BASF in South America - Report 2019 How we create value
←
→
Page content transcription
If your browser does not render page correctly, please read the page content below

BASF in
South America
Report 2019
How we create value
Index

Index
About this report                                                                                  02
Welcome                                                                                            03
BASF Group at a glance 2019                                                                        04
The BASF Group                                                                                     05
BASF in different regions                                                                          10
BASF on the capital market                                                                         13
BASF in South America                                                                              16
Commitment to South America                                                                        19
Highlights                                                                                         22
Innovative and sustainable solutions for customers                                                 25
Environmental protection, health and safety                                                        28
Sustainability in the value chain                                                                  33
Employees                                                                                          39
Acknowledgements                                                                                   41
Ten year overview — BASF Global                                                                    42
Additional information                                                                             43

About this report
The “BASF in South America” Report is published annually as a
document on the performance of our activities in the three dimensions
of sustainability — economy, environment and society — in South
America.

The reference period for this publication is the fiscal year 2019. This                                      We combine economic success,
report also provides an overview of the BASF Group, together with                                            social responsibility and
its financial performance, prepared in accordance with the
requirements of the International Financial Reporting Standards
                                                                                                             environmental protection
(IFRS) and, where applicable, the German Commercial Code as well                                             Through science and innovation, we co-create with our customers,
as the German Accounting Standards (DRSC). Emissions, waste,                                                 to attend to current and future society issues. With our products
energy and water use from consolidated joint operations are                                                  and processes, we are able to provide sustainable solutions to
included, based proportionally on our participation. The number of                                           global challenges.
employees refer to employees employed by the BASF Group as of
December 31, 2019.                                                                                           We grow through profitably and create value for society. This is how
                                                                                                             we create chemistry for a sustainable future.
The scope of this review and the main focus points of our reports are
defined based on the topics along the value chain, which we
identified in internal strategic discussion processes, ongoing global
data analysis and dialog with shareholders.
    For more information on our selection of sustainability topics, see from page 33 onwards and
basf.com/materiality

2                                                                                       BASF in South America Report 2019
Welcome/A Message from the President

Welcome
A message from BASF president
for South America

BASF remains firm with its purpose of “creating chemistry for a
sustainable future”, innovating and seeking opportunities every day
to generate value for our customers and for society.

Through our corporate strategy, which we launched just over a year
ago, we are on the right track. Supported by the pillars of innovation,
operations, portfolio, sustainability, people and digitalization, we are
effectively placing the customer at the center of our decisions.

We have moved forward with a new organizational structure,
simplifying processes and showing that we can make BASF a more
agile company that is closer to our customers.

We inaugurated the onono — Center for Scientific and Digital
Experiences — to connect everything in the digital transformation          These are some of the short-term results that confirm our long-term
ecosystem and encourage co-creation and development of new                 vision. For circular economy and the main challenges the society is
products. In 2019, we promoted more than 500 experiences,                  facing, such as climate change and mobility, we offer innovative
7 thousand face-to-face interactions and 9 thousand remote                 solutions. We remain firm in our global goal of increasing sales of
interactions. Through the center, we connected with 120 customers,         solutions that significantly contribute to sustainability in the value
70 startups and 10 universities.                                           chain, aiming to reach € 22 billion in 2025, an increase of € 7 billion
                                                                           compared to 2019.
We painted a story filled with innovation through the Suvinil Fora da
Lata (Suvinil Out of the Can) acceleration program, which selected         And to innovate with products and solutions for our customers and
startups that are not afraid to create novelties, with energy and vigor    the needs of society, we believe that diversity is essential. Our aim is
to think outside the box and transform the paint scene in Brazil.          to be as diverse as the society in which we operate. For this reason,
                                                                           we set, as a regional goal, concrete objectives for the inclusion of
We have strengthened the seed business, contributing significantly         black people, women and people with disabilities in order to gradually
to the sustainable development of South America agriculture.               increase their representation in the company.
Increasing proximity to farmers has contributed to the longevity of
their crops and the balance of their business. We innovate, co-create      In South America, despite the challenges of global scenario, we have
and strengthen our relationships.                                          increased sales by 16%, reaching € 3.8 billion, with consecutive
                                                                           growth for seven quarters.
These and other initiatives have brought us 37 recognitions from our
customers and the market, as the most sustainable company in               Our success comes from the effort and passion of our employees to
Brazil by the Exame Sustainability Guide and a stand-out company           better serve our customers, the partnerships with our suppliers and
in the Exame Compliance Guide and Você S/A’s Best Companies to             the dialogue with governments, associations and communities that we
Work for.                                                                  are part of.

We were also recognized in Chile as being one of the 20 most               I am grateful to everyone who, together with us, has contributed to
innovative companies and received the GfK award; in Colombia, we           the results that you will see in this report, which also attests to the
were recognized for solid waste management with the Latinoamérica          fact that, at BASF, we are creating chemistry for a sustainable future.
Verde award; and in Argentina we were recognized by Buenos Aires
government for our relationship with the community and generating          Manfredo Rübens
a social impact.                                                           BASF President for South America

                                                         BASF in South America Report 2019                                                       3
Key data Chemicals
BASF Group 2019
Million €
BASF Group 2019 at a glance
BASF
Segment data
Sales
1
2019 9,532
BASFGroup
Group2019
2019at
ataaglance
glance
2018 11,694
at a glance
2019 2018 +/–
Sales1 million € 59,316 60,220 (1.5%) EBIT before special items 2019 791
2018 1,587
EBITDA before special items 1
million € 8,217 9,271 (11.4%)
EBITDA1 million € 8,036 8,970 (10.4%)
BASF
Key
BASF Group 2019
data
BASF Group
EBIT before
2019 Group
special items 4,536 6,281 (27.8%)
Segment Chemicals
Industrial
Segment data
1 Solutions
1
Million €
2019
million €
EBIT 1
BASF Group 2019 at a glance
million € 4,052 5,974 (32.2%) Segment data
data
Sales
11
2019 9,532
8,389
at
at a
aa glance
2018 11,694
9,120
at glance
2019 2018 +/–
glance
Net income million € 8,421 4,707 78.9%
Sales 59,316 60,220 (1.5%)– EBIT before special items 2019 791
820
ROCE11 million %€ 7.7 12.0
2018 1,587
668
EBITDA
Earningsbefore special items1
per share million € 8,217
9.17 9,271
5.12 (11.4%)
79.1%
EBITDA
Assets 1
million € 8,036
86,950 8,970
86,556 (10.4%)
0.5%
Key
Key data
Key data
data
Chemicals
Industrial
Chemicals
Nutrition &Solutions
Care
Million €
BASF Group 2019
EBIT before
Investments special items
including 1
million € 4,536 6,281 (27.8%) Chemicals Million
Million€€
acquisitions
EBIT1
2
BASF Group 2019 at a glance
million €
million €
4,097
4,052
10,735
5,974
(61.8%)
(32.2%) Segment data
Sales
Sales
Sales
1 2019
2019
2019
9,532
8,389
9,532
6,075
9,532
2019 2018 +/– 2018 11,694
2018 9,120
11,694
5,940
at a glance
Net income million € 2019
2019
8,421 2018
2018
4,707 ++/ /––
78.9% 2018 11,694
Sales11
1
million € 59,316 60,220 (1.5%) EBIT before special items 2019 791
ROCE
Sales 7.7
59,316 12.0
60,220 (1.5%) – EBIT
EBITbefore
beforespecial
specialitems
items 2019
2019 820
791
793
791
Sales1 million%€ €
million 59,316 60,220 (1.5%) 2018 1,587
2019 2018 +/– 2018
2018 668
1,587
736
1,587
EBITDA before special items11 million € 8,217 9,271 (11.4%)
Earnings
EBITDA per
before share
special items
EBITDA before special items million € 1 million € 9.17
8,217
8,217 5.12
9,271
9,271 79.1%
(11.4%)
(11.4%)
Employees
EBITDA11 at year-end million € 117,628
8,036 122,404
8,970 (3.9%)
(10.4%)
Assets
EBITDA
EBITDA1 million
million€ € 86,950
8,036
8,036 86,556
8,970
8,970 0.5%
(10.4%)
(10.4%)
Personnel
EBIT beforeexpenses
special items11 million
million €€ 10,924
4,536 10,659
6,281 2.5%
(27.8%) Industrial Solutions Million €
Key data
Investments including Nutrition
Materials&Solutions
Chemicals
Industrial
Materials Care
BASF Group 2019
EBIT
EBITbefore
beforespecial
specialitems
items1 million
million€ € 4,536
4,536 6,281
6,281 (27.8%)
(27.8%) Million
Million€€
4,097 10,735 (61.8%)
Research
acquisitions
EBIT
EBIT
1
11
EBIT
expenses 1
and2 development
million €
million
million€€ €
million
4,052
2,158
4,052
4,052
5,974
1,994
5,974
5,974
(32.2%)
8.2%
(32.2%)
(32.2%)
Segment data
Sales
Sales
Sales
1 2019
2019
2019
2018
8,389
6,075
9,532
8,389
11,466
11,466
9,120
Net income million € 8,421 4,707 78.9% 2018 5,940
11,694
9,120
13,270
at a glance
Net income million € 2019
8,421 2018
4,707 +/–
78.9% 2018 13,270
Net income
Greenhouse gas million
million metric tons € 8,421 4,707 78.9%
ROCE 1 20.1
7.7 21.9
12.0 (8.2%) – EBIT before special items 2019 820
emissions 3
of CO 2 equivalents% EBIT
EBITbefore
beforespecial
specialitems
items 2019
2019 793
791
820
1,003
1,003
ROCE
Sales 11
ROCE1 million %€% 7.7
59,3167.7 12.0
60,220
12.0 (1.5%)–– 2018 668
2019 2018 +/– 2018
2018 736
1,587
668
2,400
2,400
Earnings per share
Energy efficiency in kilogram of sales€ 9.17 5.12 79.1%
Earnings
EBITDA
Earnings per
before
per share
special items1 million € €
share 9.17
8,217
598
9.17 5.12
9,271
626
5.12 79.1%
(11.4%)
(4.5%)
79.1%
production
Employees processes
at year-end product/MWh 117,628 122,404 (3.9%)
Assets million € 86,950 86,556 0.5%
Assets
EBITDA
Assets
1
million
million€ € 86,950
8,036
86,950 86,556
8,970
86,556 0.5%
(10.4%)
0.5%
Accelerator
Personnel sales
expenses million € 15,017
10,924 14,284
10,659 5.1%
2.5%
Investments including million € Nutrition & Care Million €
Key data
Investments
EBIT before
Investments
acquisitions
Number
Research
acquisitions
ofand
acquisitions
including
special items
2 including
on-site
1
million
sustainability million €
2 2 development
million
€
million€ €
4,097
4,536
4,097
4,097
81
2,158
10,735
6,281
10,735
10,735
100
1,994
(61.8%)
(27.8%)
(61.8%)
(61.8%)
(19.0%)
8.2%
Materials
Industrial
Nutrition
Chemicals
Surface
Sales
&Solutions
Industrial Care
Technologies
Solutions
2019
Million
Million€€
6,075
audits
EBIT of raw
1
expenses 1 material suppliers millionmillion €€ 4,052 5,974 (32.2%) Sales 2019 11,466
8,389
6,075
9,532
13,142
Sales 2019
2018 8,389
5,940
2019 2018 +/– 2018
2018 13,270
9,120
5,940
11,694
11,199
9,120
Net income gas
Greenhouse million
million metric tons€ 8,421 4,707 78.9%
20.1 21.9 (8.2%) EBIT before special items 2019 793
emissions3 of CO 2 equivalents EBIT
EBITbefore
beforespecial
specialitems
items 2019
2019 1,003
820
793
791
722
820
ROCE11
Sales million %€ 2019
7.7
59,316 2018
12.0
60,220 +/–
(1.5%) 2018 736
2019
2019 2018
2018 ++/ /–– 2018
2018 2,400
668
736
1,587
617
668
Energy efficiency in kilogram of sales
Earningsbefore
EBITDA
Employees peratshare
special items1 million €
year-end 9.17
598
8,217
117,628 5.12
626
9,271
122,404 79.1%
(4.5%)
(11.4%)
(3.9%)
production
Employees processes
atatyear-end product/MWh
117,628 122,404 (3.9%)
Employees year-end 117,628 122,404 (3.9%)
Assets
EBITDA expenses
Personnel
1
million €€
million 86,950
8,036
10,924 86,556
8,970
10,659 0.5%
(10.4%)
2.5%
Accelerator
Personnel sales million € 15,017 14,284 5.1%
Personnelexpenses
expenses million
million€ € 10,924
10,924 10,659
10,659 2.5%
2.5% Materials Million €
Investments
EBIT
Research
Number
before
ofand including
special items
development
on-site
1
sustainability
million € 4,536
4,097
6,281
10,735
(27.8%)
(61.8%)
Surface
SurfaceTechnologies
Nutrition
Materials
Industrial&Solutions
AgriculturalCare
Solutions
Technologies Million
Million€€
Research
acquisitions
Research 1and
2 development
and development million €€ 2,158
81 1,994
100 8.2%
(19.0%)
expenses
audits 1 of raw material suppliers million 2,158
2,158 1,994
1,994 8.2%
8.2% Sales 2019 11,466
EBIT
expenses
expenses1
1 million
million €
million€ €
4,052 5,974 (32.2%) Sales
Sales 2019
2019 13,142
6,075
11,466
8,389
7,814
13,142
2018 13,270
Greenhouse gas million metric tons 2018
2018 11,199
5,940
13,270
9,120
6,156
11,199
Net income
Greenhouse
Greenhouse gas gas million million
metric tons € 8,421
20.1 4,707
21.9 78.9%
(8.2%)
emissions 3
ofmillion metric tons
CO 2 equivalents 20.1
20.1 21.9
21.9 (8.2%)
(8.2%) EBIT before special items 2019 1,003
emissions
emissions
33
ofofCO
CO2 2equivalents
equivalents EBIT
EBITbefore
beforespecial
specialitems
items 2019
2019 722
793
1,003
820
1,095
722
ROCE 1
% 7.7 12.0 – 2018 2,400
Energy efficiency in kilogram of sales 2019 2018 +/– 2018
2018 617
736
2,400
668
734
617
Energy
Energyefficiency
efficiency in kilogram ofofsales 598 626 (4.5%)
production
Earnings per sharein
processes kilogram
product/MWh sales
€ 9.17
598
598 5.12
626
626 79.1%
(4.5%)
(4.5%)
production processes
productionatprocesses
Employees year-end product/MWh
product/MWh 117,628 122,404 (3.9%)
Accelerator sales
Assets million € 15,017
86,950 14,284
86,556 5.1%
0.5%
Accelerator
Accelerator
Personnel sales
sales
expenses million
million€€ € 15,017
15,017
10,924 14,284
14,284
10,659 5.1%
5.1%
2.5%
million Surface Technologies Million €
Number
Investments
Number
of on-site
of on-site
sustainability
including
sustainability 81
4,097 100
10,735 (19.0%)
(61.8%)
Agricultural
Materials
Surface Solutions
NutritionTechnologies
Nutrition &&Care
Care Million
Million€€
Number
Research
audits of
of raw
acquisitions 2on-site
andmaterial sustainability
development
suppliers million € 81 100 (19.0%)
audits 81
2,158 100
1,994 (19.0%)
8.2% Sales 2019 13,142
auditsofofraw
expenses 1rawmaterial
materialsuppliers
suppliers million € Sales
Sales 2019
2019 7,814
11,466
13,142
6,075
6,075
2018 11,199
2018
2018 6,156
13,270
11,199
5,940
5,940
Greenhouse gas million metric tons
20.1 21.9 (8.2%) EBIT before special items 2019 722
emissions3 of CO 2 equivalents EBIT
EBITbefore
beforespecial
specialitems
items 2019
2019 1,095
1,003
722
793
793
2018 617
2019 2018 +/– 2018
2018 734
2,400
617
736
736
Energy efficiency in kilogram of sales
598 626 (4.5%)
production
Employees processes
at year-end product/MWh
117,628 122,404 (3.9%)
Acceleratorexpenses
Personnel sales million € 15,017
10,924 14,284
10,659 5.1%
2.5%
million € Agricultural Solutions Million €
Number ofandon-site sustainability
Surface Technologies
Agricultural
Materials
Agricultural Solutions
Solutions Million
Million€€
Research development 81 100 (19.0%) Sales 2019 7,814
audits of raw material suppliers 2,158 1,994 8.2%
expenses 1
million € Sales
Sales 2019
2019 13,142
7,814
11,466
7,814
2018 6,156
2018
2018 11,199
6,156
13,270
6,156
Greenhouse gas million metric tons
20.1 21.9 (8.2%) EBIT before special items 2019 1,095
emissions 3
of CO 2 equivalents EBIT
EBITbefore
beforespecial
specialitemsitems 2019
2019 722
1,095
1,003
1,095
1 Restated figures, for more information, see basf.com/report 2018 734
2 Additions to intangible assets and property, plant and equipment 1 The segment data for 2018 has been restated to reflect the new segment 2018
2018
structure. 617
734
2,400
734
Energy
3 efficiency
Excluding in to thirdkilogram
sale of energy partiesof sales Figures do not include the construction chemicals activities presented as discontinued operations.
598 626 (4.5%)
production processes product/MWh
Accelerator sales million € 15,017 14,284 5.1%
4
Number of on-site sustainability
Agricultural Solutions
Surface Technologies Million €
81 100 (19.0%)
audits of raw material suppliers Sales 2019 7,814
13,142
2018 6,156
11,199
1 Restated figures, for more information, see basf.com/report EBIT before special items 2019 1,095
722
2 Additions to intangible assets and property, plant and equipment 1 The segment data for 2018 has been restated to reflect the new segment 2018structure. 734
617
3 Excluding sale of energy to third parties Figures do not include the construction chemicals activities presented as discontinued operations.
4 Agricultural Solutions Million €
Sales 2019 7,814
2018 6,156
1 Restated figures, for more information, see basf.com/report
11 Restated EBIT before special items 2019 1,095
2 Restatedfigures,
Additions to for
formore
intangible
figures, information,
assets
more see
seebasf.com/report
and property,
information, plant and equipment
basf.com/report 1 The segment data for 2018 has been restated to reflect the new segment structure.
2
32 Additions
Additionsto
Excluding tointangible
sale assets
of energy
intangible and
to third
assets property,
property,plant
parties
and plantand
andequipment
equipment 11 The
Thesegment
Figures do notdata
segment for
for2018
include
data the
2018 has
hasbeen
beenrestated
construction totoreflect
chemicals
restated reflectthe
activities new
newsegment
thepresented 2018
structure.
as discontinued
segment 734
structure. operations.
33 Excluding
Excludingsale
saleofofenergy
energytotothird
thirdparties
parties Figures
Figuresdo
donot
notinclude
includethetheconstruction
constructionchemicals
chemicalsactivities
activitiespresented
presentedasasdiscontinued
discontinuedoperations.
operations.
4
44
The BASF Group
The BASF Group Since May 1, 2019, BASF has reported its share of Wintershall DEA’s
net income in EBIT before special items and in EBIT of the BASF Group,
presented under Other. BASF and LetterOne intend to list Wintershall
At BASF, we create chemistry for a sustainable future. We DEA on the stock exchange by way of an initial public offering (IPO) in
combine economic success with environmental protection and the second half of 2020, provided market conditions are suitable.
social responsibility. The approximately 118,000 employees in
the BASF Group work on contributing to the success of our The disclosures and indicators in the Management’s Report on
customers in nearly all sectors and almost every country in the sustainability in 2019 no longer include data on Wintershall. The
world. Our portfolio is divided into the Chemicals, Materials, Construction Chemicals business is included in the disclosures on
Industrial Solutions, Surface Technologies, Nutrition & Care environmental protection, health and safety, employees and compliance,
and Agricultural Solutions segments. but has already been removed from the sales-related sustainability
figures. The business acquired from Bayer in 2018 is included in the
Organization of the BASF Group in 2019 indicators.
For more informations, see basf.com/report
As of January 1, 2019, we have 11 divisions grouped into six segments
as follows: BASF’s new segment structure allows for a more differentiated steering
of our businesses according to their market-specific competitive
Chemicals: Petrochemicals, Intermediates environment. It increases transparency regarding the results of our
Materials: Performance Materials, Monomers segments and divisions and highlights the importance of the Verbund
Industrial Solutions: Dispersions & Pigments, Performance and value chains to our business success. BASF aims to clearly position
Chemicals its businesses against their relevant competitors and establish a high-
Surface Technologies: Catalysts, Coatings performance organization to enable BASF to be successful in an
Nutrition & Care: Care Chemicals, Nutrition & Health increasingly competitive market environment.
Agricultural Solutions: Agricultural Solutions
Our divisions bear operational responsibility and are organized
The segment data for 2018 presented in this report has been according to sectors or products. They manage our 54 global and
restated to reflect the new segment structure. regional business units and develop strategies for the 76 strategic
business units.1
On December 21, 2019, BASF and an affiliate of Lone Star, a global
private equity firm, signed an agreement on the sale of BASF’s Our regional and country organizations help to leverage market potential.
construction chemicals business. The purchase price on a cash and For financial reporting purposes, we have organized the regional divisions
debt-free basis is €3.17 billion. The transaction is expected to close into four regions: Europe; North America; Asia Pacific; South America,
in the third quarter of 2020, subject to the approval of the relevant Africa, Middle East.
competition authorities. The Construction Chemicals division was
previously reported under the Surface Technologies segment. The Together with our divisions, the three global research divisions
signing of the agreement had an immediate effect on the reporting – Process Research & Chemical Engineering, Advanced Materials &
of BASF Group. Retroactively as of January 1, 2018, sales and Systems Research and Bioscience Research – safeguard our innovative
earnings of the Construction Chemicals division are no longer capacity and competitiveness.
included in sales, EBITDA, EBIT and EBIT before special items of the
BASF Group. Until closing, the income after taxes of the Construction Business processes such as the procurement of raw materials and
Chemicals business will be presented in the income after taxes of services, production and transport to customers were the shared
BASF Group as a separate item (“Income after taxes from discon responsibility of the divisions and the functional units in 2019. Seven
tinued operations”). functional units and eight corporate units support the BASF Group’s
business activities. The functional and corporate units provided services
Following the approval of all relevant authorities, BASF and LetterOne in areas such as finance, human resources, tax and legal, engineering,
completed the merger of Wintershall and DEA on May 1, 2019. In site management, purchasing and logistics, environmental protection,
September 2018, BASF and LetterOne had signed a transaction health and safety, investor relations, and communications. As part of the
agreement to merge their respective oil and gas businesses in a joint further development of the corporate strategy, in 2019 BASF embedded
venture. Shareholder loans were replaced by bank loans in the course business-critical parts of its functional units into the divisions, such as
of the merger. Since May 1, 2019, BASF’s participating interest in engineering services, procurement and logistics. This increased
Wintershall DEA has been reported in the Consolidated Financial customer proximity and improved customer-specific agility. We have
Statements of the BASF Group according to the equity method, with an also created leaner structures in our functional units, research and
initial valuation at fair value. The gain from the transition from full development and in governance functions.
consolidation to the equity method is shown in income after taxes from
discontinued operations.
1 E xcluding the Construction Chemicals activities presented as discontinued operations
5 BASF in South America Report 2019
The BASF Group
Organizational realignment as of January 1, 2020 Furthermore, one facility’s by-products can serve as feedstock
elsewhere. This not only saves us raw materials and energy, it also
BASF has created the conditions for greater customer proximity, avoids emissions, lowers logistics costs and leverages synergies.
increased competitiveness and profitable growth with an
organizational realignment as part of the implementation of its We also make use of the intelligent Verbund principle for more than
strategy. We are streamlining our administration, sharpening the production, applying it for technologies, the market and digitalization
roles of services and regions, and simplifying procedures and as well. Expert knowledge is pooled in our global research platforms.
processes as part of our ongoing Excellence Program. Customer-
focused operating divisions, cross-functional service units and Procurement and sales markets
regions as well as a lean corporate center are the cornerstones of
the new organization. BASF supplies products and services to around 100,000 customers1
from various sectors in almost every country in the world. Our
The Corporate Center units support the Board of Executive Directors customer portfolio ranges from major global customers and
in steering the company as a whole. These include central tasks from medium-sized businesses to end consumers.
the following areas: strategy; finance; law, insurance, and tax;
environmental protection, health and safety; human resources; We work with over 75,000 Tier 1 suppliers2 from different sectors
communications; investor relations and internal audit. worldwide. They supply us with important raw materials, chemicals,
investment goods and consumables, and perform a range of services.
In addition, four global service units were established: Global Some of our most important raw materials (based on volume) are
Engineering Services and Global Digital Services offer services for naphtha, liquid gas, natural gas, benzene and caustic soda.
individual sites, globally for the divisions or other units of the BASF
Group. Global Procurement makes purchasing even more effective. The Business and competitive environment
newly established Global Business Services unit will be a global, flexible
and demand-driven service unit that strengthens the competitiveness BASF’s global presence means that it operates in the context of
of the divisions and provides services in areas such as finance, human local, regional and global developments and is bound by various
resources, environmental protection, health and safety, intellectual conditions. These include:
property, communications, supply chain and consulting. – Global economic environment
– L egal and political requirements (such as European Union
The role of regions and countries is being sharpened. Going forward, regulations)
they will primarily represent BASF locally and even better support the – International trade agreements
growth of business units with local proximity to customers. – Industry standards
– Environmental agreements (such as the E.U. Emissions Trading
The ongoing Excellence Program is expected to contribute €2 billion System)
to EBITDA annually from the end of 2021 onward compared with – Social aspects (such as the U.N. Universal Declaration of Human
baseline 2018. BASF expects a reduction of a total of around 6,000 Rights)
positions worldwide until the end of 2021. This decrease results from
the organizational simplification and from efficiency gains in BASF holds one of the top three market positions in around 70% of
administration, the service units and the operating divisions. the business areas in which it is active. Our most important global
In addition, central, functional and regional structures are being competitors include Arkema, Bayer, Clariant, Corteva, Covestro,
streamlined in the context of the announced portfolio changes. Dow, Dupont, DSM, Evonik, Formosa Plastics, Huntsman, Lanxess,
SABIC, Sinopec, Solvay, Syngenta, Wanhua and many hundreds of
Sites and Verbund local and regional competitors. We expect competitors from Asia
and the Middle East in particular to gain increasing significance in the
BASF has companies in more than 90 countries. We operate six years ahead.
Verbund sites and 361 additional production sites worldwide. Our
Verbund site in Ludwigshafen, Germany, is the world’s largest Corporate legal structure
chemical complex owned by a single company that was developed
as an integrated network. This was where the Verbund principle was As the publicly traded parent company, BASF SE takes a central
originally established and continuously optimized before being position: directly or indirectly, it holds the shares in the companies
implemented at additional sites. belonging to the BASF Group, and is also the largest operating
company. The majority of Group company cover a broad spectrum
The Verbund system is one of BASF’s great strengths. We add value of our company. In the BASF Group Consolidated Financial
by using our resources efficiently. The Production Verbund Statements, 295 companies including BASF SE are fully consolidated.
intelligently links production units and their energy supply so that, for We consolidate seven joint operations on a proportional basis, and
example, the waste heat of one plant provides energy to others. account for 25 companies using the equity method.
1 T
he number of customers refers to all external companies (sold-to parties) that had contracts with the BASF Group in the business year concerned under which sales were generated.
2 BASF considers all direct suppliers of the BASF Group in the business year concerned as Tier 1 suppliers. These are suppliers that provide us with raw materials, investment goods, consumables and services.
Suppliers can be natural persons, companies or legal persons under public law.
BASF in South America Report 2019 6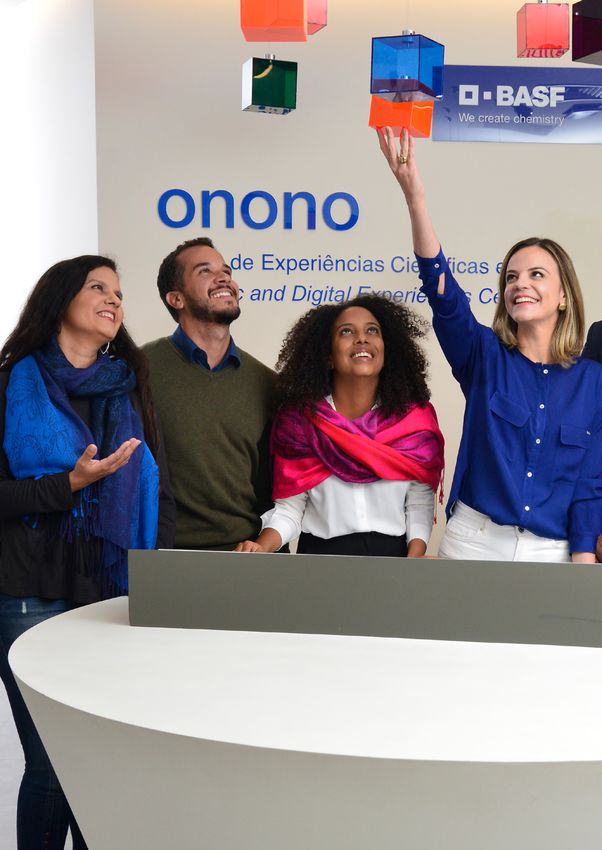
The BASF Group
The BASF Group
Our
OurStrategy
Strategy Customer focus and customer industry orientation
Customer focus and customer industry orientation
▪ BASF puts customers at the center of its decisions and
Corporate
CorporateStrategy
Strategy
▪▪ BASF puts customers at the center of its decisions and
activities
activities
▪ Closer dialog with our customers to increase customer
▪▪ Closer dialog with our customers to increase customer
At BASF, we are passionate about chemistry and our satisfaction
At BASF, we are passionate about chemistry and our satisfaction
customers. To be the world’s leading chemical company for
customers. To be the world’s leading chemical company for
our customers, we will grow profitably and create value for To be the world’s leading chemical company for our customers, we
our customers, we will grow profitably and create value for To be the world’s leading chemical company for our customers, we
society. Thanks to our expertise, our innovative and entrepre want to further strengthen our customer focus throughout the entire
society. Thanks to our expertise, our innovative and entrepre want to further strengthen our customer focus throughout the entire
neurial spirit, and the power of our Verbund integration, we organization. This is why we are aligning our business even closer
neurial spirit, and the power of our Verbund integration, we organization. This is why we are aligning our business even closer
make a decisive contribution to changing the world we live in with the needs of our customers.
make a decisive contribution to changing the world we live in with the needs of our customers.
for the better. This is our goal. This is what drives us and what
for the better. This is our goal. This is what drives us and what
we do best: We create chemistry for a sustainable future. Our diverse portfolio – from basic chemicals to high value-added
we do best: we create chemistry for a sustainable future. Our diverse portfolio – from basic chemicals to high value-added
products and system solutions – means that we are active in many
products and system solutions – means that we are active in many
Today, the world is changing more rapidly than ever before, driven by
Today, the world is changing more rapidly than ever before, driven by
value chains and value creation networks. As a result, we use various
value chains and value creation networks. As a result, we use various
demographic
demographicchange
changeand andnew
newdigital
digitaltechnologies.
technologies.Our Ourcustomers
customersinin business
business strategies,
strategies, which we flexibly
which we flexibly adapt
adaptto
tothe
theneeds
needsofofindividual
individu-
different industries and regions face diverse social and environmental
different industries and regions face diverse social and environmental alindustries.
industries.These
Theserange
rangefrom
fromcost
costleadership
leadershiptototailored,
tailored,customer
custom-
challenges
challengesdue duetotolimited
limitednatural
naturalresources,
resources,climate
climatechange
changeand andthe
the er-specific solutions for downstream products. This industry
specific solutions for downstream products. This industry orientation orienta-
increasing
increasing demands of a growing global population. Chemistry is iskey
demands of a growing global population. Chemistry keyto tion is primarily driven forward and enhanced by the divisions.
is primarily driven forward and enhanced by the divisions. Around Around
half
tosolving
solvingmany
manyofofthese
thesechallenges.
challenges.By Bycombining
combiningour ourunique
uniqueexpertise
exper- half of our business units are oriented toward specific
of our business units are oriented toward specific industries. indus tries.
tise with
with ourour customers’
customers’ competence,
competence, wewe cancan jointly
jointly develop
develop profit-
profitable,
able, innovative
innovative and and sustainable
sustainable solutions
solutions for these
for these global global challenges.
challenges.
Our
Ourpurpose
purposereflects
reflects what
what wewe dodo and
and why
why wewe do do it: it: We
we create
create
chemistry
chemistry forfor
a sustainable
a sustainable future. WeWe
future. want to to
want contribute
contributetotoaaworldworld
that
thatprovides
providesa aviable
viablefuture
futurewith
withenhanced
enhancedquality
qualityofoflife
lifeforforeveryyone.
ever one.
This
Thisis iswhy
whyweweoffer
offerproducts
productsandandsolutions
solutionsthat
thatare
aredesigned
designedto tomake
make
thethebest
bestuse
useofofavailable
availableresources
resources and help to
and help to overcome
overcomechallenges.
challenges.
Our
Ouraspiration
aspirationisistotobebethe theworld’s
world’sleading
leadingchemical
chemical company
company and and
achieve
achieveprofitable
profitablegrowth.
growth.We Weaim aimtotoprimarily
primarilygrow
groworganically
organically andand
thus
thusare
arestrengthening
strengtheningour ourcustomer
customerfocus.
focus.Our Ourgrowth
growth strategy
strategy isis
based
basedononinvestment
investmentininstrategic
strategicgrowth
growthmarkets
markets andand innovation-
innovation-
driven
drivensectors.
sectors.The TheAsian
Asianmarket
marketcontinues
continuestotoplayplayaakey keyrole
role here.
here.
With
Witha ashare
shareofofmore
morethan
than40 %,
40 %,China
Chinaisisalready
alreadythe theworld’s
world’slargest
largest
chemical
chemicalmarket
marketand anddrives
drivesthethegrowth
growthofofglobal
globalchemical
chemicalproduction.
p
roduction.
ByBy2030,
2030,China’s
China’sshare
sharewill
willincrease
increasetotonearly
nearly50 50%%––andandwe wewant
wantto to
participateininthis
participate thisgrowth.
growth.ToTofurther
furtherour
ourgrowth
growthininthis
thisdynamic
dynamicmarket,
market, BASF and
BASF and HYMER: creating
Creating
weweplan
plan to build
to build an integrated
an integrated Verbund
Verbund
site insite in
ZhanjiangZhanjiang in the
in the south-
southern Chinese province of G
uangdong. We
ern Chinese province of Guangdong. We also want to expand our also want to expand
innovation together
innovation
our existing
existing joint venture
joint venture with Sinopec
with Sinopec at theatVerbund
the V erbund
site insite in Nanjing.
Nanjing. The VisionVenture
The VisionVenture concept
concept vehicle is a good example example of of how
how we
we
create innovations
create innovations for the future in close partnership
partnership with our
with our
customers. BASF
customers. BASF and
and HYMER GmbH & Co. KG, KG, BadBad Waldsee,
Waldsee,
Corporatepurpose
Corporate purpose Germany, the European market leader for motor
Germany,
campers, show
the European
show what
market
what aa campervan
leader
campervan could
for motor hhomes
omes andand
campers, could look
look like
like in
in 2025.
2025. More
More
Wecreate
We createchemistry
chemistryfor
foraasustainable
sustainablefuture
future than 2020 BASF
BASF solutions
solutions open
open upup entirely
than entirely new
new d design
esign options
options and
and
functionalities, including various high-performance plastics, over
functionalities, including various high- performance plastics, over
100 3D-printed
100 3D-printed components,
components, a a tailored
tailored package
package of of measures
measures for for
CustomerOrientation
Customer Orientation preventing noises and vibrations, and a new coating technology.
preventing noises and
v ibrations, and a new coating technology.
In less
In less than
than twelve
twelve months,
months, HYMERHYMER and and BASF
BASF ttogether
ogether turned
turned
Ourcustomers
Our customersare areour ournumber
number one one priority.
priority. We
We want
want to
to view
view their ideas and expertise into a near-production concept camper-
their ideas and expertise into a near- production concept camper-
e
verything we do through the lens of customer
everything we do through the lens of customer relevance. BASF relevance. BASF van. The
van. The VisionVenture
VisionVenture was
was unveiled
unveiled toto the
the public
public inin August
August
suppliesproducts
supplies productsand andservices
servicestotoaround
around100,000
100,000customers from
customers11from 2019.
2019.
various sectors in almost every country in the world.
various sectors in almost every country in the world. Our customerOur customer For more information on the collaboration with HYMER and the BASF materials used in the
For more information on the collaboration with HYMER and the BASF materials used in the
VisionVenture, see basf.com/en/vision-venture
portfolioranges
portfolio rangesfrom
frommajor
majorglobal
globalcustomers
customers and and medium-sized
medium-sized VisionVenture, see basf.com/en/vision-venture
businesses to end consumers.
businesses to end consumers.
1 The number of customers refers to all external companies (sold-to parties) that had contracts with the BASF Group in the business year concerned under which sales were generated.
1 The number of customers refers to all external companies (sold-to parties) that had contracts with the BASF Group in the business year concerned under which sales were generated.
7 BASF in South America Report 2019
BASF In [ Your Country ] Report 2019
8
The BASF Group
The BASF Group
We are continually refining our organization to even better meet the total enterprise cost. GM also recognized us in June with the
We are continually refining our organization to even better meet the total enterprise cost. GM also recognized us in June with the
different needs of our customers. In 2019, we embedded significant Sustainability Partner award, the first to be given to a supplier.
different needs of our customers. In 2019, we embedded significant Sustainability Partner award, the first to be given to a supplier.
parts of our functional services – including parts of research and
parts of our functional services – including parts of research and
development, IT, procurement, human resources and communi- The Haier industrial group presented the Golden Magic Cube award
development, IT, procurement, human resources and communi
The Haier industrial group presented the Golden Magic Cube award
cations – into the operating divisions. This makes the operating to BASF-YPC Company Limited, a 50-50 joint venture between
cations – into the operating divisions. This makes the operating to BASF-YPC Company Limited, a 50-50 joint venture between
divisions more agile, enabling them to target specific market demands BASF and Sinopec, for the third time in a row in March 2019. The
divisions more agile, enabling them to target specific market d
emands BASF and Sinopec, for the third time in a row in March 2019. The
and differentiate themselves from the competition. We also simplified award recognizes, among other things, high product quality, service
and differentiate themselves from the competition. We also simplified award recognizes, among other things, high product quality, service
processes to make the way we work more effective, more efficient reliability and a strong customer focus.
processes to make the way we work more effective, more efficient reliability and a strong customer focus.
and more agile. The objective is to satisfy customer requests in a
and more agile. The objective is to satisfy customer requests in a
more focused and targeted way and improve our reaction times so In March 2019, Airbus presented us with our fifth Supply Chain &
more focused and targeted way and improve our reaction times so In March 2019, Airbus presented us with our fifth Supply Chain &
that
thatour
ourcustomers
customersexperience
experienceaanew
newBASF.
BASF. Quality
Quality Improvement
Improvementaward. award.Airbus highlighted
Airbus in particular
highlighted the con-
in particular the
sistently high delivery reliability and quality of the products
consistently high delivery reliability and quality of the products Naftoseal ®
We
Weaimaimtotoput
putthe
thecustomer
customeratatthe thecenter
centerofofour
ourdecisions
decisions and
and every-
every and Ardrox ®
, which we market under the Chemetall brand.
Naftoseal® and Ardrox®, which we market under the Chemetall brand.
thing
thing we do. Our ability to optimally combine our in-depth expertise
we do. Our ability to optimally combine our in-depth e
xpertise
with
withour
ourwide
widerange
rangeofofresources
resources reflects
reflects our
our ambition
ambition to
to be
be more
more In
In July
July 2019,
2019, Jaguar Land Rover
Jaguar Land Rover (JLR)
(JLR) recognized
recognized BASFBASF forforthe
thefirst
first
than just a supplier. We position ourselves as a
than just a supplier. We position ourselves as a solution- solution- oriented
oriented time with the Customer First Recognition Award in gold for
time with the Customer First Recognition Award in gold for outstandingoutstanding
system
systemprovider.
provider.WeWewant
want toto work closely with
work closely withour
ourpartners
partnerstotodevelop
devel- customer
customer focus.
focus. AnAn interdisciplinary
interdisciplinary team
team at at BASF
BASF hashas supported
supported
op customsolutions
custom solutionsthatthatare
are both
both profitable
profitable and
and sustainable.
sustainable. WeWe JLR
JLR for
for many
many years now with
years now with innovative
innovative solutions
solutions for
for automotive
automotive
contribute
contributeour ourexpertise to to
optimize processes andand
applications to- OEM
OEM coatings,
coatings, including
includingthe CathoGuard800
theCathoGuard RE RE
technology and
®
expertise optimize processes applications ®
800 technology
gether withwith
together ourour
customers.
customers. basecoats
and basecoats to realize the individual
to realize color preferences
the individual of JLR custom-
color preferences of JLR
ers in the premium
customers segment.
in the premium The award
segment. Thehonors
award partners that demon-
honors partners that
ToToeven
evenbetter
betterunderstand
understandour ourcustomers’
customers’ needs,
needs, wewe regularly
regularly ask
ask strate JLR’s principles
demonstrate – personalized,
JLR’s principles transparent,
– personalized, easy to
transparent, dotobusi-
easy do
them
themfor
forfeedback
feedbackon onour
ourperformance.
performance.InIn2019,
2019,wewerolled
rolledout
out the
the Net
Net ness with,with,
business dependable and make
dependable one feel
and make onespecial – which
feel special are crucial
– which are
Promoter System®worldwide
PromoterSystem worldwidetotoestablish
establishongoing,
ongoing,closer
closer dialog
dialog with to the automotive manufacturer’s success.
®
with crucial to the automotive manufacturer’s s uccess.
customers
customersand andfurther
furtherincrease
increasecustomer
customersatisfaction
satisfaction and
and customer
customer
loyalty.
loyalty.This
Thisdigital
digitalplatform
platformcreates
createsaaframework
framework to to learn
learn from
from feed-
feed-
back
backand
andrespond
respondquickly.
quickly.
InIn 2019,
2019, wewe also
also worked
worked on on an
an expanded
expanded IT-based
IT-based customer
customer
relation ship
shipmanagement
relation managementsystem.
system.We We want
want to
to roll
roll out
out this
this state-of-
state-of-
the-art,
the-art,even
evenmore
more user-friendly
user-friendly application
application inin 2020
2020 to to help
help sales
sales
employees
employeesdeliver
delivercustomer
customersupport.
support.
WeWe are pursuinga aseries
are also pursuing series of measures
of measures thatincrease
that will will increase
trans-
parencyency
transpar for our customers,
for our customers,enhance customer
enhance service
customer andand
service explore
ex-
joint joint
plore growth potential.
growth Our comprehensive
potential. Our comprehensiveunderstanding of value
understanding of
chains
value and and
chains valuevalue
creation networks
creation as well
networks as our
as well as global setup
our global and
setup
market
and knowledge
market knowledgeremain key key
remain success factors.
success factors.
Qualitymanagement
Quality management Creation Center: from
Frominspiration
inspirationto
to
solution in one place
Ourcustomers’
Our customers’satisfaction
satisfactionisis the
the basis
basis for
for our
our business
business success,
success,
which is why quality management is of vital significance for
which is why quality management is of vital significance for BASF. We BASF. We Discover, understand,
understand, createcreate– this– isthis
whatiswewhat offer ourwec ustomers
offer our
strive to continually improve processes and products.
strive to continually improve processes and products. This is also This is also customers with the new Creation Centers. These bring
with the new Creation Centers. These creative c
enters to-
creative
reflectedininour
reflected ourGlobal
GlobalQuality
QualityPolicy.
Policy.TheThemajority
majority of
of our
our produc
production
tion gether our comprehensive materials, design,
centers bring together our comprehensive materials, design, and – in particular –
sites and business units are certified according to ISO 9001. 11 In our development expertise in high- p erformance plastics using the
sites and business units are certified according to ISO 9001. In and – in particular – our development expertise in high-
addition,wewe
addition, alsoalso
meetmeet industry
industry and customer-specific
and customer-specific quality
quality require- latest visualization
performance plastics technologies.
using the latest This enables us totechnologies.
visualization address the
requirements that go beyond the
ments that go beyond the ISO standard. ISO standard. This enables us to address the specific individual needsand
specific individual needs of our customers and partners, of to-
our
gether transform ideas into tailored p
roducts
customers and partners, and together transform ideas into tai- and applications
Customerawards
Customer awards even more
lored products quickly.
andThe first Creation
applications Center
even more opened
quickly. in Mumbai,
The first
India, in May 2019. Y
okohama,
Creation Center opened in Mumbai, India, in May J
apan, and Shanghai, China, fol-
2019.
Weagain
We againreceived
receivedawards
awardsfromfromaanumber
number ofof satisfied
satisfied customers
customers in
in lowed in August 2019. Our fourth
Yokohama, Japan, and Shanghai, China, followed in August Creation Center worldwide
2019. For example, in May 2019 we were named
2019. For example, in May 2019 we were named a 2018 General a 2018 General opened
2019. Ourin Ludwigs hafen, Germany,
fourth Creation in early 2020.
Center worldwide opened in Ludwigs-
Motors(GM)
Motors (GM)Supplier
Supplierofofthe
theYear
Yearforforthe
thefourteenth
fourteenth time
time since
since 2002.
2002. For more information on BASF’s Creation Centers, see basf.com/en/creation-center
hafen, Germany, in early 2020.
The award is presented to suppliers who distinguish themselves
The award is presented to suppliers who distinguish themselves by by For more information on BASF’s Creation Centers, see basf.com/en/creation-center
meeting performance metrics for quality, execution, innovation
meeting performance metrics for quality, execution, innovation and and
1 ISO 9001 is a standard published by the International Organization for Standardization (ISO) and sets out the requirements for a quality management system.
1 ISO 9001 is a standard published by the International Organization for Standardization (ISO) and sets out the requirements for a quality management system.
BASF in South America Report 2019
BASF In [ Your Country ] Report 2019
8
9
TheBASF
The
The
The BASFGroup
BASF Group
Group
The BASF
BASF Group
Group
The BASF Group
Our
Our Targets
Our Targets
Targets purchases
purchases
purchases
p urchases to to the
to
to the 2018
the
the 2018 level
2018
2018 level while
level
level while growing
while
while growing production
growing
growing production volumes.
production
production volumes. In
volumes.
volumes. In
In
In
other
other
other words,
words,
words, we
we
we want
want
want to
to
to decouple
decouple
decouple greenhouse
greenhouse
greenhouse
other words, we want to decouple greenhouse gas emissions from gas
gas
gas emissions
emissions
emissions from
from
from
Business success
Business
Business
Business success tomorrow
success
success tomorrow means
tomorrow
tomorrow means creating
means
means creating value
creating
creating value for
value
value for the
for
for the environ-
the
the environ-
environ-
environ- organic growth.
organic
organic
organic growth. We
growth.
growth. We have
We
We have also
have
have also defined
also
also defined targets
defined
defined targets for
targets
targets for safety
for
for safety for
safety
safety for people
for
for people
people
people
ment,
ment,
ment, society
society and
and business.
business. We
We have
have set
set ourselves
ourselves ambitious
ambitious
ment, society and business. We have set ourselves ambitious global
society and business. We have set ourselves ambitious global
global
global and
and
and the
the
the environment,
environment,
environment, aaa sustainable
sustainable
sustainable product
product
product
and the environment, a sustainable product portfolio, responsible portfolio,
portfolio,
portfolio, responsible
responsible
responsible
targets
targets
targets along
along our
our entire
entire value
value chain.
chain. We
We report
report trans
trans parently
parently
targets along our entire value chain. We report transparently on our
along our entire value chain. We report transp arently on
on
on our
our
our procurement, sustainable
procurement,
procurement,
procurement, sustainable water
sustainable
sustainable water manage
water
water managem
manage
manage ment,
ment, engaged employees,
engaged
ent, engaged
ment, engaged employees,
employees,
employees,
target
target
target achievement
achievement
achievement
targetTargets
Our so
so
so that
that
that our
our
our customers,
customers,
customers, investors,
investors,
investors, e
employees
employees
achievement so that our customers, investors, employees andmployees and
and
and and
and
and inclusion
inclusion
inclusion
and inclusion
purchases of
of
of
to of diversity.
diversity.
diversity.
thediversity.
2018 level while growing production volumes. In
other stakeholders
other
other
other stakeholders can
stakeholders
stakeholders can track
can
can track our
track
track our progress.
our
our progress.
progress.
progress. other words, we want to decouple greenhouse gas emissions from
Business success tomorrow means creating value for the environ- The objective
The
The
The objective
objective
objective
organic growth. of these
of
of
of these
these
these
We have targets
targets
targets
targetsalsoisisdefined
is
is to steer
to
to
to steertargets
steer
steer our business
our
our
our business
business
business
for safety intofor
into
into
into aa sustain
aa sustain-
sustain-
sustain-
people
We want
We
We
We
ment, want
want
want to grow
to
to
to
societygrow
grow faster than
faster
and faster
grow faster thanWe
than
than
business. thehave
the
the
the market
market
market and thus
and
set and
market and thus be
thus
thus
ourselves be economi
be
be economi
economi
economi
ambitious cally
cally
ccally
ally
global able
able
able future
future
future
able future
and and,
and,
and, at
at
at the
the
the
and, at the same
the environment, same
same
same time,
time,
time, contribute
contribute
contribute
time, contribute
a sustainable product to
to
to the
the
the implementa
implementa
implementa
to portfolio,
the implementa tion
tion
ttion
responsible ion ofof
of
of
successful
successful and
and profitable.
profitable. Furthermore,
Furthermore, we
we want
want to
to provide
provide answers
answers the
the United
United Nations’
Nations’ Sustainable
Sustainable Development
Development Goals
Goals (SDGs).
(SDGs). 111
1
We
1 We are
are
successful
successful
targets and
andour
along profitable.
profitable. Furthermore,
Furthermore,
entire value we
chain. Wewe want to
wanttrans
report provide
to provide
a nswers
parentlyanswers
on our the United Nations’
the United Nations’
procurement, Sustainable
Sustainable
sustainable Development
water Development
management,Goals Goals
engaged (SDGs)
(SDGs). .
11
We
We are
employees, are
to the
to
to
to theachievement
the
the
target most pressing
most
most
most pressing
pressing
pressing challenges
challenges
challenges
challenges
so that of our
of
of
of our time.
our
our
our customers, time. To
time.
time. To combat
To
To
investors, combat
combat
combat
employees climate
climate
climate
climate
and focusing
focusing
focusing
focusing
and on issues
on
on
on
inclusion issues
issues
issues where we
where
where
where
of diversity. we as
we
we as aa
as
as aa ccompany
company
company
ompany can can make
can
can make aa
make
make aa significant
significant
significant
significant
change
change
change
change
other and global
and
and
and globalcan
global
global
stakeholders warming,
warming,
warming,
warming, weprogress.
we
we
we
track our have resolved
have
have
have resolved to
resolved
resolved to limit
to
to limit total
limit
limit total green-
total
total green-
green-
green- contribution,such
contribution,
contribution,
contribution, suchas
such
such asclimate
as
as climateprotection,
climate
climate protection,sustainable
protection,
protection, sustainableconsumption
sustainable
sustainable consumptionand
consumption
consumption and
and
and
house gas
house
house
house gas emissions
gas
gas emissions from
emissions
emissions from our
from
from our production
our
our production sites
production
production sites and
sites
sites and our
and
and our e
our
our energy
energy
energy
nergy production,
production,
production,
production,
The objective and
and
and
and fighting
fighting
fighting
of fighting hunger.
hunger.
hunger.
hunger.
these targets is to steer our business into a sustain-
We want to grow faster than the market and thus be economically able future and, at the same time, contribute to the implementation of
successful and profitable. Furthermore, we want to provide answers the United Nations’ Sustainable Development Goals (SDGs).11 We are
Status
Status
toStatus
the most
of
of Target
of Target
pressing
Achievement
Target Achievement
Achievement
challenges of our
in 2019
intime.
in 2019To combat climate
2019 focusing on issues where we as a company can make a significant
change and global warming, we have resolved to limit total green- contribution, such as climate protection, sustainable consumption and
house
Growgas emissions from than
our production sites and our energy production, and fighting hunger.
sales volumes faster
faster than global
global
––3%
3% Achieve aaa return
return on capital
capital employed (ROCE) (ROCE)
7.7%
2222
2
Grow
Grow sales
sales volumes
volumes faster than global Achieve
Achieve return on
on capital employed
employed (ROCE)
7.7%
Growsales
salesvolumes
volumesfaster
faster than global Achieveaa 2 2
Grow
Grow
Grow sales
sales volumes
volumes faster
faster than
than
than global
global chemical
global Achieve
Achieve
Achieve aareturn
returnon
return
return oncapital
on
on capital
capital
capital employed
employed
employed
employed (ROCE)2
(ROCE)
(ROCE)
(ROCE)
chemical production
chemical
chemical
production production
production every year
every
every
every year every year
year (Global
(Global chemical
chemical considerablyabove
considerably
considerably
considerably abovethe
above
above thecost
the
the costofof
cost
cost of
of capital
capital
capital
capital (Cost
(Cost of
of capital:
capital: 10%)
10%)
chemical production year (Globalchemical
(Global
(Global
(Global
chemical
chemical
chemical considerably above the cost of capital (Costof
(Cost
(Cost
(Cost
ofcapital:
of
of
capital:10%)
capital:
capital:
10%)
10%)
10%)
production:
production:
production:
production:
production:
pproduction: 1.8%)
1.8%)
1.8%)
1.8%)
1.8%)
roduction: 1.8%) percentage
percentage
percentage
ppercentage everyyear
every
every
ercentage every year
year
year
1.8%) every year
Status of Target Achievement in 2019
–––11%
11% €3.30
Increase EBITDA before special items by Increaseathe
the dividend pershare
share every year
Increase
Increase
Grow EBITDA
EBITDA
sales
Increase before
before
volumes
EBITDA special
special
faster
before items
items
thanitems
special global by
by
byby
3% Increase
Increase
Achieve
Increase the
the dividend
dividend
return per
per
on capital
dividend per share
share every
every
employed
every year
year
(ROCE)
year
7.7%3333
22
Increase
3–5%per
3–5%
3–5%
chemical
3–5%
EBITDA
peryear
per
per year
year
year
before
production
3–5% per year
special
every year
items
(Global
(Global chemical
chemical
Increase
basedon
based
based on
on
the
considerably
based
dividend
onaaaastrong
strong
strong
strong
above free
per
free
free
the
free
share
cash
cash
cash
cost
cash
based on a strong free cash flow
flow
flow
flow
of
flow
every
capital
year
(Cost
(Cost of
€3.30
of capital:
capital:
(2018:
(2018:
(2018: 10%)
10%)
€3.20)
€3.20)
€3.20)
(2018:€3.20)
€3.20)
(2018:
(2018: €3.20)
production:
production: 1.8%)
1.8%) percentage every year (2018: €3.20)
Increase EBITDA before special items by
–8.2%
11% Increase the dividend per share every year
€3.30 3
–– 8.2% €15.0
Grow
Grow
GrowCO
Grow
Grow CO
CO neutrally
neutrally
CO22222-neutrally
CO until
until
neutrallyuntil
neutrally 2030
2030
until2030
until 2030
2030 Achieve
Achieve €22
€22
Achieve€22
Achieve
Achieve billion
billion
€22billion
€22 in
in
billioninin
billion Accelerator
Accelerator
inAccelerator
in Accelerator
Accelerator sales
sales
sales
sales
sales 4444
4 4
€15.0
4 4
Grow
3–5% CO
per222neutrally
(Development year
of carbon until
emissions2030
compared Achieve
based on€22
a billion
strong free Accelerator
cash flow sales
(Development
(Development
(Development
(Development
(Development
(Development
of
ofof
of
of carbon
carbon
carbon
carbon
carbon emissions
emissions
emissions
emissions
emissions compared
compared
compared
compared
compared
of carbon emissions compared by2025
by
by
by 2025
2025
2025 (2018:
(2018: €3.20)
€3.20)
with
with
with baseline
baseline
baseline 2018)
2018)
2018) by 2025
billion
withbaseline
baseline 2018)
billion
with
with baseline 2018)
2018)
with baseline 2018)
b illion
billion
Reduce
Reduce
Reduce
Grow
Reduce
Reduce
per
per
CO worldwide
worldwide
worldwide
22
per 200,000
200,000
200,000
(Development
(Development
200,000
neutrally
worldwide
worldwide
working
working
ofworking
of
workingcarbon
carbon
process
process
process
until 2030
process
process
hours
hours
hours
emissions
emissions
hours
safety
safety
safety
safety
safety
to ≤≤≤by
to
to
incidents
incidents
incidents
incidents
incidents
0.12025
0.1
0.1
compared
to ≤ tocompared
0.1 by 2025
by
by 2025
2025
per 0.3
0.3
– 8.2%
0.3
Reducethe
Reduce
Reduce
Achieve
Reduce
Reduce
per2025
per
per
by
theworldwide
the
the
€22
the
200,000
200,000
200,000
200,000
worldwide
worldwide
worldwide
billion
worldwide
working
working
working
working hours
losttime
losttime
losttime
in Accelerator
lost-time
losttime
hours
hours
hours to ≤≤≤by
to
to
to ≤ to
0.1 0.1
injury
injury
injury
sales
injury
injury
0.12025
0.1 by
by
rate
rate
rate
rate
44
rate
by 2025
2025
2025
per 0.3
0.3
€15.0
0.3
per
with200,000
with baseline working
baseline 2018) hours ≤ 0.1 by 2025 per 200,000 working hours ≤ 0.1 by 2025
billion
2018)
Introduce
Introduce
Introduce
Reduce
Introduce
Introduce
production
production
production
per
sustainable
sustainable
sustainable
worldwide
sustainable
sustainable
sites
sites
sites
200,000sites
production working
in
watermanagement
water
water
process
water
water
inwater
in
in water
water
water
management
management
management
safety
management
stress
stress
stress
hours
stress areas
areas
areas
to ≤ areas
0.1 and
and
and
byand
2025
at
at
at
incidents
atat
at
at
at
atat
all
all
all
all
allall 35.8%
0.3
35.8% Morethan
More
More
Reduce
More
More
atBASF,
at
at
per
at
than
than
than
than
BASF,
BASF,
BASF,
the80%
80%
80%
80%
80%
they
they
they
200,000
they
ofour
of
of
of
of
ouremployees
our
our
worldwide
our
canthrive
can
can thrive
working
can
employees
employees
employees
employees
thrive
thrive
hoursand
and
and
andto
feelthat
feel
feel
losttime feel
injury
feel
perform
perform
perform
≤ 0.1 by
perform
that
that
that
rate
that
at
at
at
2025
atat
79%
0.3
79%
production sites in water stress areas and at BASF, they can thrive and perform
all Verbund
all
all Verbund
Verbund
Verbund sites
sites
sites
sitessites by 2030
by
by
by 2030 2030
2030 theirbest
their
their
their best
best
best
all Verbund by 2030 their best
Introduce sustainable water management at all
35.8% More than 80% of our employees feel that
79%
production thesites
Increasethe in water
proportion stress
womenareas
ofwomen and at
inleadership
leadership
23%
23% at BASF,
Cover they
90% ofcan thrive and
ourrelevant
relevant perform
spend withat
81%
81%
5
Increase
Increase the
the proportion
proportion of
of women
women in
in leadership
leadership Cover
Cover 90%
90% of
of our
our relevant
relevant spend
spend 555 with
5
with
Increase proportion of inin Cover 90% of our spend with
23% 81%
55
Increase the proportion of women leadership Cover 90% of our relevant spend with
all Verbund
positions
positions
positions
positions
positions sites
with
with
with
with
with by 2030responsibility
disciplinary
disciplinary
disciplinary
disciplinary
disciplinary responsibility
responsibility to
to
responsibilitytoto
responsibility to
to their best
sustainability
sustainability
sustainability
sustainability
ssustainability evaluations
evaluations
evaluations
evaluations
ustainability evaluations by
by
by
by
byby 2025
2025
2025
2025
2025
positions with disciplinary responsibility evaluations 2025
22–24%by
22–24%
22–24%
22–24% by2021
by
by 2021
2021
2021
22–24% by 2021
Newtarget
New
New
New
New
targetfor
target
target
target
for
for
for
for
2030:
2030:
2030:
2030:
2030:
30%
30%
30%
30%
30%
Have80%
Have
Have
Have
Have
80%of
80%
80%
80%
ofour
of
of
of
sustainability
sustainability
sustainability
ssustainability
oursuppliers
our
our
our
suppliersimprove
suppliers
suppliers
suppliers
performance
performance
performance
ustainability performance
improvetheir
improve
improve
improve
upon
upon
upon
upon
their
their
their
their
re-evaluation
re-evaluation
re-evaluation
re-evaluation
52%
52%
52%
performance upon re-evaluation
Increase the proportion of women in leadership
positions with disciplinary responsibility to
23% Cover 90% of our relevant spend55 with
sustainability evaluations by 2025
81%
22–24% by 2021
New target for 2030: 30%
Have 80% of our suppliers improve their
sustainability performance upon re-evaluation
52%
111
1
11 1 For
For
For more
more
more
Formore
For
For
For
information
information
information
moreinformation
more
more
informationon
information
information
on
on
on
onthe
on
on
the
the
the Sustainable
Sustainable
Sustainable
theSustainable
the
the
Development
Development
Development
SustainableDevelopment
Sustainable
Sustainable
DevelopmentGoals
Development
Development
Goals
Goals
Goals (SDGs),
(SDGs),
(SDGs),
Goals(SDGs),
Goals
Goals
(SDGs),see
(SDGs),
(SDGs),
see
see
see sustainabledevelopment.un.org
sustainabledevelopment.un.org
sustainabledevelopment.un.org
seesustainabledevelopment.un.org
see
see
sustainabledevelopment.un.org
sustainabledevelopment.un.org
sustainabledevelopment.un.org
222
2
22 2 Return
Return
Return
Returnon
Return
Return
Return
on
on
on capital
capital
capital
oncapital
on
on
employed
employed
employed
capitalemployed
capital
capital
employed(ROCE)
employed
employed
(ROCE)
(ROCE)
(ROCE)
(ROCE)isis
(ROCE)
(ROCE) is
is
is
is aaaameasure
isaa
a
measure
measure
measure
measureof
measure
measure
of
of
of the
the
the
ofthe
of
of
profitability
profitability
profitability
theprofitability
the
the
of
of
of
profitabilityof
profitability
profitability
our
our
our
ofour
of
of
operations.
operations.
operations.
ouroperations.
our
our
operations.We
operations.
operations.
We
We
We calculate
calculate
calculate
Wecalculate
We
We
this
this
this
calculatethis
calculate
calculate
indicator
indicator
indicator
thisindicator
this
this
as
as
as
indicatoras
indicator
indicator
the
the
the
asthe
as
as
EBIT
EBIT
EBIT
theEBIT
the
the
generated
generated
generated
EBITgenerated
EBIT
EBIT
by
by
by
generatedby
generated
generated
the
the
the
bythe
by
by
segments
segments
segments
thesegments
the
the
as
as
as
segmentsas
segments
segments as
as aaaapercentage
asaa
a
percentage
percentage
percentage of
of
of
percentageof
percentage
percentage
the
the
the
ofthe
of
of
average
average
average
theaverage
the
the
cost
cost
cost
averagecost
average
average
of
of
of
costof
cost
cost of
of
capital
capital
capital
ofcapital
capital
capital
basis.
basis.
basis.
capitalbasis.
basis.
basis.
basis.
333
3
33 3 Dividend
Dividend
Dividend proposed
proposed
proposed
Dividendproposed
Dividend
Dividend
Dividend
proposedby
proposed
proposed
by
by
by the
the
the
bythe
by
by
Board
Board
Board
theBoard
the
the
Boardof
Board
Board
of
of
of Executive
Executive
Executive
ofExecutive
of
of
Directors
Directors
Directors
ExecutiveDirectors
Executive
Executive
Directors
Directors
Directors
444
4
44 4 Accelerator
Accelerator
Accelerator products
products
products
Acceleratorproducts
Accelerator
Accelerator
Accelerator
productsare
products
products
are
are
are products
products
products
areproducts
are
are
productsthat
products
products
that
that
that
thatmake
that
that
make
make
make a
aa substantial
substantial
substantial
makeaaasubstantial
make
make a
sustainability
sustainability
sustainability
substantialsustainability
substantial
substantial
contribution
contribution
contribution
sustainabilitycontribution
sustainability
sustainability
contributionin
contribution
contribution
in
in
in the
the
the
ininthe
in
value
value
value
thevalue
the
the value
value
chain.
chain.
chain.
valuechain.
chain.
chain.
chain.
555
5
55 5 We
We
We understand
understand
understand
Weunderstand
We
We
We
relevant
relevant
relevant
understandrelevant
understand
understand
spend
spend
spend
relevantspend
relevant
relevant
spendas
spend
spend
as
as
as procurement
procurement
procurement
asprocurement
as
as
procurementvolumes
procurement
procurement
volumes
volumes
volumes
volumeswith
volumes
volumes
with
with
with suppliers
suppliers
suppliers
withsuppliers
with
with
defined
defined
defined
suppliersdefined
suppliers
suppliers
definedas
defined
defined
as
as
as “relevant.”
“relevant.”
“relevant.”
as“relevant.”
as
as
“relevant.”For
“relevant.”
“relevant.”
For
For
For more
more
more
Formore
For
For
information,
information,
information,
moreinformation,
more
more
information,see
information,
information,
see
see
see basf.com/report
basf.com/report
basf.com/report
seebasf.com/report
see
see
basf.com/report
basf.com/report
basf.com/report
[Your
In[[[South ] Report
10
10
910 BASFIn
BASF
BASF
BASF
BASF
In
in
In
Your America]]] Report
YourCountry
Country
Country
Your Country
Report2019
Report 2019
2019
Report2019
2019
11 For
For more
more information
information on
on the
the Sustainable
Sustainable Development
Development Goals
Goals (SDGs),
(SDGs), seesee sustainabledevelopment.un.org
sustainabledevelopment.un.org
22 Return
Return on
on capital
capital employed
employed (ROCE)
(ROCE) is
is aa measure
measure of
of the
the profitability
profitability of
of our
our operations.
operations. We
We calculate
calculate this
this indicator
indicator as
as the
the EBIT
EBIT generated
generated by
by the
the segments
segments as
as aa percentage
percentage of
of the
the average
average cost
cost of
of capital
capital basis.
basis.
33 Dividend
Dividend proposed
proposed byby the
the Board
Board of
of Executive
Executive Directors
Directors
44 Accelerator
Accelerator products
products are
are products
products that
that make
make aa substantial
substantial sustainability
sustainability contribution
contribution in
in the
the value
value chain.
chain.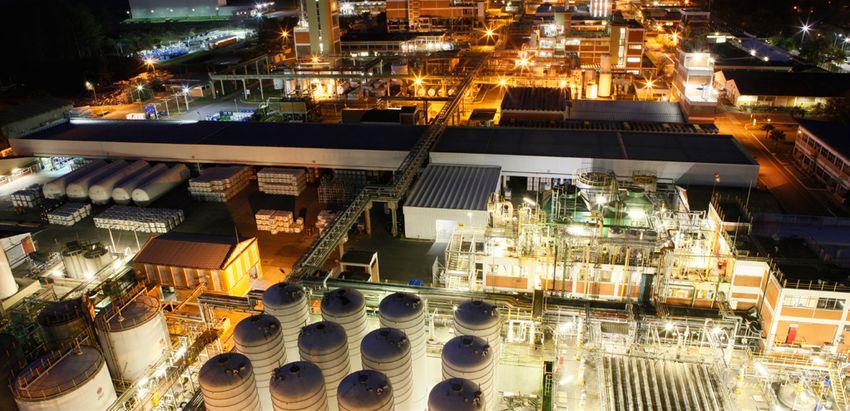
You can also read