We create chemistry for a sustainable future - BASF in South America Report 2020
←
→
Page content transcription
If your browser does not render page correctly, please read the page content below
We create chemistry
for a sustainable future

        BASF in
        South America
        Report 2020
Destaques 2020 Destaques 2020
Key facts 2020
€3,590
million
sales by location of
5,850
customer, group employees in
consolidated, sales to South America
third parties
70%
One of the top three of the business
global market areas in which
positions in around BASF is active
women in leadership
30.6% women employed in South America1 32.2%
in South America
1
Includes all consolidated BASF Group
companies and management, directorship
90,000+ Around
and vice-chairmanship positions
customers
in the world and 110,000
70,000 employees
suppliers worldwide
Mata Viva®:
144 hectares of green area
reforested with trees of
different ages in the Chemical
33,500
tons of CO2
removed from
83.4%
Waste recycled from
Complex in Guaratingueta the atmosphere chemical production of
€59,149
(SP, Brazil), since 1984 BASF in South America
billion of sales with
Accelerator products,
million €16.7 which significantly
contribute to sustainability
sales for the in the value chain
BASF Group
2002-2020
A reduction of
42%
increase in absolute
58%
10,000
specific water consumption
production volume per ton of chemicals
in tons per year
€2.1 billion
produced in South America
Research &
Development employees
expenses in Research and
Development (R&D)
worldwide
1.7 million We held
We donated more than
people
favored in South America
by social engagement
115 actions
aimed at minimizing
the impacts of the
700tons
actions in the fight pandemic on society of products in partnership
against COVID-19 with our customers
in South America
Index
Index
1 – About this report 4
2 – Message from President 5
3 – BASF Group 2020 at a glance 6
3.1 – The BASF Group 7
3.2 – BASF in the regions 13
3.3 – BASF on the capital market 15
4 – BASF in South America 17
4.1 – Implementation on our corporate strategy 19
4.2 – 2020 Situation 20
4.3 – People build our success 24
4.4 – Sustainability 30
4.5 – Innovation 38
4.6 – Digitalization 41
4.7 – Portfolio 44
4.8 – Operations 46
5 – Ten years overview — BASF Global
6 – Additional information
48
49
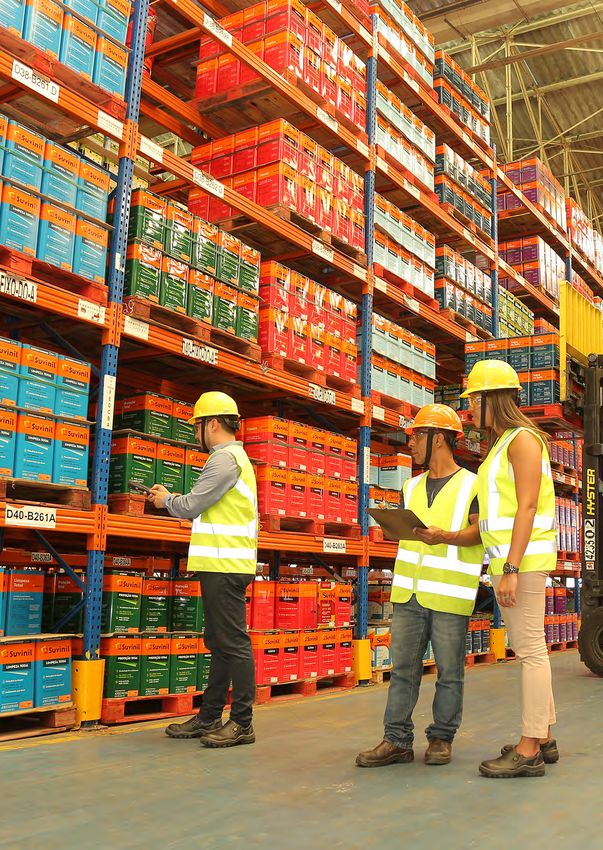
Strong virtual connections
In 2020, we experienced a substantial commitment of our
teams in South America, those who maintained our business
working from home, as well as those who maintained our
operations by working in the units. Together, they have
contributed to fighting the impacts of the COVID-19 pandemic.
We have used virtual media to be more united. We have worked
with our customers and partners to overcome challenges. We
have created new ways of doing business, with creativity, agility
and quality.
Connection, innovation and commitment: this way, we create
chemistry for a sustainable future.
About this report
The “BASF in South America” Report is published annually as a document on the performance of our activities in the three pillars of
sustainability — economy, environment and society. The reference period for this publication is the fiscal year 2020. This report also provides
an overview of the BASF Group, together with its financial performance, prepared in accordance with the requirements of the International
Financial Reporting Standards (IFRS) and, where applicable, the German Commercial Code as well as the German Accounting Standards
(DRSC). Emissions, waste, energy and water use from consolidated joint operations are included, based proportionally on our participation.
The number of employees refer to employees employed by the BASF Group as of December 31, 2020. The scope of this review and the
main focus points of our reports are defined based on the topics along the value chain, which we identified in internal strategic discussion
processes, ongoing global data analysis and dialog with shareholders.
For more information on our selection of sustainability topics, see from page 33 onwards and basf.com/materiality
1 The people depicted in this report complied with the regulations in place at the time the photos were taken – before or during the coronavirus pandemic. The photos in which people appear without wearing a mask were taken
before March 12, 2020.
2 BASF is committed to promoting gender equity, which also involves attention to the use of language. Some words have only the masculine form in Portuguese because of its specificity. If they do not explicitly address the male
gender, they are referring to all people in general.
3 Hyperlinks direct to complementary content in Spanish.
4 BASF in South America 2020 Report
Message from president

                                                                                                                           Message from president
                                                                                                                           BASF for South America

                                                                                                                           The pandemic highlighted the importance of raw materials and
                                                                                                                           solutions developed by the chemical industry, as we develop
                                                                                                                           products that became essential for the pharmaceutical, hygiene,
                                                                                                                           sanitation, household cleaning and packaging segments, among
                                                                                                                           others. Our presence in different segments has enabled us to
“We connect people and                                                                                                     contribute to reduce the impacts of the health emergency and to

organizations, because we                                                                                                  safely deliver products to our customers. Moreover, we have
                                                                                                                           reinforced our sustainability actions with significant impacts on
believe that only together we can                                                                                          society, as for example with the social engagement actions in the
                                                                                                                           fight against COVID-19, which served more than 1.7 million people
succeed in creating chemistry                                                                                              throughout South America. With different technologies, we have
for a sustainable future.”                                                                                                 been close to our customers and we have strengthened our digital
                                                                                                                           presence and our sustainable performance.

                                                                                                                           Even with the numerous challenges imposed on us during the
                                                                                                                           year, we were able to grow in volume in South America in most
                                                                                                                           segments. However, we were affected by the strong devaluation
                                                                                                                           of local currencies, especially in Brazil and Argentina. As a result,
                                                                                                                           the company’s 2020 sales in South America decreased 6%
The year 2020 was marked by the effects of an unprecedented                                                                compared to 2019, totaling €3.6 billion1.
health and humanitarian crisis that affected healthcare systems
and the economy worldwide. Our operations were also globally                                                               We challenge ourselves day after day, setting and pursuing
and regionally affected by this crisis.                                                                                    ambitious goals throughout the value chain, which you will learn
                                                                                                                           about in this report. Therefore, we effectively live our purpose.
United by our purpose to create chemistry for a sustainable future,
our activities are aimed at three fronts: health and safety of our                                                         I would like to express my solidarity with all the people who have
employees, service to our customers, and support to society.                                                               been directly impacted by the pandemic in their families.

With the commitment of our employees and the partnership with                                                              Sincerely,
communities, governments, customers, and suppliers, we have
reacted quickly to the crisis, keeping our activities in operation, with                                                   Manfredo Rübens
teams working from home office and also in our production plants.                                                          President BASF for South America

1 Regions: location of customer, group consolidated, sales to third parties; Sites: by legal entity, including sales to BASF group companies.

                                                                                          BASF in South America 2020 Report                                                                   5
Key data Chemicals
BASF Group 2019
Million €
BASF
BASFGroup
BASF Group2019
2020at
ataaglance
glance
Segment data
Sales
1
2019 9,532
BASFGroup
Group2019
2019at
ataaglance
glance
2018 11,694
at a glance
2019 2018 +/–
Sales1 million € 59,316 60,220 (1.5%) EBIT before special items 2019 791
2018 1,587
EBITDA before special items 1
million € 8,217 9,271 (11.4%)
EBITDA1 million € 8,036 8,970 (10.4%)
BASF
Key
BASF Group 2019
data
BASF Group
EBIT before
2020
2019 Group
special items 4,536 6,281 (27.8%)
Segment Chemicals
Industrial
Segment data
1 Solutions
1
Million €
2019 Segment data
million €
EBIT1
BASF Group 2019 at a glance
million € 4,052 5,974 (32.2%) Segment data
data
Sales
11
2019 9,532
8,389
at
at a
aa glance
glance
2018 11,694
9,120
at glance
Net income million €
2019
8,421 2018
4,707 +/–
78.9%
Sales 59,316 60,220 (1.5%)– EBIT before special items 2019 791
820
ROCE11 million %€ 7.7 12.0
2018 1,587
668
EBITDA
Earningsbefore special items1
per share million € 8,217
9.17 9,271
5.12 (11.4%)
79.1%
EBITDA
Assets 1
million € 8,036
86,950 8,970
86,556 (10.4%)
0.5%
Key
Key
Key
Key data
data
data
data
Chemicals
Chemicals
Industrial
Chemicals
Nutrition &Solutions
Care
Million
Million€€€
BASF Group 2019
EBIT before
Investments special items
including 1
million € 4,536 6,281 (27.8%) Chemicals Million
Million €
acquisitions
EBIT1
2
BASF Group 2019 at a glance
million €
million €
4,097
4,052
10,735
5,974
(61.8%)
(32.2%) Segment data
Sales
Sales
Sales
Sales
1 2019
2020
2019
2019
9,532
8,071
8,389
9,532
6,075
9,532
2019
2020 2018
2019 +/–+ / – 2018
2019 11,694
9,532
2018 9,120
11,694
5,940
at a glance
Net income million € 2019
2019
8,421 2018
2018
4,707 ++/ /––
78.9% 2018 11,694
Sales
Sales 1 million
million € € 59,149
59,316 59,316
60,220 –0.3%(1.5%) EBIT before
beforespecial
EBITbefore items
specialitems
items 2019
2020 791
445
ROCE
Sales 11 7.7
59,316 12.0
60,220 (1.5%) – EBIT
EBIT beforespecial
special items 2019
2019 820
791
793
791
Sales1 million%€ €
million 59,316 60,220 (1.5%) 2018
2019 1,587
791
2019 2018 +/– 2018
2018 668
1,587
736
1,587
EBITDA
EBITDAbefore
beforespecial
special items
items11a million
million€ € 8,217
7,435 9,271
8,324 (11.4%)
–10.7%
Earnings
EBITDA per share
EBITDAbefore
before special
specialitems
items1 million€ €
million 9.17
8,217
8,217 5.12
9,271
9,271 79.1%
(11.4%)
(11.4%)
Employees
EBITDA1 1a at year-end
EBITDA 1
million
million€ € 117,628
8,036
6,494 122,404
8,970
8,185 (3.9%)
(10.4%)
–20.7%
Assets
EBITDA
EBITDA million
million€ € 86,950
8,036
8,036 86,556
8,970
8,970 0.5%
(10.4%)
(10.4%)
Personnel
EBIT
EBITbefore
expensesitems1a
beforespecial
million €€ 10,924
4,536 10,659
6,281 2.5%
(27.8%) Industrial
Materials Solutions Million
Million€€€
Key data special items
items1 million 3,560 4,643 –23.3%
Investments including million € Nutrition
Materials&Solutions
Chemicals
Industrial
Materials Care
BASF Group 2019
EBIT
EBITbefore
beforespecial
special items1 million
million€ € 4,536
4,536 6,281
6,281 (27.8%)
(27.8%) Million
Million €
4,097 10,735 (61.8%)
Research
acquisitions
EBIT
EBIT
EBIT
1
EBIT1 1
1 a
expenses
and
2 development
million €
million €
million
million€€ €
million
4,052
2,158
–191
4,052
4,052
5,974
1,994
4,201
5,974
5,974
(32.2%)
8.2%
.
(32.2%)
(32.2%)
Segment data
Sales
Sales
Sales
Sales
1 2019
2020
2019
2019
2018
8,389
10,736
6,075
9,532
8,389
11,466
11,466
9,120
Net income million € 8,421 4,707 78.9% 2019
2018 11,466
5,940
11,694
9,120
13,270
at a glance
Netincome
Net income million 2019
–1,060
8,421 2018
8,421
4,707 .+ / –
78.9% 2018 13,270
Net income gas
Greenhouse tons€ € €
million
million
million metric 8,421 4,707 78.9%
ROCE 1 20.1
7.7 21.9
12.0 (8.2%) – EBIT before
beforespecial
EBITbefore items
specialitems
items 2019
2020 820
835
emissions 3
of CO 2 equivalents% EBIT
EBIT beforespecial
special items 2019
2019 793
791
820
1,003
1,003
ROCE
Sales
ROCE
ROCE
11 1
million %€%% 7.7
59,316
1.7
7.7 12.0
60,220
7.7
12.0 – ––
(1.5%) 2018 668
2019 2018 +/– 2019
2018 1,003
736
1,587
668
2,400
Earnings per share
Energy efficiency in kilogram of sales€ 9.17 5.12 79.1% 2018 2,400
Earnings
EBITDA
Earnings
Earnings per
pershare
before
per special items1 million € € €
share
share 9.17
8,217
598
9.17
–1.15 5.12
9,271
626
5.12
9.17 79.1%
(11.4%)
(4.5%)
79.1%
.
production
Employees processes
at year-end product/MWh 117,628 122,404 (3.9%)
Assets million € 86,950 86,556 0.5%
Assets
EBITDA
Assets
Total
1
assetssales million
million €
million€ €
86,950
8,036
86,950
80,292 86,556
8,970
86,556
86,950 –7.7% 0.5%
(10.4%)
0.5%
Accelerator
Personnel expenses million
million €€ 15,017
10,924 14,284
10,659 5.1%
2.5%
Investments including Nutrition &Solutions
Industrial Care Million
Million€€€
Key data
Investments
EBIT before
Investments
acquisitions
Investments
Number
Research
acquisitions
acquisitions
ofand
including
special
2 including
including
on-site
items1
million
sustainability million €
2 2 development
million
million
€
€€
4,097
4,536
4,097
4,097
4,869
81
2,158
10,735
6,281
10,735
10,735
4,097
100
1,994
(61.8%)
(27.8%)
(61.8%)
(61.8%)
18.8%
(19.0%)
8.2%
Materials
Industrial
Nutrition
Chemicals
Surface
Sales
&Solutions
Industrial Care
Technologies
Solutions
2019
Million
Million €
6,075
acquisitions
audits
1
expenses
b
EBIT of raw material suppliers million million €€ €
million 4,052 5,974 (32.2%) Sales 2020 7,644
11,466
8,389
1
Sales
Sales 2019
2019 6,075
9,532
13,142
8,389
2018
2019 5,940
8,389
2019 2018 +/– 2018
2018 13,270
9,120
5,940
11,694
11,199
9,120
Net income gas
Greenhouse million
million metric tons€ 8,421 4,707 78.9%
20.1
2020 21.9
2019 (8.2%)
+/– EBIT
emissions3 EBITbefore
EBIT beforespecial
specialitems
items 2019
2020 793
822
1,003
820
ROCE11
Sales
of CO 2 equivalents
million %€ 20197.7
59,316 2018
12.0
60,220 +/–
(1.5%) EBITbefore
beforespecial
specialitems
items 2019
2019
2018
793
791
722
820
736
2019 2018 2019 820
Employees
Energy at year-end
efficiency in kilogram of sales
2019
110,302 2018
117,628 –6.2%++/ /–– 2018
2018 2,400
668
736
1,587
617
668
Earningsbefore
EBITDA
Employees peratshare
special items1 million €
year-end 9.17
598
8,217
117,628 5.12
626
9,271
122,404 79.1%
(4.5%)
(11.4%)
(3.9%)
production
Employees processes
at product/MWh
Personnel
Employees atyear-end
expenses
year-end million € 117,628
10,576
117,628 122,404
10,924
122,404 (3.9%)
–3.2% (3.9%)
Assets
EBITDA expenses
Personnel
1
million €€
million 86,950
8,036
10,924 86,556
8,970
10,659 0.5%
(10.4%)
2.5%
Accelerator
Personnel sales million € 15,017 14,284 5.1%
Research expenses
Personnel expenses
and million
million€ € 10,924
10,924 10,659
10,659 2.5%
2.5% Materials
Surface Technologies Million
Million€€€
Investments
EBIT before
Research ofand
development
Number
including
special items1
development
expenses
on-site
million €
sustainability million €
2,086
4,536
4,097
2,158
6,281
10,735
–3.3%
(27.8%)
(61.8%)
Surface
SurfaceTechnologies
Nutrition
Materials
Industrial&Solutions
AgriculturalCare
Solutions
Technologies Million
Million €
Research
acquisitions
Research 1and
2 development
and development million €€ 2,158
81 1,994
100 8.2%
(19.0%)
expenses
audits
1 of raw material suppliers million 2,158
2,158 1,994
1,994 8.2%
8.2% Sales
Sales 2019
2020 11,466
16,659
EBIT
expenses
expenses
11 million
million €€ 4,052 5,974 (32.2%) Sales
Sales 2019
2019 13,142
6,075
11,466
8,389
7,814
13,142
Greenhouse gas million metricmilliontons € 2018 13,270
Greenhouse c gas 20.8 20.1 3.5% 2019
2018 13,142
11,199
5,940
13,270
9,120
6,156
emissions
Net income million
of CO metric tons
equivalents 8,421
20.1 4,707
21.9 78.9%
(8.2%) 2018 11,199
Greenhouse
Greenhouse gas gas million million
2metric tons €
emissions 3
ofmillion metric tons 20.1 21.9 (8.2%) EBIT before
beforespecial items 2019 1,003
CO 2 equivalents 20.1 21.9 (8.2%)
emissions 33 EBITbefore
EBIT specialitems
items 2020 484
722
793
1,003
820
emissions
Energy
ROCE 1 efficiency in ofofCO
CO2 2equivalents
kilograms equivalents
of sales
% 7.7 12.0 – EBIT beforespecial
special items 2019
2019
2018 1,095
722
2,400
Energy efficiency in kilogram of sales 540
2019 598
2018 –9.7%+ / – 2019
2018 722
617
736
2,400
668
734
production
Energy processes product/MWh 598 626 (4.5%) 2018 617
Energyefficiency
production
Earnings efficiency
per
in
sharein
processes
kilogram
kilogram ofofsales
product/MWh sales
€ 9.17
598 5.12
626 79.1%
(4.5%)
production 598 626 (4.5%)
productionprocesses
Employees
Accelerator atprocesses
year-end
sales
product/MWh
product/MWh
million € 117,628
16,740 122,404
15,017 (3.9%)
11.5%
Accelerator
Assets sales million € 15,017
86,950 14,284
86,556 5.1%
0.5%
Accelerator
Accelerator
Personnel sales
sales sustainability millionmillion
million€€ € 15,017
15,017 14,284
14,284 5.1%
5.1%
Number ofexpenses
on-site 10,924 10,659 2.5% Surface
NutritionTechnologies Million
Million€€€
Number
Investmentsof on-site
audits ofofof
Number raw
sustainability
including
material
on-site suppliers
sustainability
50
81
4,097
81
100
10,735
–38.3%
(19.0%)
(61.8%)
Materials
Surface &&
Agricultural Care
Solutions
NutritionTechnologies
Nutrition &Care
Care Million
Million €
Number
Research
audits and
of raw
acquisitions 2on-site
materialsustainability
development
suppliers million € 81 100 (19.0%)
audits of raw
1rawmaterial suppliers 2,15881 100
1,994 (19.0%)
8.2% Sales
Sales 2019
2020 13,142
6,019
audits
expenses of material suppliers million € Sales
Sales 2019
2019 7,814
11,466
13,142
6,075
6,075
2018
2019 11,199
6,075
2018
2018 6,156
13,270
11,199
5,940
5,940
Greenhouse gas million metric tons
20.1 21.9 (8.2%) EBIT before
beforespecial
EBITbefore items
specialitems
items 2019
2020 722
773
emissions3 of CO 2 equivalents EBIT
EBIT beforespecial
special items 2019
2019 1,095
1,003
722
793
793
2018
2019 617
793
2019 2018 +/– 2018
2018 734
2,400
617
736
736
Energy efficiency in kilogram of sales
598 626 (4.5%)
production
Employees processes
at year-end product/MWh
117,628 122,404 (3.9%)
Acceleratorexpenses
Personnel sales million € 15,017
10,924 14,284
10,659 5.1%
2.5%
million € Agricultural
Agricultural Solutions
Solutions Million
Million€€€
Number ofandon-site sustainability
Surface Technologies
Agricultural
Materials
Agricultural Solutions
Solutions Million
Million €
Research development 81 100 (19.0%) Sales 2019 7,814
audits of raw material suppliers 2,158 1,994 8.2% Sales 2020 7,660
expenses 1
million € Sales
Sales 2019
2019 13,142
7,814
11,466
7,814
2018
2019 6,156
7,814
2018
2018 11,199
6,156
13,270
6,156
Greenhouse gas million metric tons
20.1 21.9 (8.2%) EBIT
EBITbefore
beforespecial
specialitemsitems 2019
2020 1,095
970
emissions3 of CO 2 equivalents EBIT
EBITbefore
beforespecial
specialitemsitems 2019
2019 722
1,095
1,003
1,095
1 Restated figures, for more information, see basf.com/report 2018
2019 734
1,095
2 Additions to intangible assets and property, plant and equipment 1 The segment data for 2018 has been restated to reflect the new segment 2018
2018
structure. 617
734
2,400
734
Energy
3 efficiency
Excluding in to thirdkilogram
sale of energy partiesof sales Figures do not include the construction chemicals activities presented as discontinued operations.
598 626 (4.5%)
production processes product/MWh
Accelerator sales million € 15,017 14,284 5.1%
4
Number of on-site sustainability
Agricultural Solutions
Surface Technologies Million €
81 100 (19.0%)
audits of raw material suppliers Sales 2019 7,814
13,142
2018 6,156
11,199
1 Restated figures, for more information, see basf.com/report EBIT before special items 2019 1,095
722
2 Additions to intangible assets and property, plant and equipment 1 The segment data for 2018 has been restated to reflect the new segment 2018structure. 734
617
3 Excluding sale of energy to third parties Figures do not include the construction chemicals activities presented as discontinued operations.
4 Agricultural Solutions Million €
Sales 2019 7,814
2018 6,156
1 Restated figures, for more information, see basf.com/report
1a Restatedfigures,
Restated figuresfor2019; forinformation,
more information, see basf.com/report EBIT before special items 2019 1,095
21 Additions
b Restated to
Additions formore
intangible
figures,
tointangible
property,
assets
more
plantinformation,
and
see
seebasf.com/report
and property,
equipment
plant and equipment
basf.com/report
and intangible assets
1 The segment data for 2018 has been restated to reflect the new segment structure.
2
32 Additions
Additionsto
Excluding sale
to of energy
intangible assets and
to third
assets property,
property,plant
parties
and plantand
andequipment
equipment 11 The
Thesegment
Figures do notdata
segment for
for2018
include
data the
2018 has
hasbeen
beenrestated
construction totoreflect
chemicals
restated reflectthe
activities new
newsegment
thepresented 2018
structure.
as discontinued
segment 734
structure. operations.
c Excluding
33 Excluding sale of energy to third parties
Excludingsale
saleofofenergy
energytotothird
thirdparties
parties Figures
Figuresdo
donot
notinclude
includethetheconstruction
constructionchemicals
chemicalsactivities
activitiespresented
presentedasasdiscontinued
discontinuedoperations.
operations.
46
44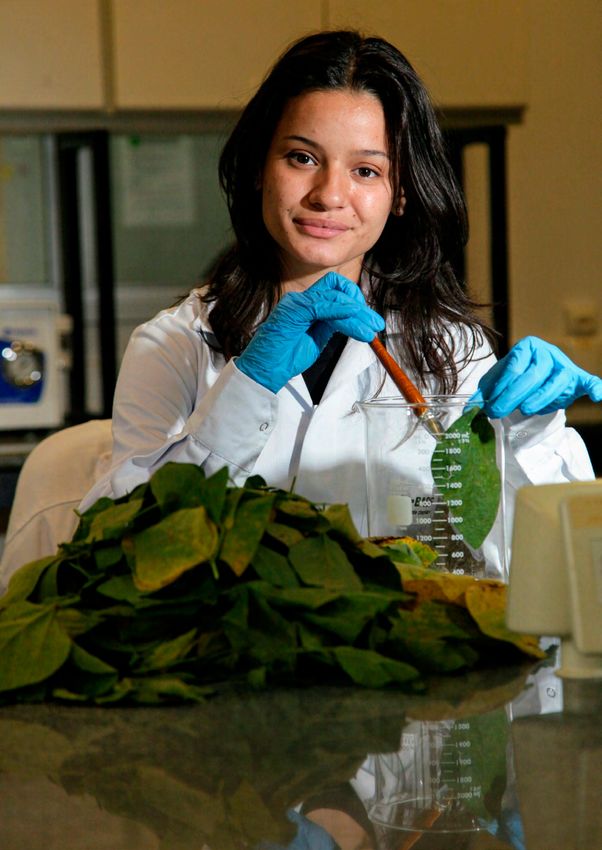
The BASF Group
The BASF Group Engineering, Advanced Materials & Systems Research and Bioscience
Research – safeguard our innovative capacity and competitiveness.
At BASF, we create chemistry for a sustainable future. Five service units provide competitive services for the operating
We combine economic success with environmental divisions and sites: Global Engineering Services; Global Digital
protection and social responsibility. The approximately Services; Global Procurement; European Site & Verbund
110,000 employees in the BASF Group work on contributing Management; Global Business Services (finance; human
to the success of our customers in nearly all sectors and resources; environmental protection, health and safety; intellectual
almost every country in the world. Our portfolio is property; communications; procurement, supply chain and
divided into Chemicals, Materials, Industrial Solutions, inhouse consulting services).
Surface Technologies, Nutrition & Care and Agricultural
Solutions segments. Following the bundling of services and resources and the
implementation of a wide-ranging digitalization strategy, the
Organization of the BASF Group number of employees in the Global Business Services unit
worldwide will decrease by up to 2,000 (from 8,000 currently) by
We have 11 divisions grouped into six segments: the end of 2022. From 2023 onward, the division expects to
Chemicals: Petrochemicals, Intermediates achieve annual cost savings of over €200 million.
Materials: Performance Materials, Monomers
Industrial Solutions: Dispersions & Pigments, The Corporate Center units support the Board of Executive
Performance Chemicals Directors in steering the company as a whole. These include
Surface Technologies: Catalysts, Coatings central tasks from the following areas: strategy; finance; law,
Nutrition & Care: Care Chemicals, Nutrition & Health compliance and tax; environmental protection, health and safety;
Agricultural Solutions: Agricultural Solutions human resources; communications; investor relations and
internal audit.
We take a differentiated approach to steering our businesses
according to market-specific requirements and the competitive The ongoing Excellence Program is expected to contribute
environment. We provide a high level of transparency around the €2 billion to EBITDA annually from the end of 2021 onward
results of our segments and show the importance of the Verbund compared with baseline 2018, including from the reduction of
and value chains to our business success. BASF aims to differenti around 6,000 positions worldwide until the end of 2021. This
ate its businesses from their competitors and establish a high- decrease results from the organizational simplification and from
performance organization to enable BASF to be successful in an efficiency gains in administration, the service units and the operating
increasingly competitive market environment. divisions. In addition, central, functional and regional structures are
being streamlined in connection with portfolio changes.
In line with BASF’s corporate strategy, the operating divisions,
service units, the regions and a Corporate Center have formed the To increase reporting transparency, the figures for investments
cornerstones of the BASF organization since January 1, 2020. We accounted for using the equity method were restated in the first
have streamlined our administration, sharpened the roles of quarter of 2020. Some investments are not an integral part of the
services and regions, and simplified procedures and processes. BASF Group. These include, in particular, the shares in Wintershall
These organizational changes have created the conditions for Dea GmbH, Kassel/Hamburg, Germany, and Solenis UK
greater customer proximity, increased competitiveness and International Ltd., London, United Kingdom. Since the first quarter
profitable growth. of 2020, these have been classified as purely financial investments
and reported separately from the shareholdings that are integral
Our divisions bear operational responsibility and are organized to the main business activities of the BASF Group. One material
according to sectors or products. They manage our 52 global and equity-accounted interest that has been classified as integral is
regional business units and develop strategies for the 75 strategic BASF-YPC Company Ltd., Nanjing, China. Income from non-
business units. integral companies accounted for using the equity method is no
longer presented in the BASF Group’s EBIT and EBIT before
The regional and country units represent BASF locally and support special items, but under net income from shareholdings. Due to
the growth of business units with local proximity to customers. For its increased significance, this will be presented as a separate
financial reporting purposes, we organize the regional divisions subtotal within income before income taxes and is no longer part
into four regions: Europe; North America; Asia Pacific; South of the financial result. Integral and non-integral investments
America / Africa / Middle East. accounted for using the equity method are also presented
separately in the balance sheet. The statement of income for 2019
Together with the development units in our operating divisions, the has been restated accordingly.
three global research divisions – Process Research & Chemical
BASF in South America 2020 Report 7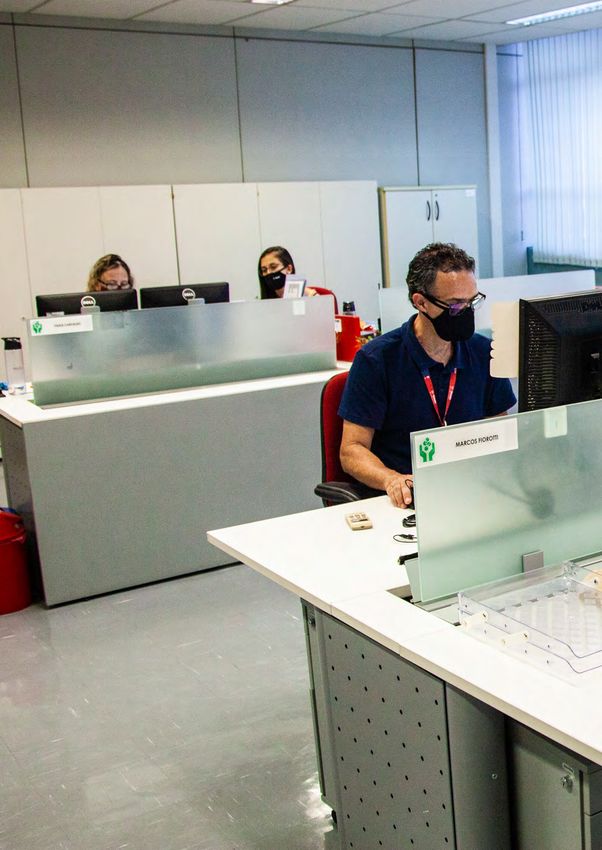
The BASF Group

On September 30, 2020, BASF completed the divestiture of its                                                             Business and competitive environment
construction chemicals business to an affiliate of Lone Star, a
global private equity firm, as agreed in December 2019.1 The                                                             BASF’s global presence means that it operates in the context of
purchase price on a cash and debt-free basis was €3.17 billion.                                                          local, regional and global developments and a wide range of
The Construction Chemicals division was previously reported                                                              conditions. These include:
under the Surface Technologies segment. The divested
construction chemicals business had around 7,500 employees                                                               – Global economic environment
and operated production sites and sales offices in more than 60                                                          – Legal and political requirements (such as European
countries. It generated sales of around €2.6 billion in 2019. The                                                           Union regulations)
disposal gain and the income after taxes of the construction                                                             – International trade agreements
chemicals business until closing are presented in the income after                                                       – Industry standards
taxes of BASF Group as a separate item (“Income after taxes from                                                         – Environmental agreements (such as the E.U. Emissions
discontinued operations”).                                                                                                  Trading System)
                                                                                                                         – Social aspects (such as the U.N. Universal Declaration of
Sites and Verbund                                                                                                           Human Rights)

BASF has companies in around 90 countries. We operate six                                                                BASF holds one of the top three market positions in around 70%
Verbund sites and 241 additional production sites worldwide. Our                                                         of the business areas in which it is active. Our most important
Verbund site in Ludwigshafen, Germany, is the world’s largest                                                            global competitors include Arkema, Bayer, Clariant, Corteva,
chemical complex owned by a single company that was developed                                                            Covestro, Dow, Dupont, DSM, Evonik, Huntsman, Lanxess,
as an integrated network. This was where the Verbund principle                                                           SABIC, Sinopec, Solvay, Sumitomo Chemical, Syngenta, Wanhua
was originally established and continuously optimized. We then                                                           and many hundreds of local and regional competitors. We expect
implemented it at additional sites. In 2020, we started the                                                              competitors from Asia and the Middle East in particular to gain
construction of the first plants at the planned integrated Verbund                                                       increasing significance in the years ahead.
site in Zhanjiang, China.
                                                                                                                         Corporate legal structure
The Verbund system is one of BASF’s great strengths. We add
value by using our resources efficiently. The Production Verbund                                                         As the publicly traded parent company of the BASF Group,
intelligently links production units and their energy supply so that,                                                    BASF SE takes a central position: Directly or indirectly, it holds the
for example, the waste heat of one plant provides energy to others.                                                      shares in the companies belonging to the BASF Group, and is also
Furthermore, one facility’s by-products can serve as feedstocks                                                          one of the largest operating companies. The majority of Group
elsewhere. This not only saves us raw materials and energy, it also                                                      companies cover a broad spectrum of our business. In the BASF
avoids emissions, lowers logistics costs and leverages synergies.                                                        Group Consolidated Financial Statements, 273 companies
                                                                                                                         including BASF SE are fully consolidated. We consolidate nine joint
We also make use of the Verbund principle for more than production,                                                      operations on a proportional basis, and account for 25 companies
applying it for technologies, the market and digitalization as well.                                                     using the equity method.
Expert knowledge is pooled in our global research divisions.

Procurement and sales markets

BASF supplies products and services to around 90,000 customers2
from various sectors in almost every country in the world. Our
customer portfolio ranges from major global customers and small
and medium-sized enterprises to end consumers.

We work with over 70,000 Tier 1 suppliers3 from different sectors
worldwide. They supply us with important raw materials, chemicals,
investment goods and consumables, and perform a range of
services. Important raw materials (based on volume) include
naphtha, liquid gas, natural gas, benzene and caustic soda.

1 T
   he construction chemicals business was transferred in two steps, on September 30, 2020, and on November 30, 2020.
2 The number of customers refers to all external companies (sold-to parties) that had contracts with the BASF Group in the business year concerned under which sales were generated.
3 BASF considers all direct suppliers of the BASF Group in the business year concerned as Tier 1 suppliers. These are suppliers that provide us with raw materials, investment goods, consumables and services.
  Suppliers can be natural persons, companies or legal persons under public law.

8                                                                                        BASF in South America 2020 Report
The BASF Group

Our Strategy                                                                                                            Customer focus

                                                                                                                        Our customers are our number one priority. BASF supplies
Corporate Strategy                                                                                                      products and services to around 90,000 customers1 from various
                                                                                                                        sectors in almost every country in the world. Our customer portfolio
At BASF, we are passionate about chemistry and our customers.                                                           ranges from major global customers and small and medium-sized
We want to be the world’s leading chemical company for our                                                              enterprises to end consumers. Our comprehensive product portfolio
customers, grow profitably and create value for society.                                                                means that we are active in many value chains and value creation
Thanks to our expertise, our innovative and entrepreneurial                                                             networks. We use various business strategies, which we adapt to
spirit, and the power of our Verbund integration, we make a                                                             the needs of individual industries and markets. These range from
decisive contribution to changing the world for the better. This                                                        cost leadership in basic chemicals to tailored, customer-specific
is our goal. This is what drives us and what we do best: We                                                             system solutions.
create chemistry for a sustainable future.
                                                                                                                        We want to be our customers’ most attractive partner for all
The world is facing major challenges. Climate change is advancing,                                                      challenges that can be solved with chemistry. This is why we
the world’s population is growing and so is its need for food. More                                                     continue to drive forward our focus on customers and their needs.
and more people live in cities and the demand for individual mobility                                                   We are refining our organizational structure so that our operating
is rising. At the same time, natural resources are limited. More than                                                   divisions can flexibly address specific market requirements and
ever before, we need solutions that make sustainable growth                                                             differentiate themselves from the competition. In addition, we are
possible. Chemistry plays a key role here. It can help to overcome                                                      simplifying and digitalizing our processes to make the way we work
global challenges in almost all areas of life. By combining our                                                         more effective, more efficient and more agile.
expertise with our customers’ competence, we can together
develop sustainable and profitable solutions.

Our innovations, products and technologies help to use natural
resources more efficiently, produce enough food for everyone,
reduce emissions, enable climate-smart mobility, improve the
capabilities of renewable energy, and make buildings more energy
efficient, among other things. Our purpose reflects what we do and
why we do it: We create chemistry for a sustainable future.

   Our corporate purpose
   We create chemistry for a sustainable future

                                                                                                                            Ultrasim®: Shorter development
We want to continue to grow profitably and make a positive                                                                  times thanks to virtual simulation
contribution to society and the environment. We see disruptive
changes in the chemical industry – like the advance of digitalization,                                                      Technical progress requires innovative materials. This is why
the development of circular economy models or the transformation                                                            engineering plastics are being used in more and more sectors
to climate-neutral production – as an opportunity. We have set                                                              and applications. They are often significantly lighter than
ourselves ambitious targets along the entire value chain.                                                                   conventional materials, are usually easier to process and offer
                                                                                                                            advantages such as heat and impact resistance or mechanical
Our customers and their needs are at the core of our strategy. We                                                           strength. As a leading manufacturer, BASF not only offers a
want to maintain our leading position in an increasingly competitive                                                        comprehensive portfolio of high-performance plastics, but also
environment. To achieve this, we are accelerating our innovation                                                            has extensive expertise in computer-aided engineering (CAE).
processes and deepening cooperation with our customers. We are                                                              Ultrasim, our virtual simulation tool, covers the entire process
systematically aligning our portfolio with growth areas and                                                                 chain – from the selection of suitable materials and the
integrating sustainability into our value chains even more strongly.                                                        development of virtual prototypes to the optimal production
Our Verbund structure is the basis for efficient, safe and reliable                                                         process for the component. Our customers find out quickly,
production both now and in the future. We leverage digital                                                                  precisely and reliably how our materials behave in specific
technologies to continuously improve processes and customer                                                                 applications. This reduces development times and saves costs
relationships, for example. We create a working environment that                                                            for complex tests.
best enables our employees to contribute to BASF’s success.                                                                    	For more information on Ultrasim, see basf.com/en/ultrasim

1 The number of customers refers to all external companies (sold-to parties) that had contracts with the BASF Group in the business year concerned under which sales were generated.

                                                                                        BASF in South America 2020 Report                                                                      9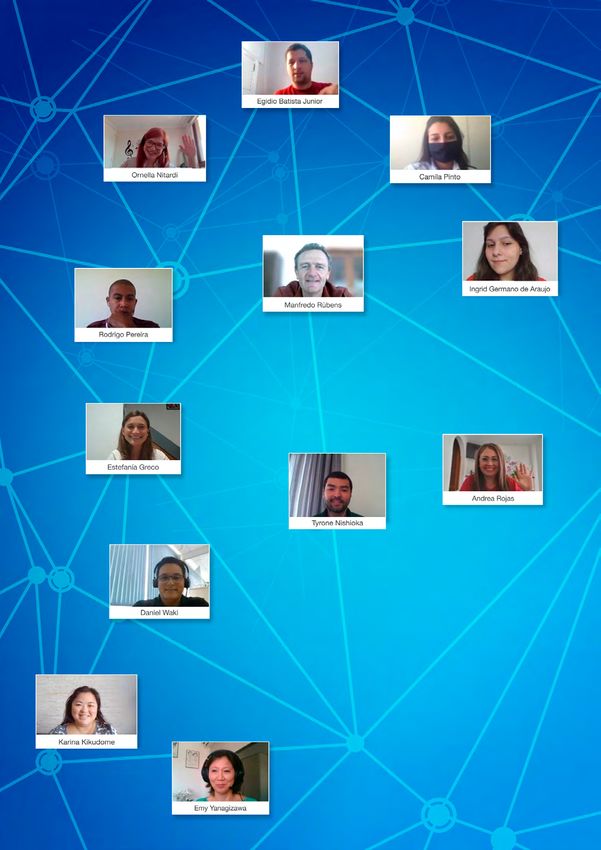
The BASF Group

We are continuously increasing transparency for our customers                   PolyTHF, which is used to produce elastic spandex textile fibers.
and improving our customer service with a range of measures. For                The next generation offers our customers easier processing and
instance, we have used the Net Promoter System® since 2019. We                  products with improved stretch characteristics.
are constantly improving our problem-solving skills, product quality
and delivery reliability based on customer feedback. In 2020, we                In Brazil, we received several awards in 2020. BASF’s Coatings
also started the global rollout of Salesforce, a new, integrated IT-based       division markets a broad portfolio of decorative paints under the
customer relationship management system. The user-friendly                      Suvinil brand. The national association of construction material
application helps sales employees deliver even better customer                  traders (Associação Nacional dos Comerciantes de Material de
support and simplifies their work.                                              Construção) elected Suvinil as the best company in the category of
                                                                                coatings for walls, ceilings, and facades, in the category of large
                                                                                customers. The award was based on a survey of more than 1,600
  Innovations and tailored                                                      traders conducted by the industry association. Suvinil was also
  solutions                                                                     acknowledged as the most remembered paint brand in the country,
  in close partnership with our customers                                       according to the Folha de S. Paulo newspaper’s Top of Mind Award,
                                                                                one of the most acknowledged awards in the marketing universe.
                                                                                Winning in the Top Wall Paint category for the 18th consecutive time
Above and beyond this, we want to intensify cooperation with our                and adding its 20th achievement in the award overall. These
customers and leverage growth potential together with them. For                 achievements also earned it the award in the Top Performance
instance, we have created interdisciplinary teams in our business               category, which had already been won in 2013 and now reaffirms
units to better and more quickly address the needs of our most                  the brand as the highlight and the only one acknowledged on this
important customers. Cooperation and innovation are also the                    front in the 2020 edition.
focus at our Creation Centers in Ludwigshafen, Germany; Mumbai,
India; Shanghai, China; and Yokohama, Japan. These creative                     Quality management
centers bring together our comprehensive materials, design, and
digital development expertise in high-performance plastics using                Our customers’ satisfaction is the basis for our success, which is
the latest visualization and collaboration technologies. This enables           why quality management is of vital significance for BASF. We strive
us to transform our customers’ ideas into tailored products and                 to continually improve processes and products. This is also reflected
applications even more quickly – everything in one place, from                  in our Global Quality Policy. The majority of our production sites and
initial inspiration to solution.                                                business units are certified according to ISO 9001. In addition, we
                                                                                also meet industry and customer-specific quality requirements such
Customer awards                                                                 as IATF 16949 certification for the automotive industry.

We again received awards from a number of satisfied customers in
2020. In North America, for example, BASF was recognized by
General Motors (GM) in June as a 2019 Supplier of the Year for the
fifteenth time since 2002. The award is presented to suppliers who
exceed GM’s expectations around quality, execution, innovation and
total enterprise cost. GM also honored us with the Overdrive Award
for our sustainable construction solutions. BASF products help GM
to meet key sustainability targets – such as a smaller carbon footprint
and water and energy savings – at two of its plants.

In Europe, the global surface treatments business in our Coatings
division, which operates under the Chemetall brand, received the
Airbus Supply Chain & Quality Improvement award in February
2020 for the sixth time. It acknowledges Chemetall’s performance,
strong continuous improvement and customer-oriented approach
in line with Airbus’ targets and expectations.

In Asia Pacific, we received an award from Godrej Interio, India’s
leading home and commercial furniture brand, in the category Best
Overall Performance in July. BASF has supplied Godrej with
Elastoflex and Ultramid products since 2008. The award particularly
recognizes delivery reliability and innovation. In September, this
was followed by the CIIF New Materials Award, presented by the
organizers of the China International Industry Fair in Shanghai. The
award recognizes BASF for its modification of the intermediate

10                                                          BASF in South America 2020 Report
The BASF Group

Our strategic action areas
                                                                                  Action areas sharpen customer focus
We have defined six strategic action areas through which we will
sharpen our customer focus and achieve our goals.
                                                                                                                                     I nno
                                                                                                                                             vat
                                                                                                                                                     ion
Innovation                                                                                                                  Operat ions
                                                                                                            ty
Innovation is the bedrock of our success. BASF is an innovation                                       ili
                                                                                                                                   Dig

                                                                                                  b
                                                                                                                                       ita

                                                                                               na
leader in the chemical industry, with around 10,000 employees in                                                                           li   za

                                                                                              tai
                                                                                                                          lio
research and development and R&D spending of around                                                                    tfo

                                                                                          Su s
                                                                                                                                Peop
                                                                                                                     or

                                                                                                                                                 t io
                                                                                                                                    le

                                                                                                                                                     n
€2.1 billion. We continue to build on these strengths by bringing

                                                                                                                 P
research and development closer together and making our
                                                                                                                        Our
customers’ demands a greater part of our innovation process. We                                                      Customers
involve them at an earlier stage and are expanding our partnerships
with customers and external partners.

Sustainability
A key driver is sustainability. We want to create value for the
environment, society and business with our products, solutions
and technologies. Therefore, we are increasing the relevance of
sustainability in our steering processes and business models.
This establishes us as a key partner supporting our customers,
opens up new growth areas and secures the long-term success
of our company.                                                               Portfolio
                                                                              With our acquisitions and divestitures, we have oriented our
Operations                                                                    portfolio toward innovation-driven growth areas. The acquisition of
Our core business is the production and processing of chemicals.              the integrated polyamide business from Solvay and the purchase
The Verbund offers us many technological, market, production-                 of various businesses from Bayer further strengthened our position
related and digital advantages. Our comprehensive product portfolio,          in engineering plastics and in the agricultural sector. The Asian
which ranges from basic chemicals to custom system solutions,                 market will play a key role in our future growth. Our strong innovation,
enables us to meet the increasingly diverse needs of our customers            production and sales base in China enables us to respond to the
with a differentiated offering.                                               needs of our customers in a differentiated way. To further strengthen
                                                                              our position in this dynamic growth market, we plan to build an
Digitalization                                                                integrated Verbund site in Zhanjiang.
Digitalization is an integral part of our business. We want to
significantly improve the availability and quality of our process data.       Employees
To achieve this, we will digitalize processes at more than 420 plants         Our employees are key to BASF’s success. That is why we believe
worldwide by 2022. We will systematically analyze this data to                that it is important to have a working environment that fosters
further automate processes and in this way, increase efficiency.              employees’ individual talents and enables them and their teams to
Combining internal and external data provides many new opportunities          perform at their best. We are giving our employees more individual
to manage our businesses more efficiently, improve processes and              freedom. At the same time, we encourage and promote a
create value added for our customers.                                         leadership culture that empowers our employees to respond to
                                                                              customer needs quickly and efficiently with a solution orientation.

   Corporate values
   guide our conduct and actions

   Creative: We make great products and solutions for our                   Responsible: We value the health and safety of people above all
   customers. This is why we embrace bold ideas and give them               else. We make sustainability part of every decision. We are
   space to grow. We act with optimism and inspire one another.             committed to strict compliance and environmental standards.

   Open: We value diversity, in people, opinions and experience.            Entrepreneurial: We focus on our customers, as individuals and
   This is why we foster feedback based on honesty, respect and             as a company. We seize opportunities and think ahead. We take
   mutual trust. We learn from setbacks.                                    ownership and embrace personal accountability.

                                                          BASF in South America 2020 Report                                                                11
The BASF Group
Our targets BASF is setting itself even more ambitious goals on its journey to
climate neutrality and wants to achieve net zero emissions by 2050.
Business success tomorrow means creating value for the environment, In addition, we want to reduce greenhouse gas emissions globally
society and business. That is why we have set ourselves ambitious by 25% by 2030 compared to 2018. We also strive to strengthen
global targets along our entire value chain and the three dimensions sustainability in our supply chains and use natural resources
of sustainability. We report transparently on our target achievement responsibly. We want to further improve safety in production. In
so that our stakeholders can track our progress. addition, we aim to promote diversity within the company and
create a working environment in which our employees can thrive
We want to grow faster than the market, further increase our and perform at their best.
profitability, achieve a return on capital employed (ROCE) considerably
above the cost of capital percentage and increase the dividend per The objective of these targets is to steer our business into a sustainable
share every year based on a strong free cash flow. In addition to future, and at the same time, contribute to the implementation of the
these financial targets, we pursue broad sustainability targets. United Nations’ Sustainable Development Goals (SDGs).
2020 Target Achievement Status
Profitable growth SDG1 Target 2020 status Responsible procurement SDG1 Target 2020 status
Achieve a return on capital employed Cover 90% of our relevant spending with
(ROCE) considerably above the cost of sustainability evaluations by 2025 90% 80%
capital percentage every year
>9% 1.7% Have 80% of our suppliers improve
their sustainability performance
upon re-evaluation
80% 68%
Grow sales volume faster than global
chemical production every year
> –0.4% –0.5% Resource efficiency and safety Target 2020 status
Reduce worldwide process safety
incidents per 200,000 working hours to
≤0.1 by 2025
Increase EBITDA before special items ≤0.1 0.3
by 3%–5% per year
3%–5% –10.7%
Reduce worldwide Lost Time Injury rate
Increase the dividend per share every year per 200,000 working hours to ≤0.1 by 2025
based on a strong free cash flow
≤0.1 0.3
>€3.30 €3.30
Introduce sustainable water management
Climate protection2 Target 2020 status at our production sites in water stress
areas and at our Verbund sites by 2030
25% reduction in CO2 100% 46.2%
from 2018 to 2030 (Scope 1 and 2) ≤16.4 20.8
MMT MMT
Employee engagement and
Sustainable product portfolio Target 2020 status diversity Target 2020 status
Achieve €22 billion in Accelerator sales Increase the proportion of women in
by 2025 €22.0 €16.7 leadership positions with disciplinary
responsibility to 30% by 2030
billion billion 30% 24.3%
Most important key performance indicators
More than 80% of our employees
feel that at BASF, they can thrive and
perform at their best
1 For more information on the Sustainable Development Goals (SDGs), see sustainabledevelopment.un.org
2 New target as of March 2021
>80% 82%
12 BASF in South America 2020 ReportBASF nas regiões BASF nas regiões
Europe
BASF in the regions
BASF Group sales 2020: €59,149 million
EBIT 2020: –€191 million
24,223
Sales1 (in million €)
–1,005
EBIT (in million €)
68,849 Asia Pacific
Employees 2
Antwerpen
North America
Florham Ludwigshafen
Park
Geismar
Nanjing 14,895
Sales1 (in million €)
Hongkong
16,440 Freeport
Zhanjiang
768
Sales1 (in million €) EBIT (in million €)
–201 Kuantan 17,753
EBIT (in million €) Employees2
Regionale Zentren
16,948
Ausgewählte Standorte
Employees 2
Verbundsstandorte
South America, São Paulo
Ausgewählte Forschungs-
Africa, Middle East
und Entwicklungsstandorte
3,591
Sales1 (in million €)
247
Regional centers
Selected sites
Verbund sites
EBIT (in million €)
Planned verbund sites
6,752
Selected research and development sites
Employees2
1 In 2020, by location of company
2 At year-end 2020
13 BASF in South America 2020 Report BASF in South America 2020 Report 14BASF
BASFononthe
theCapital
CapitalMarket
Market BASF on the Capital Market
BASF
BASF on
BASFon the
onthe
the Long-term
Long-termperformance
performanceofofBASF
BASFshares
sharescompared
comparedwith
withindexes
indexes
Capital Market
Average
Averageannual
annualincrease
increasewith
withdividends
dividendsreinvested
Capital
CapitalMarket
reinvested
Market 2015–2020
2015–2020 2.8%
2.8%
5.0%
5.0%
InInIn2020,
2020,
2020, the
the the stock
stock
stock markets
markets
markets were
were
were dominated
dominated
dominated by
by by the
the the spread
spreadofof
spread 4.3%
4.3%
ofthethecoronavirus
the coronavirusand
coronavirus andthe the resulting
theresulting
resulting social
social
socialand and economic
economic
and economic
10.3%
10.3%
effects.
effects.
effects. Despite
Despite
Despite thethe exceptionally
exceptionally
the exceptionally high high economic
economic
high economic burden
burden burden
caused by the coronavirus 2010–2020
2010–2020 4.9%
4.9%
caused
caused by bythethe coronavirus
coronaviruspandemic, pandemic,aadividend dividendof of€3.30
of €3.30per
€3.30 per
share
per share
share isistotobe
has be proposed
been granted,
proposed tototheasAnnual
the in Shareholders’
the previous
Annual Meeting,
year. Based
Shareholders’ Meeting, 7.1%
7.1%
onasasininthe
the theprevious
year-endprevious share year.price
year. Based ononthe
for 2020,
Based the year-end
BASF shares
year-end share price
continue
share pricefor for 5.4%
5.4%
to2020,
offerBASF
2020, an
BASF shares
sharescontinue
attractive dividend
continueyield totooffer ananattractive
of around
offer 5.1%. dividend
attractive dividend 9.0%
9.0%
yield
yieldofofaround
around5.1%. 5.1%. ▪ ▪BASF share ▪ ▪DAX
BASFshare DAX3030 ▪ ▪EURO STOXX5050 ▪ ▪MSCI
EUROSTOXX MSCIWorld
WorldChemicals
Chemicals
BASF share performance
BASF
BASFshare shareperformance
performance
BASF share price declines 3.9% in 2020 Weighting of BASF shares in important indexes as of December 31, 2020
BASF
BASFshare
Assuming that
share price declines
dividends
price declines were3.9% inin2020
reinvested,
3.9% 2020 BASF’s share Weighting
WeightingofofBASF
BASFshares
sharesininimportant
importantindexes
indexesasasofofDecember
December31,
31,2020
2020
Assuming
Assumingthat
performance rose
that dividends
by 2.3%were
dividends werereinvested,
reinvested,BASF’s BASF’sshare share DAX 30 5.5%
performance
performancerose roseby by2.3%2.3% DAX
DAX3030STOXX 50
EURO 5.5%
5.5%
2.3%
BASF share closed the 2020 stock market year at €64.72, EURO
EUROSTOXX
MSCI STOXX
World 5050
Chemicals 2.3%
2.3%
6.0%
aTheTheBASF
decreaseBASFof share
3.9%closed
share compared
closed the
the2020
with
2020thestock market
previous
stock market year
year’s atat€64.72,
yearclosing €64.72, MSCI
MSCIWorld
WorldChemicals
Chemicals 6.0%
6.0%
a adecrease
price (€67.35).
decrease ofof3.9%
3.9%compared
After the with
significant
compared withthe previous
downturn
the previousin year’s
share
year’s closing
prices
closing price
price
(€67.35).
caused
(€67.35).byAfter
the the
After thesignificant
pandemicsignificantin thedownturn
first half
downturn ininof
share prices
2020,
share BASF’s
prices causedshare
caused bybythe
the Dividend of €3.30 per share
pandemic
price recovered
pandemic ininthe and
the first half
halfofof2020,
stabilized
first overBASF’s
2020, the second
BASF’s sharehalf
share price
of the
price recovered
year butand
recovered and Proposed
Proposeddividend dividendofof€3.30 €3.30per pershare
share
stabilized
remained
stabilized over
overthe
slightly second
below
the half
halfofofthe
the prior-year
second yearyearbut
theclosing remained
remainedslightly
price.
but slightlybe-be- As in the previous year, a dividend of €3.30 per share has been
low
lowthetheprior-year
prior-yearclosing closingprice.price. AsAsininthe
granted, previous
theresulting
previous inyear,
ayear, a adividend
payment of €3.0ofbillion
dividend of€3.30 per
pershare
shareisisto
to shareholders.
€3.30 tobe
Due be
Assuming that dividends were reinvested, BASF’s share proposed
to
proposed totothe
the exceptionally theAnnual high
Annual Shareholders’
economic burden
Shareholders’ Meeting,
Meeting, a apayment
caused by theofof
payment
Assuming
Assumingthat
performance rosedividends
that by 2.3% inwere
dividends 2020.
were reinvested,
The DAX 30,
reinvested, BASF’s share
shareperfor-
the benchmark
BASF’s perfor- €3.0
€3.0billion
billiontotopandemic,
coronavirus shareholders.
shareholders. Due
whichDue totothe
also exceptionally
impacted
the high
the BASF
exceptionally higheconomic
Group’s
economic
mance
index
manceof rose
the
rose byby2.3%
German 2.3% inin2020.
stock The
market,
2020. TheDAXDAX30,
rose by the
thebenchmark
30,3.5% over the same
benchmark index
indexofof burden
free
burden cashcaused
flow, by
caused bythe
the thecoronavirus
dividend per share
coronavirus pandemic,
has notwhich
pandemic, been also
alsoimpacted
whichincreased for
impacted
the
theGerman
period, while stock
German the
stock market,
market,rose
European EURO
rose byby3.5%
3.5%over
STOXX 50the
over same
index
the same period,
period,while
decreased while the
theBASF
first
BASF Group’s
time sincefree
Group’s freecash
the cashflow,
2009 flow,the
businesstheproposed
proposeddividend
year. dividendper pershare
share
the
theEuropean
3.2%. The global
European EUROindustry
EURO STOXX index
STOXX 50 index
MSCI
50 index lost
Worldlost3.2%.
3.2%.The
Chemicals Theglobal industry
increased
global industry will
willnot
notbe beincreased
increasedfor forthe
thefirst
firsttime
timesince
sincethethe2009
2009business
businessyear.
year.
index
indexMSCI
14.8%. The
MSCI World
WorldChemicals
assets ofChemicals
an investor gainedwho14.8%.
gained invested
14.8%. The
The assets
€1,000
assetsin ofofBASF
ananinves-
inves- Based on the year-end share price for 2020, BASF shares offer a
tor
torwho
shares who invested
at the end of€1,000
invested 2010
€1,000 ininBASF
and BASFshares
reinvestedsharestheatdividends
atthe
theendendof 2010
2010and
inofadditionalandre-re- Based
high
Based on onthe
dividend theyear-end
yield share
shareprice
of around
year-end pricefor
5.1%. 2020,
BASF
for is BASF
2020, part
BASF ofshares offer
offera a
the DivDAX
shares
invested
BASF shares
invested the
the dividends
would have in
dividends inadditional
increased
additional BASF
BASFshares
to €1,614 by the end
shares would have
havein-
of 2020.
would in- high
highdividend
share index, yield
dividend yieldofofcontains
which around
around5.1%.the 15
5.1%. BASF isispart
companies
BASF partofofwith
the
theDivDAX
the share
highest
DivDAX share
creased
This toto€1,614
represents
creased bybythe
an annual
€1,614 the end
yield
endof ofof
2020.
2020.This
4.9%. Thisrepresents
representsan anannual
annual index,
index,which
dividend yield
which contains
in the DAX
contains the 15
the30.15companies
companieswith withthe
thehighest
highestdividend
dividend
yield
yieldofof4.9%.
4.9%. yield
yieldininthetheDAX DAX30. 30.
Change
Changeininvalue
valueofofan
aninvestment
investmentininBASF
BASFshares
sharesinin2020
2020
With
Withdividends
dividendsreinvested;
reinvested;indexed
indexed
120
120 120
120
110
110 110
110
100
100 100
100
9090 9090
8080 8080
7070 7070
6060 6060
Jan
Jan Feb
Feb Mar
Mar Apr
Apr May
May Jun
Jun Jul
Jul Aug
Aug Sep
Sep Oct
Oct Nov
Nov Dec
Dec
BASF
BASFshare
share2.3%
2.3% DAX
DAX30303.5%
3.5% EURO
EUROSTOXX
STOXX5050 –3.2%
–3.2% MSCI
MSCIWorld
WorldChemicals
Chemicals14.8%
14.8%
14
14 BASF
BASF
BASFin [ Your
InIn
South Country
[ Your
America ]2020
Country ] Report 2020
Report
Report 2020 15You can also read