From Hand-Crafted to Deep Learning-based Cancer Radiomics: Challenges and Opportunities - arXiv
←
→
Page content transcription
If your browser does not render page correctly, please read the page content below
From Hand-Crafted to Deep Learning-based Cancer
                                             Radiomics: Challenges and Opportunities
                                                Parnian Afshar†, Student Member, IEEE, Arash Mohammadi†, Senior Member, IEEE, Konstantinos N.
                                                       Plataniotis‡, Fellow, IEEE, Anastasia Oikonomou∗ , and Habib Benali>, Member, IEEE
                                            †Concordia Institute for Information Systems Engineering (CIISE), Concordia University, Montreal, Canada
                                                     ‡ Department of Electrical and Computer Engineering, University of Toronto, Toronto, Canada
                                          ∗ Department      of Medical Imaging, Sunnybrook Health Sciences Centre, University of Toronto, Toronto, Canada
                                         >PERFORM Centre, Electrical and Computer Engineering Department, Concordia University, Montreal, Canada
arXiv:1808.07954v3 [cs.CV] 20 Feb 2019

                                            Abstract—Recent advancements in signal processing and ma-                images, however, highly depends on the experience of the
                                         chine learning coupled with developments of electronic medical              radiologist and due to the increasing number of images per
                                         record keeping in hospitals and the availability of extensive               study can be time-consuming.
                                         set of medical images through internal/external communication
                                         systems, have resulted in a recent surge of significant interest               Referred to as “Radiomics” [1]–[4], the ability to process
                                         in “Radiomics”. Radiomics is an emerging and relatively new                 such large amounts of data promises to decipher the encoded
                                         research field, which refers to extracting semi-quantitative and/or         information within medical images; Develop predictive and
                                         quantitative features from medical images with the goal of                  prognostic models to design personalized diagnosis; Allow
                                         developing predictive and/or prognostic models, and is expected             comprehensive study of tumor phenotype [5], and; Assess
                                         to become a critical component for integration of image-derived
                                         information for personalized treatment in the near future.                  tissue heterogeneity for diagnosis of different type of cancers.
                                         The conventional Radiomics workflow is typically based on                   More specifically, Radiomics refers to the process of extract-
                                         extracting pre-designed features (also referred to as hand-crafted          ing and analyzing several semi-quantitative (e.g., attenuation,
                                         or engineered features) from a segmented region of interest.                shape, size, and location) and/or quantitative features (e.g.,
                                         Nevertheless, recent advancements in deep learning have caused              wavelet decomposition, histogram, and gray-level intensity)
                                         trends towards deep learning-based Radiomics (also referred to
                                         as discovery Radiomics). Considering the advantages of these two            from medical images with the ultimate goal of obtaining
                                         approaches, there are also hybrid solutions developed to exploit            predictive or prognostic models.
                                         the potentials of multiple data sources. Considering the variety               Although several challenges are in the way of bringing
                                         of approaches to Radiomics, further improvements require a                  Radiomics into daily clinical practice, it is expected that
                                         comprehensive and integrated sketch, which is the goal of this              Radiomics become a critical component for integration of
                                         article. This manuscript provides a unique interdisciplinary
                                         perspective on Radiomics by discussing state-of-the-art signal              image-driven information for personalized treatment in the
                                         processing solutions in the context of Radiomics.                           near future.
                                                                                                                        It is worth mentioning that computer aided diagnosis (CAD)
                                           Index Terms: Radiomics, Deep Learning, Hand-Crafted                       is not a new concept, and researchers have developed auto-
                                         Features, Medical Imaging.                                                  matic systems to investigate the link between imaging-based
                                                                                                                     features and biological characteristics in the past. However,
                                                                  I. I NTRODUCTION                                   this field is formalized as “Radiomics”, since 2010 [6], and it
                                            The volume, variety, and velocity of medical imaging data                has a few key differences with the traditional CAD systems.
                                         generated for medical diagnosis are exploding. Generally                    First of all, CAD systems incorporate much fewer number
                                         speaking, medical diagnosis refers to determining the source                of features (typically, within 8 to 20 features), whereas in
                                         and etiology of a medical condition. Diagnosis is typically                 Radiomics, hundreds to thousands of features are extracted.
                                         reached by means of several medical tests, among them biopsy                Second, the application of the CAD systems is, typically,
                                         and diagnostic imaging, in case of suspected cancer. Although               limited to the diagnosis of the diseases, such as distinguishing
                                         biopsy can be very informative, it is invasive and by being                 between benign and malignant masses. Nevertheless, Ra-
                                         focal, may not represent the heterogeneity of the entire tumor,             diomics is a much broader field, including both predictive and
                                         which is crucial in cancer prognosis and treatment. In contrast             prognostic applications [7]. The first comprehensive clinical
                                         to biopsy, diagnostic imaging is not invasive and can provide               application of Radiomics was performed by Aerts et al. [5]
                                         information on tumor’s overall shape, growth over time, and                 with involvement of 1019 lung cancer patients. More than
                                         heterogeneity, making it an attractive and favored alternative              400 different intensity, shape, texture, and wavelet features
                                         to biopsy. Interpretation of such a large amount of diagnostic              were extracted from Computed Tomography (CT) images and
                                                                                                                     used together with clinical information and gene expression
                                            This work was partially supported by the Fonds de Recherche du Québec
                                         Nature et Technologies (FRQNT) Grant 206591 EQ. Corresponding Author        data to develop Radiomics heat map, which shows the associ-
                                         is Arash Mohammadi, email: arash.mohammadi@concordia.ca                     ation between Radiomics and different clinical outcomes such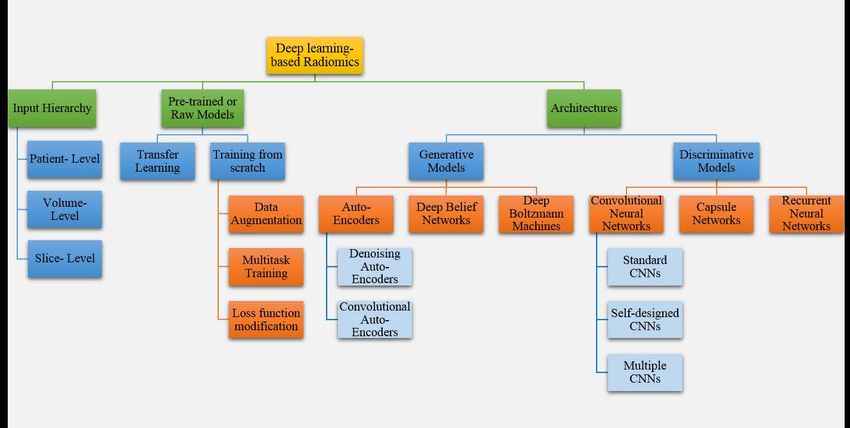
2

                                                                       Radiomics consists of a wide range of (partially intercon-
                                                                       nected) research areas with each individual branch possibly
                                                                       worth a complete exploration, the purpose of this article is
                                                                       to provide an inclusive introduction to Radiomics for the
                                                                       signal processing community, as such, we will focus on the
                                                                       progression of signal processing algorithms within the context
                                                                       of Radiomics. In brief, we aim to present an overview of the
                                                                       current state, opportunities, and challenges of Radiomics from
                                                                       signal processing perspective to facilitate further advancement
                                                                       and innovation in this critical multidisciplinary research area.
                                                                       As such, the article will cover the following four main areas:
                                                                         (i) Hand-crafted Radiomics, where we introduce and in-
Fig. 1: Increasing interest in Radiomics based on data from Google           vestigate different feature extraction, feature reduction,
Scholar (“Radiomics” is used as the keyword). It is observed that
                                                                             and classification approaches used within the context
there is an increasing interest in both types of the Radiomics.
                                                                             of Radiomics. Most of the techniques utilized in any
as cancer stage. This clinical study has illustrated/validated               of the aforementioned steps lie within the broad area
effectiveness of Radiomics for tumor related predictions and                 of “Machine Learning,” where the goal is to improve
showed that Radiomics has the capability to identify lung                    the performance of different computational models using
and head-and-neck cancers from a single-time point CT scan.                  past experiences (data) [17]. In other words, the underly-
Consequently, there has been a recent surge of interest [8]–                 ing models are capable of learning from past data, lead-
[12] on this multidisciplinary research area as Radiomics has                ing to the automatic process of prediction and diagno-
the potential to provide significant assistance for assessing                sis. Furthermore, since hundreds of Radiomics features
the risk of recurrence of cancer [13]; Evaluating the risk                   are extracted, an appropriate feature selection/extraction
of radiation-induced side-effects on non-cancer tissues [14],                strategy should be adopted to reduce the “curse of
and; Predicting the risk for cancer development in healthy                   dimensionality” and overfitting of the prediction models.
subjects [14]. In a very recent article by Vallieres et al. [16], it         Most of these strategies, themselves, lie within the field
is shown that the Radiomics features extracted in Reference [5]              of “Machine Learning”, as they are aimed to learn the
have a noticeable dependency on the tumor volume, which                      best set of features, based on the available data.
is a strong prognostic factor, and revised calculations are             (ii) Deep learning-based Radiomics, where we provide an
proposed that are less correlated to the tumor volume. In other              overview of different deep architectures used in Ra-
words, more powerful Radiomics features and procedures are                   diomics along with interpretability requirements.
being introduced, illustrating the ongoing research potentials         (iii) Hybrid solutions developed to simultaneously benefit
of Radiomics.                                                                from the advantages of each of the above two mentioned
   The key underlying hypothesis in the Radiomics is that                    categories.
the constructed descriptive models (based on medical imaging           (iv) Challenges, Open Problems, and Opportunities, where
data, sometimes complemented by biological and/or medical                    we focus on the limitations of processing techniques
data) are capable of providing relevant and beneficial predic-               unique in nature to the Radiomics, and introduce open
tive, prognostic, and/or diagnostic information. In this regard,             problems and potential opportunities for signal process-
one can identify two main categories of Radiomics. Con-                      ing researchers.
ventional pipeline based on Hand-Crafted Radiomic features             Fig. 1 shows the increasing interest in Radiomics within the
(HCR) that consists of the following four main processing              research community. Although there have been few recent arti-
tasks: (i) Image acquisition/reconstruction; (ii) Image segmen-        cles [3], [18] reviewing and introducing Radiomics, to the best
tation; (iii) Feature extraction and quantification, and; (iv)         of our knowledge, most of them are from outside the signal
Statistical analysis and model building. On the other hand, the        processing (SP) community. References within the SP society
Deep Learning-based Radiomics (DLR) pipeline has recently              such as the work by J. Edwards [19] have investigated recent
emerged which differs from the former category since deep              advancements in medical imaging devices and technologies
networks do not necessarily need the segmented Region Of               without reviewing the role of Radiomics in medical applica-
Interest (ROI), and their feature extraction and analysis parts        tions. Other existing papers outside SP community (e.g., [3])
are partially or fully coupled. We will elaborate on these             have failed to clearly describe the underlying signal processing
properties in section IV.                                              technologies and have narrowed down their scope only to
   More clinical studies are being approved and conducted              hand-crafted Radiomics and its diagnosis capability. While
to further investigate and advance the unparalleled oppor-             Reference [18] has briefly touched upon the deep learning
tunities the Radiomics posed to offer for clinical applica-            pipeline as an emerging technology that can extract Radiomics
tions. Information Post I provides an overview of different            features, it has not studied applicability of different deep
screening technologies used within the Radiomics pipeline              architectures [20] and left the interpretability topic untouched.
along with supporting data sources and available datasets to           Furthermore, Reference [21] has mostly focused on the hand-
develop Radiomics-based predictive/prognostic models. While            crafted Radiomics, while deep learning-based Radiomics is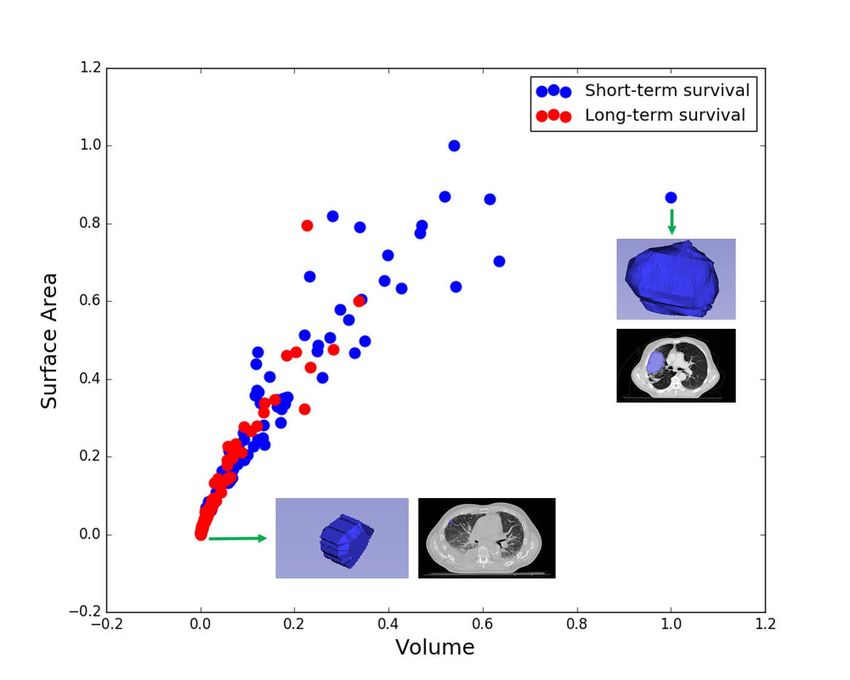
3
explained briefly without addressing different architectures, especially since SP is one of the main building blocks of the
interpretability, and hybrid models. Although both types of Radiomics.
Radiomics are covered in Reference [22], combination of The reminder of this article is organized as follows: first in
hand-crafted and deep learning-based features are not con- Section II, we will discuss several applications of Radiomics
sidered. Besides, challenges associated with Radiomics and in cancer-related fields, followed by Hand-Crafted solutions in
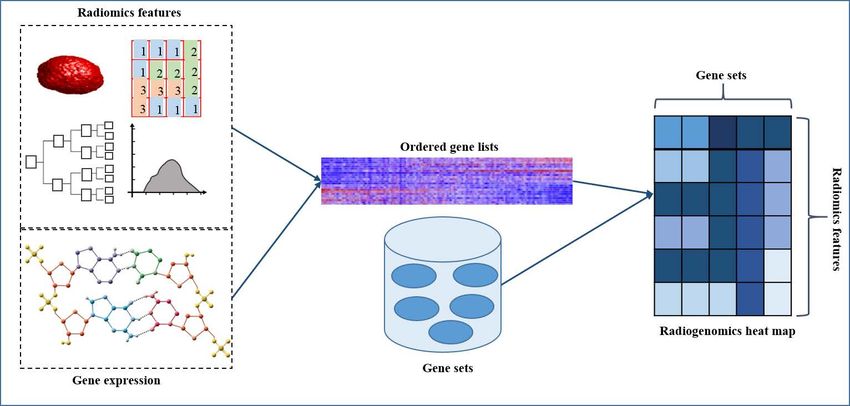
the relation between Radiomics and gene-expression (Radio- Section III. The Deep learning-based Radiomics is presented
genomics) are also not discussed thoroughly. Finally, the scope in Section IV, where several aspects of DLR is investigated. In
of Reference [23] is limited to deep learning-based Radiomics, Section V, we explain different hybrid solutions to Radiomics,
without addressing hand-crafted features, their stability, hybrid which aim to take advantage of both DLR and HCR. Finally in
Radiomics, and Radiogenomics. All these call for an urgent Section VI various challenges and opportunities of Radiomics,
and timely quest to introduce Radiomics to our community especially for SP community, are discussed. We conclude our
work is Section VII.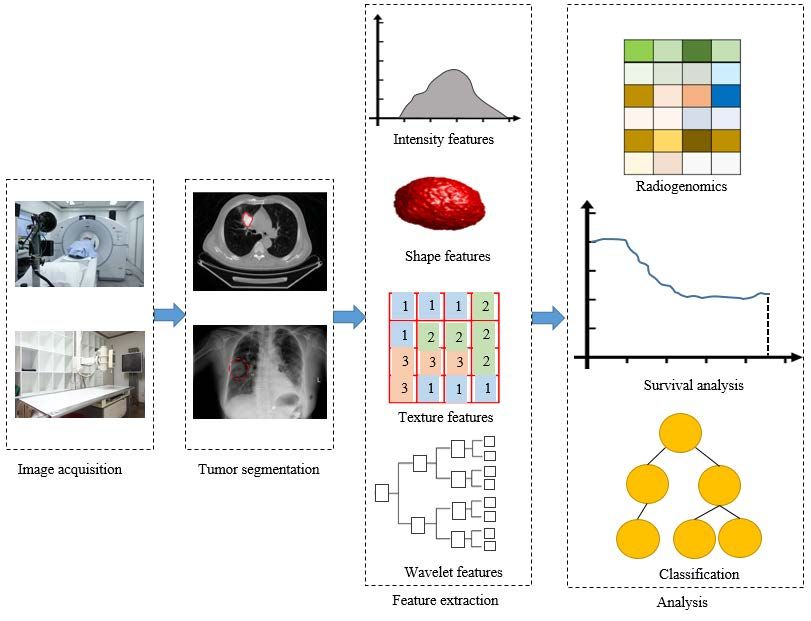
4

    Information Post I: Radiomics Supporting Resources

    Several potential medical resources provide information to the          •   Magnetic Resonance Imaging (MRI): Unlike CT, proper-
    Radiomics pipeline, some of which are directly used to extract              ties of MRI images are not directly associated with tissue
    Radiomics features and some serve the decision making process,              density and specific methods are required to obtain the so-
    as complementary information sets. Below we review the most                 called signal intensity. Besides, several imager and vendor-
    important data resources for Radiomics.                                     dependant factors such as gradient and coil systems [26],
                                                                                pulse sequence design, slice thickness, and other parameters
    Screening Technologies: The Radiomics features can be ex-                   such as artifacts and magnetic field strength affect the prop-
    tracted from several imaging modalities, among which the fol-               erties of the MRI images [2], which should be consistent
    lowing are the most commonly used modalities:                               across different institutions.
       • Computed Tomography (CT) Scans: The CT is the modal-
          ity of choice for the diagnosis of many diseases in dif-
          ferent parts of the body, and by providing high resolution
          images [1] paves the path for extracting comparable Ra-
          diomics features. Nonetheless, the CT imaging performance
          depends on different components of the utilized protocol
          including the following three main properties: (i) Slice
          thickness, which is the distance in millimeter (mm) between
          two consecutive slices; (ii) The capability for projecting
          the density variations into image intensities, and; (iii) Re-
          construction algorithm, which aims at converting tomo-
                                                                          Complimentary Data Sources: In addition to imaging resources,
          graphic measurements to cross-sectional images. Although
                                                                          the following clinical data sources are typically combined with
          CT protocols for specific clinical indications are usually
                                                                          Radiomics features:
          similar across different institutions, Radiomics features can
          even differ between different scanners with the same set-         •   Gene expression: The process of converting DNA to func-
          tings [24]. Therefore, there is still a considerable need to          tional product to have a global insight of cellular function.
          ensure consistency of Radiomics feature extraction amongst        •   Clinical characteristics: Patient’s characteristics such age,
          different scanners and imaging protocols [2]. CT images               gender, and past medical and family history [2].
          are typically divided into two categories [25]: screening         •   Blood Bio-markers: Measurable characteristics from the
          and diagnostic. While screening CT uses low dose images,              patient’s blood such as glucose level, cholesterol level and
          diagnostic CT utilizes high dose and is of higher quality             blood pressure.
          and contrast.                                                     •   Prognostic Markers: Markers to evaluate the progress of
       • Positron Emission Tomography (PET) Scans: The PET is                   the disease, response to treatment or survival, such as size,
          a nuclear imaging modality that evaluates body function and           tumor stage, tumor recurrence, and metastasis.
          metabolism [1], and since its performance depends on not
          only the scanner properties, but also the doze calibration,     Radiomics Image Databases: Large amount of data is typically
          similar to the case with the CT scans, standardizing the        required to get reliable results about tissue heterogeneity based on
          PET protocols across different institutions is challenging.     Radiomics [2]. Table I below introduces a few publicly available
          Furthermore, glucose level at the time of scanning can also     imaging data source that can be used to develop and test new
          affect the properties of PET images [2].                        Radiomics approaches:

                                        TABLE I: Popular data sets for performing Radiomics.
               Data Set             Reference    Year    Imaging Modality        Type of the Tumor      Number of Patients     Annotation Type
           LIDC-IDRI                    [27]     2015           CT                  Lung Tumor                 1010            Multiple experts
        NSCLC-Radiomics                  [5]     2014           CT                  Lung Tumor                 422              One expert
     NSCLC-Radiomics-Genomics            [5]     2014           CT                   Lung tumor                 89                    -
        LGG-1p19qDeletion               [28]     2017          MRI                  Brain Tumor                159              One expert
        Head-Neck-PET-CT                [29]     2017         PET, CT           Head-and-Neck Cancer           298                    -
           BRATS2015                    [30]     2015          MRI                  Brain Tumor                 65             Multiple experts

                          II. A PPLICATIONS                               that the automatic diagnosis systems have the potential to
                                                                          achieve a human-level performance and can be utilized as one
   It is undeniable that automatic diagnosis systems are still            of the two experts. Similar to other emerging technologies,
in their infancy, and there is a long way before they can be              automatic diagnosis systems have different advantages and
reliably used in clinical applications. Having said that, several         disadvantages. For instance, these systems have the potential to
recent studies have investigated automatic diagnosis systems              improve the quality of clinical care and decrease the number of
and compared them against human experts. For instance,                    medical errors. These systems, however, are associated with
Esteva et al. [31] have developed a deep CNN for skin cancer              a major concern, i.e., the risk of violating patients’ privacy,
classification, using a dataset of 129, 450 clinical images.              calling for strict regulations to ensure the privacy of the clinical
The performance of this system is tested against 21 board-                information [32].
certificated experts, and results show that the performance of
the system is on a par with human experts. This study suggests              In recent years, Radiomics has been applied to many health-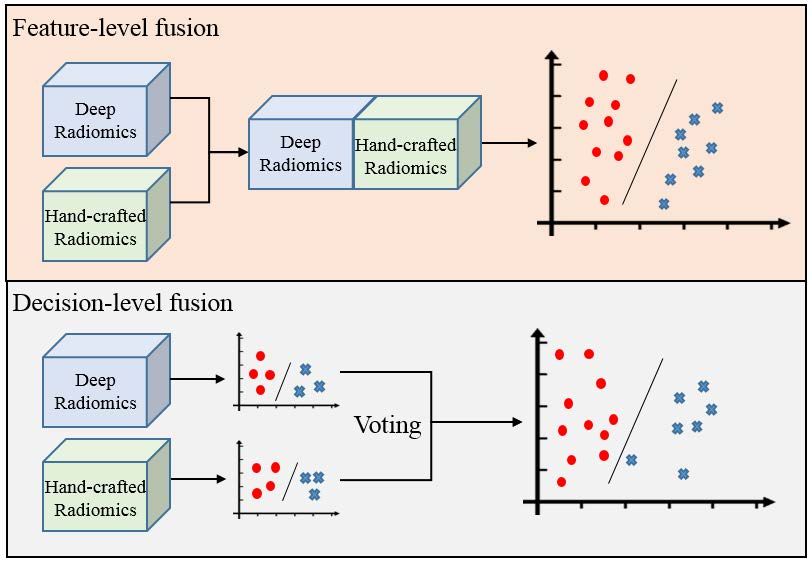
5

                                             TABLE II: Applications of Radiomics.
                     Imaging       Information           Application           Radiomics      Number of      Type of
    Reference        Modality        Sources              Domain                Method         Patients     Annotation
Zhang et al. [8]       CT               -             Prediction of lung      Hand-crafted      112         One expert
                                                      cancer recurrence        Radiomics
                                                      and death.                (HCR)

Aerts et al. [5]        CT       Gene-expression      Lung, and head &           HCR            1019      Multiple experts
                                 and Clinical data.   neck cancer sur-
                                                      vival prediction.

Griethuysen et al.      CT               -            Lung cancer be-            HCR            302       Multiple experts
[9]                                                   nign and malig-
                                                      nant classification.

Oikonomou et al.      CT, PET     Standardized        Lung cancer sur-           HCR            150         One expert
[4]                               uptake value        vival prediction.
                                 (ratio of image
                                     and body
                                   radioactivity
                                  concentration).

Kumar et al. [64]       CT               -            Lung cancer be-             Deep          1010      Multiple experts
                                                      nign and malig-        Learning-based
                                                      nant classification.     Radiomics
                                                                                 (DLR)

Kumar et al. [41]       CT               -            Lung cancer be-            DLR             97       Multiple experts
                                                      nign and malig-
                                                      nant classification.

Huynh et al. [42]    Mammogram           -            Classification of       HCR, DLR,         219       Semi-automatic
                                                      breast cancer: be-     Combination of
                                                      nign or malignant.     HCR and DLR

Li et al. [43]         MRI               -            IDH1      enzyme           DLR            151         Automatic
                                                      mutation
                                                      prediction.

Sun et al. [10]         CT               -            Lung cancer be-         HCR, DLR          1018      Multiple experts
                                                      nign and malig-
                                                      nant classification.

Jamaludin et al.       MRI               -            Disc abnormality           DLR            2009
[44]                                                  classification.

Liu et al. [48]        MRI               -            Prostate cancer         HCR, DLR          341       Not performed
                                                      diagnosis.

Oakden-Rayner           CT               -            Longevity predic-       HCR, DLR           48       Semi-automatic
et al. [45]                                           tion.

Paul et al. [46]        CT               -            Lung        cancer     Combination of      81       Semi-automatic
                                                      short/long-term        HCR and DLR
                                                      survival prediction.

Fu et al. [47]          CT               -            Lung tumor de-         Combination of     1010      Not performed
                                                      tection.               HCR and DLR

Bickelhaupt et al.   Mammogram           -            Classification of          HCR             50         One expert
[68]                                                  breast cancer: be-
                                                      nign or malignant.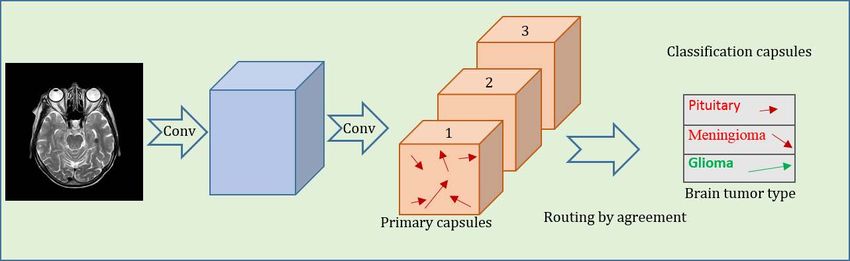
6

                                         TABLE III: Applications of Radiomics (Continued).
                         Imaging           Information          Application         Radiomics         Number of          Type of
     Reference           Modality            Sources              Domain             Method            Patients        Annotation
Lao et al. [49]            MRI             Clinical risk     Brain cancer sur-    Combination of        112           Multiple experts
                                              factors.       vival prediction.    HCR and DLR

Antropova et al.        Mammogram,               -           Breast      cancer   Combination of        2060          Semi-automatic
[52]                   Ultrasound, MRI                       benign         and   HCR and DLR
                                                             malignant
                                                             classification.

Wang et al. [15]          CT, PET          Standardized      Lung        cancer    HCR, DLR              168            One expert
                                           uptake value.     benign         and
                                                             malignant
                                                             classification.

Shen et al. [55]             CT                  -           Prediction     of        DLR               1010          Not performed
                                                             lung        tumor
                                                             malignancy
                                                             likelihood.

Emaminejad        et         CT              Genomics        Lung       cancer        HCR                79           Semi-automatic
al. [65]                                    bio-markers.     recurrence risk
                                                             prediction

Sun et al. [12]              CT                  -           Lung        cancer    HCR, DLR             1018            One expert
                                                             benign         and
                                                             malignant
                                                             classification.

Kim et al. [57]              CT                  -           Lung        cancer   Combination of         20             One expert
                                                             benign         and   HCR and DLR
                                                             malignant
                                                             classification.

Shen et al. [58]             CT                  -           Lung cancer ma-          DLR               1010          Not performed
                                                             lignancy proba-
                                                             bility estimation.

Ciompi et al. [59]           CT                  -           Lung        tumor        DLR               1411          Not performed
                                                             classification
                                                             as solid and
                                                             non-solid.

Afshar et al. [37]          MRI                  -           Brain tumor type         DLR                233            One expert
                                                             classification.

Cha et al. [71]              CT                  -           Bladder cancer           DLR                123            Automatic
                                                             treatment
                                                             response
                                                             prediction.

Yu et al. [70]               CT                  -           Kidney                   HCR                119          Multiple experts
                                                             tumor         type
                                                             classification.

Zhou et al. [69]             CT           Gene expression.   Liver cancer re-         HCR                215            One expert
                                                             currence predic-
                                                             tion.

                                                                       care applications, including oncology, cardiology, and neurol-
                                                                       ogy. In cardiology, for instance, Radiomics is used in different
7

investigations, such as identifying the coronary plaques [33].            likelihood with noninvasive methods such as Radiomics
In neurology, it is widely applicable for detecting Alzheimer’s           is, therefore, of paramount importance.
disease [34] and Parkinson’s disease [35]. However, among all         6) Recurrence prediction: Even the treated cancers have
the applications of the Radiomics, cancer-related topics have             the potential to grow and reappear, which is referred
been the focus of interest. Below we briefly introduce and de-            to as “cancer recurrence”. As the cancerous region
fine different cancer-related applications in which Radiomics             is supposed to be removed or treated, there are not
has been shown to be successful.                                          strong landmarks or evidences helping with predicting
                                                                          the recurrence. However, recently Radiomics is being
  1) Cancer diagnosis, which refers to confirming the pres-               employed to assist with such issue and has shown
     ence or absence of the cancer, is one of the most critical           promising initial results.
     and sensitive decisions that has to be made as early             7) Cancer staging: Cancers may be diagnosed in different
     as possible. However, most of the times cancers are                  stages, e.g., they may be in an early stage meaning that
     diagnosed in late stages reducing the chance of receiving            they are remaining in the tissue they have first appeared
     effective treatment, as there are typically few clinical             in, or they can be in an advanced stage, meaning that
     symptoms in the early stages of cancer. Nevertheless,                they are spread in other tissues. Knowing the stage of the
     Radiomics has the potential to improve the accuracy of               tumor has significant impact on the choice of required
     cancer early diagnosis.                                              treatment.
  2) Tumor detection refers to the identification of those         Based on the above categories, Tables II and III summarize
     lesions that are malignant, which is very important in        different application domains of Radiomics introduced in
     order to guide targeted local treatment. For instance,        various articles, along with their associated Radiomics method
     Radiotherapy, the process of killing cancerous cells          (HCR, DLR, or the combination of both). These tables also
     using ionizing radiation, can have much more efficient        provide information on any complementary data source that
     results if it is focused on the more “aggressive” areas       has been utilized in combination with Radiomics.
     of the tumor (usually the more heterogeneous areas are
     the more aggressive ones. Drug delivery, i.e., having           III. S TATE - OF - THE -A RT IN H AND -C RAFTED R ADIOMICS
     an exact plan to deliver the drug to the target area, is         In clinical oncology, tissue biopsy, which refers to the
     another problem that requires precise information about       removal of a small focal part of the cancerous tissue (tumor), is
     the abnormality location.                                     considered as the state-of-the-art approach for diagnosing can-
  3) Tumor classification and attribute scoring: Tumor clas-       cer. Although tissue biopsy has several diagnostic properties
     sification refers to determining the type of the tumor.       and is widely used for detecting and investigating cancerous
     Typically, cancer is classified into the following main       cells, its reliability is limited by the fact that tumors are
     classes: (i) benign; (ii) primary malignant, and; (iii)       spatially and temporally heterogeneous, and as a result, biopsy
     metastatic malignant. Besides, tumors are associated          cannot capture all the available information that is necessary
     with different attributes such as their border and spheric-   for an inclusive decision. Besides, most of the biopsies are
     ity. Analyzing these attributes contribute to a better        invasive which restricts the number of times this procedure
     understanding of the tumor’s shape and behavior.              can be performed, or sometimes biopsy is not an option due to
  4) Survival prediction: The knowledge of the expected            the high risk for complication that pertains to specific patients.
     survival of a specific disease with or without a specific        Although biopsy remains the gold standard for cancer
     treatment is critical both for treating physicians and the    diagnosis, it can be combined with Radiomics, which is a
     patients. Physicians need to choose the best treatment        non-invasive technique and can capture intra-tumoral hetero-
     plan for their patients and patients need to know their       geneity. The resulting imaging-guided biopsy is a much less
     predicted survival time in order to make their own            interventional procedure associated with fewer complications
     choices for the quality of their life. Radiomics can add      compared to surgical biopsy. In other words Radiomics can
     significant information about patient’s survival based on     be used to facilitate biopsy by detecting more suspicious loca-
     image properties and heterogeneity of the tumor and this      tions [3]. Furthermore, Radiomics can provide complementary
     has attracted a lot of attention recently.                    information for diagnosis, and in case of “negative result
  5) Malignancy prediction: Tumors can be either malignant         of a biopsy” Radiomics prediction models may also provide
     or benign based on several factors such as their abil-        additional information to the clinicians on whether re-biopsy
     ity to spread to other tissues. Benign tumors usually         is needed [78].
     do not spread to other organs but may need surgical              In this section, we focus on the state-of-the-art research
     resection because occasionally they may grow in size.         on hand-crafted Radiomics (HCR). Studies on hand-crafted
     Pre-invasive lesions may be indolent for years, however,      Radiomics features [1], [2], [4], typically, consist of the
     they may transform to aggressive malignant tumors             following key steps:
     and therefore need to be monitored closely or even                1. Pre-processing, introduced to reduce noise and artifacts
     be treated with lower dose of anti-cancer regimens.                  from the original data and typically includes image
     Malignant tumors are life threatening and may spread                 smoothing and image enhancement techniques.
     to distant organs, requiring more complicated treatments          2. Segmentation, which is a critical step within the HCR
     such as Chemotherapy. Prediction of tumor malignancy                 workflow, as typically HCR features are extracted from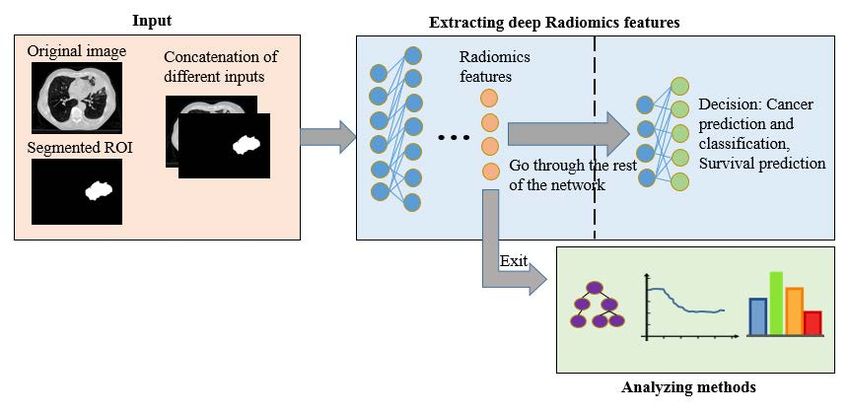
8

   segmented sections and many tissues do not have distinct              techniques are discussed in Sub-section III-B.
   boundaries [3]. Although manual delineation of the gross           5. Statistical analysis, which refers to utilizing the ex-
   tumor is the conventional (standard) clinical approach,               tracted Radiomics features in a specific application
   it is time consuming and extensively sensitive to inter-              as outlined in Section II. We will further elaborate
   observer variability [2], resulting in a quest to develop             on such Radiomics-based statistical analysis in Sub-
   advanced (semi) automated segmentation solutions of                   section III-C.
   high accuracy that can also generate reproducible bound-        In the reminder of this section, we focus on Steps 3-5 in Sub-
   aries.                                                          sections III-A-III-C, respectively, starting by reviewing the
   Automatic and semi-automatic segmentation techniques            key feature extraction methodologies recently used in HCR,
   can be either conventional, meaning that pre-defined            followed by a review of the main feature reduction techniques
   features are used to classify image pixels/voxels as            and Radiomics-based statistical analytics.
   tumorous or non-tumorous, or deep learning-based, re-
   ferring to the use of a deep network to segment the im-
                                                                   A. Radiomics Feature Extraction
   age. Conventional techniques can, themselves, lie within
   three categories of intensity-based [82], model-based,             During the feature extraction step within Radiomics work-
   and machine learning methods. In the former category,           flow, different types of features are extracted that can be
   intensity is used as the main distinguishing feature of         generally classified into three main categories: (1) First order
   the pixels, while in the model-based approaches, the            (intensity-based and shape-based features) [8]; (2) Second
   aim is to improve an initial contour, by optimizing an          order (texture-based features) [8], and; (3) Higher order fea-
   energy function. In machine learning methods, however,          tures [3]. Table IV provides a summary of different potential
   a set of features, including intensity and gradient, are        features. It is worth mentioning that HCR features are not
   extracted from the pixels. These features are then used         limited to this list and can exceed hundreds of features (e.g., in
   as the inputs to a machine learning model, such as a            Reference [5] 400 HCR features are initially extracted before
   Support Vector Machine (SVM), to classify the pixels.           going through a feature reduction process). Below, we further
   Nevertheless, conventional techniques are subject to            investigate the most commonly used categories of hand-crafted
   several shortcomings. For instance, the intensity of the        features:
   tumor can, sometimes, be similar to other tissues, and          1. Intensity-based Features: Intensity-based methods convert
   therefore, intensity can not be a good discriminator.           the multi-dimensional ROI into a single histogram (describing
   Furthermore, the formulation of an energy function, in          the distribution of pixel intensities), from which simple and
   a model-based segmentation, may involve large num-              basic features (e.g., energy, entropy, kurtosis, and skewness)
   ber of parameters [86], which makes optimization of             are derived. Intensity features allow us to investigate properties
   the energy function difficult and time-consuming. Deep          of the histogram of tumor intensities such as sharpness,
   learning methods, on the other hand, are capable of             dispersion, and asymmetry. These features are, however, the
   learning the features that can best distinguish tumor-          most sensitive ones to image acquisition parameters such as
   ous and non-tumorous pixels, and can be trained in              slice thickness [25] (discussed in the Information Post I).
   an end-to-end manner. Deep learning approaches, such            Therefore, designing intensity-based features need special
   as different variations of the U-Net [67], “LungNet”            care and pre-processing. Among all intensity features, en-
   architecture [83], DenseNet [84], and hybrid dilated            tropy and uniformity are the most commonly used ones in
   convolutions (HDC) [85] are currently used more often           Radiomics [62]. Generally speaking, entropy measures the
   for medical image segmentation.                                 degree of randomness within the pixel intensities, and takes
   The most important metric for evaluating a segmentation         its maximum value when all the intensities occur with equal
   method is to calculate its accuracy according to a              probabilities (complete randomness). Uniformity, on the other
   ground truth. However, since ground truth is not always         hand, estimates the consistency of pixel intensities, and takes
   available for medical images, reproducibility metrics are       its maximum value when all the pixels are of the same value.
   often used to assess the performance of the segmentation           Although intensity-based features are simple to calculate
   algorithm [2], [3]. For instance, reference [2] has used        and have the potential to distinguish several tissues such as
   a similarity metric based on the overlap of generated           benign and malignant tumors [62], they suffer from some
   segments resulting in a better average for automatic            drawbacks. First, the selected number of bins can highly
   methods compared with manual delineation.                       influence such features, as too small or too large bins can
3. Feature extraction, which is the main step in Radiomics         not resemble the underlying distribution correctly, and as
   workflow and will be discussed in details in Sub-               such these features are not always reliable representatives.
   section III-A.                                                  Besides, optimizing the number of histogram bins can also
4. Feature reduction, is another critical step in Radiomics        be problematic, because it leads to different number of bins
   as although a large number of quantitative features can         for different ROIs, and makes it difficult to compare the results
   be extracted from the available big image datasets, most        of various studies.
   of the features are highly correlated, irrelevant to the task
   at hand, and/or contribute to over-fitting of the model.        2. Shape-based Features: Shape-based features describe the
   To address these issues, Radiomics feature reduction            geometry of the ROI and are useful in the sense that they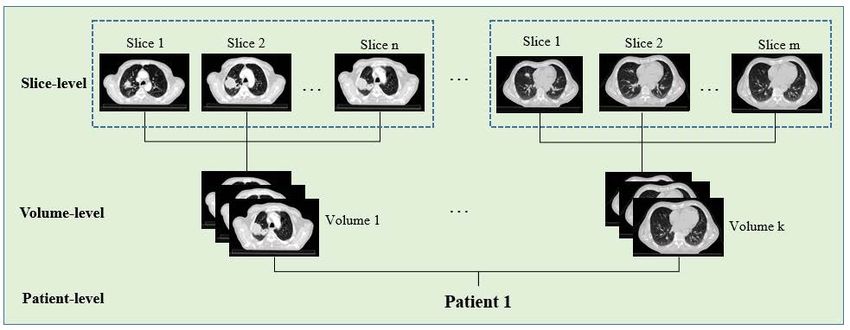
9

              TABLE IV: Different categories of HCR features commonly used within the context of Radiomics.
                  Category                                     Description                                    Sub-category
 First Order Radiomics                       Concerned with the distribution of pixel
                                             intensities and use of elementary metrics to
                                             compute geometrical features.

   • Shape Features                          Quantify the geometric shape of region or       Size of the Region of Interest (ROI);
                                             volume of interest [2]                          Sphericity; Compactness; Total volume;
                                                                                             Surface area, Diameter, flatness and;
                                                                                             Surface-to-volume ratio [2], [25].

   • Intensity Features                      Derived from a single histogram generated       Intensity Mean; Intensity Standard Devi-
                                             from the 2D region or the whole 3D vol-         ation; Intensity Median; Minimum of In-
                                             ume [2].                                        tensity; Maximum of Intensity; Mean of
                                                                                             Positive Intensities; Uniformity; Kurtosis;
                                                                                             Skewness; Entropy; Normalized Entropy;
                                                                                             Difference of Entropy; Sum of Entropy, and;
                                                                                             Range [2], [25].

 Second Order Radiomics (Texture Features)   Concerned with texture features and rela-
                                             tions between pixels to model intra-tumor
                                             heterogeneity. Texture features are gener-
                                             ated from different descriptive matrices [2].

   • Gray Level Co-occurrence (GLCM)         GLCM [25] is a matrix that presents the         Contrast; Energy; Correlation; Homogene-
                                             number of times that two intensity levels       ity;Variance; Inverse Difference Moment;
                                             have occurred in two pixels with specific       Sum of Average; Sum of Variance; Differ-
                                             distance.                                       ence of Variance; Information Measure of
                                                                                             Correlation; Autocorrelation; Dissimilarity;
                                                                                             Cluster Shade; Cluster Prominence; Cluster
                                                                                             Tendency, and; Maximum Probability.

   • Gray Level Run-Length (GLRLM)           GLRLM [62] is a matrix that presents the        Short run emphasis; Long run emphasis;
                                             length of consecutive pixels having the same    Gray Level Non-Uniformity; Run length
                                             intensity.                                      non-uniformity; Run percentage; Low gray
                                                                                             level run emphasis, and; High gray level run
                                                                                             emphasis [2].

  • Neighborhood Gray Tone Difference        NGTDM [25] is concerned with the inten-         Coarseness; Contrast; Busyness; Complex-
 Matrix (NGTDM)                              sities of neighboring pixels instead of the     ity Texture Strength.
                                             pixel itself.

  • Grey-Level Zone Length Matrix (GL-       GLZLM [9] considers the size of homoge-         Zone Percentage; Short-Zone Emphasis;
 ZLM)                                        neous zones in every dimension.                 Long-Zone Emphasis; Gray-Level Non-
                                                                                             Uniformity for zone; Zone Length Non-
                                                                                             Uniformity.

 Higher Order Radiomics                      Use of filters to extract patterns from im-     Wavelets; Fourier features [25]; Minkowski
                                             ages.                                           functionals; Fractal Analysis [3], and;
                                                                                             Laplacian of Gaussian (LoG) [9].

have high distinguishing ability for problems such as tumor          as benign tumors are most of the times more sphere compared
malignancy and treatment response prediction [25]. Although          to malignant ones. Compactness is itself defined based on
radiologists commonly use shape features (also referred to as        sphericity and as such, these two need not to be calculated
“Semantic Features” or “Morphological features”), the aim of         simultaneously, and one of them will be probably excluded
Radiomics is to quantify them with computer assistance [3].          by the feature selection methods, which are targeting feature
These features are extracted from either 2D or 3D structures         redundancy.
of the tumor region to investigate different shape and size
characteristics of the tumor.                                        3. Texture-based Features: Shape-based and intensity-based
   Among different shape-based features, volume, surface,            features fail to provide useful information regarding corre-
sphericity, compactness, diameter, and flatness are more com-        lations between different pixels across a given image. In
monly used in Radiomics. For instance, sphericity measures           this regard, texture-based features are the most informative
the degree of roundness of the volume or region of interest and      ones, specially for problems where tissue heterogeneity plays
it is specially useful for the prediction of tumor malignancy,       an important role, because texture-based features can catch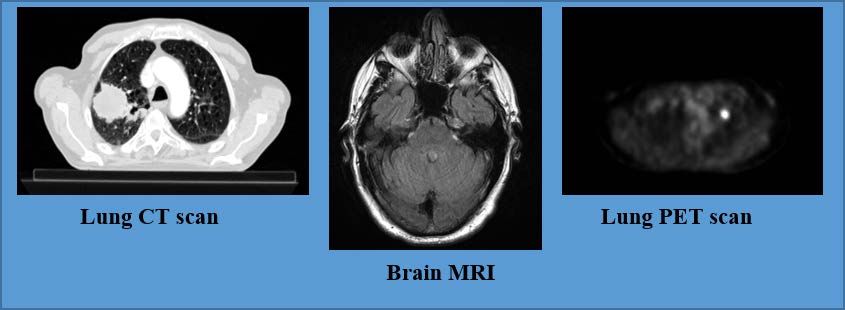
10

the spatial relationships between neighboring pixels [25].          B. Radiomics Feature Reduction Techniques
In Radiomics, typically, texture-based features are extracted          Feature reduction is another critical step in Radiomics
based on different descriptive matrices, among them gray            as although a large number of quantitative features can be
level co-occurrence matrix (GLCM), gray level run length            extracted from the available image datasets, most of the
matrix (GLRLM), neighborhood gray tone difference matrix            features are highly correlated, irrelevant to the task at hand,
(NGTDM), and gray level zone length matrix (GLZLM) are              and/or contribute to over-fitting of the model (making it
the most commonly used ones [62], which are defined below:          highly sensitive to noise). Feature reduction techniques that
                                                                    are used in Radiomics can be classified into supervised and
  •   The GLCM, models the spatial distribution of pixels’          unsupervised categories [8], as summarized in Table V. Su-
      intensities and can be calculated by considering the fre-     pervised approaches, such as filtering and wrapper methods,
      quency of the occurrence of all pairs of intensity values.    take the discriminative ability of features into account and
      Features extracted from GLCM are the most commonly            favor features that can best distinguish data based on a pre-
      used textural features in Radiomics [62]. Each GLCM is        defined class. Unsupervised methods, on the other hand, aim to
      associated with two predefined parameters θ and d, where      reduce feature redundancy and include Principle Component
      θ ∈ {0◦ , 45◦ , 90◦ , 135◦ }, and d is any integer distance   Analysis (PCA), Independent Component Analysis (ICA) and
      admissible within the image dimensions.                       Zero Variance (ZV) [8].
  •   The GLRLM, defines the number of adjacent pixels                 In summery, various objectives can be defined when re-
      having the same intensity value, e.g., the (i, j) element     ducing the feature space in Radiomics. The following key
      of the GLRLMθ matrix determines the number of times           characteristics can be defined for feature selection purposes
      intensity value i has occurred with run length j, in          [2], [3]:
      direction θ.                                                     • Reproducibility: Reproducible features (also referred to
  •   The NGTDM, which is based on visual characteristics                 as “stable features”) are the ones that are more robust
      of the image, is a vector whose k th element is defined             to pre-processing and manual annotations. These features
      as the summation of differences between all pixels with             will be discussed in Sub-section III-D.
      intensity value k and the average intensity of their neigh-      • Informativeness and Relevancy, which can be defined
      borhood (size of which is determined by the user).                  as features that are highly associated with the target
  •   The GLZLM, which looks for zones in a matrix. A                     variable [25]. For instance a χ2 -test, calculates the chi-
      zone can be defined as the set of connected pixels/voxels           squared statistic between features and the class variable,
      sharing the same intensity. The (i, j)th element of the             and consequently features with low impact on the target
      GLZLM corresponds to the number of zones with the                   are discarded. Another selection approach is a Fisher
      intensity i, and the size j.                                        score test, where features with higher variance are treated
                                                                          as the more informative ones.
4. Higher Order Radiomics Features: Higher order features              • Redundancy: Non-redundant features are the ones with
such as Wavelet and Fourier features capture imaging bio-                 small correlation with each other. Feature redundancy is
markers in various frequencies [25]. Wavelet features are                 defined as the amount of redundancy present in a par-
the mostly used higher order features in Radiomics. Wavelet               ticular feature with respect to the set of already selected
course and fine coefficients represent texture and gradient               features.
features respectively, and is calculated by multiplying the         Below, supervised and unsupervised techniques commonly
image by a matrix including complex linear or radial “wavelet       used in Radiomics are further discussed.
mother functions”. Fourier features can also capture gradient
information. Minkowski Functional (MF) is another common            1. Supervised Feature Selection Methodologies: Supervised
higher order feature extractor considering the patterns of pixels   methods are generally divided into two categories as outlined
with intensities above a predefined threshold.                      below:
                                                                       • Filtering (Univariate) Methods: These methods consider
  In brief, the MFs are computed by initially forming a binary           the relation between the features and the class label one
version of the ROI through utilization of several thresholds             at a time without considering their redundancy. Among
within the minimum and maximum intensity limits. Although                all filtering approaches, Wilcoxon test based method
the number of utilized thresholds is a free parameter, for               has been shown to be more stable, resulting in more
better results, it should be identified through a selection              promising predictions in the field of Radiomics [62]. A
mechanism (typically empirical tests are used). Based on the             Wilcoxon test is a nonparametric statistical hypotheses
binarized ROI, different MFs such as area and perimeter are              testing technique that is used to determine dependencies
computable as follows                                                    of two different feature sets, i.e., whether or not they have
                        M Farea    =   ns ,                   (1)        the same probability distribution.
                                                                       • Wrapper (Multivariate) Methods: Filtering methods have
             and    M Fperimeter   =   −4ns + 2ne ,           (2)
                                                                         the drawback of ignoring relations between features
where ns and ne are the total number of white pixels (above              which has led to development of wrapper techniques. In
the threshold) and edges, respectively. This completes our               contrary to the filtering methods, wrapper methods inves-
coverage of feature extraction methods used in Radiomics.                tigate the combined predictive performance of a subset
11
TABLE V: Feature reduction techniques commonly used within the Radiomics literature.
Category Description Methods
Supervised Considers the relation of features with the
class labels and features are selected mostly
based on their contribution to distinguish
classes.
• Filtering (Univariate) Test the relation between the features and Fisher score (FSCR); Wilcoxon rank sum
the class label one by one. test; Gini index (GINI); Mutual information
feature selection (MIFS); Minimum redun-
dancy maximum relevance (MRMR), and;
Student t-test [62].
• Wrapper (Multivariate) Considers both relevancy and redundancy. Greedy forward selection, and Greedy back-
ward elimination.
Unsupervised Does not consider the class labels and its
objective is to remove redundant features.
• Linear Features have linear correlations. Principle Component Analysis (PCA), and;
Multidimensional scaling (MDS)
• Nonlinear Features are not assumed to be lied on a Isometric mapping (Isomap), and; Locally
linear space. linear embedding (LLE).
of features, and the scoring is a weighted sum of both C. Radiomics Statistical Analysis
relevancy and redundancy [62]. However, computational
difficulties prevent such methods from testing all the Statistical analysis refers to utilizing the extracted Ra-
possible feature subsets. diomics features in a specific task such as cancer diagno-
Wrappers methods include greedy forward selection and sis, tumor stage classification, and survivability analysis, as
greedy backward elimination. In a forward feature re- described in Section II. Although most statistical methods,
duction path, selection begins with an empty set and the initially, treat all the features equally and use the same
correlation with class label is calculated for all features weights over all predictors, in the area of Radiomics, the most
individually. Consequently, the most correlated feature successful methods are the ones that use a prior assumption
is selected and added to the set. In the next step, the (provided by experts) over the meaning of features [3]. One
remaining features are added, one by one, to this set to basic approach to analyze the Radiomics features adopted
test the performance of the obtained set, and the process in [5], [9] is to cluster the extracted features and look for
continues until no further addition can increase the pre- associations among clusters and clinical outcomes. For in-
dictive performance of the set. A backward selection path stance, patients belonging to one cluster may have similar
works in contrary to the forward one, beginning with a set diagnosis or patterns. Observations show that image bio-
including all the available features, and gradually reduces markers are associated with clinical outcomes such as tumor
them until no further reduction improves the performance. malignancy. Hierarchical clustering is most commonly used
in Radiomics [2]. However, clustering techniques are not basi-
Since supervised methods are based on class labels, they are cally trained for target forecasting purposes, which necessitates
subject to over-fitting and can not be easily applied to different the use of prediction tools that are specially trained based
applications once trained based on a given feature set. on a predefined class label. Prediction tools in Radiomics are
categorized as either:
2. Unsupervised Feature Selection Methodologies: Unsuper-
vised approaches try to reduce the feature space dimensionality (i) Classification and Regression Models that are mostly
by removing redundant features (those who are correlated similar to other multi-media domains, trying to foresee
and do not provide any additional information). Although a discrete or continues value. Random Forest (RF), Sup-
these methods are not prone to over-fitting, they are not port Vector Machine (SVM) and Neural Network (NN)
guaranteed to result in the optimum feature space. Unsuper- are among the most common regression and classifi-
vised techniques can be divided into linear and non-linear cation techniques used to make predictions based on
methods, where the former assumes that features lie on a linear Radiomics [8].
space. Because, in the field of Radiomics, commonly, very (ii) Survivability analysis: Also referred to as time-related
simple and basic forms of unsupervised techniques, such as models, mostly try to predict the survival time associated
PCA, are used, they are not covered in this article. However, with patients. These models are also useful when testing
this presents an opportunistic venue for application of more the effectiveness of a new treatment.
advanced statistical-based dimensionality reduction solutions Table VI presents a summary of different Radiomics analysis
recently developed within signal processing literature. techniques. As predictors belonging to the former category12
TABLE VI: Common analysis methods in Radiomics.
Purpose Description Methods
Clustering Similar patients are grouped together based Hierarchical, Partitional
on a distance metrics.
Classification Models are trained to distinguish patients Random Forest (RF); Support Vector Ma-
based on their associated clinical outcome. chine (SVM); Neural Network (NN); Gen-
eralized linear model (GLM); Naive Bayes
(NB); k-nearest neighbor (KNN); Mixture
Discriminant Analysis (MDA); Partial Least
Squares GLM (PLS), and; Decision Tree
(DT).
Time-related analysis The survival time or the probability of sur- Kaplan-Meier survival analysis; Cox pro-
vival is calculated based on the available set portional hazards regression model [4], and;
of data from previous patients. Log-Rank Test.
are also common in other multi-media applications, they are the “Risk” and is conventionally assumed to be a linear
PNc com-
not covered in this article. Survivability analysis (the latter bination of the features (covariates), i.e., Risk , i=1 bi x i .
category), however, is more specific to Radiomics, and as The Risk coefficients (bi , for (1 ≤ i ≤ Nc )) are then computed
such, below, we discuss the three mostly used techniques from through a training process based on historical data. More
this category, i.e., Kaplan-Meier Survival Curve (KMS), Cox realistically, the risk can be modeled as a general non-linear
Proportional Hazards (regression) Model (PHM), and Log- function, i.e., Risk , f (x), with the non-linearity being
Rank Test. learned via deep learning architectures, which has not yet been
investigated within the Radiomics context.
1. Kaplan-Meier Survival Curve (KMS): The KMS curve [5],
[8] represents a trajectory for measuring the probability of 3. Log-Rank Test [5], which is used for comparing the
survival S(t) in given points of time t, i.e., survival of two samples specially when these two samples have
N umber of patients survived until t undergone different treatments. This test is a non-parametric
S(t) = . (3) hypothesis test assessing whether two survival curves vary
N umber of patients at the beginning
significantly. One limitation associated with the Log-Rank
The KMS curve can be calculated for all Radiomics features test is that the size of the groups can influence the results,
to assess the impact of different features on patients’ survival therefore, larger number of patients should be included to from
as follows: equal sized groups.
1) A desired feature, for which the KMS curve is supposed Evaluation of HCR: In summary, having a successful hand-
to be calculated, is selected. crafted Radiomics pipeline requires an accurate design to
2) Based on the selected feature, one or more thresholds choose the best combination of feature extraction, feature
are considered that can partition patients into, e.g., low reduction, and analysis methods. Several studies have tried
and high risk cancer subjects. Patients are then grouped to find the most important factor leading to the performance
based on whether their associated feature lies above or variation. For instance, the effects of these design choices are
below the threshold. recently investigated in [8] through an analysis of variance,
3) The KMS curve is calculated for all the obtained groups, where it has been shown that, e.g., feature selection can
and the result can be used to compare the survivability significantly influence the final accuracy. On the other hand,
among patients with, e.g., low and high risk cancer. For References [17], [74] have concluded that the classification
instance, in Reference [5] high heterogeneity features method is the dominant source of performance variation for
are associated with shorter survival time, while high head-and-neck and lung cancer classification tasks. The dif-
compactness features are associated with longer survival. ference between the concluding remarks of Reference [8] and
References [17], [74] indicates that impact of design choices
2. Cox Proportional Hazards (Regression) Model (PHM) [5], may vary from one application to another, one dataset to
is commonly used in medical areas to predict patient’s survival another, and from a set of features to another.
time based on one or more predictors (referred to as covariates) Finally, it should be noted that reporting accuracy is not as
such as Radiomics features. The output of the PHM model informative measure in Radiomics as it is in other multi-media
denoted by h(t) is the risk of dying at a particular time t, domains. Because, in medical areas, making mistakes in, for
which can be calculated as follows instance, classifying positive and negative samples are not
PNc
bi xi equal. Therefore, in Radiomics, measures which are capable of
h(t) = h0 (t) × exp i=1 (4)
distinguishing between False Positive (FP) and False Negative
where xi , for (1 ≤ i ≤ Nc ), are predictors (covariates); bi (FN) errors are more favored. Such one measure is the area
represent the impacts of predictors, and h0 (t) is called the under Receiver Operating Characteristic (ROC) curve, which
base-line hazard. The exponent term in Eq. (4) is referred to as allows for investigating the impact of different decision thresh-13
olds on FP and FN rates. Confusion matrix is another common setting, is a nonparametric repeated measurement that
and useful technique to report the performance of a Radiomics estimates whether there is a significant difference be-
classifier in terms of its FP and FN rates. In practice, most of tween the distribution of multiple observations, and has
the decisions in medical areas cannot be made with a complete the advantage of not requiring a Gaussian population.
certainty, and physicians consider several factors such as harms Based on this test, the most stable features are the ones
and benefits of a specific judgment, when forming thresholds with a stability rank of 1 [5].
for their decisions. However, these factors are not quantified In [5], it is declared that Radiomics features with higher
and utilized in Radiomics, which calls for a broad investigation stability have more prognostic performance, therefore, stability
into potential solutions to incorporate the factors commonly analysis can be interpreted as a feature reduction technique.
used by physicians. According to Reference [9], Laplacian of Gaussian (LoG),
intensity-based, and texture features are more stable for lung
D. Radiomics Stability CT images, while wavelet and shape-based features are sensi-
tive to variation in segmentation. However, there are also other
An important aspect of Radiomics is the stability of the sources of variation (other than the segmentation step), that
extracted features, which quantifies the degree of dependency can influence the stability of the features, one of which is the
between features and pre-processing steps. Stability in Ra- image intensity discretization strategy [72] that has a strong
diomics is generally evaluated based on either of the following impact on the texture features, in particular. There are two
two techniques: main approaches to discretize the medical images. The first
1) Test-Retest: In this approach, patients undergo an imag- one is to adopt a fixed bin size for all of the images, and the
ing exam more than once and images are collected second one is to use a fixed number of bins. While it is shown
separately. Radiomics features are then extracted from that both approaches lead to texture features that depend on the
all the obtained sets and analyzed. Here, being invariant intensity resolution, the first method (fixed-sized bins) results
across different set of images illustrates stability of in more stable and comparable features. Nevertheless, texture
Radiomics features. analysis requires standardized intensity discretization method,
2) Inter-observer reliability, which is referred to an ex- to serve as a meaningful and reliable Radiomics technique.
periment where multiple observers are asked to delineate Finally, it is worth mentioning that the Image Bio-marker
the ROI from the same images, and Radiomics features Standardization Initiative (IBSI) [73] is an international collab-
are extracted from all different delineations to test their oration that seeks to provide unique definitions, guidelines, and
stability for variation in segmentation [9]. Here, being Radiomics steps, in response to the reproducibility challenge
invariant across different segmentations illustrates sta- of the Radiomics. The provided guideline covers several steps
bility of Radiomics features. within the Radiomics pipeline, from image acquisition, pre-
Different stability Criteria are used to find robust features in processing and segmentation, to feature calculation. To sum-
Radiomics as briefly outlined below: marize our finding on HCR and elaborate on its applications,
1) Intra-class Correlation Coefficient (ICC): One ap- we have provided an example in Information Post III-E,
proach to measure the stability of Radiomics features, where the problem of Radiomics-based lung cancer analysis
which is used for both the aforementioned categories is investigated.
(i.e., test-retest and inter-observer setting) is referred to
as the intra-class correlation coefficient (ICC) [5]. The E. Radiogenomics
ICC is defined as a metric of the reliability of features, Radiomics is typically combined with Genomic data, of-
taking values between 0 and 1, where 0 means no ten referred to as Radiogenomics [3]. In other words, Ra-
reliability and 1 indicates complete reliability. Defining diogenomics refers to the relationship between the imaging
terms BM S and W M S as mean squares (measure characteristics of a disease and its gene expression patterns,
of variance) between and within subjects, which are gene mutations and other genome-related characteristics. Po-
calculated based on a one-way Analysis of variance tential association between imaging outcome and molecular
(ANOVA), for a test-retest setting, the ICC can be diagnostic data can serve as a predictor of patient’s response
estimated as to the treatments and provide critical support for the decision
BM S − W M S making tasks within the clinical care setting. In other words,
ICCTest-Retest = , (5)
BM S + (N − 1)W M S Radiogenomics has the potential to investigate the Genomics
where N is the number of repeated examinations. By of the cancer, without utilizing invasive procedures such as
defining EM S as residual mean squares from a two- biopsy. Various association mining and clustering methods are
way ANOVA and M as the number of observers, for an used to identify the relationships between gene expressions
inter-observer setting, the ICC can be calculated as and Radiomics, e.g., in [3] it was found that just 28 Radiomics
features were able to reconstruct 78% of the global gene
BM S − EM S
ICCInter-Observer = . (6) expressions in human liver cancer cells.
BM S + (M − 1)EM S To assess the association between gene expression and
2) Friedman Test: The Friedman test, which is specially discrete classes such as benign and malignant tumors, genes
useful for assessing the stability in an inter-observer should be first sorted based on their discriminative ability.You can also read