Differences in Chinese and Western tourists faced with Japanese hospitality: A natural language processing approach
←
→
Page content transcription
If your browser does not render page correctly, please read the page content below
Information Technology & Tourism manuscript No.
                                         (will be inserted by the editor)

                                         Differences in Chinese and Western tourists faced
                                         with Japanese hospitality: A natural language
                                         processing approach

                                         Elisa Claire Alemán Carreón 1 · Hugo
                                         Alberto Mendoza España 1 · Hirofumi
                                         Nonaka 1 · Toru Hiraoka 2

                                         Received: date / Accepted: date
arXiv:2107.14681v1 [cs.IR] 30 Jul 2021

                                         Abstract Since culture influences expectations, perceptions, and satisfac-
                                         tion, a cross-culture study is necessary to understand the differences between
                                         Japan’s biggest tourist populations, Chinese and Western tourists. However,
                                         with ever-increasing customer populations, this is hard to accomplish without
                                         extensive customer base studies. There is a need for an automated method for
                                         identifying these expectations at a large scale. For this, we used a data-driven
                                         approach to our analysis. Our study analyzed their satisfaction factors compar-
                                         ing soft attributes, such as service, with hard attributes, such as location and
                                         facilities, and studied different price ranges. We collected hotel reviews and ex-
                                         tracted keywords to classify the sentiment of sentences with an SVC. We then
                                         used dependency parsing and part-of-speech tagging to extract nouns tied to
                                         positive adjectives. We found that Chinese tourists consider room quality more
                                         than hospitality, whereas Westerners are delighted more by staff behavior. Fur-
                                         thermore, the lack of a Chinese-friendly environment for Chinese customers
                                         and cigarette smell for Western ones can be disappointing factors of their
                                         stay. As one of the first studies in the tourism field to use the high-standard
                                         Japanese hospitality environment for this analysis, our cross-cultural study
                                         contributes to both the theoretical understanding of satisfaction and suggests
                                         practical applications and strategies for hotel managers.

                                         B Elisa Claire Alemán Carreón
                                           E-mail: elisa.claire.aleman.carreon@gmail.com
                                           ORCID: 0000-0002-6437-0866
                                             Hugo Alberto Mendoza España
                                             E-mail: mendoza.espana@gmail.com
                                             Hirofumi Nonaka
                                             E-mail: nonaka@kjs.nagaokaut.ac.jp
                                             Toru Hiraoka
                                             E-mail: hiraoka@sun.ac.jp
                                         1   Nagaoka University of Technology, Nagaoka, Japan
                                         2   University of Nagasaki, Nagasaki, Japan
2 E. Alemán Carreón et al.
Keywords Sentiment Analysis · Hotels and Lodging · Text Mining · Chinese ·
English · Satisfaction and Dissatisfaction Factors
1 Introduction
Inbound international tourism has been increasingly affecting Japanese econ-
omy (Jones et al. 2009). A year-on-year growth rate of 19.3% was observed in
2017, with 28,691,073 inbound tourists (Japan National Tourism Organization
2019).
Japan’s hospitality has been known historically to be of the highest qual-
ity. Omotenashi, which describes the spirit of Japanese hospitality, with roots
in Japanese history and tea ceremony, is celebrated worldwide (Al-alsheikh
and Sato 2015). Consequently, it would stand to reason that tourists visiting
Japan would have this hospitality as their first and foremost satisfaction fac-
tor. However, it is known that customers from different countries and cultures
have different expectations (Engel et al. 1990). Thus, it could be theorized
that their satisfaction factors should be different.
The Japanese tourist market is gradually becoming diverse because of mul-
ticultural tourist populations. This diversity means that the expectations when
staying at a hotel will be varied. Cultural backgrounds have a decisive role in
aspects of satisfaction and in the perceptions of quality (Mattila 1999; Winsted
1997), or behavioral intentions (Liu et al. 2001), such as the difference in West-
erners and Asians in their willingness to pay more (Levy 2010). A difference in
cultural background can also heavily influence customers’ expectations, as well
as their perceptions of quality, and the difference between these two is what
expresses itself as satisfaction. This difference in expectations and perceptions
of quality can be smaller or larger depending on the culture in reaction to the
same service.
For a growing industry with increasing cultural diversity, it is essential
to identify the cross-culture expectations of customers in order to provide
the appropriate services, cater to these expectations to ensure and increase
customer satisfaction, maintain a good reputation, and generate positive word-
of-mouth.
In 2017, Chinese tourists accounted for 25.63% of the tourist population.
On the other hand, Western countries accounted for 11.4% of the total, and
7.23% were countries where English is the official or the de facto national
language (Japan National Tourism Organization 2019). The effect of Chinese
tourists on international economies is increasing, along with the number of
studies on this phenomenon, (Sun et al. 2017). Despite this, many tourist-
behavior analyses have been performed only involving Western subjects. Yet,
it is known that Western and Asian customers are heavily differentiated(Levy
2010). As such, a knowledge gap existed until recent decades. Considering the
numbers of inbound tourists in Japan and our team’s language capabilities,
our study focuses on Western and Chinese tourists.Differences in Chinese and Western tourists faced with Japanese hospitality: ... 3
In studies involving Asian populations in the analysis, Chinese-tourist be-
haviors have been evaluated most commonly (e.g. Liu et al. 2019; Chang et al.
2010; Dongyang et al. 2015). The few studies reporting comparisons between
Asian and Western tourists’ behaviors (e.g. Choi and Chu 2000) are typically
survey- or interview-based, using small samples. These studies, although valid,
can have limitations, namely, the scale and sampling. In the past, survey-based
studies have provided a theoretical background for a few specific tourist pop-
ulations of a single culture or traveling with a single purpose. These studies’
limited scope often leads to difficulties in observing cultural and language dif-
ferences in a single study. This creates a need for large-scale cross-cultural
studies for the increasing Asian and Western tourist populations. It could be
said that Westerners account for a smaller portion of the tourist population
compared to Asians. However, according to Choi and Chu (2000), Westerners
are known as “long-haul” customers, spending more than 45% of their budget
on hotels. In comparison, their Asian counterparts only spend 25% of their
budget on hotels. Therefore, it is essential to study Asian and Western tourist
populations, their differences, and the contrast with the existing literature
results.
However, with ever-increasing customer populations, this is hard to ac-
complish without extensive studies of the customer base. There is a need for
an automated method for identifying these expectations at a large scale. Our
study intends to answer the need for such a methodology utilizing machine
learning and natural language processing of large amounts of data. For this,
we used a data-driven approach to our analysis, taking advantage of hotel
review data. With this methodology, we explore the expectations and needs
for the two most differing cultures currently interacting with the hospitality
industry in Japan.
Owing to the advent of Web 2.0 and customer review websites, researchers
realized the benefits of online reviews for research, sales (Ye et al. 2009; Ba-
suroy et al. 2003), customer consideration (Vermeulen and Seegers 2009) and
perception of services and products (Browning et al. 2013), among other ef-
fects of online interactions between customers (e.g. Xiang and Gretzel 2010;
Ren and Hong 2019). Consequently, information collected online is being used
in tourism research for data mining analysis, such as opinion mining (e.g. Hu
et al. 2017), predicting hotel demand from online traffic (Yang et al. 2014),
recommender systems (e.g. Loh et al. 2003), and more. Data mining and ma-
chine learning technologies can increase the number of manageable samples in
a study from hundreds to hundreds of thousands. These technologies can not
only help confirm existing theories but also lead to finding new patterns and
to knowledge discovery (Fayyad et al. 1996).
In this study, we evaluate the satisfaction factors of two essential tourist
populations that are culturally different from Japan: Chinese and Western
tourists. We take advantage of the wide availability of online reviews of Japanese
hotels by both Mainland Chinese tourists posting on Ctrip and Western,
English-speaking tourists posting on TripAdvisor. Based on these data, we
can confirm existing theories regarding the differences in tourists’ behavior and4 E. Alemán Carreón et al.
discover factors that could have been overlooked in the past. We use machine
learning to automatically classify sentences in the online reviews as positive
or negative opinions on the hotel. We then perform a statistical extraction of
the topics that most concern the customers of each population.
2 Research objective
With the knowledge that cultural background influences expectations in cus-
tomers, which is the basis for satisfaction, it becomes important to know the
difference in factors influencing satisfaction and dissatisfaction between the
most differing and numerous tourist populations in a given area.
This study aims to determine the difference in factors influencing satisfac-
tion and dissatisfaction between Chinese and English-speaking tourists in the
context of high-grade hospitality of Japanese hotels across several price ranges.
We use machine learning to classify the sentiment in texts and natural language
processing to study commonly used word pairings. More importantly, we also
intend to measure how hard and soft attributes influence customer groups’ sat-
isfaction and dissatisfaction. We define hard attributes as attributes relating
to physical and environmental aspects, such as the hotel’s facilities, location,
infrastructure, and surrounding real estate. In contrast, soft attributes are the
hotel’s non-physical attributes related to services, staff, or management.
3 Theoretical background and hypothesis development
3.1 Cultural influence in expectation and satisfaction
Customer satisfaction in tourism has been analyzed since decades past, Hunt
(1975) having defined customer satisfaction as the realization or overcoming of
expectations towards the service. Oliver (1981) defined it as an emotional re-
sponse to the provided services in retail and other contexts, and Oh and Parks
(1996) reviewed the psychological processes of customer satisfaction for the
hospitality industry. It is generally agreed upon that satisfaction and dissatis-
faction stem from the individual expectations of the customer. As such, Engel
et al. (1990) states that each customer’s background, therefore, influences sat-
isfaction and dissatisfaction. It can also be said that satisfaction stems from
the perceptions of quality in comparison to these expectations.
These differences in customers’ backgrounds can be summed up in cultural
differences as well. In the past, satisfaction and perceived service quality have
been found to be influenced by cultural differences (e.g. Mattila 1999; Winsted
1997). Service quality perceptions have been studied via measurements such
as SERVQUAL (e.g. Armstrong et al. 1997).
Previous studies on the dimensions of culture that influence differences
in expectations have been performed in the past as well (e.g. Mattila 2019;
Levy 2010; Donthu and Yoo 1998), such as comparing individualism vs. col-
lectivism, high context vs. low context, uncertainty avoidance, among otherDifferences in Chinese and Western tourists faced with Japanese hospitality: ... 5
factors. While culture as a concept is difficult to quantify, some researchers
have tried to use these and more dimensions to measure cultural differences,
such as the six dimensions described by Hofstede (1984), or the nine dimen-
sions of the GLOBE model (House et al. 1999).
These cultural dimensions are more differentiated in Western and Asian
cultures (Levy 2010). Our study being located in Japan, it stands to rea-
son that the differences in expectations between Western tourists and Asian
tourists should be understood in order to provide a good service. However, even
though geographically close, Japanese and Chinese cultures are both very dif-
ferent when it comes to customer service. This is why our study focuses on the
difference between Chinese and Western customers in Japan. The contrast-
ing cultural backgrounds between Chinese and Western customers will lead to
varying expectations of the hotel services, the experiences they want to have
while staying at a hotel, and the level of comfort that they will have. In turn,
these different expectations will determine the distinct factors of satisfaction
and dissatisfaction for each kind of customer and the order in which they
prioritize them.
Because of their different origins, expectations, and cultures, it stands to
reason Chinese and Western tourists could have completely different factors
to one another. Therefore, it could be that some factors do not appear in the
other reviews at all. For example, between different cultures, it can be that a
single word can express some concept that would take more words in the other
language. Therefore, we must measure their differences or similarities at their
common ground as well.
3.2 Customer satisfaction and dissatisfaction towards individual factors
during hotel stay
We reviewed the importance of expectations in the development of satisfaction
and dissatisfaction and the influence that cultural backgrounds have in shaping
these expectations. This is true for overall satisfaction for the service as a
whole, as well as individual elements that contribute to satisfaction.
In this study, we study not overall customer satisfaction but the satis-
faction and dissatisfaction that stem from individual-specific expectations, be
they conscious or unconscious. For example, if a customer has a conscious ex-
pectation of a comfortable bed and a wide shower, and it is realized during
their visit, they will be satisfied with this matter. However, suppose that same
customer with a conscious expectation of a comfortable bed experienced loud
noises at night. In that case, they can be dissatisfied with a different aspect,
regardless of the satisfaction towards the bed. Then, the same customer might
have packed their toiletries, thinking that the amenities might not include
those. They can then be pleasantly surprised with good quality amenities and
toiletries, satisfying an unconscious expectation. This definition of satisfaction
does not allow us to examine overall customer satisfaction. However, it will
allow us to examine the factors that a hotel can revise individually and how6 E. Alemán Carreón et al.
a population perceives them as a whole. In our study, we consider the defini-
tions in Hunt (1975) that satisfaction is a realization of an expectation, and
we posit that customers can have different expectations towards different ser-
vice aspects. Therefore, in our study, we define satisfaction as the emotional
response to the realization or overcoming of conscious or unconscious expec-
tations towards an individual aspect or factor of a service. On the other hand,
dissatisfaction is the emotional response to the lack of a realization or under-
performance of these conscious or unconscious expectations towards specific
service aspects.
Studies on customer satisfaction (e.g. Truong and King 2009; Romão et al.
2014; Wu and Liang 2009) commonly use the Likert scale (Likert 1932) (e.g. 1
to 5 scale from strongly dissatisfied to strongly satisfied) to perform statistical
analysis of which factors relate most to satisfaction on the same dimension as
dissatisfaction (e.g. Chan et al. 2015; Choi and Chu 2000). The Likert scale’s
use leads to correlation analyses where one factor can lead to satisfaction,
implying that the lack of it can lead to dissatisfaction. However, a binary dis-
tinction (satisfied or dissatisfied) could allow us to analyze the factors that
correlate to satisfaction and explore factors that are solely linked to dissat-
isfaction. There are fewer examples of this approach, but studies have done
this in the past (e.g. Zhou et al. 2014). This method can indeed decrease the
extent to which we can analyze degrees of satisfaction or dissatisfaction. How-
ever, it has the benefit that it can be applied to a large sample of text data
via automatic sentiment detection techniques using artificial intelligence.
3.3 Japanese hospitality and service: Omotenashi
The spirit of Japanese hospitality, or Omotenashi, has roots in the country’s
history, and to this day, it is regarded as the highest standard (Ikeda 2013;
Al-alsheikh and Sato 2015). There is a famous phrase in customer service
in Japan: okyaku-sama wa kami-sama desu, meaning “The customer is god.”
Some scholars say that omotenashi originated from the old Japanese art of the
tea ceremony in the 16th century, while others found that it originates in the
form of formal banquets in the 7th-century (Aishima et al. 2015). The practice
of high standards in hospitality has survived throughout the years. Presently,
it permeates all business practices in Japan, from the cheapest convenience
stores to the most expensive ones. Manners, service, and respect towards the
customer are taught to workers in their training. High standards are always
followed to not fall behind in the competition. In Japanese businesses, in-
cluding hotels, staff members are trained to speak in sonkeigo, or “respectful
language,” one of the most formal of the Japanese formality syntaxes. They
are also trained to bow differently depending on the situation, where a light
bow could be used to say “Please, allow me to guide you.” Deep bows are used
to apologize for any inconvenience the customer could have faced, followed by
a very respectful apology. Although the word omotenashi can be translated di-
rectly as “hospitality,” it includes both the concepts of hospitality and serviceDifferences in Chinese and Western tourists faced with Japanese hospitality: ... 7
(Kuboyama 2020). This hospitality culture permeates every type of business
with customer interaction in Japan. A simple convenience shop could express
all of these hospitality and service standards, which are not exclusive to hotels.
It stands to reason that this cultural aspect of hospitality would positively
influence customer satisfaction. However, in many cases, other factors such as
proximity to a convenience store, transport availability, or room quality might
be more critical to a customer. In this study, we cannot directly determine
whether a hotel is practicing the cultural standards of omotenashi. Instead,
we consider it as a cultural factor that influences all businesses in Japan.
We then observe the customers’ evaluations regarding service and hospitality
factors and compare them to other places and business practices in the world.
In summary, we consider the influence of the cultural aspect of omotenashi
while analyzing the evaluations on service and hospitality factors that are
universal to all hotels in any country.
Therefore, we pose the following research question:
Research Question 1a: To what degree are Chinese and Western tourists
satisfied with Japanese hospitality factors such as staff behavior or service?
However, Japanese hospitality is based on Japanese culture. Different cul-
tures interacting with it could provide a different evaluation of it. Some might
be impressed by it, whereas some might consider other factors more important
to their stay in a hotel. This point leads us to a derivative of the aforemen-
tioned research question:
Research Question 1b: Do Western and Chinese tourists have a different
evaluation of Japanese hospitality factors such as staff behavior or service?
3.4 Customer expectations beyond service and hospitality
Staff behavior, hospitality and service, and therefore Omotenashi, are all soft
attributes of a hotel. That is, they are non-physical attributes of the hotel,
and as such, they are practical to change through changes in management.
While it is important to know this, it is not known if the cultural differences
between Chinese and Western tourists also influence other expectations and
satisfaction factors, such as the hard factors of a hotel.
Hard factors are attributes uncontrollable by the hotel staff, which can play
a part in the customers’ choice behavior and satisfaction. Examples of these
factors include the hotel’s surroundings, location, language immersion of the
country as a whole, or touristic destinations, and the hotel’s integration with
tours available nearby, among other factors.
Besides the facilities, many other aspects of the experience, expectation,
and perception of the stay in a hotel can contribute to the overall satisfac-
tion, as well as individual satisfactions and dissatisfactions. However, previous
research focuses more on these soft attributes, with little focus on hard at-
tributes, if only focusing on facilities (e.g. Shanka and Taylor 2004; Choi and8 E. Alemán Carreón et al.
Chu 2001). Because of this gap in knowledge, we decided to analyze the dif-
ferences in cultures regarding both soft and hard attributes of a hotel.
This leads to two of our research questions:
Research Question 2a: To what degree do satisfaction and dissatisfaction
stem from hard and soft attributes of the hotel?
Research Question 2b: How differently do Chinese and Western customers
perceive hard and soft attributes of the hotel?
The resulting proportions of hard attributes to soft attributes for each
population could measure how much the improvement of management in the
hotel can increase future satisfaction in customers.
3.5 Chinese and Western tourist behavior
In the past, social science and tourism studies focused extensively on Western
tourist behavior in other countries. Recently, however, with the rise of Chinese
outbound tourism, both academic researchers and businesses have decided to
study Chinese tourist behavior, with rapid growth in studies following the
year 2007 (Sun et al. 2017). However, studies focusing on only the behavior
of this subset of tourists are the majority. To this day, studies and analyses
specifically comparing Asian and Western tourists are scarce, and even fewer
are the number of studies explicitly comparing Chinese and Western tourists.
One example is a study by Choi and Chu (2000), which found that Western
tourists visiting Hong Kong are satisfied more with room quality, while Asians
are satisfied with the value for money. Another study by Bauer et al. (1993)
found that Westerners prefer hotel health facilities, while Asian tourists were
more inclined to enjoy the Karaoke facilities of hotels. Both groups tend to
have high expectations for the overall facilities. Another study done by Kim
and Lee (2000) found American tourists to be individualistic and motivated by
novelty, while Japanese tourists were collectivist and motivated by increasing
knowledge and escaping routine.
One thing to note with the above Asian vs. Western analyses is that they
were performed before 2000 and not Chinese-specific. Meanwhile, the current
Chinese economic boom is increasing the influx of tourists of this nation. The
resulting increase in marketing and the creation of guided tours for Chinese
tourists could have created a difference in tourists’ perceptions and expecta-
tions. In turn, if we follow the definition of satisfaction in Hunt (1975), the
change in expectations could have influenced their satisfaction factors when
traveling. Another note is that these studies were performed with question-
naires in places where it would be easy to locate tourists, i.e., airports. How-
ever, our study of online reviews takes the data that the hotel customers
uploaded themselves. This data makes the analysis unique in exploring their
behavior compared with Western tourists via factors that are not considered
in most other studies. Furthermore, our study is unique in observing the cus-
tomers in the specific environment of high-level hospitality in Japan.Differences in Chinese and Western tourists faced with Japanese hospitality: ... 9
More recent studies have surfaced as well. A cross-country study (Francesco
and Roberta 2019) using posts from U.S.A. citizens, Italians, and Chinese
tourists, determined using a text link analysis that customers from different
countries indeed have a different perception and emphasis of a few predefined
hotel attributes. According to their results, U.S.A. customers perceive clean-
liness and quietness most positively. In contrast, Chinese customers perceive
budget and restaurant above other attributes. Another couple of studies (Jia
2020; Huang 2017) analyze differences between Chinese and U.S. tourists using
text mining techniques and more massive datasets, although in a restaurant
context.
These last three studies focus on the U.S.A. culture, whereas our study
focuses on the Western culture. Another difference with our study is that of
the context of the study. The first study (Francesco and Roberta 2019) was
done within the context of tourists from three countries staying in hotels across
the world. The second study chose restaurant reviews from the U.S.A. and
Chinese tourists eating in three countries in Europe. The third study analyzed
restaurants in Beijing.
On the other hand, our study focuses on Western culture, instead of a single
Western country, and Chinese culture clashing with the hospitality environ-
ment in Japan, specifically. Japan’s importance in this analysis comes from
the unique environment of high-grade hospitality that the country presents.
In this environment, customers could either hold their satisfaction to this hos-
pitality regardless of their culture or value other factors more depending on
their cultural differences. Our study measures this at a large scale across dif-
ferent hotels in Japan.
Other studies have gone further and studied people from many countries in
their samples and performed a more universal and holistic (not cross-culture)
analysis. Choi and Chu (2001) analyzed hotel guest satisfaction determinants
in Hong Kong with surveys in English, Chinese and Japanese translations,
with people from many countries in their sample. Choi and Chu (2001) found
that staff service quality, room quality, and value for money were the top satis-
faction determinants. As another example, Uzama (2012) produced a typology
for foreigners coming to Japan for tourism, without making distinctions for
their culture, but their motivation in traveling in Japan. In another study,
Zhou et al. (2014) analyzed hotel satisfaction using English and Mandarin
online reviews from guests staying in Hangzhou, China coming from many
countries. The general satisfaction score was noticed to be different among
those countries. However, a more in-depth cross-cultural analysis of the sat-
isfaction factors was not performed. As a result of their research, Zhou et al.
(2014) thus found that customers are universally satisfied by welcome extras,
dining environments, and special food services.
Regarding Western tourist behavior, a few examples can tell us what to
expect when analyzing our data. Kozak (2002) found that British and Ger-
man tourists’ satisfaction determinants while visiting Spain and Turkey were
hygiene and cleanliness, hospitality, the availability of facilities and activities,
and accommodation services. Shanka and Taylor (2004) found that English-10 E. Alemán Carreón et al.
speaking tourists in Perth, Australia were most satisfied with staff friendliness,
the efficiency of check-in and check-out, restaurant and bar facilities, and lobby
ambiance.
Regarding outbound Chinese tourists, academic studies about Chinese
tourists have increased (Sun et al. 2017). Different researchers have found that
Chinese tourist populations have several specific attributes. According to Ryan
and Mo (2001) and their study of Chinese tourists in New Zealand, Chinese
tourists prefer nature, cleanliness, and scenery in contrast to experiences and
activities. Dongyang et al. (2015) studied Chinese tourists in the Kansai region
of Japan and found that Chinese tourists are satisfied mostly with exploring
the food culture of their destination, cleanliness, and staff. Studying Chinese
tourists in Vietnam, Truong and King (2009) found that Chinese tourists are
highly concerned with value for money. According to Liu et al. (2019), Chi-
nese tourists tend to have harsher criticism compared with other international
tourists. Moreover, as stated by Gao et al. (2017), who analyzed different gen-
erations of Chinese tourists and their connection to nature while traveling,
Chinese tourists prefer nature overall. However, the younger generations seem
to do so less than their older counterparts.
Although the studies focusing only on Chinese or Western tourists have
a narrow view, their theoretical contributions are valuable. We can see that
depending on the study and the design of questionnaires and the destinations;
the results can vary greatly. Not only that, but while there seems to be some
overlap in most studies, some factors are completely ignored in one study but
not in the other. Since our study uses data mining, each factor’s definition is
left for hotel customers to decide en masse via their reviews. This means that
the factors will be selected through statistical methods alone instead of being
defined by the questionnaire. Our method allows us to find factors that we
would not have contemplated. It also avoids enforcing a factor on the mind
of study subjects by presenting them with a question that they did not think
of by themselves. This large variety of opinions in a well-sized sample, added
to the automatic findings of statistical text analysis methods, gives our study
an advantage compared to others with smaller samples. This study analyzes
the satisfaction and dissatisfaction factors cross-culturally and compares them
with the existing literature.
Undoubtedly previous literature has examples of other cross-culture studies
of tourist behavior and may further highlight our study and its merits. A con-
trast is shown in Table 1. This table shows that older studies were conducted
with surveys and had a different study topic. These are changes in demand
(Bauer et al. 1993), tourist motivation (Kim and Lee 2000), and closer to our
study, satisfaction levels (Choi and Chu 2000). However, our study topic is not
the levels of satisfaction but the factors that drive it and dissatisfaction, which
is overlooked in most studies. Newer studies with larger samples and similar
methodologies have emerged, although two of these study restaurants instead
of hotels (Jia 2020; Huang 2017). One important difference is the geographical
focus of their studies. While Francesco and Roberta (2019) , Jia (2020) and
Huang (2017) have a multi-national focus, we instead focus on Japan. TheDifferences in Chinese and Western tourists faced with Japanese hospitality: ... 11 focus on Japan is important because of its top rank in hospitality across all types of businesses. Our study brings light to the changes, or lack thereof, in different touristic environments where an attribute can be considered excel- lent. The number of samples in other text-mining studies is also smaller than ours in comparison. Apart from that, every study has a different text mining method.
12
                         Table 1: Comparison between cross-culture or cross-country previous studies and our study.
                      Bauer et.al (1993)       Choi and Chu (2000)   Kim and Lee (2000)   Huang (2017)                      Francesco and Roberta (2019)      Jia (2020)       Our study
                                                                                                                            USA
                      Asians                   Asians                Anglo-Americans      Chinese                           vs                                Chinese          Chinese
Comparison objects    vs                       vs                    vs                   vs                                China                             vs               vs
                      Westerns                 Westerners            Japanese             English-speakers                  vs                                US tourists      Westerners
                                                                                                                            Italy
                                                                                          Dining experience                 Perception and                    Motivation and   Satisfaction and
Study topic           Changes in demand        Satisfaction Levels   Tourist Motivation
                                                                                          of Roast Duck                     Emphasis                          Satisfaction     Dissatisfaction
Geographical focus    Asia Pacific region      Hong Kong             Global               Beijing                           Multi-national                    Multi-national   Japan
Industry              Hotels                   Hotels                Tourism              Restaurant (Beijing Roast Duck)   Hotels                            Restaurants      Hotels
                                                                     Tourists arriving    Diners                            Hotel customers                   Diners           Hotel customers
Study subjects        Hotel managers           Hotel customers
                                                                     in airport           online reviews                    online reviews                    online reviews   online reviews
Sample method         surveys                  surveys               survey               text mining                       text mining                       text mining      text mining
                                                                                                                                                              2448 reviews     89,207 reviews
                                                                     165 Anglo-American   990 Chinese reviews
Number of samples     185 surveys              540 surveys                                                                  9000 reviews (3000 per country)   (1360 Chinese)   (48,070 Chinese)
                                                                     209 Japanese         398 English reviews
                                                                                                                                                              (1088 English)   (41,137 English)
                                                                                          Semantic                                                                             SVM,
                                                                                                                                                              Topic modeling
Study method          statistics               VARIMAX               MANOVA               Network                           Text Link Analysis                                 Dependency Parsing
                                                                                                                                                              (LDA)
                                                                                          Analysis                                                                             and POS tagging
                      Asians:
                      China,                   Asians:
                      Fiji,                    China,
                      Hong Kong,               Taiwan,                                                                                                                         Chinese-speakers:
                      Indonesia,               Japan,                                     English-speakers:                                                                    China
                      Malaysia,                South Korea,                               U.K., U.S., Australia,
                      Singapore,               South-East Asia                            New Zealand, Canada,                                                                 English-speakers:
Subject nationality                                                  USA, Japan                                             USA, China, Italy                 USA, China
                      Taiwan,                                                             Ireland                                                                              (U.K., U.S.,
                      Guam,                    Westerners:                                                                                                                     Australia,
                      Tahiti,                  North America,                             Chinese-speakers: China                                                              New Zealand,
                      Thailand                 Europe,                                                                                                                         Canada, Ireland)
                                               Australia,
                      Westerners: Australia,   New Zealand
                      New Zealand
                                                                                                                                                                                                    E. Alemán Carreón et al.
Differences in Chinese and Western tourists faced with Japanese hospitality: ... 13
3.6 Data mining, machine learning, knowledge discovery and sentiment
analysis
In the current world, data is presented to us in larger and larger quantities.
Today’s data sizes were commonly only seen in very specialized large labora-
tories with supercomputers a couple of decades ago. However, they are now
standard for market and managerial studies, independent university students,
and any scientist connecting to the Internet. Such quantities of data are avail-
able to study now more than ever. Nevertheless, it would be impossible for
researchers to parse all of this data by themselves. As Fayyad et al. (1996)
summarizes, data by itself is unusable until it goes through a process of selec-
tion, preprocessing, transformation, mining, and evaluation. Only then can it
be established as knowledge. With the tools available to us in the era of in-
formation science, algorithms can be used to detect patterns that would take
researchers too long to recognize. These patterns can, later on, be evaluated to
generate knowledge. This process is called Knowledge Discovery in Databases.
Now, there are, of course, many sources of numerical data to be explored.
However, perhaps what is most available and interesting to managerial pur-
poses is the resource of customers’ opinions in text form. Since the introduction
of Web 2.0, an unprecedented quantity of valuable information is posted to
the Internet at a staggering speed. Text mining has then been proposed more
than a decade ago to utilize this data (e.g. Rajman and Besançon 1998; Nahm
and Mooney 2002). Using Natural Language Processing, one can parse lan-
guage in a way that translates to numbers so that a computer can analyze
it. Since then, text mining techniques have improved over the years. This has
been used in the field of hospitality as well for many purposes, including satis-
faction analysis from reviews (e.g Berezina et al. 2016; Xu and Li 2016; Xiang
et al. 2015; Hargreaves 2015; Balbi et al. 2018), social media’s influence on
travelers (e.g. Xiang and Gretzel 2010), review summarization (e.g. Hu et al.
2017), perceived value of reviews (e.g Fang et al. 2016), and even predicting
hotel demand using web traffic data (e.g Yang et al. 2014).
More than only analyzing patterns within the text, researchers have found
how to determine the sentiment behind a statement based on speech patterns,
statistical patterns, and other methodologies. This method is called sentiment
analysis or opinion mining. A precursor of this method was attempted decades
ago (Stone et al. 1966). With sentiment analysis, one could use patterns in the
text to determine whether a sentence was being said with a positive opinion,
or a critical one. This methodology could even determine other ranges of emo-
tions, depending on the thoroughness of the algorithm. Examples of sentiment
analysis include ranking products through online reviews (e.g Liu et al. 2017;
Zhang et al. 2011), predicting political poll results through opinions in Twitter
(O’Connor et al. 2010), and so on. In the hospitality field, it has been used to
classify reviewers’ opinions of hotels in online reviews (e.g. Kim et al. 2017;
Al-Smadi et al. 2018).
Our study used an algorithm for sentiment analysis called a Support Vector
Machine (SVM), a supervised machine learning used for binary classification.14 E. Alemán Carreón et al.
Machine learning is a general term used for algorithms that, when given data,
will automatically use that data to ”learn” from its patterns and apply them
for improving upon a task. Learning machines can be supervised, as in our
study, where the algorithm has manually labeled training data to detect pat-
terns in it and use them to establish a method for classifying other unlabeled
data automatically. Machine learning can also be unsupervised, where there is
no pre-labeled data. In this latter case, the machine will analyze the structure
and patterns of the data and perform a task based on its conclusions. Our
study calls for a supervised machine since text analysis can be intricate. Many
patterns might occur, but we are only interested in satisfaction and dissatis-
faction labels. Consequently, we teach the machine through previously labeled
text samples.
Machine learning and data mining are two fields with a significant overlap
since they can use each other’s methods to achieve the task at hand. Machine
learning methods focus on predicting new data based on known properties and
patterns of the given data. Data mining, on the other hand, is discovering new
information and new properties of the data. Our machine learning approach
will learn the sentiment patterns of our sample texts showing satisfaction and
dissatisfaction and using these to label the rest of the data. We are not ex-
ploring new patterns in the sentiment data. However, we are using sentiment
predictions for knowledge discovery in our database. Thus, our study is a data
mining experiment based on machine learning.
Because the methodology for finding patterns in the data is automatic and
statistical, it is both reliable and unpredictable. Reliable in that the algorithm
will find a pattern by its nature. Unpredictable in that since it has no interven-
tion from the researchers in making questionnaires, it can result in anything
that the researchers could not expect. These qualities determine why, similar
to actual mining; data mining is mostly exploratory. One can never be sure
that one will find a specific something. However, we can make predictions
and estimates about finding knowledge and what kind of knowledge we can
uncover. The exploration of large opinion datasets with these methods is es-
sential. The reason is that we can discover knowledge that could otherwise be
missed by observing a localized sample rather than taking a holistic view of
every user’s opinion. In other words, a machine algorithm can find the needles
in a haystack that we did not know were there by examining small bundles of
hay at a time.
4 Methodology
We extracted a large number of text reviews from the site Ctrip, with mostly
mainland Chinese users, and the travel site TripAdvisor. We then determined
the most commonly used words that relate to positive and negative opinions
in a review. We did this using Shannon’s entropy to extract keywords from
their vocabulary. These positive and negative keywords allow us to train an
optimized Support Vector Classifier (SVC) to perform a binary emotionalDifferences in Chinese and Western tourists faced with Japanese hospitality: ... 15
classification of the reviews in large quantities, saving time and resources for
the researchers. We then applied a dependency parsing to the reviews and
a Part of Speech tagging (POS tagging) to observe the relationship between
adjective keywords and the nouns they refer to. We split the dataset into price
ranges to observe the differences in keyword usage between lower-class and
higher-class hotels. We observed the frequency of the terms in the dataset to
extract the most utilized words in either review. We show an overview of this
methodology in Figure 1, which is an updated version of the methodology used
by Alemán Carreón et al. (2018). Finally, we also observed if the satisfaction
factors were soft or hard attributes of the hotel.
4.1 Data collection
In the Ctrip data collection, reviews from a total of 5774 hotels in Japan
were collected. From these pages, we extracted a total of 245,919 reviews,
from which 211,932 were detected to be standard Mandarin Chinese. Since
a single review can have sentences with different sentiments, we separated
sentences using punctuation marks. The Chinese reviews were comprised of
187,348 separate sentences.
In the TripAdvisor data collection, we collected data from 21,380 different
hotels. In total, we collected 295,931 reviews, from which 295,503 were detected
to be in English. Similarly to the Chinese data, we then separated these En-
glish reviews into 2,694,261 sentences using the gensim python library. For the
language detection in both cases we used the langdetect python library.
However, to make the data comparisons fair, we filtered both databases
only to contain reviews from hotels in both datasets, using their English names
to do a search match. We also filtered them to be in the same date range. In
addition, we selected only the hotels that had pricing information available.
We extracted the lowest and highest price possible for one night as well. The
difference in pricing can be from better room settings, such as double or twin
rooms or suites, depending on the hotel. Regardless of the reason, we chose the
highest-priced room since it can be an indirect indicator of the hotel’s class.
After filtering, the datasets contained 557 hotels in common. The overlapping
date range for reviews was from July 2014 to July 2017. Within these hotels,
Fig. 1: Overview of the methodology to quantitatively rank satisfaction factors.16 E. Alemán Carreón et al.
from Ctrip there was 48,070 reviews comprised of 101,963 sentences, and from
TripAdvisor there was 41,137 reviews comprised of 348,039 sentences.
The price for a night in these hotels ranges from cheap capsule hotels at
2000 yen per night to high-end hotels 188,000 yen a night at the far ends of
the bell curve. Customers’ expectations can vary greatly depending on the
pricing of the hotel room they stay at. Therefore, we made observations on
the distribution of pricing in our database’s hotels and binned the data by
price ranges, decided by consideration of the objective of stay. We show these
distributions in Figure 2. The structure of the data after division by price is
shown in Table 2. This table also includes the results of emotional classification
after applying our SVC, as explained in 4.3. The first three price ranges (0 to
2500 yen, 2500 to 5000 yen, 5000 to 10,000 yen) would correspond to low-class
hotels or even hostels on the lower end and cheap business hotels on the higher
end. Further on, there are business hotels in the next range (10,000 to 15,000
yen). After that, the stays could be at Japanese style ryokan when traveling
in groups, high-class business hotels, luxury love hotels, or higher class hotels
(15,000 to 20,000 yen, 20,000 to 30,000 yen). Further than that is more likely
to be ryokan or high class resorts or five-star hotels (30,000 to 50,000 yen,
50,000 to 100,000 yen, 100,000 to 200,000 yen). Note that because of choosing
the highest price per one night in each hotel, the cheapest two price ranges (0
to 2500 yen, 2500 to 5000 yen) are empty, despite some rooms being priced
at 2000 yen per night. Because of this, other tables will omit these two price
ranges.
(a) 50 equal lenght bins (b) manually set 9 price ranges
Fig. 2: Price for one night distribution, blue: lowest price, orange: highest price.
4.2 Text processing
We needed to analyze the grammatical relationship between words, be it En-
glish or Chinese, to understand the connections between adjectives and nouns.
For all these processes, we used the Stanford CoreNLP pipeline developedDifferences in Chinese and Western tourists faced with Japanese hospitality: ... 17
Table 2: Collected data and structure after price range categorizing.
Price range Data collected Ctrip database Tripadvisor database
Hotels 557 557
Reviews 48,070 41,137
0: All Prices Sentences 101,963 348,039
Positive sentences 88,543 165,308
Negative sentences 13,420 182,731
Hotels 0 0
1: 0 to 2500 yen
Reviews 0 0
Hotels 0 0
2: 2500 to 5000 yen
Reviews 0 0
Hotels 22 22
Reviews 452 459
3: 5000 to 10,000 yen Sentences 1,108 3,988
Positive sentences 924 1,875
Negative sentences 184 2,113
Hotels 112 112
Reviews 2,176 2,865
4: 10,000 to 15,000 yen Sentences 4,240 24,107
Positive sentences 3,566 11,619
Negative sentences 674 12,488
Hotels 138 138
Reviews 7,043 4,384
5: 15,000 to 20,000 yen Sentences 14,726 37,342
Positive sentences 12,775 17,449
Negative sentences 1,951 19,893
Hotels 129 129
Reviews 11,845 13,772
6: 20,000 to 30,000 yen Sentences 24,413 115,830
Positive sentences 21,068 55,381
Negative sentences 3,345 60,449
Hotels 83 83
Reviews 8,283 7,001
7: 30,000 to 50,000 yen Sentences 17,939 58,409
Positive sentences 15,642 28,493
Negative sentences 2,297 29,916
Hotels 59 59
Reviews 16,670 9,646
8: 50,000 to 100,000 yen Sentences 36,255 81,940
Positive sentences 31,638 38,217
Negative sentences 4,617 43,723
Hotels 14 14
Reviews 1,601 3,010
9: 100,000 to 200,000 yen Sentences 3,282 26,423
Positive sentences 2,930 12,274
Negative sentences 352 14,149
by the Natural Language Processing Group at Stanford University (Manning
et al. 2014). In order to separate Chinese words for analysis, we used the
Stanford Word Segmenter (Chang et al. 2008). In English texts, however, only
using spaces is not enough to correctly collect concepts. The English language
is full of variations and conjugations of words depending on the context and
tense. Thus, a better segmentation is achieved by using lemmatization, which
returns each word’s dictionary form. For this purpose, we used the gensim
library for the English texts.18 E. Alemán Carreón et al.
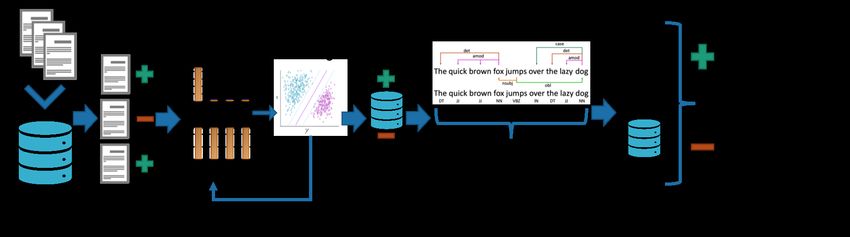
A dependency parser analyzes the grammatical structure, detecting con-
nections between words, and describing the action and direction of those con-
nections. We show an example of these dependencies in Figure 3. This study
uses the Stanford NLP Dependency Parser, as described by Chen and Manning
(2014). A list of dependencies used by this parser is detailed by de Marneffe and
Manning (2008). In more recent versions, they use an updated dependency tag
list from Universal Dependencies (Zeman et al. 2018). In our study, this step
was necessary to extract adjective modifiers and their subject. We did that by
parsing the database and extracting instances of a few determined dependency
codes. One of these dependency codes is “amod”, which stands for “adjectival
modifier”. This is used when an adjective modifies a noun directly (e.g., A big
apple). The other dependency code we used was “nsubj”, or nominal subject,
the class’s syntactic subject. We used this one for cases where the adjective
is modifying the noun indirectly through other words (e.g., The apple is big).
This dependency does not necessarily only include a combination of adjectives
and nouns. However, it can also be connected with copular verbs, nouns, or
other adjectives. We saw it necessary also to perform a Part of Speech (POS)
tagging of these clauses.
Fig. 3: Example of dependency parsing.
A Part of Speech (POS) tagger is a program that assigns word tokens with
tags identifying the part of speech. An example is shown in Figure 4. A Part of
Speech is a category of lexical items that serve similar grammatical purposes,
for example, nouns, adjectives, verbs, or conjunctions. In our study, we used
the Stanford NLP POS tagger software, described by Toutanova and Manning
(2000) and Toutanova et al. (2003), which uses the Penn Chinese Treebank
tags (Xia 2000).
Fig. 4: Example of POS tagging with the Penn Treebank tags.
In this study, we were interested in identifying combinations of adjectives,
some verbs, and nouns. We also needed to filter away bad combinations that
were brought by the versatility of nominal subject dependencies. For this pur-
pose, we identified the tags for nouns, verbs, and adjectives in Chinese and En-Differences in Chinese and Western tourists faced with Japanese hospitality: ... 19
glish, with the English tags being a bit more varied. What would be called ad-
jectives in English corresponds more to stative verbs in Chinese, so we needed
to extract those as well. We show a detailed description of the chosen tags in
Table 3. We also show a detailed description of the tags we needed to filter.
We selected these tags heuristically by observing commonly found undesired
pairs in Table 4.
Table 3: Target Parts of Speech for extraction and pairing.
Language POS Tag Part of Speech Examples
NN Noun (general) 酒店 (hotel)
VA Predicative Adjective (verb) 干净 的 (clean)
Chinese target tags
JJ Noun modifier (adjectives) 干净 (clean)
VV Verb (general) 推荐 (recommend)
NN Noun (general) room
NNS Noun (plural) beds
JJ Adjective big
JJS Adjective (superlative) best
English target tags JJR Adjective (comparative) larger
VB Verb (base form) take
VBP Verb (single present) take
VBN Verb (past participle) taken
VBG Verb (gerund / present participle) taking
Table 4: Filtered out Parts of Speech to aid pairing.
Language POS Tag Part of Speech Examples
DT Determiner a, an
PN Pronoun I, you, they
Commonly filtered tags
CD Cardinal Number 1, 2, 3, 4, 5
PU Punctuation .!?
DEV Particle 地 (Japan) (adverbial particle)
NR Noun (proper noun) 日本 (Japan)
Chinese filtered tags M Measure word 个 (general classifier), 公里 (kilometer)
SP Sentence-final particle 他 (he), 好 (good)
IJ Interjection 啊 (ah)
NNP Noun (proper noun) Japan
English target tags PRP$ Possessive Pronoun My, your, her, his
WP Wh-pronoun What, who
Once we had these adjective + noun or verb + noun pairs, we could de-
termine what the customers referred to in their reviews. With what frequency
they use those pairings positively or negatively.
4.3 Sentiment analysis using a Support Vector Classifier
The sentiment analysis was performed using the methodology described by
Alemán Carreón et al. (2018). Keywords are determined by a comparison of
Shannon’s entropy (Shannon 1948) between two classes by a factor of α for one20 E. Alemán Carreón et al.
class and α0 for the other, and then they are used in an SVC (Cortes and Vap-
nik 1995), optimizing keywords to select the best performing classifier using
the F1 -measure (Powers 2011). The selected SVC keywords would then clearly
represent the user driving factors leading to positive and negative emotions.
We also performed experiments to choose the best value of the parameter C
used in the SVC. C is a constant that affects the optimization process when
minimizing the error of the separating hyperplane. Low values of C give some
freedom of error, which minimizes false positives but can also increase false
negatives. Inversely, high C values will likely result in minimal false negatives
but a possibility of false positives. SVC performance results are displayed in
Tables 5 and 6. Examples of tagged sentences are shown in Table 7.
Table 5: Best performing SVC 5-fold cross-validation Chinese text classifiers.
Classifier F1 F1
Keyword List C
emotion µ σ
Satisfaction keywords
Satisfaction 2.5 0.91 0.01
(α = 2.75)
Negative keywords
Dissatisfaction 0.5 0.67 0.11
(α0 = 3.75)
Combined
Satisfaction 0.5 0.95 0.01
(α = 2.75, α0 = 3.75)
Table 6: Best performing SVC 10-fold cross-validation English text classifiers.
Classifier F1 F1
Keyword List C
emotion µ σ
Satisfaction keywords
Satisfaction 1.75 0.82 0.02
(α = 1.5)
Dissatisfaction keywords
Dissatisfaction 3 0.80 0.03
(α0 = 4.25)
Combined
Satisfaction 2 0.83 0.02
(α = 1.5, α0 = 4.25)
Shannon’s entropy can be used to observe the probability distribution of
each word inside the corpus. A word included in many documents will have
a high entropy value for that set of documents. Opposite to this, a word
appearing in only one document will have an entropy value of zero.
An SVC is trained to classify data based on previously labeled data, gen-
eralizing the data’s features by defining a separating (p-1)-dimensional hyper-
plane in p-dimensional space. Each dimension is a feature of the data in this
space. The separating hyperplane, along with the support vectors, divides the
multi-dimensional space and minimizes classification error.
Our study used a linear kernel for the SVC, defined by the formula (1)
below. Each training sentence is a data point, a row in the vector x. Each
column represents a feature; in our case, the quantities of each of the keywords
in that particular sentence. The labels of previously known classifications (1 for
positive, 0 for negative) for each sentence comprise the f (x) vector. The WeightDifferences in Chinese and Western tourists faced with Japanese hospitality: ... 21
Table 7: Examples of positive and negative sentences used for training SVM.
Language Emotion Sentences
酒店 的 服务 很 好 和 我 住 过 的 所有 日本 酒店 一样 各 种 隐形 服务 非常 厉害
(translated as: ”The service of the hotel is very good.
Positive
All the services of the Japanese hotels I have stayed in are extremely good.”)
Chinese
有 一 个 后门 到 地铁站 非常 近 周边 也 算 方便 酒店 服务 和 卫生 都 很 好
(translated as: ”There is a back door to the subway station very close to it.
The surrounding area is also convenient hotel service and health are very good”)
酒店 旁边 很 荒凉 连个 便利 店 都 要 走 很远
(translated as: ”The hotel is very bleak,
Negative
and you have to go very far to go to the nearest convenience store.”)
唯一 不 足 是 价格 太高
(translated as: ”The only negative is that the price is too high.”)
It was extremely clean, peaceful and the hotel Hosts made us feel super welcome
Positive
Location is very good, close to a main road with a subway station, a bakery,
English
a 7 eleven and a nice restaurant that is not too expensive but serves good food
The only downside. Our room was labeled ’non-smoking’
Negative but our duvet reeked of smoke.
A bit pricey though
Vector w is comprised of the influences each point has had in the training
process to define the hyperplane angle. The bias coefficient b determines its
position.
During the SVC learning algorithm, each data point classified incorrectly
alters the weight vector to correctly classify new data. These changes to the
weight vector are greater for features close to the separating hyperplane. These
features have stronger changes because they needed to be taken into account
to classify with a minimal error. Sequentially, the weight vector can be inter-
preted as a numerical representation of each feature’s effect on each class’s
classification process. Below we show the formula for the weight vector w (2),
where x is the training data and each vectorized sentence xi in the data is
labeled yi . Each cycle of the algorithm alters the value of w by α to reduce
the number of wrong classifications. This equation shows the last value of α
after the end of the cycle.
f (x) = w> x + b (1)
N
X
w= αi yi xi (2)
i=1
We tagged 159 Chinese sentences and 2357 English sentences as positive or
negative for our training data. The entropy comparison factors α and α0 were
tested from 1.25 to 6 in intervals of 0.25. We applied this SVC to classify the
rest of our data collection. Subsequently, the positive and negative sentence
counts shown in Table 2 result from applying our SVC for classification.22 E. Alemán Carreón et al.
5 Data Analysis
5.1 Frequent keywords in differently priced hotels
We observed the top 10 satisfaction and dissatisfaction keywords with the
highest frequencies of emotionally positive and negative statements to study.
The keywords are the quantitative rank of the needs of Chinese and English-
speaking customers. We show the top 10 positive keywords for each price range
comparing English and Chinese in Table 8. For the negative keywords, we show
the results in Table 9.
We can observe that the most used keywords for most price ranges in the
same language are similar, with a few changes in priority for the keywords
involved. For example, in Chinese, we can see that the customers praise clean-
liness first in cheaper hotels, whereas the size of the room or bed is praised
more in hotels of higher class. Another example is that in negative English re-
views, complaints about price appear only after 10,000 yen hotels. After this,
it climbs in importance following the increase in the hotel’s price.
5.2 Frequently used adjectives and their pairs
Some keywords in these lists are adjectives, such as the word “大 (big)” men-
tioned before. To understand those, we performed the dependency parsing and
part of speech tagging explained in section 4.2. While many of these connec-
tions, we only considered the top 4 used keyword connections per adjective per
price range. We show the most used Chinese adjectives in positive keywords in
Table 10, and for negative Chinese adjective keywords in Table 11. Similarly,
for English adjectives used in positive sentences we show the most common
examples in Table 12, and for adjectives used in negative sentences in Table
13.You can also read