Improving the usability of online symptom checkers to avoid the digital exclusion of vulnerable user groups - Felipe González Carceller
←
→
Page content transcription
If your browser does not render page correctly, please read the page content below
Master’s Programme in Computer, Communication and Information Sciences

Improving the usability of online symptom
checkers to avoid the digital exclusion of
vulnerable user groups

Felipe González Carceller

                                                  Master’s Thesis
                                                  2021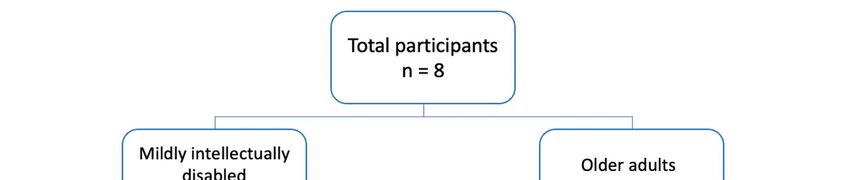
Copyright ©2021 Felipe González Carceller
Author Felipe González Carceller
Title of thesis Improving the usability of online symptom checkers to avoid the digital
exclusion of vulnerable user groups
Programme Computer, Communication and Information Sciences
Major Software and Service Engineering
Thesis supervisor PhD Sari Kujala
Thesis advisor DA Kaisa Savolainen
Date 08.08.2021           Number of pages 67 + 12                 Language English

Abstract
This research aims to study how usable existing online symptom checkers are from the
point of view of vulnerable user groups and what to consider when developing these
services in the future. For this, usability tests were conducted on two of the most prevalent
symptom checkers in Finland, Omaolo symptom checker and Klinik Access. A total of eight
participants were recruited for this study, four people with mild intellectual disabilities and
four older adults. These user groups were selected since they can be considered to be at risk
of digital exclusion, which then may lead to social exclusion. This may happen as health
services become progressively more digitized restricting some people’s access to them. By
developing usable services for people of all ages, abilities, and skill levels, everyone can
benefit, as states the principle of universal design.

A combination of the think-aloud method, observations, questionnaires, and semi-
structured interviews was used to better understand the presented problem. The methods
used yielded various usability issues that hindered the participants’ ability to fill in the
symptom checkers in an efficient manner. The median System Usability Scale score of the
Omaolo symptom checker was 72/100 and for Klinik Access it was 68/100.

Based on the gathered data and analyzed results, this study presents 13 guidelines that
address issues found in the usability tests ranging from the insufficient visibility of relevant
information to the clearness of the different options in the services. These guidelines are an
effort to make online symptom checkers usable by people with the widest range of
capabilities and therefore minimize service quality gaps between the different user groups,
no matter their age or capabilities. Learning from the usability issues revealed in this study
and applying this acquired information in the future will improve the chances to take every
user into consideration and ultimately result in universally more usable online symptom
checkers.

Keywords        usability, universal design, symptom checkers, eHealth, vulnerable
users

                                                    3
Tekijä Felipe González Carceller
Työn nimi Sähköisten oirearvioiden käytettävyyden parantaminen heikommassa
asemassa olevien käyttäjien digitaalisen syrjäytymisen välttämiseksi
Koulutusohjelma Computer, Communications and Information Sciences
Pääaine Software and Service Engineering
Työn valvoja FT Sari Kujala
Työn ohjaaja TaT Kaisa Savolainen
Päivämäärä 08.08.2021 Sivumäärä 67 + 12 Kieli Englanti
Tiivistelmä
Tämän tutkimuksen tarkoituksena on tutkia, kuinka käytettäviä olemassa olevat sähköiset
oirearviot ovat heikommassa asemassa olevien käyttäjäryhmien näkökulmasta ja mitä on
pidettävä mielessä näitä palveluita kehitettäessä tulevaisuudessa. Tätä varten suoritettiin
oirearvioiden käytettävyystestit Omaolo oirearviolla ja Klinik Accessilla. Tähän
tutkimukseen rekrytoitiin yhteensä kahdeksan osallistujaa, neljä lievästi kehitysvammaista
ja neljä ikäihmistä. Nämä käyttäjäryhmät valittiin, koska niiden voidaan katsoa olevan
digitaalisen syrjäytymisen vaarassa, mikä voi sitten johtaa sosiaaliseen syrjäytymiseen.
Näin voi käydä, kun terveydenhuoltopalvelut digitalisoituvat mikä saattaa rajoittaa
joidenkin ihmisten pääsyä palveluihin. Kun palveluita voi käyttää iästä, kyvyistä tai
taidoista riippumatta, jokainen käyttäjä hyötyy.
Jotta esitettyä ongelmaa voitaisiin ymmärtää paremmin, käytettävyystestin aikana tietoa
kerättiin ääneen ajattelun, havaintojen, kyselylomakkeiden sekä haastatteluiden avulla.
Käytetyt menetelmät toivat esille erilaisia käytettävyysongelmia, jotka estivät osallistujia
täyttämästä oirearvioita tehokkaasti. System Usability Scale -kyselystä Omaolo oirearvio
sai keskimäärin 72/100 pistettä ja Klinik Access 68/100 pistettä.
Kerätyn tiedon ja analysoitujen tulosten perusteella tässä tutkimuksessa esitetään 13
ohjetta, jotka käsittelevät käytettävyystesteissä löydettyjä käytettävyysongelmia kuten
esimerkiksi relevantin tiedon puutteellista näkyvyyttä sekä eri vastausvaihtoehtojen
selkeyttä. Näiden ohjeiden avulla pyritään tekemään sähköisistä oirearvioista
mahdollisimman käytettäviä heikommassa asemassa oleville käyttäjille ja huomioimaan
mahdollisimman moni käyttäjä, tarjoten kaikille käyttäjille saman käyttökokemuksen ja
mahdollisuuden käyttää palveluita. Tässä tutkimuksessa löydetyistä
käytettävyysongelmista voidaan ottaa oppia ja tätä opittua tietoa voidaan soveltaa
tulevaisuudessa, antaen ihmisille mahdollisuuden käyttää verkkopalveluita itsenäisesti
lisäten heikommassa asemassa olevien käyttäjien itsenäisyyttä ja oirearvioiden
helppokäyttöisyyttä.
Avainsanat käytettävyys, universal design, oirearvio, eHealth, heikommassa asemassa
olevat käyttäjät
4Preface
I want to give a special thanks to my supervisor Sari Kujala as well as my advisor Kaisa
Savolainen for mentoring me and allowing me to constantly learn throughout the writing of
this thesis. They both helped me immensely during my time as a research assistant and I
cannot thank them enough. I would also like to thank everyone at DigiIN for giving me
invaluable feedback and guiding me in the right direction.
I would also like to thank people at DigiFinland, Klinik Healthcare Solutions, the Selkeästi
meille -initiative, Väylä ry, and all the participants who made this study possible. This thesis
could not have happened without you.
A big thank you goes also to my family as they supported me through my struggles and were
always there for me while I was working on this thesis.
Espoo, 8 August 2021
Felipe González Carceller
5Contents
1 Introduction ................................................................................................ 7
2 Background..................................................................................................9
2.1 Usability ..................................................................................................................................... 9
2.1.1 Universal design ................................................................................................................................ 10
2.1.2 Universal design in eHealth ...............................................................................................................12
2.2 Accessible services for vulnerable users ..................................................................................13
3 Research methods ..................................................................................... 15
3.1 Research approach ................................................................................................................... 15
3.2 Online symptom checkers ........................................................................................................16
3.3 Participants ............................................................................................................................... 17
3.4 Usability evaluation ................................................................................................................. 18
3.4.1 Thinking aloud ................................................................................................................................... 18
3.4.2 Observation .........................................................................................................................................19
3.4.3 Questionnaires ....................................................................................................................................19
3.4.4 Semi-structured interview ................................................................................................................ 20
3.4.5 Symptom vignettes .............................................................................................................................21
3.5 Study setup ................................................................................................................................21
3.6 Pilot study................................................................................................................................. 23
3.7 Data analysis ............................................................................................................................ 24
4 Results ....................................................................................................... 25
4.1 Participant characteristics ...................................................................................................... 25
4.2 Usability test findings and results .......................................................................................... 27
4.2.1 Usability issues .................................................................................................................................. 27
4.2.2 Task completion times ...................................................................................................................... 29
4.2.3 Perceived usability ..............................................................................................................................31
4.2.4 Participants’ views on the symptom checkers ................................................................................. 32
4.3 Guidelines................................................................................................................................. 35
5 Discussion.................................................................................................. 41
5.1 Answering the research questions ...........................................................................................41
5.1.1 Usability of current online symptom checkers .................................................................................41
5.1.2 Designing symptom checkers for all users ....................................................................................... 42
5.2 Evaluation of the study ............................................................................................................ 43
5.3 Limitations of the study .......................................................................................................... 45
5.4 Ethics ........................................................................................................................................ 46
5.5 Future work .............................................................................................................................. 47
6 Conclusion ................................................................................................ 48
References .......................................................................................................49
Appendix A: Background information survey ................................................. 56
Appendix B: Health literacy survey ................................................................. 57
Appendix C: SUS .............................................................................................58
Appendix D: Symptom vignettes ..................................................................... 59
Appendix E: Usability issues .......................................................................... 60
61 Introduction
As the world becomes more and more digital, some services can be found exclusively online.
A shift towards digital services is also happening in the healthcare field (Mehta et al., 2020).
However, not all patients have the same opportunities or knowledge to adapt to the rapid
digitalization of the modern world and this can lead to some unwanted or unaccounted
consequences. Some groups of people might be unintentionally excluded and receive limited
service or no service at all for something they have no control over.
Online symptom checkers are used by people seeking health related guidance as these
services typically provide an urgency assessment and suggest a course of action based on the
reported symptoms (Chambers et al., 2019). The user can then use this information to make
better informed decisions regarding their health and decide whether they should seek
medical attention as soon as possible or whether they can treat the symptoms on their own.
Symptom checkers utilize algorithms to provide the user with an initial screening or triage
to determine the most appropriate next step the user should take (Semigran et al., 2015).
Depending on the symptom checker, entered information can also be relayed to a doctor to
give them advanced understanding of the patient’s condition before even meeting them.
Furthermore, symptom checkers can empower users as they facilitate patient involvement
in their health care (Meyer et al. 2020). This study focuses on the two most prevalent online
symptom checkers in Finland, Omaolo symptom checker and Klinik Access.
Public services are typically aimed for a wider audience so it can sometimes be difficult to
provide the same service for everybody. However, there are some steps that can be taken to
get closer to this goal. Namely, the term universal design, also referred to as design for all,
conceptualizes a design philosophy which aims to develop products and services that are
usable to the greatest extent possible by all kinds of people regardless of their age as well as
their abilities or disabilities (Story et al., 1998). This kind of approach benefits user groups
that are vulnerable or in danger of digital exclusion which, then again, may lead to social
exclusion (Martin et al., 2016). Universal design combats this issue by aiming to provide the
users with the means to use the service with equal opportunities. Especially in the case of
intellectually disabled individuals as well as older adults, creating a situation where they can
use a service on their own without the feeling of being a burden to others can make them
feel empowered and creates a positive user experience (Chan et al., 2013; Wass & Safari,
2020). Nevertheless, vulnerable users’ needs might be neglected as studies suggest that
vulnerable user groups are often not involved in the design process of eHealth applications
(Ware et al., 2017; Oudshoorn et al., 2020).
Previous work has discussed the usability aspect of symptom checkers but little to no
research has focused on vulnerable user groups such as older adults and intellectually
disabled individuals (Kim, 2017; Knitza et al., 2021; Liu et al., 2021). The aim of this research
is to propose a set of guidelines to address the design choices of public digital health services,
and more specifically online symptom checkers, as an attempt to minimize the gap of service
received by different groups of people. Thus, the research problem that will be answered is
7“How can the usability of digital health services be improved to avoid the digital
exclusion of vulnerable user groups?”. This research problem is further supported by
two additional research questions:
1. How usable are current online symptom checkers for older adults and the mildly
intellectually disabled?
2. How to design symptom checkers for all users?
These questions help to better understand the problem of designing public services for a
large and heterogeneous user base. To answer these research questions, a literature review
will be conducted and followed up by an empirical study. The literature review will present
a summary of what has been accomplished in this field so far while the empirical part of the
study will take the form of a usability test in order to identify what works in the current
design of the services and where changes need to possibly take place.
The thesis is structured as follows. Section 1 introduces the topic of the thesis, the research
problem along with the supporting research questions, and the scope of the study. Section 2
further introduces usability, universal design, and accessible services and their relevance in
this study. This sections also present examples of previous studies in this field and what can
be learned from them. Section 3 goes over the methodology of this study. This includes the
research approach, an introduction to the tested services and the participants, the data
collection methods and the reasonings why they were chosen, a step-by-step description of
how each usability test was conducted, and how the collected data was analyzed. Then,
Section 4 presents the results of the empirical study. An overview of the participants is given
followed up by the results of the usability tests. Section 4 also proposes a set of guidelines
that are based on the usability issues identified during the tests. Finally, Section 5 discusses
the study as a whole by answering the research problem and research questions, going over
the limitations of the study, and then proposing future directions for studies to follow.
82 Background
2.1 Usability
The Human-centered design for interactive systems’ standard ISO 9241-11:2018
(International Organization for Standardization, 2018) defines usability as “the extent to
which a system, product, or service can be used by specified users to achieve specified goals
with effectiveness, efficiency, and satisfaction in a specified context of use”. According to
Bevan et al. (2015), usability has previously been used to measure the user’s performance or
how well they used a system, product, or service to solve tasks and reach goals, that is, its
effectiveness and efficiency. The emphasis was more on the applicability of the system in a
specific situation rather than on the user’s experience when using the system, which is also
an important aspect to consider states Bevan et al (2015). However, over the years usability
has come to replace the term “user friendly” (Bevan et al., 1991; Nielsen, 1993). In a similar
manner, Bevan et al. (2015) argue that there is more to usability evaluation than measuring
just effectiveness, efficiency, and satisfaction, referring to Nielsen’s (1993) definition of
usability which consists of a total of five usability attributes adding learnability,
memorability, and errors to the previously mentioned efficiency and satisfaction. Nielsen
defines usability as a quality attribute that assesses how easy a user interface is to use. In
other words, the easier a webpage is to use, the better its usability.
Following Nielsen’s (1993) definition, learnability describes how easy it is for users to
accomplish basic tasks the first time they interact with the system. For a system to be usable,
it should be easy for a new user to learn and to understand (Shackel, 2009). In the case of a
system being challenging to learn and to comprehend, users might be reluctant to accept it
and to use it (Rizzo et al., 2005). By using words, phrases, and concepts familiar to the user,
the user can associate interactions to past experiences and make connections which improve
learnability (Nielsen, 1994a).
Efficiency measures how quickly and successfully users can perform tasks once they have
learned the design and are familiar with the system (Nielsen, 1993). This can be evaluated
by recording the time it takes a user to complete a high-level task once they have had time
to get used to the system (Kim, 2017). Although the user may be able to perform the tasks
efficiently, said tasks might not be effectively completed. Effectiveness measures the
accuracy and completeness with which the user achieves a specified goal, where accuracy
describes how well the actual outcome matches the intended outcome and completeness
describes how many of the intended outcomes were actually achieved (International
Organization for Standardization, 2018). Effectiveness can be evaluated by determining the
task completion rate (Arain et al., 2016).
Memorability consists in the user’s ability to interact with a system again and reestablish
proficiency after a period of not using it (Nielsen, 1993). A human’s information processing
has a limited capacity and any additional memory used in tasks other than the one at hand
may reduce resources for comprehension (Dalal et al., 2000). Making objects, actions, and
9options visible to the user and allowing the user to recognize rather than recall certain
functions and interactions minimizes their memory load (Nielsen, 1994a).
Errors can and will happen when engaging with user interfaces. Good usability allows and
also helps users to recognize, diagnose, and recover from errors (Nielsen, 2012). People like
to feel they are in control and not bound by a system’s limits. This leads to the need to
provide users with an option to go back on their actions in the case of an unwanted reaction
(Nielsen, 1994a). In other words, supporting undo is important. This said, small errors or
slips can be prevented by constraining users’ actions and by limiting their choices
(Laubheimer, 2015a). The number of slips can also be reduced by providing users with
predefined choices and presenting them with a ready list of possible interactions as opposed
to have them form their own input (Laubheimer, 2015a). Eliminating or checking for error-
prone conditions and presenting users with a confirmation option before they commit to an
action is part of a well-designed system. Similarly, small unwanted mistakes can be
prevented applying thoughtful and easy to understand design such as providing users with
a preview before applying major changes or before performing destructive actions
(Laubheimer, 2015b).
Satisfaction considers how pleasant a device or a system is to use and what emotions it
evokes in the user (Nielsen, 1993). According to Jordan (1998), pleasure and the feeling of
satisfaction when using a product play a big role in usability when interacting with a service.
The happier the user is while using the system, the easier it is to sustain the user’s attention
and interest in using the system which then facilitates any ongoing learning process.
2.1.1 Universal design
Since the goal is to make services usable by everyone, the principle of universal design is
adopted. Universal design strives to design products, environments, and services to be
usable by all people and to the greatest extent possible, without the need for adaptation or
specialized design (Mace, 1988). In other words, the designs insist on being universally
applicable to all people of all ages, abilities, and skill levels. A service should be designed to
meet the needs of all people who wish to use it (National Disability Authority, 2021). This
does not mean that a special requirement is met to benefit only a minority of the population
but instead if the service is accessible, usable, convenient, and a pleasure to use, everyone
will benefit (Centre for inclusive Design, 2020). Supporting this, a study conducted by
Harrington et al. (2017) suggests that designing non-stigmatizing products and services for
users who have been shown to have the most difficulties in learning and adopting new
technologies, will conceivably result in products and services that are usable and therefore
adopted by a wider audience. For example, in the physical world there are lowered curbs at
crosswalks to provide easy passage for people in wheelchairs. Moreover, these design choices
also benefit other people using the crosswalk such as people riding bikes or parents pushing
their child’s stroller. A similar approach can be taken in the digital world. By lowering the
curb for people with limited capabilities, we assure everyone’s inclusion (Hesse, 1995). The
10aim is to create a structured environment to be equally accessible by all users, regardless of
experience level or physical and mental ability (Hesse & Shneiderman, 2007).
Universal design consists of seven principles established by The Center of Universal Design
(Connell et al., 1997). These principles, although initially crafted to be applied in architecture,
aim to educate all designers as well as consumers about the characteristics of more usable
products, environments, and services (Story et al., 1998). The principles, and the guidelines
within them, served as inspiration and were kept in mind during the planning of the
empirical study and the evaluation of the test results. Table 1 consists of each of universal
design’s seven principles, their definition, and a list of key elements that ought to be present
in a design that complies with the principle.
Table 1. Principles of universal design (Connell et al., 1997).
Principle Guidelines
1. Equitable Use. The design is useful 1a. Provide the same means of use for all
and marketable to people with diverse users: identical whenever possible; equivalent
abilities. when not.
1b. Avoid segregating or stigmatizing any
users.
1c. Provisions for privacy, security, and safety
should be equally available to all users.
1d. Make the design appealing to all users.
2. Flexibility in Use. The design 2a. Provide choice in methods of use.
accommodates a wide range of 2b. Accommodate right- or left-handed
individual preferences and abilities. access and use.
2c. Facilitate the user's accuracy and
precision.
2d. Provide adaptability to the user's pace.
3. Simple and Intuitive. Use of the 3a. Eliminate unnecessary complexity.
design is easy to understand, 3b. Be consistent with user expectations and
regardless of the user’s experience, intuition.
knowledge, language skills, or current 3c. Accommodate a wide range of literacy
concentration level. and language skills.
3d. Arrange information consistent with its
importance.
3e. Provide effective prompting and feedback
during and after task completion.
4. Perceptible Information. The 4a. Use different modes (pictorial, verbal,
design communicates necessary tactile) for redundant presentation of
information effectively to the user, essential information.
regardless of ambient conditions or the 4b. Provide adequate contrast between
user’s sensory abilities. essential information and its surroundings.
4c. Maximize "legibility" of essential
information.
4d. Differentiate elements in ways that can
be described (i.e., make it easy to give
instructions or directions).
4e. Provide compatibility with a variety of
11techniques or devices used by people with
sensory limitations.
5. Tolerance for Error. The design 5a. Arrange elements to minimize hazards
minimizes hazards and the adverse and errors: most used elements, most
consequences of accidental or accessible; hazardous elements eliminated,
unintended actions. isolated, or shielded.
5b. Provide warnings of hazards and errors.
5c. Provide fail safe features.
5d. Discourage unconscious action in tasks
that require vigilance.
6. Low Physical Effort. The design can 6a. Allow user to maintain a neutral body
be used efficiently and comfortably position.
and with a minimum of fatigue. 6b. Use reasonable operating forces.
6c. Minimize repetitive actions.
6d. Minimize sustained physical effort.
7. Size and Space for Approach and 7a. Provide a clear line of sight to important
Use. Appropriate size and space is elements for any seated or standing user.
provided for approach, reach, 7b. Make reach to all components
manipulation, and use regardless of comfortable for any seated or standing user.
user’s body size, posture, or mobility. 7c. Accommodate variations in hand and grip
size.
7d. Provide adequate space for the use of
assistive devices or personal assistance.
2.1.2 Universal design in eHealth
Universal design is particularly important in the eHealth sector as it can make services more
inclusive and usable for vulnerable user groups (Kadir & Jamaludin, 2013; Ruzic & Sanfod,
2017; Irish, 2020). That being said, usability is perhaps the biggest barrier stopping older
adults from fully embracing the use of digital channels when it comes to healthcare (Zapata
et al., 2015). Bad usability of a system can also lead to users not adopting the use of the
service or abandoning it completely (Greenhalgh et al., 2017; Harrington et al., 2017). One
solution to this issue is to involve users in the design process. User involvement results in
more accurate user requirements and in improved user satisfaction (Kujala, 2003). Similarly,
studies by Raviselvam et al. (2016) and Gkouskos & Burgos (2017) show that universal
design has the potential to empower users and that supporting user participation can
improve the overall usability of products and services. Ruzic & Sanfod (2017) concluded that
even if a set of guidelines are intended to promote universal design, they still need to be
validated by applying them and evaluating them with users with a wide range of abilities.
However, since the two user groups involved in this study do not represent the average user
of an eHealth application, their role and involvement in the design process may be minimal
or nonexistent. Oudshoorn et al. (2020) suggest that the majority of studies do not take into
consideration the preferences or needs of people with mild intellectual disabilities when it
comes to eHealth applications. This inconsideration applies to older adults as well (Ware et
al., 2017).
122.2 Accessible services for vulnerable users
While universal design focuses on designing products, environments, and services that are
usable by the widest range of users operating in varying situations, accessibility strives to
make products, environments, and services usable by people with disabilities as well as older
adults (Petrie & Bevan, 2009). One of the groups affected by the digitization of health
services is the intellectually disabled (Lussier-Desrochers et al., 2017). Intellectually
disabled individuals have been observed to encounter significantly more difficulties with
finding information on the internet as well as understanding information from online
sources compared to people from the general population (Alfredsson Ågren et al., 2020).
Moreover, it has been estimated that around 1% of the general population has some degree
of an intellectual disability (Patel et al., 2020). In Finland, this ratio is roughly the same,
accumulating to nearly 50 000 Finns being classified as intellectually disabled (Westerinen,
2018; Kehitysvammaliitto, 2021; Tukiliitto, 2021). Studies show that the majority of people
with an intellectual disability have a mild intellectual disability, meaning that they may have
limitations when it comes to conceptual development and daily living skills but they can still
do basic self-care and function in ordinary life with minimal support (National Academics
of Sciences, Engineering, and Medicine, 2015; Patel et al., 2018). Developing more accessible
services would allow intellectually disabled individuals to find information concerning their
health more easily (Alfredsson Ågren et al., 2020).
Both of the previously mentioned user groups, the mildly intellectually disabled and older
adults, can be considered as vulnerable user groups as Vines et al. (2013) state that people
can be vulnerable in a number of ways, for example, physically, cognitively, and socially.
Existing literature shows that these two user groups face, among other things, cognitive
challenges when interacting with technology (Marston et al., 2019; Setchell et al., 2021).
Consequently, studies suggest that not being able to use digital technology, or in other words
being excluded to an extent due to the lack of digital capabilities, can in some cases lead to
social exclusion as well (Martin et al., 2016; Seifert et al., 2018; Seifert et al., 2020).
Furthermore, people with intellectual disabilities tend to have problems in the field of
language meaning that they have a reduced understanding of speech as well as a reduced
ability to communicate (Parnell, 2014). Such limitations impact the person’s access to
information and therefore lead to a lack of health-related knowledge (Larson et al., 2005).
Moreover, this makes it difficult for people with intellectual disabilities to make assessments
and decisions regarding their health needs (Feldman et al., 2015; Shogren, 2017). This is
why some intellectually disabled people rely on caregivers when it comes to health-related
decision-making (Geukes et al., 2019). Nevertheless, eHealth has the potential to offer
opportunities to support people with mild intellectual disabilities in different contexts of
their daily lives (Oudshoorn et al., 2020). Giving people with intellectual disabilities the
opportunity to make their own decisions about daily matters, makes them feel more
empowered and in control of their own life (Wass & Safari, 2020).
13Studies show that people with intellectual disabilities can benefit from eHealth applications
in the same way as the rest of the population (Raspa et al., 2018; Watfern et al., 2019).
However, this requires some additional aspects to be considered in order to facilitate the
users’ adaptation to digital healthcare systems. The Matching Person & Technology model
(Scherer & Craddock, 2002) is used to assist people in selecting the most appropriate
support solution for a certain individual. According to this model, there are three main areas
that need to be assessed for eHealth to be effective: 1) the environmental factors influencing
use, 2) the consumer’s needs and preferences, and 3) the functions and features of the
eHealth application. Following this, Oudshoorn et al. (2020) lists three main aspects related
to using eHealth in order to support people with mild intellectual disabilities in performing
daily activities.
First, Oudshoorn et al. (2020) conclude that the people around the user have a significant
impact on how the user sees and adapts the system. Their research shows that people around
a mildly intellectually disabled individual are rarely involved in the process of selecting and
adapting the use of an eHealth application. People with mild intellectual disabilities can have
difficulties with generalizing and applying their learned skills to a new context and they need
support throughout their life (Thompson et al., 2009). Therefore, it is essential to receive as
much support as possible from key stakeholders, whether they are family members or hired
support staff.
Second, Oudshoorn and her colleagues’ (2020) results show that when working with
intellectually disabled individuals, studies often neglect the user’s needs and preferences.
This lack of personalization impedes users from exploring their preferences and finding
suitable solutions. Using the needs and preferences of mildly intellectually disabled users as
a starting point can help find the most appropriate eHealth applications that cater to the
user’s needs bringing more value to the user. Each user is widely different and hence it is
essential to offer customization. Studies regarding assistive technologies and eHealth
emphasize the importance of personalization and its impact on the user’s ability to fulfil their
personal goals (Collins & Collet-Klingenberg, 2018; Boot et al., 2018; Frielink et al., 2020).
Third, Oudshoorn et al. (2020) imply that many eHealth applications can be implemented
following the conventions of universal design. Developing eHealth applications with the
guidelines of universal design in mind increases the likelihood of users adapting the use of
the systems in their daily life and it allows intellectually disabled people to benefit from
eHealth systems in the same way as the rest of the population, given that they are involved
in the design process from the very beginning (Raspa et al., 2018; Watfern et al., 2019). This
universal ease of use can make services easier to use even for people who do not use digital
means often or are not that familiar with technology (Gassmann & Reepmeyer, 2008).
Furthermore, a broader application of accessibility may benefit everyone, not only people
with disabilities.
143 Research methods
The research method used for this study was a usability test as testing with real users helps
uncover problems in the design and learn about the users’ behavior and preferences. In the
usability test, people from two different user groups, older adults and people with mild
cognitive disabilities, acted as test users and performed an evaluation with the help of
standardized clinical vignettes on the two most prevalent symptom checkers in Finland,
Omaolo symptom checker (Omaolo, 2021) and Klinik Access (Klinik Healthcare Solutions,
2021). The following sections describe the research approach and introduce the services
being tested and the participants involved in this study. Then, the usability evaluation
methods are presented after which the data analysis is described.
3.1 Research approach
This study was conducted as part of the DigiIN project, a project that strives towards a
socially inclusive digital society (DigiIN, 2021). It does this by creating practical solutions
which ensure that the social welfare and healthcare sector’s digital services are available and
accessible by everyone and by making information more accessible to decision-makers and
any other interested party. The DigiIN project is a cooperation between the Finnish Institute
for Health and Welfare (THL), Aalto University, University of Helsinki, University of
Jyväskylä, Laurea University of Applied Sciences, and Age Institute, aiming to prevent the
marginalization of vulnerable users as digital services become more prominent in society
thus requiring a more active role from the users themselves.
The study was conducted as a case study where the usability of two online symptom checkers
was evaluated in order to make the services more accessible to everyone. A case study helps
to understand a real-world scenario as well as take into account the specific conditions of
the case (Yin, 2002). Case study research utilizes selective sampling instead of random
sampling in order to achieve the most accurate and representative results regarding the
research problem and the focused user group (Easterbrook et al., 2008).
Nielsen (1993) argues that usability testing with real users is irreplaceable, since it provides
direct information about how people use the services and gives insight to their exact
problems with the interface being tested. The usability test is a qualitative test which helps
identify problems in the design of the service, uncovers opportunities to improve, and gives
insight to the users’ behavior and preferences (Moran, 2019). In other words, the goal of
usability testing is to improve the usability of the service being tested by uncovering its
problems. According to Dumas & Redish (1999), by observing the performance as well as
the comments of the participant while they complete the usability test, valuable information
is gathered about the current usability of the service. Dumas & Redish argue that asking the
opinion of the participant is also an important part of usability testing as this helps
understand how the user sees their experience with the service.
15Previous usability testing on eHealth applications has included data collection methods such
as questionnaires, task completion, interviews, and the think-aloud method to name a few
listed by Maramba et al. (2019). In this study, data was collected using a combination of the
think-aloud method, observations, a questionnaire, and a semi-structured interview. In
addition, standardized clinical vignettes were used as they provide some common scenarios
as to why people visit health centers. They also allow the classification of symptoms based
on their severity and make the results comparable with previous studies.
3.2 Online symptom checkers
Online symptom checkers are digital health services that allow users to seek health related
guidance (Chambers et al., 2019). They have existed for a number of years already and
became even more prominent during 2020 due to the COVID-19 pandemic as a way to
facilitate and help healthcare customers to self-diagnose and self-triage without the need of
physically going to the health center (Aboueid et al., 2021a). These artificial intelligence-
enhanced tools provide users with an initial diagnosis and triage based on the symptoms
they are experiencing or displaying (Tsai et al., 2021). Symptom checkers may also be used
to get suggestions of what are the next steps the user should take and they may offer some
self-care options in cases when the displayed symptoms are not too grave (Semigran et al.,
2015). Furthermore, some use them to self-diagnose before going to the health center while
others double check the symptoms afterwards to have a second opinion and to get further
information about the doctor’s diagnosis (Meyer et al., 2020). Typically, symptom checkers
present a series of questions where the user is asked about their symptoms. These answers
are then processed by the service’s artificial intelligence, making each diagnosis personal to
that specific user and their case. As an additional benefit, symptom checkers have the
potential to decrease the number of unnecessary medical visits (Chambers et al., 2019;
Kujala et al., 2020). The two most prevalent symptom checkers in Finland are Omaolo
symptom checker (Omaolo, 2021) and Klinik Access (Klinik Healthcare Solutions, 2021) and
they are the two services tested in this study.
Omaolo is a digital service and service channel for healthcare, which supports self-service in
personal care and directs patients to appropriate assistance when necessary (DigiFinland,
2020). The Omaolo symptom checker is composed of 16 specialized symptom checkers, each
specializing in a different part of the body, ranging from headaches to back pain. Each of the
symptom checkers asks the user a set of questions and then, based on the user’s answers,
suggests next steps the user should follow to address their issue. The user may also enter
their home municipality in which case the service will display the corresponding city’s
recommendations and refer the user to the nearest health center if the symptoms require it.
Much like Omaolo, Klinik Access is widely used in Finland. It allows users to take care of
their health concerns online by answering to a set of questions presented by the symptom
checker. Similar to the Omaolo symptom checker, Klinik Access first asks the user to locate
the ailment on the body. Once the user has chosen the location, more specific questions are
16presented to better understand the possible illness. In case the user cannot pinpoint the
symptom’s exact location, they may also choose a corresponding option stating no specific
location. The entered information acts as a preliminary questionnaire which the user’s
doctor can access, giving them time to familiarize themselves with the case before meeting
their patient. If the artificial intelligence-driven service deems the entered symptoms or
their combination serious, the user is urged to contact a health center for immediate medical
attention, assuring that the patients are directed safely and efficiently to the right point of
care (Klinik Healthcare Solutions, 2021). This helps relief the stress placed on the general
practitioners taking care of the patients.
This study was done in collaboration with the people behind Omaolo and Klinik Access. They
provided demo environments where the tests could be conducted ensuring that the fictitious
data entered into the systems would interfere with the systems’ function as little as possible.
After the usability tests’ results were analyzed, each of the service providers received their
own detailed report and presentation where they were able to present questions regarding
the participants’ interactions and experiences that they were more curious about.
3.3 Participants
The goal was to recruit at least eight participants for the study. Given the scope of the study
as well as the COVID-19 pandemic, around eight test participants was seen as a reasonable
number to provide an overview of the research problem and highlight the main usability
issues within the systems. Sinkkonen et al. (2006) argue that a usability test should include
three to six participants after which most of the major usability flaws are discovered.
Nielsen’s (1994b) study also shows that with just five participants, around 80% of main
concerns and problems can be found and with eight participants, like in this study, around
90% of the of the most prevalent issues would be brought to attention when incorporating
the think-aloud method.
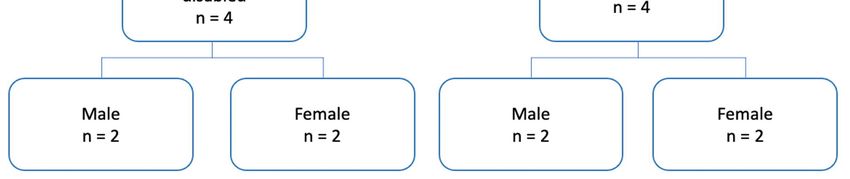
As the focus of the study was on people at risk of digital exclusion, the participants recruited
for the study consisted of a balanced mix of mildly intellectually disabled individuals and
older adults, four from each group respectively. Two of the four intellectually disabled test
participants were recruited from the Selkeästi meille-initiative, a joint project between The
Finnish Association on Intellectual and Developmental Disabilities (FAIDD) and
Kehitysvammatuki 57 ry. The other two intellectually disabled participants were recruited
from Väylä ry, a non-profit organization that aims to employ intellectually disabled
individuals and provide proper compensation to them for their work. Meetings were held
with the two establishments to discuss about any special arrangements the test participants
might require in order to make the test environment more suitable for them and more
representative of a real-world scenario. This included assistive technology and other details
that might have had to be taken into consideration. The test’s older adults were recruited by
utilizing personal contacts. They also had to satisfy the requirement of being at least 75 years
17old with knowledge of how to use a computer, making them potential users of the services
being tested.
Figure 1. Distribution of participants.
3.4 Usability evaluation
A variety of data collection methods and their combination were used to better understand
the research problem. Each method has its advantages and collecting data from different
perspectives using multiple methods helps offset the limitations of each method leading to
a more comprehensive understanding of the research problem (Easterbrook et al., 2008).
The methods used for data collecting were the think-aloud method, observations, a
questionnaire, and a semi-structured interview.
3.4.1 Thinking aloud
Participants were asked to say out loud what they were thinking during the tests regarding
the usability of the services and the overall user experience allowing for the recording of the
participants’ thoughts and opinions. They were encouraged to voice even the minute
problems they encountered while conducting the usability test. The think-aloud method
gives insight to how the participant sees and interprets things as well as the reason why they
see things in a certain way (Van Den Haak et al., 2003). The method also highlights issues
in the moment so the observations made by the participant are recorded even if the
participant forgets them later on. Since the usability tests were conducted remotely, the
think-aloud method is especially useful as non-verbal cues might be hard to detect over the
videocall (Vasalou et al., 2004).
183.4.2 Observation
Observation was used as a data collecting method during the usability test to perceive how
the participants interact with the services and to catch behavior patterns that the
participants might be unaware of. The test facilitator who observed the participants’ actions
and reactions live during the tests and then another time when watching the recording of
the test a day or two after the test had taken place took notes of any encountered issues. The
facilitator also kept track of the number of successfully completed tasks, number of errors
committed, amount of assistance required to successfully complete the tasks, and the time
it took to complete them. During the observation, the facilitator did not interfere with the
test unless the participant asked for assistance or was unable to proceed on their own in
which case the facilitator helped as was needed in order to allow the participant to continue
with their test.
3.4.3 Questionnaires
Three questionnaires were used in this study to collect data. These questionnaires helped to
get a more rounded picture of the participants and facilitate the comparison of the results as
all of the participants are asked the exact same questions in the same order. First, the
participants were asked to fill in a questionnaire regarding their background information
before the usability test (see Appendix A). The background information consisted of the
participant’s gender, age, the number of times they had visited a doctor during the last two
years, how many medical conditions diagnosed by a doctor they have, how many times they
have previously used digital healthcare services, and how often they use digital devices such
as smart phones or computers. These questions substantiated that the participants fit the
study’s target demographic concerning their age and ability to use an electronic device such
as a computer on their own.
In addition to the background questionnaire, the participants were also asked to fill in a
health literacy survey in order to establish the participants’ health literacy level. In this case,
health literacy is described as the ability of a person to gain access, understand, and then
apply resources to make decisions regarding their own health (Sørensen et al., 2013). Morse
et al. (2020) argue that health literacy is something that should be taken into consideration
when evaluating symptom checkers and that it is a metric that can be used to measure
whether using a symptom checker augments the understanding and management of the
user’s illnesses. An assessment about the health literacy of the participant also results in a
more accurate description of the participant as a user of the service (Aboueid et al., 2021b).
The first 16 questions of the complete European Health Literacy Questionnaire, HLS-EU-
Q47, address health care while the rest of the questions focus more on disease prevention
and health promotion (Jovanić et al., 2018). Therefore, a 16-question variation of the survey
was used instead of the complete questionnaire with 47 items as it was seen a more suitable
choice given the scope of this study (see Appendix B). This 16-question health literacy survey,
HLS-EU-Q16, is a 4-point Likert scale where the answering options range from “very
19difficult” to “very easy” and has also the option of “I don’t know” which, for the purpose of
collecting data, is interpreted as a missing answer (Eronen et al., 2019). The 16-question
variant has been shown to be a feasible option in a number of different countries as well as
when studies have included vulnerable user groups (Storms et al., 2017; Eronen et al., 2019;
Lorini et al., 2019; Bas-Sarmiento et al., 2020). The health literacy survey used was based
on the Finnish translation by Eronen et al. (2019).
After each of the usability tests, the participants were given a System Usability Scale (SUS)
questionnaire to measure the perceived usability of the system (see Appendix C). The SUS
questionnaire contains 10 questions on a 5-point Likert scale where the answering options
range from “Strongly agree” to “Strongly disagree” (Brooke, 1996). The scored answers
result in a numeric value that can be used to roughly compare the usability of different
systems or alternatively, it can be used to detect any improvement in the usability of a newer
version of the same system. According to Brooke (1996), this quick and quite effortless way
of assessing the services’ usability alternates between positive and negative questions in
order to avoid response bias as the participants need to think about the questions and cannot
simply mark the same answer for each question presented. Other versions of the SUS were
also taken into consideration in case the participants needed a cognitively easier and less
straining version of the questionnaire. Holden’s (2020) simplified SUS, aimed at the
cognitively impaired and older adults, as well as The Usability Metric for User Experience
Lite (UMUX-Lite) proposed by Lewis et al. (2013), which contains just two positive
questions using a 7-point Likert scale, were amongst the ones considered. However, these
were discarded after some consulting with the mildly intellectually disabled participants’
employers and the older adults’ family members when it was assured that the people
participating in the usability test would have no issues with the original and slightly lengthier
SUS.
3.4.4 Semi-structured interview
Since the usability test was conducted on a small scale, the focus of data collection was
mostly on gathering qualitative data rather than quantitative. Interviews fit this purpose as
they are useful for understanding a certain group of people’s needs, problems, ideas, and
expectations (Stickdorn et al., 2018). Similarly, interviews can help gather more ideas and
bring up points that might not have been addressed in the structured part of the study. There
are many types of interviews but the one seen as the most suitable for this study was the
semi-structured approach as it offers a mixture of more specific questions, that were
prepared prior to the interview, as well as open-ended questions, that address issues the
participants might have encountered during the test. Semi-structured interviews are
designed to obtain foreseen information along with possible unexpected types of
information (Seaman, 1999). They also give the participant the opportunity to express
themselves more freely and to further clarify why they liked or did not like certain design
choices and interactions encountered while performing the tests. In order to ease the
participant into the interview, they were simply asked what they felt about the test and then
20they were asked to comment on the services they had just tested, if they were easy to use, or
difficult perhaps, and if so, if they could elaborate on their remarks. Easing into the more
structured part of the interview gave the participants time to gather their thoughts and get
more comfortable to discuss about their experience. The questions for the structured part of
this study’s interview are partly influenced by the requests of the service providers and their
interests and can be found in Table 2.
Table 2. Interview’s questions.
Question
1 Would you use the service again in the future?
2 Was the summary and the instructions of what to do next clear enough?
3 Would you actually follow the instructions given?
4 Given the option, would you use the service using your phone?
3.4.5 Symptom vignettes
To assist the usability test and to avoid the need for participants to enter their personal
medical information into the services, each participant was given two standardized clinical
vignettes depicting ready symptoms. A total of six conditions with varying severity levels
were selected from a list composed by Semigran et al. (2015). Conditions with different
severity levels were chosen since people reportedly use symptom checkers in both urgent
and non-urgent situations (North et al., 2012). Following the suggestions made by Semigran
et al. (2015), the vignettes chosen were from three categories of triage urgency: conditions
which require emergent care, conditions which require non-emergent care, and conditions
where a medical visit is seen unnecessary and which can be treated with self-care. The
selected conditions were translated from English to Finnish and simplified in order to make
them more understandable and relatable by the participants. The different symptom
vignettes used, their urgency, a more detailed description of which vignette was given to
which participant, and the order in which participants tested the two symptom checkers can
be found in Appendix D. During the tests, the participants were only given the symptom
description, the correct diagnosis and the symptoms’ urgency were omitted in order to
influence the outcome as little as possible.
3.5 Study setup
The test sessions were held in the Microsoft Teams video conferencing platform which
allows screen sharing, screen recording, and voice recording. This made interacting with the
participants easy and created an opportunity to observe the participant and their actions
while they conducted the usability test. The test sessions were primarily one-on-one
21You can also read