VALUE CHAIN ANALYSIS FOR ORGANIC MILK IN FLANDERS
←
→
Page content transcription
If your browser does not render page correctly, please read the page content below
UNIVERSITEIT GENT

FACULTEIT ECONOMIE EN BEDRIJFSKUNDE
                 ACADEMIEJAAR 2013 – 2014

   VALUE CHAIN ANALYSIS FOR
   ORGANIC MILK IN FLANDERS

    Masterproef voorgedragen tot het bekomen van de graad van

             Master of Science in de Bedrijfseconomie

                         Bram Pauwelyn

                        onder leiding van

                       Prof. dr. X. Gellynck
PERMISSION
Ondergetekende verklaart dat de inhoud van deze masterproef mag geraadpleegd en/of
gereproduceerd worden, mits bronvermelding.
Undersigned gives permission to put this thesis to disposal for consultation and to copy parts of it for
personal use. Any other use falls under the limitations of copyright, in particular the obligation to
explicitly mention the source when citing parts out of this thesis.
Gent, 20 mei 2014
Bram Pauwelyn
IIABSTRACT
As competition more and more involves the entire value chains, close collaboration among all chain
members becomes increasingly important in order to reach higher levels of value chain performance
(VCP). Emerging markets of the organic food sector are typically suffering from inefficiencies and
ineffectiveness which results in mismatches between supply and demand in the supply chain. This
makes them a suitable study object to explore attributes that could contribute to higher value chain
integration (VCI). For this study, the organic dairy sector in Flanders was chosen as focal chain.
As a first step of the study, we mapped the Flemish organic dairy chain to illustrate its limited scope
as only 18 farmers were active in this sector. 17 of them were member of Biomelk Vlaanderen, a
cooperative that functions as the link between primary production and processing and marketing of
milk. This producer cooperative protects farmers’ interests, mainly pursuing higher profit margins at
farm level. Organic dairy products in Flanders are mainly sold by big mainstream retailers and health
food shops, reaching only a very limited part of the Flemish consumers.
Based on scientific literature regarding value chain analyses and the theoretical framework, three
conceptual value chain subjects contributing to VCI were proposed. Using a case study approach, we
explored the influence of these on VCI and consequently of VCI on VCP.
Firstly, ‘goal alignment’ appeared to be a main prerequisite for close collaboration among chain
partners. Nevertheless, in our study we found that all interrogated chain actors were pursuing
different goals hampering higher levels of VCI. Farmers also indicated profit and risk to be unequally
shared in favor of downstream actors, while processors stated to earn a fair part of total chain
revenues. According to us, the cooperative should act as a negotiator in aligning all chain actors’
goals by sharing the same core values and mission.
Secondly, we concluded hybrid ‘governance structures’, as in practice in the studied chain, are most
suitable for organic chains. Spot markets are associated with too much uncertainty, while strict
vertical integration would harm farmers’ independence. Hence, an inverse U-shaped relationship was
found between the level of governance structure formalization and VCI.
Thirdly, despite the fact that chain actors generally seemed satisfied about the level of ‘information
sharing’, insufficient qualitative and reciprocal communication happened on chain level, especially
towards consumers. Knowledge sharing could be considered as important in achieving VCI. However,
in the studied chain it seemed better to leverage this correlation reversely using close collaboration
as an enabler for better chain communication, which in turn could improve again VCI.
IIIFinally, VCI was found to have a strong positive influence on VCP. The Flemish organic dairy sector
could benefit strongly from this relationship as until now their limited scope hampered the chain’s
well-functioning. Due to close collaboration among chain members with truly strategic chain
partners, fostered by the cooperative, the essential sector growth could be achieved providing the
solution for the high logistic costs and low profit margins for farmers.
IVSAMENVATTING
Een nauwe samenwerking tussen alle ketenpartners wordt steeds belangrijker om een hogere
ketenperformantie (VCP) te bereiken aangezien er steeds meer onderlinge competitie optreed
tussen ganse ketens. Groeiende markten zoals de biologische voedingssector lijden typisch onder
een inefficiënte en ineffectieve ketenwerking wat resulteert in een gebrekkige afstemming van vraag
en aanbod. Dit zorgt ervoor dat dit soort ketens een ideaal studieobject vormen om na te gaan welke
kenmerken kunnen bijdragen tot een betere geïntegreerde keten (VCI). Voor deze studie werd
gekozen voor de Vlaamse biologische zuivelketen.
Vooreerst werd deze keten volledig in kaart gebracht waarbij vooral zijn beperkte omvang opvalt
aangezien slechts 18 biologische melkveehouders in Vlaanderen actief zijn. Hiervan zijn er 17
verenigd zijn in een coöperatieve, Biomelk Vlaanderen, dat de link vormt tussen de primaire
producent en de verwerkers en verkoop. De coöperatieve verdedigt de belangen van de
landbouwers wat voornamelijk neerkomt op het streven naar hogere winstmarges op
boerderijniveau. Biologische zuivelproducten worden in Vlaanderen vooral verkocht door grote
retailers en natuurvoedingswinkels en worden slechts door een zeer beperkt deel van de Vlamingen
geconsumeerd.
Gebaseerd op wetenschappelijke literatuur omtrent ketenanalyses en het opgestelde theoretische
framework, werden drie conceptuele keteneigenschappen vooropgesteld die aan VCI zouden
bijdragen. Via een case study-aanpak werd de invloed van deze eigenschappen op VCI verder
onderzocht en uiteindelijk ook de invloed van VCI op VCP.
Als eerste leek ‘het afstemmen van bedrijfsdoelstellingen’ een basisvoorwaarde voor een nauwe
ketensamenwerking. Toch zagen we in onze studie dat de ketenpartners andere doelen nastreefden
ten koste van VCI. Landbouwers gaven ook aan dat winsten en risico’s oneerlijk verdeeld zijn in het
voordeel van verdere ketenpartners, terwijl verwerkers wel dachten een eerlijk deel van de winst op
te strijken. De coöperatieve moet hierin volgens ons als moderator optreden om alle doelstellingen
op elkaar af te stemmen door gemeenschappelijke waarden en visie voorop te stellen.
Ten tweede concludeerden we dat hybride ‘governance structuren’, zoals het geval in deze keten,
het meest geschikt lijken voor biologische voedingsketens. Afzonderlijke transacties creeën te veel
onzekerheid, terwijl een stricte verticale integratie de landbouwers hun onafhankelijkheid te zeer
zou beperken. We kunnen besluiten dat er een omgekeerd U-vormige relatie bestaat tussen de mate
van formalisatie van de governance structuur en VCI.
VDesondanks het feit dat ketenpartners in het algemeen tevreden waren over het ‘delen van
informatie’, stelden we als derde punt toch onvoldoende kwalitatieve en wederzijdse ketenwijde
communicatie vast, vooral naar de consument toe. Kennisverspreiding kan worden beschouwd als
een belangrijke voorwaarde voor VCI. In deze keten bleek echter beter de omgekeerde relatie te
worden gebruikt waarbij een nauwe samenwerking zou moeten leiden tot een betere communicatie.
Tot slot konden we besluiten dat VCI een sterk positieve invloed heeft op VCP. De Vlaamse
biologische melkketen zou in sterke mate van deze relatie kunnen profiteren aangezien tot nu hun
beperkte omvang de werking van de keten had bemoeilijkt. Dankzij een nauwe verticale
samenwerking met strategische partners, gecoördineerd door de coöperatieve, zou de noodzakelijke
groei van de keten kunnen worden bereikt. Het zou een oplossing bieden voor de hoge logistieke
kosten en lage winstmarges voor de landbouwers.
VIACKNOWLEDGEMENTS
Several months I have been working on this master thesis, demanding quite some efforts and time
making my study as I now present it to you. Nevertheless, this would not have been possible without
the support of some people I would like to thank here.
First of all, I thank my promotor, prof. dr. Xavier Gellynck, for offering me the opportunity to write
my thesis handling about this interesting topic of organic food chains. Further, my honest thanks go
to my ever enthousiastic tutor, dr. Manoj Kumar Dora, who always had a clear answer on my
questions while giving me the freedom to do what I thought that would be the best. Next, also
Mulugeta Damie Watabaji should be thanked since the interesting discussions concerning our similar
research topics clarified lots of things for me while defining my research questions and composing
my questionnaire.
I should also thank all the farmers, the people of the cooperative and the processors who offered
some part of their precious time to complete my questionnaire and to provide some feedback on
their answers during the further interviews. A special thank goes to Nadine Pillaert of BioMelk
Vlaanderen and farmer Jakob Devreese for their additional help clarifying some of the topics
concerning the functioning of the Flemish organic dairy chain. Moreover, I thank Liese, Heide and
Caroline for reading my thesis and marking all my foolish mistakes.
Studying five years at Ghent University graduating as Bio-engineer did not seem sufficient to me.
Therefore, I truly want to thank my parents for offering me the possibility to complete this additional
study in Business Economics. Without their financial, emotional and social support, you would not be
reading this master thesis. I would also like to thank my girlfriend and all other friends and family for
making the last 6 years such a nice time.
VIICONTENT
ABSTRACT ....................................................................................................................................................... III
SAMENVATTING ............................................................................................................................................... V
ACKNOWLEDGEMENTS .................................................................................................................................. VII
CONTENT....................................................................................................................................................... VIII
LIST OF ABBREVIATIONS ................................................................................................................................... X
LIST OF FIGURES .............................................................................................................................................. XI
LIST OF TABLES ............................................................................................................................................... XII
CHAPTER 1. INTRODUCTION ....................................................................................................................... 1
1.1. GENERAL INTRODUCTION ............................................................................................................................. 1
1.2. ORGANIC AGRICULTURE ............................................................................................................................... 2
1.3. ORGANIC MILK PRODUCTION......................................................................................................................... 3
1.4. RESEARCH JUSTIFICATION ............................................................................................................................. 4
1.4.1. Gaps in organic food supply chains ............................................................................................... 4
1.4.2. Gaps in value chain research ........................................................................................................ 5
CHAPTER 2. THEORETICAL BACKGROUND .................................................................................................. 7
2.1. VALUE CHAIN ............................................................................................................................................. 7
2.2. VALUE CHAIN ANALYSIS ................................................................................................................................ 8
2.2.1. Dimensions of a value chain.......................................................................................................... 9
2.2.1.1. Technical structure and chain actors ........................................................................................................ 9
2.2.1.2. Territorial structure .................................................................................................................................. 9
2.2.1.3. Input-output structure ........................................................................................................................... 10
2.2.1.4. Governance structure ............................................................................................................................. 10
2.2.2. Mapping ...................................................................................................................................... 12
2.2.3. Upgrading ................................................................................................................................... 12
2.3. VALUE CHAIN INTEGRATION ........................................................................................................................ 12
2.4. VALUE CHAIN PERFORMANCE ...................................................................................................................... 13
2.4.1. Efficiency ..................................................................................................................................... 14
2.4.2. Flexibility ..................................................................................................................................... 14
2.4.3. Responsiveness ........................................................................................................................... 14
2.4.4. Food quality ................................................................................................................................ 15
2.5. THEORETICAL FRAMEWORK......................................................................................................................... 15
2.5.1. Strategy-structure-performance (SSP) paradigm........................................................................ 15
2.5.2. Transaction Cost Economics (TCE) .............................................................................................. 15
2.5.3. Resource Based View (RBV) ........................................................................................................ 16
2.5.4. Social capital theory .................................................................................................................... 16
2.6. RESEARCH OBJECTIVES ............................................................................................................................... 16
2.7. CONCEPTUAL FRAMEWORK ......................................................................................................................... 21
VIIICHAPTER 3. RESEARCH METHODOLOGY ................................................................................................... 22
3.1. DATA COLLECTION .................................................................................................................................... 22
3.2. DATA ANALYSIS ........................................................................................................................................ 23
CHAPTER 4. RESULTS AND DISCUSSION .................................................................................................... 24
4.1. RESPONDENTS ......................................................................................................................................... 24
4.2. THE FLEMISH ORGANIC DAIRY CHAIN............................................................................................................. 24
4.3. CONCEPTUAL SUBJECTS .............................................................................................................................. 29
4.3.1. Goal alignment............................................................................................................................ 29
4.3.2. Governance structure.................................................................................................................. 32
4.3.3. Information sharing .................................................................................................................... 34
4.3.4. Value chain integration ............................................................................................................... 37
4.3.5. Value chain performance ............................................................................................................ 38
4.4. RESEARCH QUESTIONS ............................................................................................................................... 40
4.4.1. RQ1: Goal alignment positively affects value chain integration ................................................. 40
4.4.2. RQ2: Governance structure positively affects value chain integration ....................................... 42
4.4.3. RQ3: Information sharing positively affects value chain integration .......................................... 43
4.4.4. RQ4: Value chain integration positively affects chain performance ........................................... 43
CHAPTER 5. CONCLUSION ......................................................................................................................... 47
5.1. GENERAL CONCLUSION .............................................................................................................................. 47
5.2. LIMITATIONS AND FURTHER RESEARCH .......................................................................................................... 48
REFERENCES ................................................................................................................................................... 49
APPENDIX: QUESTIONNAIRE .......................................................................................................................... 55
IXLIST OF ABBREVIATIONS
BMV BioMelk Vlaanderen
IT Information Technology
RBV Resource Based View
SSP Strategy-Structure-Performance
TCE Transaction Costs Economics
VCI Value Chain Integration
VCP Value Chain Performance
XLIST OF FIGURES
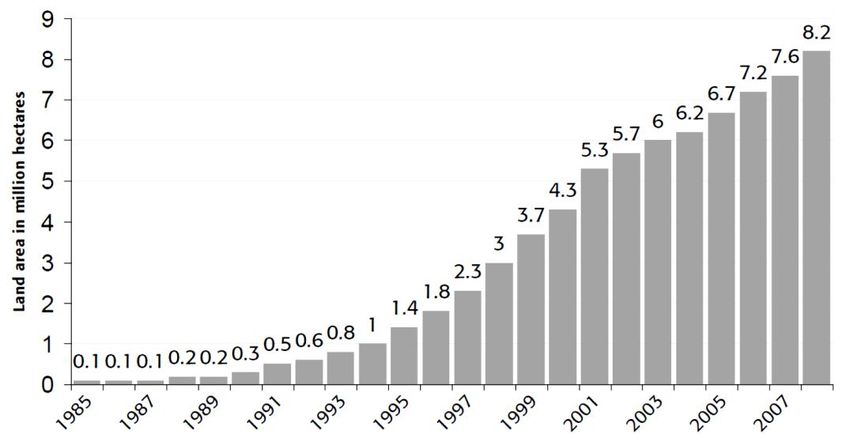
Figure 1: Evolution of the organic area in the EU (1985-2008)............................................................... 3
Figure 2: Simplified agri-food chain. ....................................................................................................... 7
Figure 3: A supply chain (from the view of a processor) in a food supply chain network. ..................... 8
Figure 4: Vertical coordination continuum ........................................................................................... 11
Figure 5: Conceptual framework........................................................................................................... 21
Figure 6: Relationships within the focal chain: farmer-cooperative (F-C) and cooperative-processor
(C-P)........................................................................................................................................ 22
Figure 7: Mapped supply chain for organic milk and dairy in Flanders (in bold and underlined: the
focal chain in this study). ....................................................................................................... 28
Figure 8: Chain goals’ importance score given by farmers, cooperative and processors. .................... 32
Figure 9: Relationship between governance structure and value chain integration. ........................... 42
XILIST OF TABLES
Table 1: Governance structures in increasing order of formalization. ................................................. 11
Table 2: Questionnaires received compared to sent. ........................................................................... 24
Table 3: Overall scores for the conceptual subjects concerning the relationships in the focal chain
(left: farmer-cooperative; right: cooperative-processor). ..................................................... 29
Table 4: Means for each of the statements concerning goal alignment (left: farmer-cooperative; right:
cooperative-processor). ......................................................................................................... 30
Table 5: Means for each of the statements concerning governance structure (left: farmer-
cooperative; right: cooperative-processor). .......................................................................... 34
Table 6: Means for each of the statements concerning information sharing (left: farmer-cooperative;
right: cooperative-processor). ............................................................................................... 35
Table 7: Means for each of the statements concerning value chain integration (left: farmer-
cooperative; right: cooperative-processor). .......................................................................... 37
Table 8: Means for each of the statements concerning value chain performance (left: farmer-
cooperative; right: cooperative-processor). .......................................................................... 39
XIICHAPTER 1. INTRODUCTION
1.1. General introduction
Organic food is more and more trending nowadays, caused by consumers’ increasing interest in
environmental issues and hence sustainable agriculture. Offering these products to consumers
implies that entire organic supply chains should be set up tracking back from retailer over processor
till farmer. However, since these value chains are still rather new, no real long-term relationships
could yet been established among chain partners. Nevertheless, economic competition increasingly
stresses the importance of the well-functioning of the entire supply chain, so proper supply chain
management became a major source of competitive advantage. Regarding their novel character,
organic agri-food chains seemed very suitable in exploring how value chains could further improve
their performance by pursuing a closer chain collaboration.
In Chapter 1, a general introduction is given concerning organic agriculture and more specifically
organic milk production in Flanders. Subsequently, gaps in organic food supply chains and value chain
research are explored, justifying our research topic.
Chapter 2 firstly provides a theoretical background concerning value chains and value chain analysis
where the dimensions of a value chain and ultimately value chain mapping and upgrading are
clarified. Next, an extensive explanation is given of the two main concepts of this study: value chain
integration (VCI) and value chain performance (VCP). Based on the theoretical framework, four
research questions were proposed. They are summarized in the conceptual framework, being the
basis of the study.
The research methodology in Chapter 3 explains the case study approach implemented in this study
and specifies which chain actors were selected to complete the questionnaire.
The first part of Chapter 4 clarifies the flowchart of the Flemish organic dairy chain as a result of the
mapping procedure. In the second part, we display and discuss the results as answered by the
respondents in the questionnaires. This is accompanied by additional remarks obtained during
further in-depth interviews and data found in scientific literature. By doing so, we examined the five
conceptual subjects and their relationships as stated in the research questions.
Chapter 5 explores to what extent we could confirm the proposed research questions and
summarizes this in some general conclusions. Finally, the limitations of this study are mentioned
together with recommended future research about this topic.
11.2. Organic agriculture
Organic agriculture could be defined as a production system sustaining health of soils, ecosystems
and people. It relies on ecological processes, biodiversity and cycles adapted to local conditions,
rather than the use of inputs with adverse effects. Organic farming combines tradition, innovation
and science to benefit the shared environment, promote fair relationships and a good quality of life
for all people involved (IFOAM, 2010). To achieve this, organic agriculture relies on some basic
practices such as a wide crop rotation, no or restricted use of pesticides, mineral fertilizers,
antibiotics and food additives, no use of genetic modified organisms and appropriate animal
husbandry practices ensuring animal welfare. However, organic farming should be seen as a part of a
larger organic supply chain, comprising feed production but also food processing, distribution and
retailing (EU, 2014).
Organic products are always produced, processed, distributed, labelled and controlled according to
very strict rules imposed by the EU in the basic Council Regulation on organic agriculture (EU No
834/2007) and its later adaptations. Only when official certification bodies declare compliance with
this legislation, the European organic logo may be used (EU, 2014).
Aertsens (2011) stated that the organic food sector is an emerging market because (1) this market
has a lot of growth potential as it is still relatively small in comparison with the conventional food
market (e.g. in 2011 the organic area represented only 5.31% of total used agricultural area in the
EU; in Flanders this was only 0.8%) (Samborski et al., 2014). (2) The European and Flemish policies
and legislation about organic agriculture keep on changing. (3) Demand as well as supply has been
growing fast last decades, as shown in Figure 1 for the EU from 1985 till 2008. Even after 2008, it
continued increasing but at a lower trend (2008: +13% vs. 2012: +6%) which could be explained by
the declining amount of area in the transition period. The total organic agricultural area in the EU in
2012 was around 10 million hectares. The European countries having the highest shares of organic
agriculture are Liechtenstein, Austria, Estonia and Sweden (Willer and Lernoud, 2014). In Flanders,
the organic area increased between 2008 and 2012 to 5065 ha (+44.6%), inducing an increase in
market share of organic food products to 1.6% (+24.6%) (Samborski et al., 2014).
2Figure 1: Evolution of the organic area in the EU (1985-2008) (Source: Willer and Kilcher, 2010).
1.3. Organic milk production
The production of organic milk in the EU is mainly located in Austria and Denmark. In 2010, only 1.1%
of the total milk production in Flanders was produced in an organic way, representing around
6 million liters (Verbeke, 2012). The total amount of organic dairy cattle in Flanders could be seen as
relatively constant, varying around 1200 cows (AMS, 2014) or 0.4% of all Flemish dairy cattle
(Samborski and Van Bellegem, 2013). Farmers normally get a price premium for their organic milk to
compensate for the extra costs, which always varies around an average of 5 euro/100 liter (Verbeke,
2012). Within the Flemish organic market, dairy products in 2013 accounted for 21% of the sales,
representing 54 million euros (+3.8% in comparison with 2012) (Samborski et al., 2014).
Based on BioForumVlaanderen (2013), we discuss some of the main principles of organic animal
production. Firstly, animals should originate from an organic farm and indigenous breeds with
natural reproduction are preferred. Next, dairy cattle feed should contain minimally 60% organic
roughage, which is mainly produced on the farm itself according to the rules of organic crop
production. Also very important is the land-based principle, meaning the density of grazing animals is
restricted to prevent over-fertilization (e.g. max 2 dairy cows/ha). Housing of the animals should
meet biological and ethological requirements about space (6 m²/dairy cow) and clean air; stanchion
barns or permanent housing are not allowed. Animal health should be maintained through
prevention of diseases since the use of antibiotics is only allowed in exceptional cases. Finally,
organic and conventional animals may never be kept together.
31.4. Research justification
1.4.1. Gaps in organic food supply chains
Reviewing scientific literature, several gaps in the effectiveness and efficiency of organic food supply
chains could be detected. Baecke et al. (2002) concluded that it is difficult for actors in organic
chains, characterized by high risk and uncertainty, to find and trust each other. Although provided
that more resources are used to strengthen the organic chain, these authors stated it has a lot of
possibilities. The non-optimal working of the supply chain implies supply does not satisfy demand in
terms of price-quality ratio, availability and diversity of products (Kottila et al., 2005).
Because organic farming is small scale and rather fragmented, transaction costs associated with it are
typically larger than those of conventional farming. Organic prices also differ more between farmers
compared with the conventional market due to great differences in farmers’ access to sales channels
(Offermann and Nieberg, 2000).
Transparency, good communication and supporting relationships are crucial in organic agriculture
because this is an information intensive sector. However, these mechanisms appeared to be missing
in the past, impeding the adoption of organic farming (Baecke et al., 2002). Lack of knowledge and
widespread misconceptions about organic products by all chain actors hinder the well-functioning of
the chain (Aertsens, 2011).
This lack of transparency and communication, together with long conversion periods, causes organic
markets to suffer from boom and bust cycles. This implies supply and demand are not always aligned,
resulting in extra uncertainty and hampering a smooth market growth (Aertsens, 2011). This cyclic
pattern could also be seen extensively in the Flemish organic milk market since periods of excesses
alternate with periods of shortages. In the past demand was larger than supply in Flanders (Aertsens,
2011), but since the beginning of 2012 the Flemish organic milk production is under pressure
because lots of British and French farmers switched from conventional to organic farming. Therefore,
there was an increase in milk import from the UK while export from Flanders to France hampered
(Verbeke, 2012). On the other hand, Verbeke (2011) concluded that due to a raising European
demand and a stagnating supply, opportunities will occur for Flemish organic dairy farmers.
All these factors of a suboptimal supply organization lead to high price differentials compared with
conventional food products, impeding the potential growth of the organic food market. This suggests
that improved organic supply chains would result in decreasing consumer prices, closing consumers’
attitude-behavior gap and thus enlarging adoption by consumers (Aertsens, 2011).
4A demand higher than supply, generally the case for the organic market during the past decades,
does not only imply missed chances but could even cause marketing problems for domestic organic
farmers. Processors and/or retailers are forced to act with foreign organic actors, in the long term
neglecting domestic producers meaning the latter have to sell their products as conventional
products (Baecke et al., 2002). These authors stress the importance of a cost-effective supply chain
for organic farmers to be competitive (i.e. with low transaction costs, easy access to information,
more trust…). These conditions could be set more easily when more farmers would adopt the
principles of organic agriculture; however, at the same time, the absence of these conditions thwart
massive adoption (Baecke et al., 2002).
Kottila et al. (2005) summarized the problems in organic food chains as such: imbalance between
supply and demand, high operational costs, lack of cooperation between chain actors, incompatibility
of goals, lack of information flow and poor supply reliability. These authors therefore stated research
is needed to encourage stronger collaboration between organic chain actors.
1.4.2. Gaps in value chain research
Nowadays, agreement exists about shifting from competition between companies to competition
between supply chains (Molnar, 2010) and from internal self-efficiency to value chain efficiency
(Olhager and Selldin, 2004). Customers’ present requirements about consistent and on-time delivery
demand for some kind of integration within these supply chains to win the competition (Mentzer et
al., 2001). Previous studies already identified several factors enhancing or inhibiting integration (e.g.
Fawcett and Magnan, 2002, Pagell, 2004). However, no consensus exists about how exactly value
chain integration can be measured, mainly resulting from the many different meanings given to the
term “integration“ (Mentzer et al., 2001, Pagell, 2004, Fabbe-Costes and Jahre, 2008). Fabbe-Costes
and Jahre (2008) mentioned the need for more understanding in the concept of integration and its
dimensions and implications.
Secondly, Fabbe-Costes and Jahre (2008) concluded from their review that various researchers
agreed that more integration would lead to better performance, though not all studies found this to
be confirmed. According to them, this ambiguity mainly originates from the fact that different studies
used different performance concepts. Next, they also concluded many studies agreed with ‘the more
the better’, but only a very few could really prove this relationship. This implies that the impact of
integration on chain performance needs to be further investigated, as mentioned by many authors
(e.g. Olhager and Selldin, 2004, Fabbe-Costes and Jahre, 2008).
5Next, most studies discussing supply chain analyses focus on the performance of individual firms
within a supply chain. Only a few investigated the performance on dyadic level (i.e. between two
firms). However, there is a need to look beyond this dyadic level and to focus on the real level of
supply chain with a minimum of three connected firms performing together (Molnar, 2010). Despite
the fact that many agreed with this statement, only a very few studies really addressed the triadic
level (Fabbe-Costes and Jahre, 2008). Kotilla and Rönni (2008) stated that also for studies concerning
organic food markets, research on the level of the complete chain was hardly done before.
Moreover, research on corporate governance was done frequently before, while supply chain
governance is a topic that is hardly investigated (Crișan et al., 2011)
Furthermore, most studies addressing the supply chain level only collected data from one firm of the
triadic: the focal company (Molnar, 2010). Since supply chain management is a complex matter, it
would be better to collect data from a minimum of three firms within the supply chain, asking each
actor questions about their upstream and downstream partners (Spekman et al., 1998).
These factors, together with those mentioned above about gaps in organic supply chains (see 1.4.1),
explain why research about the value chain of organic farming could be interesting. Despite many
agreed with this statement, most studies investigating organic markets approached it from the
perspective of one actor only (farmers or consumers), leaving the whole chain perspective
unexamined (Kottila, 2010). The choice for the Flemish organic dairy chain in particular could be
justified when you know that an attempt to set up a cooperative for the organic milk production in
Flanders already failed in the past because they were not able to match supply and demand in the
market as a consequence of a lack of chain collaboration (Aertsens, 2011).
6CHAPTER 2. THEORETICAL BACKGROUND
2.1. Value chain
The value chain concept is a common used framework in research nowadays, but its origin dates
back to the French ‘filière concept’ of the 1960s (Faße et al., 2009). It was further developed by
Porter (1985), who distinguished two categories of value-adding activities in a company: primary and
support activities. However, he restricted his value chain to activities within a company, without
taking upstream and downstream activities into account (Faße et al., 2009). Gereffi (1994) developed
the global commodity chain and focused especially on governance structures referring to
institutional mechanisms and inter-firm relationships.
In literature, several different definitions of a value or supply chain were found. However, their core
message is always the same. A value chain involves three or more individuals or companies that
perform series of value-adding activities and processes to enable the flow of products, services,
finances, information and knowledge from their origin to their destination (Molnar, 2010, Arshinder
et al., 2008). Kaplinsky and Morris (2001) defined a value chain as “a full range of activities which are
required to bring a product or service passing through the intermediate phases of production to
delivery to consumers and final disposal after use”. Following this definition, the actors in a simplified
agri-food chain are input suppliers, farmers, processors, marketing and consumers (Figure 2)
(Springer-Heinze, 2004). According to Aramyan (2006), an agri-food chain is different from other
value chains due to three factors: (1) the biological nature of the production process, increasing the
variability and risk; (2) some specific characteristics of the product such as a limited shelf life; and (3)
the societal and consumer attitudes towards issues such as food safety, animal welfare or
environmental pressure. Typically an organic food chain is shorter, more locally oriented and with
more tightly connected chain actors as compared to conventional food chains (Kottila et al., 2005).
Input
Farmers Processors Marketing Consumers
suppliers
Figure 2: Simplified agri-food chain (Source: Springer-Heinze, 2004).
However, in reality supply chains are much more complex. First, there tend to be many more links in
the chain than these shown in Figure 2 (Kaplinsky and Morris, 2001). For example, the processing
industry does not rely on farmers only, but also on suppliers of packaging, electricity, water and so
7on. Next to that, the hierarchical structure of a supply chain is not always followed. Actors could skip
one or more stages, resulting in a shorter chain. This is truly the case for agri-food chains where
some farmers sell their products directly to the consumers in farm shops. Secondly, several supply
chains can be linked to each other because companies typically act in a number of different chains
(Kaplinsky and Morris, 2001). In our case of the agri-food chain, this means that a certain farmer for
example does not always sell to the same processor. Therefore, Van Der Vorst (2006) posited the
food supply chain network concept (Figure 3) where each firm is positioned in a network layer and
belongs to one or more of all the possible supply chains in this network. He also stated that other
actors, such as the government, influence the organization of the supply chain.
Figure 3: A supply chain (from the view of a processor) in a food supply chain network (Van Der Vorst, 2006)
2.2. Value chain analysis
In the last few years, the analysis of a value chain as a research methodology is used more and more
(Faße et al., 2009). The scope of value chain analysis, which focuses more on the dynamics of linkages
within the whole chain, is much broader than those of traditional economic and social analyses
(Kaplinsky and Morris, 2001). Value chain analyses provide an overview and a better understanding
of the economic reality of the production process. It facilitates the identification of constraints to
growth and competitiveness and it explains relationships and linkages among buyers, suppliers and
market actors (Alexander, 2012). This information could be used in strategic decisions to develop
joint visions and selecting possible upgrading strategies. Governments could use value chain analysis
to plan supportive actions and to monitor environmental impacts (Springer-Heinze, 2007).
82.2.1. Dimensions of a value chain
Gereffi (1994) distinguished five different dimensions of a value chain that could be used in analyses:
technical structure, chain actors, territorial structure, input-output structure and governance
structure. The analysis of these dimensions should give information about the production process,
the participants at each stage, the locations of each stage, how stages are linked, who has which
benefits, etcetera (Kodigehalli, 2011).
2.2.1.1. Technical structure and chain actors
The technical production process can be separated into five stages, each with its own actors: input
supply, primary production, processing, marketing and consumption (Kodigehalli, 2011). However,
some of these stages may be subdivided, while others can be combined or compressed (McCormick
and Schmitz, 2001).
In the case of milk production, input supply comprises everything a farmer needs for the production
of milk, such as feed, machinery, veterinarian practices, dairy semen... The primary production is the
production of the milk itself on the dairy farm. However, lots of this milk is converted into other dairy
products such as cheese or butter in the processing step. The different actors in this stage vary
according to the volume and quality of the product and the complexity of the production process
(Schipmann, 2006). Marketing holds the transportation and distribution of the final products. Though
direct farm selling exists, most of the time logistic companies, food corporations and supermarket
chains are used, especially when the amount and quality requirements are high. The last stage (i.e.
consumers) becomes more and more important since food markets are consumer-driven, meaning
customer demand is determining the kind, amount and quality of the goods produced (Schipmann,
2006).
2.2.1.2. Territorial structure
The territorial structure is defined as “the geographic concentration or dispersion of production and
marketing” (Stamm, 2004). It analyzes the geographical location of the different stages of a value
chain (Kodigehalli, 2011). For this study, the area was restricted to Flanders. Nevertheless, for
example a processor could also sell its dairy products to foreign retailers, resulting in an international
chain. In general, McCormick and Schmitz (2001) distinguished global, national, regional and local
value chains, all characterized by a respectively smaller geographic distribution.
92.2.1.3. Input-output structure
Stamm (2004) defined the input-output structure as “tangible (raw materials, intermediate goods)
and intangible (knowledge) flows linked together in the process of value creation”. This structure
gives an overview of (1) the amount and quality of a good required by one stage to fulfill the
requirements of the next stage; (2) the value created at each stage; (3) the profit distribution along
the different actors of the chain and (4) the information flow between the several stages (Kodigehalli,
2011). The flow of information and knowledge usually parallels the material flow, but its intensity
may differ (McCormick and Schmitz, 2001).
2.2.1.4. Governance structure
The governance structure of a value chain was defined as “the set of institutional arrangements
within which a transaction is organized” (McFetridge, 1994). Governance could be seen as the power
to define who does and who does not participate in the chain, the setting of rules of inclusion,
helping other actors in achieving the standard and monitoring their performance (Kaplinsky and
Morris, 2001). The mode of governance refers to the extent of control a lead firm has on the
exchange of information and production activities and thereby could influence the allocation of
resources and gains along the chain. Muradian and Pelupessy (2005) stated that power is exerted if
leading actors are able to set the conditions where others have to operate in.
Based on three variables (information complexity, ability to codify information and supplier
capabilities), Gereffi et al. (2005) distinguished five different governance forms: market coordination,
modular value chains, relational value chains, captive value chains and hierarchical value chains.
Peterson et al. (2001) posited the concept of the vertical coordination continuum which is a range of
possible governance structures, based on their level of coordination control and formalization (Figure
4). At the side of lowest control, there is the spot market, characterized by a make-or-buy decision
and ‘invisible hand’ coordination. The only control that firms could exercise here is to engage in price
discovery, so the control is almost entirely ex ante to the transaction. At the other side of the
spectrum, there is fully vertical integration, i.e. one organization that has the total control over the
transaction. The scope of control here is ex ante as well as ex post. Between those two extremes,
there are still three hybrid governance structures. In order of increasing control, Peterson et al.
(2001) called them specifications contract, relation-based alliance and equity-based alliance.
10Figure 4: Vertical coordination continuum (Source: Peterson et al., 2001).
However, the taxonomy used in this paper is adapted from Molnar (2010). Here, spot markets and
vertical integration are again the two extremes of the continuum. But this categorization
distinguishes more hybrid structures. In order of increasing coordination control, there are non-
contractual relationships with non-qualified and with qualified partners, contractual relationships,
relation-based alliances and equity-based alliances. Table 1 gives an overview of the definitions of
the different governance structures according to Molnar (2010).
Table 1: Governance structures in increasing order of formalization (adapted from: Molnar, 2010).
Spot market
When our company does business with our supplier/ customer each transaction (price, quantity,
quality etc.) is negotiated individually
Non-contractual relationship with non-qualified partner
Doing business with our supplier/ customer is based on trust and it is not a prerequisite that we know
in advance whether our supplier has a qualification/third party certification
Non-contractual relationship with qualified partner
Doing business with our supplier/ customer is based on trust but it is a prerequisite that we know in
advance whether our supplier has a qualification/third party certification
Contractual relationship
Our relationship with our supplier/ customer is based on a written contract (price, quality, delivery time,
etc.)
Relation-based alliance
Our company and our supplier/ customer develop common business ideas
Equity-based alliance
Our company and our supplier/ customer combine resources (human, financial etc.) in joint projects
Vertical integration
Our company and our supplier/ customer are fully integrated (financial, organizational)
112.2.2. Mapping
An important initial step when conducting a value chain analysis is mapping. The purpose of the
mapping procedure is to define the boundaries of the value chain and to identify all actors. By doing
so, the product flow can be determined and all intra-chain relations become visible (Faße et al.,
2009). However, since in practice there are many possible links (see 2.1), the entire mapping of a
whole supply chain could be very hard.
2.2.3. Upgrading
According to Stamm (2004), upgrading is “the process that enables a firm or any other actor of the
chain to take on more value intensive functions in the chain, make itself harder to replace, and thus
appropriate a larger share of the generated profits”. With the information from a value chain
analysis, four possible ways of upgrading could be followed. Firstly, process upgrading is making the
transformation of inputs into outputs more efficient. Secondly, choosing more sophisticated product
lines is called product upgrading. The third form is functional upgrading, meaning you improve your
functional position. The final option is sectorial upgrading, i.e. choosing a new value chain (Kaplinsky
and Morris, 2001).
2.3. Value chain integration
Value chain integration (VCI) is very important in supply chain management which in fact is even
predicated on VCI. Well-managed supply chains are those where all value creating processes are
aligned aiming at providing the highest level of customer value, meaning all processes of the value
chain are integrated (Pagell, 2004). The main drivers of the rise of VCI are (1) the information
revolution; (2) the increased levels of competition, creating more demanding customers and demand
driven markets; and (3) the emerge of new types of inter-organizational relationships (Handfield and
Nichols, 1999)
Therefore, VCI is a phenomenon studied extensively in literature in various ways (reviewed by e.g.
Frohlich and Westbrook, 2001); however, a unified definition of VCI does not exist. We try to define it
as the degree to which chain actors strategically collaborate with each other through synchronization
of their intra- and inter-organizational activities. Therefore, they coordinate their operational,
logistical and planning database with the aim of increased performance in order to maximize value
for the end customer (Villena et al., 2009, Fawcett and Magnan, 2002, Flynn et al., 2010). The main
advantage Villena et al. (2009) mentioned, is the access and use of knowledge and resources from
chain partners allowing them to better exploit and improve their capacities. However, the goal
12should always be realizing effective and efficient flows of products, services, information, money and
decisions (Flynn et al., 2010).
Studies revealed various perspectives of the dimensionality of VCI, reviewed by Flynn et al. (2010).
They argued that ultimately VCI can be broken down into three dimensions: external (customer and
supplier) and internal integration. External integration, i.e. collaboration and alignment of strategies
and processes between different chain actors, involves coordination of core competences with
critical customers (forward) and with critical suppliers (backward) (Bowersox et al., 1999). Internal
integration refers to the degree a firm structures its own strategies into collaborative and
synchronized processes. Both, internal and external integration, are important since the former
stresses all firm’s operations should function as a whole, while the latter emphasizes on interactive
relations with suppliers as well as customers (Flynn et al., 2010). An extended type of integration is a
complete forward and backward integration from the suppliers’ supplier till customers’ customer.
However, this kind of VCI was perceived as very rare and could be seen as a more theoretical ideal
(Fawcett and Magnan, 2002). Finally, it should be mentioned that all these kinds of VCI are called
“vertical integration”, i.e. between consecutive actors in the chain. Moreover, also “horizontal
integration” could occur where competitors on the same chain level start working together to
outperform others (Barratt, 2004).
2.4. Value chain performance
Value chain performance (VCP) is the overall measure of the performance of a whole chain,
depending on the performance of the individual actors (Aramyan et al., 2007). According to Van der
Vorst (2000), VCP is the extent to which the supply chain meets consumers’ requirements about the
relevant performance indicators and at which total cost it does so.
Literature describes several models to assess VCP, of which the main models were reviewed by
Aramyan et al. (2006). First, the SCOR® model combines reliability, cost, responsiveness and asset
measures to provide a guidance for the possible performance metrics. A second model is the
Balanced Scorecard, using a financial, customer, business process, innovation and technology
perspective. Next, Activity Based Costing enables companies to more accurately assess the costs of
specific products or customers. Multi-Criteria Analysis establishes preferences between several
options according to a set of objectives the company identified. Life-Cycle Analysis uses detailed
measurements of input use and environmental pressure in the entire supply chain. Finally, Data
Envelopment Analysis measures the efficiency of a company relative to those of competitors.
13According to Hannus (1993), adapted from Korpela et al. (2001), VCP measurement should reflect the
objectives of the main stakeholders of the chain. This means that it should comprise financial as well
as operational performance indicators. These authors suggested using three categories of indicators:
efficiency, flexibility and responsiveness. However, due to the perishability of food, Aramyan et al.
(2006) suggested adding food quality as a fourth performance category when analyzing agri-food
chains. Each category contains more detailed indicators, obtained by Aramyan et al. (2006) from the
review of several other studies, which could be used on organizational level as well as on supply
chain level (Aramyan et al., 2007).
2.4.1. Efficiency
Efficiency measures how well resources are used (Lai et al., 2002) and mainly indicates the financial
performance. It could contain several indicators such as production, logistic or transaction costs,
profit, return on investment and data about inventories (Aramyan et al., 2006). In this thesis we
included logistic costs and profit as indicators for efficiency. Logistic costs could be seen as the
operating and opportunity costs that could be influenced by logistic decisions and by the integration
of management practices and activities throughout the logistic chain (Perona et al., 2001). Profit is
defined as the positive gain from an investment or business operation after subtracting all expenses
(Aramyan et al., 2007).
2.4.2. Flexibility
Flexibility refers to the extent to which the supply chain can respond to a changing environment and
to specific consumer requests (Beamon, 1998). Possible indicators for flexibility are consumer
satisfaction, volume flexibility, delivery flexibility and number of late orders. Here we chose to use
customer satisfaction (i.e. ratio of satisfied to unsatisfied customers) and volume flexibility (i.e. the
ease to change output levels of the products produced) (Aramyan et al., 2006).
2.4.3. Responsiveness
Responsiveness aims at providing the requested products with a short lead time (Persson and
Olhager, 2002). The indicators for responsiveness that Aramyan et al. (2007) suggested, were fill rate,
product lateness, customer response time, lead time, shipping errors and customer complaints.
However, in this thesis we only used customer complaints and lead time, i.e. duration between
sending/getting a request until the delivery of the goods or service (Gunasekaran et al., 2001).
142.4.4. Food quality
According to the framework of Luning et al. (2002), food quality could be divided into product and
process quality. The former contains factors such as sensorial properties and shelf life, product
safety, health and convenience, while indicators for the latter could be production system
characteristics (e.g. pesticide use, animal welfare…), environmental friendliness and marketing
aspects. The indicators used here were product safety, i.e. degree to which the product does not
exceed acceptable levels of pathogenic organisms or chemical and physical hazards (Molnar, 2010),
environmental friendliness, i.e. referring to the use of packaging, water, energy… (Aramyan et al.,
2007), and attractiveness, i.e. the product’s appeal according to customers (Verbeke et al., 2009).
2.5. Theoretical framework
Supply chain management gained more and more attention in research and has been approached
from many different academic perspectives. The complexity of today’s value chain makes it almost
impossible to explain its functioning with one single theory. Therefore, the main concepts of
following important theories are considered relevant for our research topic.
2.5.1. Strategy-structure-performance (SSP) paradigm
The SSP paradigm of strategic management states that a firm’s strategy, including its external factors,
influences the corporate structure and processes which will help the firm to achieve its desired
performance (Galunic and Eisenhardt, 1994). This paradigm acknowledges the importance of
communication to create trust and close relationships among the chain actors (Hutt et al., 2000). VCI
is one of the most popular strategies to compete in present markets since it is no longer possible to
succeed as a single, isolated company. Fortuin (2007) stated that chain strategies should be
formulated based on common goals, so these goals should be aligned across the partners of an
integrated value chain.
2.5.2. Transaction Cost Economics (TCE)
Each transaction implies ex ante costs (e.g. costs for drafting or negotiating) and ex post costs (e.g.
set-up and running costs associated with the governance structure) (Fynes et al., 2004). These
transaction costs are characterized by their asset specificity, the frequency of the transaction and the
uncertainty involved (Williamson, 1985). These factors, together with the characteristics of the chain
actors (i.e. bounded rationality and opportunistic behavior), influence the governance structure to be
adopted (Slangen et al., 2008). This means that good governance of transactions makes it possible for
the partners to realize mutual gains on their cooperation (Verhaegen and Van Huylenbroeck, 2002).
15You can also read