Recommendations on Zero Ratings in the Value-Added Tax System - INDEPENDENT PANEL OF EXPERTS FOR THE REVIEW OF ZERO RATING IN SOUTH AFRICA ...
←
→
Page content transcription
If your browser does not render page correctly, please read the page content below
2018

  Recommendations on Zero
Ratings in the Value-Added Tax
             System

                 6 August 2018

  INDEPENDENT PANEL OF EXPERTS FOR THE
  REVIEW OF ZERO RATING IN SOUTH AFRICA

  RECOMMENDATIONS TO THE MINISTER OF FINANCE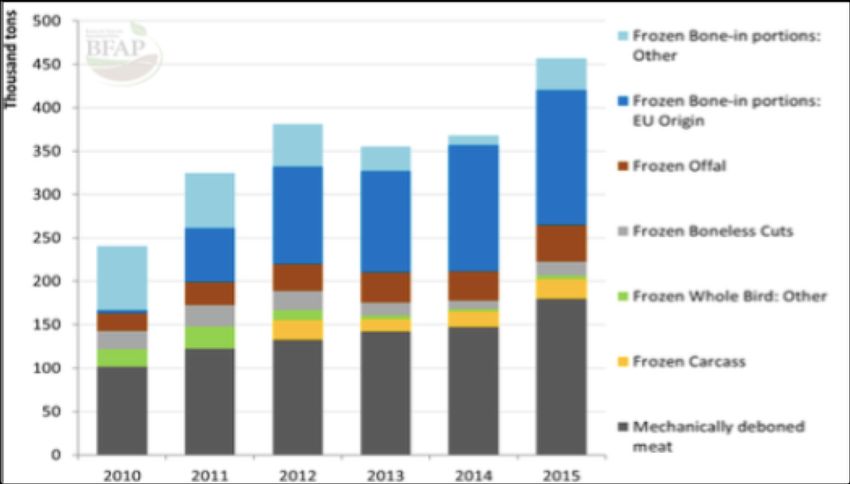
Contents
1     EXECUTIVE SUMMARY ................................................................................ 7
2     INTRODUCTION ........................................................................................... 9
    2.1     BACKGROUND..........................................................................................................................................9
    2.2     TERMS OF REFERENCE ...........................................................................................................................9
    2.3     COMPOSITION OF THE PANEL ........................................................................................................... 10
    2.4     CONSULTATIONS .................................................................................................................................. 11

3     A GUIDE TO EVALUATING TAX POLICY ............................................... 12
    3.1     ASSESSING TAX POLICY PROPOSALS.................................................................................................. 12

4     PROCESS AND METHODOLOGY ............................................................. 15
    4.1     THE TAX REVENUE LANDSCAPE ...................................................................................................... 15
    4.2     PRINCIPLES ............................................................................................................................................ 16

5     DATA ANALYSIS ........................................................................................... 23
    5.1     AIMS ........................................................................................................................................................ 23
    5.2     METHODOLOGY ................................................................................................................................... 23
    5.3     RESULTS OF THE DATA ANALYSIS ..................................................................................................... 30

6     ANALYSIS OF EIGHT ITEMS REVIEWS FOR ZERO RATING ............. 40
    6.1     BREAD..................................................................................................................................................... 40
    6.2     WHITE BREAD FLOUR AND CAKE FLOUR (CONSIDERED COLLECTIVELY) ............................... 43
    6.3     SCHOOL UNIFORMS.............................................................................................................................. 48
    6.4     BABY FORMULA (MILK-BASED BABY FOOD) .................................................................................... 50
    6.5     INDIVIDUALLY QUICK FROZEN POULTRY PARTS ........................................................................... 53
    6.6     SANITARY PADS ..................................................................................................................................... 57
    6.7     NAPPIES .................................................................................................................................................. 60

7     RECOMMENDATIONS ............................................................................... 63
    7.1     ITEMS RECOMMENDED FOR ZERO RATING ..................................................................................... 63
    7.2     ITEMS NOT RECOMMENDED FOR ZERO RATING ............................................................................ 64
    7.3     DISAGREEMENT ON OTHER ITEMS ................................................................................................... 64

8     ALTERNATIVE WAYS TO MITIGATE THE VAT INCREASE ............... 66
    8.1     IN-KIND SUPPORT PROGRAMMES ...................................................................................................... 67
    8.2     NUTRITIONAL SUPPORT ...................................................................................................................... 67
    8.3     PROVISION OF SANITARY PRODUCTS................................................................................................ 69
    8.4     CASH TRANSFER PROGRAMMES ......................................................................................................... 69
    8.5     LOWER POSITIVE VAT RATES ON SOME ITEMS .............................................................................. 73
    8.6     CONCLUSION: ........................................................................................................................................ 74

9     APPENDIX ..................................................................................................... 75
2
9.1 APPENDIX 1 – LIST OF SUBMISSIONS RECEIVED ............................................................................ 75
9.2 APPENDIX 2 – CALCULATION TABLES .............................................................................................. 80
9.3 APPENDIX 2 – EXTRACTS FROM THE NATIONAL FOOD AND NUTRITION SECURITY PLAN
FOR SOUTH AFRICA 2018 – 2023 ...................................................................................................................... 91
3Tables in the Report
Table 1: Comparison of total expenditure figures in the LCS with CPI and GDP data ............................... 25
Table 2: Data summary for eight items considered in detail (Rand million), 2018 prices ............................. 30
Table 3: Annual VAT revenue forgone (VAT relief) per household on existing zero-rated basket in Rand
(2018 prices), by decile ................................................................................................................................... 32
Table 4: VAT revenue savings on existing zero-rated basket in Rand (2018 prices), by decile.................... 33
Table 5: Proportional expenditure and equity gain ratio of eight vatable items, by decile ............................ 33
Table 6: VAT revenue paid per decile on vatable expenditure items in Rand (2018 prices), data, by decile
............................................................................................................................................................................ 34
Table 7: Annual Difference in VAT paid per household on existing vatable items in Rand (2018 prices),
LCS data, by decile .......................................................................................................................................... 34
Table 8: VAT paid (in Rand million) at 15% rate on selected existing vatable items, by decile ................... 36
Table 9: VAT paid (in Rand million) at 15% rate on selected existing vatable items, by decile, scaled for
LCS undercounting ......................................................................................................................................... 36
Table 10: Proportional expenditure on bread....................................................................................................... 41
Table 11: Flour price comparison .......................................................................................................................... 45
Table 12: Wheat production figures ....................................................................................................................... 46
Table 13: Proportional expenditure on flour ........................................................................................................ 46
Table 14: VAT revenue - flour................................................................................................................................ 46
Table 15. Data on school uniforms by decile ....................................................................................................... 49
Table 16: Revenue cost of zero rating proposals (R million in 2018 prices, adjusted for LCS undercount)
............................................................................................................................................................................ 64
Table 17: Cash transfers, 2018/19 fiscal year ....................................................................................................... 70
Table 18: Percentage of households receiving social assistance grants, by decile (2014/15) ........................ 71
Table 19: List of submissions received .................................................................................................................. 75
Table 20: Spending on zero-rated items as percentage of total consumption expenditure .......................... 80
Table 21: Benefit cost ratios for existing zero-rated items (VAT rate = 15%) ............................................... 83
Table 22: Total VAT relief on existing zero-rated items (Rand million), 2018 prices ................................... 85
Table 23: Submissions received .............................................................................................................................. 90
4Figures in the Report
Figure 1: Total gross tax revenue as a percentage of the GDP for the fiscal year and in constant Rand ... 15
Figure 2: Share of different types of tax in total revenue from 1990/2000 ..................................................... 16
Figure 3: Average household income and expenditure by decile, 2014/5 ....................................................... 17
Figure 4: Incidence of the increase in VAT by household decile, in 2017 Rand and compared to household
income and expenditure ................................................................................................................................. 18
Figure 5: Share of expenditure on zero-rated and other goods by decile, 2014/5 ......................................... 19
Figure 6: National budget deficit as percentage of the GDP, 1990 to 2018 ................................................... 21
Figure 7: The average difference in price between white and brown bread (600g and 700g loaves), 2000 to
January 2017..................................................................................................................................................... 22
Figure 8: Average household income and average household consumption expenditure by decile, April 2018
prices ................................................................................................................................................................. 26
Figure 9: Household spending on major expenditure group items as percentage of total expenditure, by
decile ................................................................................................................................................................. 27
Figure 10: Household spending on selected zero-rated items as percentage of total expenditure, by decile
............................................................................................................................................................................ 31
Figure 11: Equity gain ratio for existing zero-rated items .................................................................................. 32
Figure 12: Benefit cost ratios for existing eight vatable items (BCR1) ............................................................. 35
Figure 13: Average VAT relief on (existing vatable) items as percentage of average income: poultry, by
decile ................................................................................................................................................................. 37
Figure 14: Average VAT relief on (existing vatable) items as percentage of average income: white bread,
cake flour and bread flour, by decile ............................................................................................................ 38
Figure 15: Average VAT relief on (existing vatable) items as percentage of average income: disposable
nappies, sanitary products, school uniform, by decile............................................................................... 38
Figure 16: Average VAT relief on (existing vatable) items as proportional of average income: baby food
predominantly milk, by decile ....................................................................................................................... 39
Figure 17: Retail prices for chicken, average for 2017 ........................................................................................ 53
Figure 18: Expenditure on all poultry as percentage of household expenditure and estimated VAT paid on
IQF in 2017 Rand (a) by household expenditure decile ........................................................................... 54
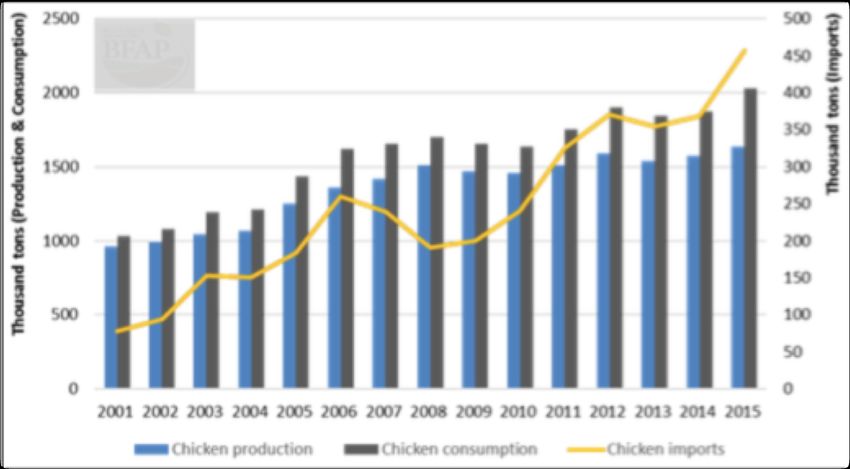
Figure 19: Chicken production, consumption and imports ............................................................................... 56
Figure 20: Composition of chicken inputs ............................................................................................................ 56
Figure 19: Expenditure on sanitary pads as percentage of household expenditure and estimated VAT paid
in 2017 Rand (a) by household expenditure decile .................................................................................... 58
Figure 20: Average household expenditure required to meet the need for sanitary pads of women aged 13
to 55 compared to reported expenditure by expenditure decile, in 2017 Rand .................................... 59
5Figure 21: VAT paid (in Rand million at 15%) .................................................................................................... 62
Figure 24. Cost of the increase in VAT by household expenditure decile, total and average per household
(in 2018 Rand terms) ...................................................................................................................................... 66
Figure 25. Share of households not receiving any grant by decile .................................................................... 72
Figure 26. UIF membership by earnings level, 2016 ........................................................................................... 73
61 Executive Summary
The Value-Added Tax (VAT) rate was increased from 14% to 15% on 01 April 2018, as announced in the
February 2018 National Annual Budget. Following the announcement of the VAT increase, concerns have
been raised, in Parliamentary and other processes, about its impact on poor and low-income households.
The increase in VAT would raise the tax on the poorest 50% of households by around R1.8 billion or an
average of R216 per household per annum.
Arising from a report of the Standing Committee on Finance and the Select Committee on Finance
(compiled after public hearings) and the statement of Cabinet of 28 February 2018, the Minister of Finance,
through the Davis Tax Committee, appointed a panel of independent experts to consider and review the
list of zero rated food items. The current VAT system allows for 19 basic food items to be taxed at a rate
of zero per cent in terms of section 11(1)(j) of the VAT Act, 1991. The zero rating of food items was
introduced as a means of providing some relief to low-income households which spend a relatively high
proportion of their income on the zero-rated items.
Based on public submissions (excluding duplications) a total of 66 expenditure items were considered – see
section 9.1 for a list of these items. Applying the criteria outlined below, the Panel identified eight
expenditure items for further consideration: baby food consisting predominantly of milk, bread flour, cake
flour, disposable nappies, poultry, sanitary products, school uniforms, and white bread.
The Panel assessed its proposals in terms of their projected effects on five main outcomes.
1. The overall tax system must remain as progressive as possible.
2. The extent to which VAT could become more progressive.
3. Zero rating should incentivise merit goods and address special needs for women, older people,
those living with disabilities and children if possible.
4. The cost of zero rating to the fiscus should not be excessively high.
5. The benefits of zero rating should not be absorbed by producers or retailers.
Based on its analysis, the Panel recommends that the following items are zero rated:
1. White bread
2. White flour
3. Cake flour
4. Sanitary products, combined with the free provision of sanitary products to women and girls.
5. School uniforms, subject to further investigation to clearly demarcate school uniforms.
6. Nappies
For all of the above items, the Panel recommends that National Treasury do further work to ensure that
the benefits of zero rating accrue to consumers and are not captured by producers due to high levels of
concentration in the product markets.
7The Panel recommends that the following items are not zero rated: baby food (predominantly milk), that
is baby formula, should not be zero rated based on public health recommendations.
The Panel was unable to reach consensus on whether or not to recommend the following products be zero
rated: individually quick frozen (IQF) poultry parts. This report gives the arguments behind each of these
proposals.
In addition to these recommendations, and in line with the Terms of Reference, the Panel provides
possibilities on alternative ways to mitigate the VAT increase, including;
1. Nutritional support
2. Free provision of sanitary products
3. Cash transfer programmes, especially through the social grants system
4. Lower (non-zero) VAT rates on the items that the Panel identified.
The Panel is of the view that expenditure programmes have a role to play in mitigating the impact of the
VAT increase on poor households. In theory, it would be cheaper to return the cost of the VAT increase
to the poorest households than to extend zero rating. The challenge is to ensure that expenditure actually
increases above the baseline, and that it is reaches the bulk of low-income households. In addition, as noted
above, experience internationally indicates that in the long run, improving income distribution requires a
strongly overall progressive incidence for taxation (although each individual tax instrument need not be
progressive), irrespective of the progressivity of government expenditure.
82 Introduction
2.1 Background
The Value-Added Tax (VAT) rate was increased from 14% to 15% on 01 April 2018, as announced in the
February 2018 National Annual Budget. The increase is expected to raise additional revenue of R22.9 billion
in 2018/19. It formed part of a package of other tax increases aimed at raising the R36 billion required to
provide sustainable funding for government programmes during 2018/19. Other components include
below-inflation adjustments to personal income tax brackets (particularly for higher-income individuals),
increases in excise duties, and a higher rate of estate duty imposed on wealthy individuals. In addition,
personal income tax rates, particularly for higher earners, were increased in the 2017/18 Budget, and the
VAT increase should be considered as part of a series of tax changes being enacted over a number of years.
The current VAT system allows for 19 basic food items to be taxed at a rate of zero per cent in terms of
section 11(1)(j) of the VAT Act, 1991. The zero rating of food items was introduced as a means of providing
some relief to low-income households which spend a relatively high proportion of their income on the
zero-rated items.
Since the increase in the VAT rate was announced, concerns have been raised, in Parliamentary and other
processes, about its impact on poor and low-income households. Following the report of the Standing
Committee on Finance and the Select Committee on Finance (compiled after public hearings) and the
statement of Cabinet of 28 February 2018, the Minister of Finance, through the Davis Tax Committee,
appointed a panel of independent experts to consider and review the list of zero rated food items. The
Terms of Reference were subsequently revised to broaden the scope to include non-food items.
2.2 Terms of Reference
The Panel’s terms of reference are as follows.
2.2.1 Evaluation of the current zero rated food items:
• Evaluate whether the current list of 19 zero rated food items achieves the objective for which it
was implemented, including examining the consumption patterns of low income households as
opposed to higher income households and the benefits derived from the zero rating by these
households respectively;
• Consider whether the policy objective underlying zero rating may be better achieved through
disaggregation of those items (which are currently expressed as broad categories) to more specific
targeting of products.
92.2.2 Consideration of inclusion of additional zero rated food items1:
• Identify any food items other than the current zero rated food items that may be considered for
inclusion for zero rating that will achieve the policy intention of providing relief to poor and low-
income households taking into account:
o The absolute and proportional benefit likely to accrue to low-income households,
o Market structure, to determine likelihood of producers passing benefit on to customers,
o Ease of administration,
o Potential for abuse,
o Estimated revenue loss.
2.2.3 Consideration of other mitigatory measures:
• To explore whether the outcome of zero rating of food items cannot be better achieved by a
government expenditure programme; whether a government expenditure programme is more
efficient in targeting poor and lower income households than the zero rating of food items; and
whether specific current government programmes as determined by or agreed with National
Treasury, can be better tailored to achieve the same or a better outcome than the zero rating of
food items.
2.3 Composition of the Panel
• Professor Ingrid Woolard (Chair)
• Ayabonga Cawe
• Professor Ada Jansen
• Dr Thabi Leoka
• Dr Neva Makgetla
• Lynn Moeng-Mahlangu
• Cecil Morden
• Prenesh Ramphal
• Professor Imraan Valodia
The Panel would like to thank Mashekwa Maboshe and David Francis for their research assistance in
compiling this report.
1 As noted above, non-food items were subsequently included in the Terms of Reference.
102.4 Consultations The Panel was initially required to deliver a report with recommendations to the Minister of Finance and the Davis Tax Committee (DTC) by 30 June 2018. This date was extended to provide the panel an opportunity for greater deliberations and consultations, and to account for changes in scope. The Panel requested inputs from the public and the NEDLAC constituencies both in written form and through meetings. This section outlines who spoke and wrote to the Panel and what suggestions, inputs and contributions they made to the process. The Panel received over 2 000 submissions and held meetings with various groups. The full list of all submissions received is available as Appendix 12. The Panel received submissions from individuals (like Kathy Bouwer who submitted an email on her Android device suggesting that flour, basic stationery and sugar should be zero rated). Kumbula Nogantshi from King William’s Town suggested that tinned fish products be zero rated to mitigate the impact of the VAT increase on lower income households. Many of the individual submissions included merit goods like school uniforms and books and necessities like sanitary products. The latter was undoubtedly the most suggested addition to the list of items already zero rated. Ramola Naidoo suggested some segments of small business such as professional services and those engaged in public benefit initiatives and the services they provide be exempt from value added tax. The Panel also received submissions from the private sector. Pieter Joubert from Tzaneen, a farmer and mango atchar manufacturer suggested that the Panel recommend that atchar be zero rated. His suggestion was also supported by a submission from the South African Subtropical Growers’ Association. Tiger Brands proposed that oats and sorghum be zero rated. The Panel also received submissions from industry bodies and producer associations. The Sorghum Forum proposed the zero rating of sorghum and sorghum products. The South African Poultry Producers Association’s submission suggested the inclusion of bone- in-chicken in the list of zero rated items. The commercial farmers’ association AgriSA suggested that all forms of meat (including pork and red meat), all forms of bread (brown and white) and flour be included in the list of zero rated items. Government entities also made their submissions. The Department of Finance in the North West Provincial Government recommended the inclusion of cereal products, meat products, milk, eggs, water and electricity and liquid fuels. The Panel was also able to receive a wide range of submissions from civil society bodies, including change.org, which suggested the removal of VAT on sanitary products. We had an in-person engagement with the Budget Justice Coalition (a coalition including Section27, the Alternative Information and Development Centre, Amandla.mobi, the Studies in Poverty and Inequality Institute, Pietermaritzburg Agency for Community Social Action, the Institute for Economic Justice and the Teddy Bear Clinic). 2 This list does not include the 1 397 submissions from Amandla.Mobi. However, the products detailed in these submissions were included in the Panel’s analysis. 11
The Panel also received presentations from the social partners at NEDLAC. These discussions brought
together the submissions of organized business and labour, community and government constituencies.
The Panel considered every submission, whether presented in meetings or in writing. The Panel evaluated
the various proposals against a common set of criteria, as described in section 5.3 below. For products that
enjoyed the greatest support, we undertook a more in-depth analysis, as described in section 6.

       3 A guide to evaluating tax policy
         3.1 Assessing tax policy proposals
The evaluation of VAT in this report requires a broader understanding of tax policies in general, in order
to understand how VAT fits into the tax mix. As Grown (2014) argues, VAT is a central aspect of the
revenue systems in over 125 countries, and its widespread use raises important questions of equity in
particular, along with efficiency and ease of administration. Indeed, VAT raises the challenge of how to
generate adequate public funding in a way that does not place an unfair and undue burden on the poor and
marginalised3.
Later in this report we present our detailed methodology for identifying and evaluating particular goods
which, if zero rated, would improve the equity of VAT in South Africa. However, before we do this, it is
important to give a brief exposition of the conceptual and theoretical approach to evaluating tax proposals
more broadly. When considering tax policy proposals, there are three main areas of concern, known as the
“Three Es” of tax policy: equity, efficiency and ease of administration. We discuss each of these very briefly
here.

                 3.1.1      Equity
When examining the equity of a tax, there are two main issues that we must consider: vertical and horizontal
equity. The focus of equity discussions, such as the debate about whether VAT is progressive or regressive,
is generally on vertical equity. A tax that is vertically equitable is one where the rich pay a greater share of
their income in tax. However, there is an additional equity consideration that must be addressed when
examining tax proposals: horizontal equity. Horizontal equity is concerned with the fact that households
which look the same, or very similar, in financial terms (i.e. they are in the same income decile) might in
fact be very different for a number of reasons. Broadly, these are: the gender composition of the household;
the number of dependents; the number of employed people in the household; and other differences such
as location. As Grown (2014) notes, indirect taxes such as VAT are often horizontally equitable, but
vertically inequitable. They are horizontally equitable because equally wealthy (or poor) people tend to

3 Grown, C. 2014. “Taxation and gender equality: a conceptual framework”, in Grown and Valodia (eds), Taxation and Gender
Equity. Routledge, London and New York.

12
consume equal amounts of goods and services and thus pay the same indirect taxes. They are vertically inequitable, however, because the poor generally spend a larger proportion of their income than do the rich, so they pay relatively more tax as a share of their income.4 While it is important, then, to take horizontal equity considerations into account, our focus is understanding how to evaluate the vertical equity considerations of VAT. One of the central considerations when evaluating taxes is to examine the distributional effects of each instrument. That is, to ascertain whether the incidence of the tax falls, proportionally, more on the rich, the poor or whether it is evenly spread across the income distribution. In this regard, there are two important aspects to consider: both how much of the tax burden (in absolute terms), falls on each income group and how much tax each income group pays relative to their ability to pay (their income). A tax is progressive if the relative tax burden increases as income increase, and thus falls mainly on the rich; regressive if the relative tax burden declines as income increases, and thus falls mainly on the poor; and neutral if the burden is spread equally across all income groups. There is a further and very important caveat to this analysis – while we need to know, for each tax instrument, whether it is progressive, regressive or neutral, what is ultimately important is that the tax system as a whole is progressive, even if some of its constituent parts are not. In the simplest terms, how do we calculate if a tax is progressive, regressive or neutral? To do this, we need to calculate the share of tax that each income group pays relative to its income (this is the tax incidence). By way of illustration, let us compare two citizens, A and B. A, a low-income South African earns R30,000 per annum and spends all her income because she finds it difficult to save. B, a high-income South African, earns R3 million per annum and, being wealthy, spends 50% of her income, saving and investing the rest. For simplicity, we assume that all of A’s and B’s expenditure is on goods that attract VAT. At 15% VAT, A pays R4,500 in VAT (15% of her income) while B pays R225, 000 in VAT (7.5% of income). In this scenario, VAT is said to be regressive because, although A contributes significantly more to the VAT pool, relative to their incomes, A is paying more than B. A is paying 15c in each Rand earned while B is paying only 7.5 cents in each Rand earned. In theory, and in this simple scenario, VAT is regressive because it is a tax on consumption and, compared to the rich, the poor consume a larger proportion of their income. Without any zero rating or exemptions, VAT is regressive if considered in isolation and without taking the life-cycle approach (for example, savings today will be spent later in life – consumption smoothing) for the reasons outlined above. However, in reality the impact of VAT is determined by how it is implemented and what goods are Vatable and which not. In South Africa, we have zero rating of a wide range of basic food items and petroleum products (paraffin, petrol and diesel) which means that VAT becomes less regressive and could even be more or less proportional. 4 Ibid. p.14. 13
3.1.2      Ease of Administration, and Efficiency
From an ease of administration perspective, VAT is a transparent tax – consumers can work out how much
VAT they are paying on any item. From an administrative efficiency perspective, there are two
considerations – how much money does the state collect for a small change in the rate of tax, and how
much of what the state should collect does it actually collect (i.e. how easy is it to evade the tax). VAT has
great advantages in this regard. The gap between what should be collected and what is actually collected is
very small indeed – it is much smaller in South Africa than in comparable countries. For these reasons,
VAT is an extremely attractive option when it is important to quickly and cost-effectively raise revenue.
VAT does, however, raise important equity considerations, which are outlined briefly above and discussed
extensively in this report. Finally, some economists argue that taxes should minimise the effects on
economic decision-making, and from that standpoint, VAT is desirable because it affects almost all
products equally.

14
4 Process and Methodology
The Panel aimed to balance the need to mitigate the impact of the VAT increase on the poor against the
need to maintain government revenue, and by extension, its service provision. This section first reviews the
trends in VAT revenue. It then describes the principles that guided the Panel’s analysis of the effects and
desirability of zero rating specific products. Those principles in turn inform both its evaluation of inputs
from the public and its economic analysis.

                                   4.1 The Tax Revenue Landscape
As the following graph shows, in the past fiscal year total tax revenue fell slightly from 25.9% of the GDP
to 25.8%. If we deflate total tax revenue by the GDP deflator, then it rose by 0.7%, or around half the rate
of population growth. By extension, revenue per South African dropped by about 0.8%.

Figure 1: Total gross tax revenue as a percentage of the GDP for the fiscal year and in constant Rand5

            Other tax revenue (a)       VAT revenue (a)       Total tax revenue as % of GDP (right axis)
    1 400                                                                                             60.0%

    1 200
                                                                                                      50.0%

    1 000
                                                                                                      40.0%
      800
                                                                                                      30.0%
      600    26.0%                                          24.9%   25.5%   25.9%   25.9%    25.8%
                       23.5%    23.9%    24.1%    24.5%
                                                                                                      20.0%
      400

      200                                                                                             10.0%

     -                                                                                                0.0%
             2008/09 2009/10 2010/11 2011/12 2012/13 2013/14 2014/15 2015/16 2016/17 2017/18

                                                   actual                                   revised

Source: Tax revenue calculated from National Treasury. Budget Review data in excel format. Table 2. GDP deflator calculated
from Statistics South Africa, GDP data. Tax revenue as % of GDP from South African Reserve Bank, Interactive dataset.

5   Deflated with the GDP deflator for the fiscal year
15
Although VAT revenues increased in current Rand terms, in constant terms (deflated by the GDP deflator)
they dropped some 2.1% from 2016/7 to 2017/8. In contrast, all other taxes taken together climbed 1.6%,
with income taxes rising 1.5%.
Figure 2 distils the trends in the share of gross tax revenue from VAT, taxes on income and property, and
other taxes (mostly various excise duties and tariffs). It shows that the share of VAT averaged 26.3% in the
five years to 2015/6, but then declined to 24.6% in 2017/8. The increase in the VAT rate is expected to
return the share of VAT in total tax revenues to 26.1% in the three years from 2018/9.
Figure 2: Share of different types of tax in total revenue from 1990/20006
Taxes on income, profits and property Value-added tax Other taxes
70%
60%
62.9%
61.4%
59.9%
59.8%
59.5%
58.8%
58.7%
58.7%
58.5%
58.2%
58.1%
57.7%
57.6%
57.3%
50%
40%
30%
27.2%
26.5%
26.4%
26.4%
26.3%
26.3%
26.0%
25.9%
25.7%
25.3%
24.8%
24.7%
24.7%
24.6%
20%
16.32%
16.01%
15.79%
15.61%
15.55%
15.36%
15.34%
15.28%
15.27%
15.21%
15.07%
14.98%
10%
12.45%
13.85%
0%
2008/09 2009/10 2010/11 2011/12 2012/13 2013/14 2014/15 2015/16 2016/17 2017/18 before after 2019/20 2020/21
actual actual revised 2018/19 budget projected
4.2 Principles
The Panel assessed its proposals in terms of their projected effects on five main outcomes.
1. The overall tax system must remain as progressive as possible, that is, the benefits of zero rating
should, proportionately, benefit the poor.
2. The extent to which VAT could become more progressive.
3. Zero rating should incentivise merit goods and address special needs for women, older people,
those living with disabilities and children if possible.
4. The cost of zero rating to the fiscus should not be excessively high.
5. The benefits of zero rating should not be absorbed by producers or retailers.
6 Figures for 2018/9 budget show projected revenue before and after changes in rates introduced in the 2018/9 budget.
164.2.1 The overall tax system must remain as progressive as possible
South Africa remains amongst the most unequal countries in the world. According to Statistics South
Africa's Living Conditions Survey, the richest 10% of households accounted for over 40% of all household
spending in 2014/5 and the next decile, for almost 20%. The poorest 30% accounted for less than 10% of
total household purchases. Due to under-counting in the Living Conditions Survey, as discussed in this
report, the expenditure figures in this figure are somewhat understated, mostly for spending on food.
Figure 3: Average household income and expenditure by decile, 2014/5
average income average expenditure
550 000 516 800
500 000
450 000
400 000
350 000
rands per year
300 000 267 700
250 000
200 000
159 800
150 000
104 600
100 000 67 300
80 900
50 400 56 000
42 400
50 000 35 600
18 500 28 000 34 300 40 600 47 300 57 500 73 600 108 500 191 700 432 600
-
poorest 2 3 4 5 6 7 8 9 richest
Source: Statistics South Africa. Living Conditions Survey 2014/5. Electronic database.
International experience shows that inequality at the very profound levels found in South Africa fuels social
and political divisions and conflict. That in turn slows down growth and reduces prosperity for all citizens.
As a result, the government has a role in ensuring greater equity both
• in the short run, through tax policies and spending on services that favour low-income
households, and;
• in the longer run, by promoting a more equitable economy in terms of both greater economic
opportunities and more equality in remuneration, asset ownership and education.
The standard measure of redistribution through the state is the extent to which taxation and expenditure
are progressive. A tax is defined as progressive when richer people pay a higher share of their income than
poor people, as is the case with personal income tax.
Currently, even with zero rating, according to the latest Living Conditions Survey the increase in the VAT
across the entire population is not regressive; it is more or less proportional. However, relative to the rich,
17VAT does place a proportionately heavy burden on some of the poor deciles who also have a low ability
to pay. In other words, given the high levels of inequality in South Africa, households which have low-
incomes may face a heavy burden of taxes due to the increase in VAT. As Figure 4 shows, from the fourth
to the eighth decile – that is, from incomes of around R40 000 a year to around R100 000 a year – as a
share of income the VAT increase has a lower impact on higher income households than on lower income
ones. For this range of income levels, better-off households pay more VAT in Rand terms, but that is still
a lower share of their income than for worse-off households.
Figure 4: Incidence of the increase in VAT by household decile, in 2017 Rand7 and compared to household income
and expenditure
increase in VAT (average annual cost to households)
Increase as % of household income (right axis)
Increase as % of household expenditure (right axis)
2 500 0.50%
0.47% 0.47% 0.47% 0.46%
0.46% 0.45% 0.45%
0.43% 0.42%
2 000 0.40% 0.40% 0.40%
0.37% 0.36%
0.34% 0.35% 0.34% 0.35%
0.33% 0.32% 0.31% 0.31%
1 500 0.30%
2018 Rand
0.25% 0.25%
1 000 0.20%
0.15%
500 0.10%
0.05%
105 163 201 238 273 321 395 568 964 2 140
- 0.00%
poorest 2 3 4 5 6 7 8 9 richest
Source: Statistics South Africa. Living Conditions Survey 2014/5. Electronic database.
It follows that increasing the VAT rate with the existing system of zero rating places a heavy burden on
low and middle income groups. International experience demonstrates that maintaining a strongly
progressive tax system overall is necessary for economic equality in the long run.
7 Estimated by reflating 2014/5 figures using average annual CPI.
18In 2017, Statistics South Africa set the food poverty line at R531 per person per month. Around one in
four households lived on incomes that were at or below the food poverty line, according to the 2017
General Household Survey. One in three South Africans lived below the lower-bound poverty line of R758,
which allows for limited non-food expenditure. In these circumstances, it is not desirable to broaden the
tax base by making low-income households pay more tax. Rather, the tax base should be broadened by
promoting more inclusive growth so that more households can afford to contribute to the fiscus.
4.2.2 Progressivity of VAT
Zero rating could potentially make the incidence of VAT more progressive – that is, as defined above, low-
income households should pay a smaller share of their income in tax than rich ones. That means that goods
should be zero rated if poor households spend a larger share of their income on them than rich ones do.
South Africa's unusually deep income inequalities mean that the majority of households can be considered
low income. The Panel agreed that zero rating should be measured in terms of the benefits to the poorest
70% of households (deciles one to seven). In functional terms, that means essentially combining
• households with no employed people, most of whom depend on remittances and social grants;
• informal-sector workers; and
• the working poor in the formal sector, such as farm and domestic workers.
In the event, as Figure 5 shows, the current list of zero-rated goods already targets the main products with
the most progressive impact – that is, where poor households spend a significantly larger share of their
income than rich ones, as the following graph shows. There are relatively few products remaining that
would improve the progressivity of the VAT.
Figure 5: Share of expenditure on zero-rated and other goods by decile, 2014/5
100%
90%
80%
70%
% of expenditure
60%
total zero rated
50%
40% other
30%
20%
10%
0%
poorest
2
3
4
5
6
7
8
9
richest
Source: Statistics South Africa. Living Conditions Survey 2014/5. Electronic database.
194.2.3 Administrative efficiency and simplicity
One of the biggest practical problems of allowing a zero VAT rate for goods or services is related to the
definition. Unless the scope of the zero rate has been well-considered, and a definition is crafted which
clearly lays down the ambit of the zero rate in the legislation, the important policy goals of administrative
efficiency and simplicity will not be achieved for both the supplier and SARS, if not also for the
consumer/buyer of those goods or services. In addition, a long list of zero-rated items may add to the
compliance costs for vendors due to the additional administrative and accounting requirements.
Ambiguous wording can result in numerous queries as to the proper treatment of items lying on the
borderline between distinct categories, open the door for disputes or even lend itself to abuse and VAT
fraud where items are deliberately misclassified. This will ultimately result in onerous requirements which
must be met to substantiate the zero rating, increasing the administrative and compliance burden on the
vendor, as well as the auditing and controls costs of SARS which must ensure that only qualifying goods
or services are zero rated. Furthermore, the scope of zero rating should not incentivise undesirable or
unjustified changes in consumer or producer preferences.
4.2.4 Merit goods
On the whole, goods should only be considered for zero rating if increased consumption would benefit, or
at least not harm, economic and social development. This principle can be understood through the
economic concept of external costs and benefits. Consumption of these goods generates costs and benefits
to society that are not captured by the consumers themselves. For instance, higher consumption of
cigarettes or sugar imposes health costs that society as a whole ends up paying. In contrast, more
consumption of, say, food, education and primary healthcare benefits society by improving individuals’
well-being and productivity, reducing demands on government services over time. Many merit goods are
consumed primarily by the high-income group. In these circumstances, zero rating would have a regressive
impact. For instance, the richest 10% of households spends over half a percent of their income on books,
compared to less than a 20th of a percent for the poorest 70%. In this kind of case, zero rating would not
be the best way to incentivise higher consumption. Instead, more targeted measures should be considered
to promote increased use by low-income households. In addition, some vulnerable or disadvantaged groups
have specific needs that consume a disproportionate share of their incomes. These groups include women,
particularly for their reproductive health, the elderly, children, and people living with disabilities. The Panel
agreed to pay particular attention to these goods.
4.2.5 Cost of zero rating
Zero rating goods imposes two kinds of cost on the state:
• It reduces tax revenue from the high-income group in particular, and
• It can impose an administrative burden
20In Rand terms, the rich almost always benefit more from zero rating than the poor, because they account
for a much larger share of total spending. Even when the poor spend a larger share of their income on a
good, zero rating it usually means high-income households get more tax relief in money terms. For currently
zero-rated goods, households in the poorest 10% spent around R830 million in 2014, while households in
the richest 10% spent R1.3 billion. For goods that were not zero rated, the poorest decile spent R3 billion,
while the richest spent R87 billion.
South Africa today has a relatively high fiscal deficit, so cutting revenues excessively may end up
constraining government services. The budget is still recovering from the aftermath of the global financial
crisis in 2008/9, as Figure 6 shows. As a result, the deficit in 2018 was 4.5%, which is large by historical
and international standards. Zero rating products to benefit the poor must be balanced against the need to
avoid large reductions in tax revenue which could compromise government expenditures aimed at the very
poor.
Figure 6: National budget deficit as percentage of the GDP, 1990 to 2018
2%
1%
0%
1990
1991
1992
1993
1994
1995
1996
1997
1998
1999
2000
2001
2002
2003
2004
2005
2006
2007
2008
2009
2010
2011
2012
2013
2014
2015
2016
2017
2018
-1%
-2%
-3%
-4%
-5%
-6%
-7%
-8%
Source: Reserve Bank, interactive dataset. Downloaded in July 2018.
In addition, zero rating a long list of relatively minor products can increase the possibility of abuse and
thereby a reduction in tax revenue. Abusive practices commonly entail suppliers deliberately misclassifying
their sales to be zero rated when they should be standard rated, or collecting the VAT from their customers
and not paying it over by misrepresenting these sales to SARS. Generating undue refunds as a result of
misclassifying sales as zero rated is also a common abusive and non-compliant practice. SARS is constantly
under pressure to analyse VAT refunds where zero-rated products are supplied. A typical case of substantial
VAT revenue loss that was unearthed by SARS relates to the agricultural sector where some suppliers (some
farmers) deliberately misrepresented the sale of a standard rated product as zero rated thus generating
substantial VAT refunds.
214.2.6 Ensuring zero rating benefits consumers
Consumers only benefit from zero rating if sellers in fact reduce prices by the amount of the VAT saved.
The extent to which zero rating has in fact benefited consumers remains unclear. We can understand this
problem by comparing the consumer price of brown and white bread. Brown bread is zero rated; white
bread is not. Since these are very similar products, in principle, this means the consumer price for brown
bread should have been 12.3% lower than for white bread. In fact, as the following graph shows, the
differential varied substantially over the past 17 years. The average price for a 700-gram brown bread loaf
was only 11% lower than white bread over the past decade, and the differential tended to decline from 2012
to 2017. In contrast, the price of a 600-gram loaf was 15% lower, or slightly more than the VAT relief.
Figure 7: The average difference in price between white and brown bread (600g and 700g loaves), 2000 to January
2017
24%
22%
20%
18%
16% 600 gr
14%
12%
700 gr
10%
8%
6%
4%
2%
0%
2000
2001
2002
2003
2004
2005
2006
2007
2008
2009
2010
2011
2012
2013
2014
2015
2016
2017
2018
Source: Statistics South Africa data, downloaded from www.sagis.org.za in July 2018.
With the limited time at the disposal of the Panel, the Panel was unable to give more targeted consideration
to some of the market structure issues that explain VAT relief pass-through, or lack thereof, and account,
as one example, for the differences in prices between white and brown bread. It is very important to note
that South Africa is characterised by highly concentrated product and retail markets, which means
producers and retailers may not face competitive pressure to pass on the benefits of zero rating. In more
competitive markets, sellers would compete down the price to attract customers; in the concentrated
markets, in contrast, they do not face pressure to avoid being undercut. The Panel is therefore very
concerned about the possibility of any savings from additional zero rating being captured by producers and
retailers instead of being passed onto the consumer. In future, government should establish mechanisms
to ensure that retailers pass the full value of the VAT relief through to consumers. Mechanisms to achieve
this aim could include, for instance, investigations by the Competition Commission and publication by
Statistics South Africa of reference prices for zero-rated goods as part of the Consumer Price Index (CPI)
data.
225 Data analysis
5.1 Aims
The Panel analysed the impact of VAT zero rating on:
• Goods that are already zero rated, and
• Items included in submissions from the public.
For the analysis, it first undertook an assessment of household consumption of the relevant goods by
income level using the Living Conditions Survey (LCS) of 2014/5, the most recent large-scale study of
consumer spending. This section outlines the methodology utilised for that purpose. That methodology
was applied to currently zero-rated goods and to submissions from the public.
The data analysis pointed to eight items from public submissions that were both significant costs to low-
income households, reasonably progressive in terms of expenditure, and merit goods. In section 0, these
items are analysed in greater detail, using more information about total consumption and socio-economic
implications as well as the structure of consumption by income level.
5.2 Methodology
5.2.1 The Living Conditions Survey 2014/5
The LCS provides detailed information on household expenditure on individual items by overall
expenditure and income level. It is a household expenditure survey conducted by Statistics South Africa
with the primary purpose of providing information on expenditure patterns to update the consumer price
index (CPI) basket of goods and services (Statistics South Africa, 2017(a)).
The survey uses three data collection instruments:
• a household questionnaire that includes questions on the structure and composition of the
household, and then mainly questions that are expenditure-related;
• weekly diaries: households received two weekly diaries to track expenditures of households
• a summary questionnaire to assist survey officers in coding expenditure items according
to the Classification of Individual Consumption According to Purpose (COICOP), and to
summarise weekly household consumption expenditure (Statistics South Africa, 20178).
8Statistics South Africa. 2017. Living Conditions of Households in South Africa. An analysis of household expenditure and income
data using the LCS 2014/2015. Statistical Release: P0310. Statistics South Africa. Available: http://www.statssa.gov.za.
23The LCS is nationally representative, with 27 527 households participating in the 2014/5 survey (Statistics
South Africa, 20179). The expenditure items are classified according to 13 major group expenditure items,
but the survey also provides information on 780 individual budget items.
It is important to note that the LCS undercounts expenditure in certain categories of goods and services,
which may lead to an underestimation of the effects of zero rating for these products. Reasons for the
undercount include the following.10
• Frequent purchases: Despite the various techniques used to capture expenditure,
experience in many countries shows that survey respondents fail to record their full
spending on items such as groceries and food and drink away from home that are
purchased often, usually by several household members.
• Stigmatized purchases: Households often under report products that they find in some
way embarrassing. This affects alcoholic beverages, tobacco and gambling, but could also
influence reporting on sanitary pads (see section 6.6 below).
• Methodological differences: In certain cases, the concepts underlying the economic scope
of expenditure for the CPI are not easily applied in a survey. For example, a net payments
approach is applied to insurance and gambling. Here the money received back (in refunds
or winnings) is deducted from the total expenditure to avoid double counting. Different
estimates for owner occupied housing in the LCS and CPI are a result of different methods
used to estimate this category.
• Survey response: The LCS shows poor response rates in affluent areas in general, and in
Gauteng in particular. In 2014/5, expenses incurred mainly by higher-income households
(such as vehicles and tertiary education) reported lower levels of expenditure than the
previous survey, a finding that was not borne out in other data sources.
Table 1 compares the LCS data with other sources, including the Consumer Price Index for 2015 (which
Statistics South Africa adjusts using additional data sources, for instance reports on production and sales)
and the GDP data. It shows that the LCS data are considered reliable for most categories except food,
alcoholic beverages and tobacco. Food is the only significant category for the analysis here.
9Statistics South Africa. 2017b. Living Conditions Survey 2014/2015. Metadata. Report No. P0310, Statistics South Africa.
Available: http://www.statssa.gov.za.
10 Source: http://www.statssa.gov.za/cpi/documents/Introduction_of_2016_CPI_weights_and_basket.pdf
24Table 1: Comparison of total expenditure figures in the LCS with CPI and GDP data
COICOP CPI 2017 LCS 2014/15 GDPE2015 LCS Scaling11
(a) (b) (c) (d) Factor
Food and non- 365 746 448 021 220 891 343 194 477 071 319 252 243 540 620 942 1,5
alcoholic beverages
Alc Bev & Tobacco 120 639 148 397 15 131 609 277 109 674 838 225 16 683 141 430 7,2
Clothing 82 071 676 458 82 071 697 546 118 034 342 029 90 486 987 372 0,9
Housing 453 781 096 378 564 075 243 377 347 953 171 751 621 913 168 001 0,7
House contents 89 599 332 093 89 599 318 726 152 048 446 005 98 786 459 455 0,9
Health 26 815 166 973 15 533 466 281 158 342 221 254 17 126 203 176 1,6
Transport 306 495 086 609 278 825 439 171 409 064 074 611 307 415 037 675 1,0
Communication 58 321 906 666 58 321 906 666 67 424 902 156 64 301 991 914 0,9
Recreation 99 002 283 883 65 360 668 794 103 429 845 728 72 062 479 376 1,4
Education 49 045 216 987 42 069 727 730 80 028 455 865 46 383 382 282 1,1
Restaurants & Hotels 68 287 111 878 36 237 592 306 60 153 094 088 39 953 243 998 1,7
Miscellaneous 304 142 698 793 252 025 087 313 260 462 992 038 277 866 689 430 1,1
Total 2 023 947 173 136 1 720 143 100 381 2 343 687 703 002 1 896 519 405 051 1,1
Source: Statistics South Africa. Note: CPI 2017 and LCS are given in December 2016 prices. The scaling factor is calculated by
dividing column (a) by column (d).
The analysis here assumes that, despite the undercount, the LCS provides a reasonably accurate picture of
the difference by household income level in the share of expenditure on specific goods and thus we use the
unadjusted figures for calculating the equity measures on different items. For the total estimated revenue
cost, we use the adjusted figures which are found in Table 9. For the eight products reviewed for additional
zero rating, Statistics South Africa kindly provided its estimates of actual consumption, which it uses for
calculating CPI.
5.2.2 Analysis of household consumption expenditure
A first step in the analysis is to consider the expenditure patterns of households across the income
distribution. For this purpose, we rank households from poorest to richest based on their per capita
household expenditure and divide them into ten groups of equal size (i.e. ten deciles). Expenditure is used
(instead of income) to rank households as income is generally less accurately recorded in surveys of this
nature. Furthermore, there is inevitably an imperfect match between reported income and expenditure.
Hence, given that our focus here is on expenditure patterns, the analysis can become confusing if one ranks
on income and then analyses expenditure.
Figure 8 shows the average (total) household income and expenditure by decile, whilst Figure 9 shows the
household expenditure by major expenditure groups across the (expenditure) distribution. Figure 9 reveals
11The scaling factors are used later to gross up VAT amounts. Note that the scaling factors for the major group
expenditure categories may differ from those for specific expenditure items.
25You can also read