The Next Energy Transition - Transformative Pathways, Choices and Opportunities
←
→
Page content transcription
If your browser does not render page correctly, please read the page content below
The Next Energy Transition
    Transformative Pathways,
    Choices and Opportunities

                                             UNITED for
                              International Institute NATIONS
                              Applied Systems Analysis DEVELOPME
                                             INDUSTRIAL
                      IIASA   www.iiasa.ac.at
Acknowledgements
This publication was prepared jointly by the IIASA Energy Program and the UNIDO Energy and Climate
Change Branch, as a key deliverable to the project Global Energy Assessment: Developing Policy Tools for
Jointly Reducing Energy Poverty and Greenhouse Gas Emissions. The project has been developed under the lead of
Pradeep Monga (UNIDO) in collaboration with Luis Gomez Echeverri (Associate Director, Global Energy Assessment),
Nebojsa Nakicenovic (Director, Global Energy Assessment) and Keywan Riahi (Leader, IIASA Energy Program).
This report was authored by Keywan Riahi, David McCollum and Volker Krey. IIASA scientists Shonali Pachauri,
Yu Nagai, Peter Kolp, Shilpa Rao, Oscar van Vliet and UNIDO’s Bettina Schreck provided essential input for the
development of this report. Many other colleagues have provided important contributions to this project,
in particular, Marina Ploutakhina (UNIDO) and IIASA colleagues including Pat Wagner, Mathis Rogner, Eri Nagai,
Iain Stewart, Anka James and Martina Jöstl. The development of this project would not have been possible
without financial support from the Global Environment Facility (GEF) and UNIDO. IIASA and UNIDO also thank
the ECOWAS Centre for Renewable Energy and Energy Efficiency, The Energy and Resource Institute and
UNIDO Armenia Field Office who hosted stakeholder workshops in Praia, New Delhi and Yerevan, respectively.
The Next Energy Transition
Transformative Pathways,
Choices and Opportunities

Keywan Riahi
David McCollum
Volker Krey
Energy Program
International Institute for Applied Systems Analysis (IIASA), Laxenburg, Austria

With contributions from
Luis Gomez Echeverri 1
Pradeep Monga 2
Nebojsa Nakicenovic 1
Bettina Schreck 2
1
    International Institute for Applied Systems Analysis (IIASA), Laxenburg, Austria
2
    United Nations Industrial Development Organization (UNIDO), Vienna, Austria
Submitted to
                             United Nations Industrial Development Organization (UNIDO)
                             under Project No. GF/GLO/10/004 – Contract No. 16002078
                             in September 2011
                             IIASA Reference: 10-134

                             © IIASA 2012

                             This report summarizes Chapter 17 of the Global Energy Assessment :
                             Riahi, K., F. Dentener, D. Gielen, A. Grubler, J. Jewell, Z. Klimont, V. Krey, D. McCollum, S. Pachauri, S. Rao,
                             B. van Ruijven, D. P. van Vuuren, and C. Wilson (2012). Energy Pathways for Sustainable Development.
                             In GEA (2012): Global Energy Assessment – Toward a Sustainable Future. Cambridge University Press,
                             Cambridge, UK and New York, NY, USA and the International Institute for Applied Systems Analysis,
                             Laxenburg, Austria [ISBN 9781107005198 (hardback); ISBN 9780521182935 (paperback)].

                             About the Global Energy Assessment
                             The Global Energy Assessment involves specialists from a range of disciplines, industry groups and policy
                             areas in defining a new global energy policy agenda, one that is capable of transforming the way society
                             thinks about, uses and delivers energy and to facilitate equitable and sustainable energy services for all,
                             in particular the two billion people who currently lack access to clean, modern energy.
                             Coordinated by the International Institute for Applied Systems Analysis (IIASA), the GEA is led by some
                             of the world’s leading energy experts, in research, academia, business, industry and policy, representing both
                             the developed and the developing world. GEA is the first ever fully integrated energy assessment analyzing
                             energy challenges, opportunities and strategies for developing industrialized and emerging economies.
                             It is supported by government and non-governmental organizations, the United Nations System and
                             the private sector.
                             The Assessment is subject to rigorous and independent analysis and review. The final assessment is
                             published by Cambridge University Press and is available online at www.globalenergyassessment.org.

                             Disclaimer
                             This paper reports on work of the International Institute for Applied Systems Analysis and has received only
                             limited review. Views or opinions expressed in this report do not necessarily represent those of the Institute,
                             its National Member Organizations or other organizations sponsoring the work.
                             Citation
                             This report should be cited as:
                             Riahi, K., D. McCollum and V. Krey (2012). The Next Energy Transition:
                             Transformative Pathways, Choices and Opportunities. IIASA, Laxenburg, Austria.

                             Design/layout by IIASA Communications Department
                             Cover images © iStockphoto.com: Josef Becker (front large), ZoneCreative (front left),
                             Wittelsbach bernd (front right; back)
                             Printed by Remaprint, Vienna

The Next Energy Transition
iii

Table of Contents
Forewords...............................................................................................................iv

Preface...................................................................................................................vii

Main Findings of the Global Energy Assessment Scenario Analysis....................viii

The Objectives: Progress along Multiple Dimensions..........................................1

The Pathways: Taking a Holistic Approach to Energy..........................................3

Key Features of the Energy Transition.......................................................................7
   Energy Demand and Energy Efficiency................................................................................... 9
   Energy Supply Portfolios.......................................................................................................13
   Commonalities and Choices across the GEA Pathways.........................................................17
   Financing the Energy System Transition................................................................................24

How the Pathways Expand Energy Access for the Poor.................................... 30

How the Pathways Preserve the Environment and Improve Human Health.....36
  Climate Change................................................................................................................... 36
  Air Pollution and Health...................................................................................................... 40

How the Pathways Enhance Energy Security......................................................45

Conclusion: Harnessing Synergies between Multiple Energy Objectives.........49

References.............................................................................................................55

iv

                                  Forewords
                                                                Energy powers human progress, from job generation
                                                                to economic competitiveness, from strengthening
                                                                security to empowering women, energy is the great
                                                                integrator: it cuts across all sectors and lies at the heart
                                                                of all countries’ core interests. I strongly believe that
                                                                now more than ever, the world needs to ensure that the
                                                                benefits of modern energy are available to all and that
                                                                energy is provided as cleanly and efficiently as possible.
                                                                This is a matter of equity, first and foremost, but it is
                                                                also an issue of urgent practical importance.
                                  Kandeh Yumkella
                                  Director-General
                                  UNIDO                         Developed countries face the combined challenge and
                                                                opportunity of transforming existing energy infrastructure,
                                  while developing countries have the opportunity to adopt cleaner, more efficient
                                  technology from the start. These objectives reinforce each other in many instances, and
                                  achieving them together will power opportunity, maximize socioeconomic development,
                                  enhance domestic and international security and help reduce climate change impacts.

                                  The transformational scenario pathways developed by the IIASA Energy Program
                                  within the framework of the Global Energy Assessment (GEA) approach the global
                                  transition toward sustainable development in an integrated, holistic manner, taking a
                                  broad view of the four main energy challenges faced by society in the 21st century:
                                  providing universal access to modern energy for all; avoiding dangerous climate change;
                                  reducing the impacts of energy on human health and the environment; and enhancing
                                  energy security. In other words, achieving sustainable energy—energy that is accessible,
                                  cleaner and more efficient—powers opportunity. Recognising the importance of sustainable
                                  energy choices, IIASA and UNIDO, with support of the Global Environment Facility (GEF),
                                  have partnered to develop specific tools, reports and technical analysis to support
                                  decision makers in addressing the challenges of providing energy services for
                                  sustainable development throughout the world.

                                  This report uses the GEA as a knowledge platform and aims to inform decision-makers
                                  on the scaling-up of low carbon energy technologies, achievement of reductions in
                                  greenhouse gas emissions, and the reduction of energy poverty.

     The Next Energy Transition
v

                                   Two decades ago, decision makers from all segments of
                                   society gathered in Rio de Janeiro for the United Nations
                                   Conference on Environment and Development. The world
                                   has undergone a substantial transformation since that
                                   time—socially, economically, politically, and in so many
                                   other dimensions. Along the way, the International Institute
                                   for Applied Systems Analysis (IIASA) has played an active
                                   role in informing the policy process at all levels and in all
                                   parts of the globe, particularly on issues that are too large
                                   or complex for any single nation or scientific discipline to
Pavel Kabat                        solve on its own.
Director/Chief Executive Officer
IIASA
                                In particular, by employing rigorous scientific
methodologies and a comprehensive framework of systems-level modeling tools,
researchers from the Energy Program at IIASA have made a unique and lasting
contribution to the field of global change research. Energy Program scientists have
for years investigated the various dimensions of socio-economic and technological
change and sought solutions for the many social ills of the 21st century that relate to
the energy conundrum. Two of the best examples of IIASA’s work include the future
development pathways and emission scenarios they designed and analyzed in support
of the Intergovernmental Panel on Climate Change (IPCC) assessments and the
World Energy Council study.

The rich tradition of the Energy Program continues today with the finalization of the
Global Energy Assessment (GEA) and the transformational energy pathways that have
been developed as a part of this multi-year, multi-stakeholder activity, which aims to
help decision makers throughout the world address the challenges of providing energy
services for sustainable development. As summarized in this report, the GEA pathways
go beyond the existing scenario literature by presenting a comprehensive and integrated
analysis of energy challenges, opportunities and strategies, for developing, industrialized
and emerging economies. The pathways make clear that, from both a technical and
economic perspective, it is entirely feasible to simultaneously (1) mitigate the worst
effects of climate change, (2) provide near universal energy access, (3) enhance the
security of national and regional energy systems and infrastructures, and (4) improve
local air quality in most parts of the globe.

Achieving these multiple objectives for energy sustainability is of course contingent upon
sufficient political and social will, as well as the willingness of decision makers to take
a more holistic and integrated perspective of the problems we are facing as a society
vi

                                  over the coming decades. Thanks primarily to the support of the United Nations
                                  Industrial Development Organization (UNIDO) and the Global Environment Facility (GEF),
                                  this study and the interactive policy tools that have sprung from it help to inform
                                  the evolving dialogue by illuminating some of the complex relationships, synergies and
                                  trade-offs between the various dimensions of energy transformation and global change.
                                  Having worked at the interface of science and policy for almost three decades, I am
                                  personally convinced that this is a critical step in the right direction. For along the path that
                                  is sustainability, which will soon take us again through Rio and then beyond, there will be
                                  a myriad of choices and opportunities. This report provides sound guidance to decision
                                  makers when considering the different directions they could take.

     The Next Energy Transition
vii

Preface
This report provides a high-level summary of the transformational scenario
pathways developed by the IIASA Energy Program within the framework of the
Global Energy Assessment (GEA). These pathways approach the global transition
toward sustainable development in an integrated, holistic manner, taking a broad
view of the four main energy challenges faced by society in the 21st century:
providing universal access to modern energy for all; avoiding dangerous climate
change; reducing the impacts of energy on human health and the environment;
and enhancing energy security. Developing solutions to these challenges is one of
the chief aims of policy makers, and for this reason this report attempts to synthesize
a multitude of strategic insights that have resulted from the pathways analysis.
The overarching objective of the report is to provide guidance on how to facilitate
the transformation of the energy system to achieve the multiple energy objectives.
Focus is given to the required pace of the transformation at both the global and
regional levels, as well as to the types of measures that will be needed to ensure
a successful transition.

This report is complemented by three interactive, web-based analytical tools,
which have been developed by the IIASA Energy Program in support of this
study: (1) the GEA Scenario Database, which documents the full suite of transition
pathways in great detail, allowing the user to explore the consequences of
different supply and demand-side technology choices for the feasibility and costs
of reaching the multiple energy objectives at both the global and regional levels;
(2) the IIASA ENE-MCA Policy Analysis Tool, which permits the concurrent assessment
of synergies and trade-offs between the multiple energy objectives at the global scale;
and (3) the IIASA Energy Access Tool (ENACT), which helps gauge the effectiveness
of various energy access policies and measures in the major developing regions
of the world.

viii
Main Findings of the
Global Energy Assessment Scenario Analysis
Commonalities of The large ensemble of future energy pathways developed by the IIASA Energy Program within the
the GEA Pathways framework of the Global Energy Assessment (the “GEA pathways”) shows that it is possible to achieve
improved energy access, air quality, and energy security simultaneously, while avoiding dangerous climate
change. Doing so will require a technological transformation of the global energy system over the next
several decades, as well as the rapid introduction of policies and fundamental political changes toward
concerted and coordinated efforts to integrate global concerns into local and national policy priorities.
An in-depth modeling and sensitivity analysis illustrates the following commonalities of the GEA pathways:
Constant and sustained energy efficiency improvements are imperative, in order to reduce the
risk that the multiple energy objectives become unreachable. Lowering the energy intensity of
the global economy – at improvement rates consistent with the recent past, if not much faster –
helps to increase the flexibility of supply and the overall cost-effectiveness of the energy system
transformation.
Low-carbon shares in global primary energy must reach at least 60–80% by 2050. This will necessitate a
broad portfolio of supply-side options, including non-combustible renewables, bioenergy, nuclear energy,
and carbon capture and storage (CCS). In particular, this translates to:
Strong growth in renewable energy beginning immediately and reaching 165–650 exajoules (EJ)
of primary energy by 2050.
An increasing requirement for storage technologies to support system integration of intermittent
wind and solar energy.
Growth in bioenergy in the medium term to 80–140 EJ by 2050 (including extensive use
of agricultural residues and second-generation bioenergy to mitigate adverse impacts on
land use and food production).
Nuclear energy playing an important role in the supply-side portfolio in some, but not all,
transition pathways. (The assessment of “restricted” portfolio pathways suggests that it is
also feasible to phase out nuclear and still meet the sustainability targets.)
Fossil CCS as an optional bridging or transitional technology in the medium term, and increasing
contribution of biomass with CCS in the long.
Aggressive decarbonization is particularly critical in the electricity sector, where low-carbon
shares will likely need to reach between 75 and almost 100% by 2050. This means a phase-out of
conventional coal power (i.e., without CCS) in the short to medium term, with natural gas power
potentially acting as a bridging or transitional technology.
Transportation sector enhancements, through electrification or the introduction of hydrogen vehicles,
can improve end-use efficiency and increase supply flexibility.
Oil consumption will likely need to peak in the transportation sector by 2030, followed by a phase-out
over the medium term. Strong growth of liquid biofuels will be necessary to offset petroleum-based fuels
in the short to medium term, after which the mix of liquid and gaseous fuels depends on transportation
system choices and technological breakthroughs.
The availability of energy resources should not limit low-carbon technology deployment on an
aggregated global scale but may pose important constraints regionally, particularly in Asia,
where energy demand is expected to grow rapidly.
The transformation of the global energy system would require substantially increased future cash flows:
Dedicated efforts to increase global energy-related investments to between US$1.7 trillion and
US$2.2 trillion annually, compared with about US$1.3 trillion in annual investment today.
The Next Energy Transitionix
Out of this total, about US$300 to US$550 billion per year would be for efficiency-related
investments on the demand-side.
Future transitions with a focus on energy efficiency would achieve the targets at more
modest cost and, thus, represent the lower bound of the investment range.
Total energy investments correspond to a small fraction (about 2%) of global
gross domestic product (GDP).
The storylines of the required energy system transformations that are quantified and elaborated in the
GEA pathways are far richer than these commonalities suggest. Nevertheless, this collation of all the
required features of an energy system transformation describes the trunk off which the many choices and
possibilities branch. Many of these choices are strongly influenced by one or more of the GEA objectives
with respect to energy access, air pollution, climate change, and energy security. Table 1 summarizes
some of the main characteristics of the pathways in the context of each objective and the more detailed
policy and investment requirements that illustrate how these pathways might be driven.
Policies to Drive Meeting the sustainability objectives will require further tightening of present and
the Sustainable planned legislation and the introduction of new policies:
Energy Transition Universal access to electricity and clean cooking requires the rapid shift from the use of traditional
biomass to cleaner fuels and technologies. This is feasible over the next 20 years provided that sufficient
financial resources are made available for investments on the order of US$36 billion to US$41 billion/year
(half of it in Africa). Universal access results in significant health benefits of more than 24 million
disability-adjusted life years (DALYs) saved in 2030.
Pollution control measures across all sectors need to be tightened beyond those in present and planned
legislation in order to meet World Health Organization (WHO) air quality standards. Estimated global
costs to meet the air pollution target are about US$200 billion to US$350 billion annually to 2030
(about 10–20% of energy costs), resulting in about 21 million DALYs saved in 2030.
Limiting global temperature change to less than 2°C over preindustrial levels can only be achieved through
stringent climate policies motivating rapid reductions of global CO2 emissions from the energy sector,
which in the GEA pathways peak around 2020 and decline thereafter to 30–70% below 2000 emissions
levels in 2050, eventually reaching zero or even negative CO2 emissions in the second half of the century.
Enhanced energy security for regions can be achieved by both limiting dependence on imported
fuels and increasing the diversity and resilience of energy systems. A focus on energy efficiency
improvement and renewable deployment increases the share of domestic (national or regional)
supply in primary energy by a factor of 2 and thus significantly decreases import dependency.
Maximizing The GEA pathways illustrate the importance of a holistic and integrated approach to
Synergies energy policy and planning:
The simultaneous achievement of energy access, climate change mitigation, energy security,
and air pollution control comes at a significantly reduced total energy cost when the multiple
economic benefits of each are properly accounted for.
Above all, stringent climate policy and a rapid decarbonization of the energy system will
allow these enormous synergies to be realized.
The added costs of air pollution control can be cut by up to US$500 billion annually to 2030
at the global level.
The costs of pursuing energy security interests can be reduced to almost zero, translating to an
annual cost savings of about US$130 billion in 2030.
Fossil fuel subsidies, particularly to the most affluent parts of the global population, can be lowered by
about US$70 billion to US$130 billion per year by 2050. (At present, subsidies of coal and oil products
amount to about US$132 billion to US$240 billion per year.)The Next Energy Transition
1
The Objectives:
Progress along Multiple Dimensions
Reaching the economic, environmental and social sustainability objectives of all
societies requires that several major energy challenges be successfully overcome and
necessitates rapid progress along multiple dimensions. The energy pathways presented
in this book describe transformative changes toward these goals. The pathways were
developed by the IIASA Energy Program within the framework of the Global Energy
Assessment (GEA) to explore technical measures, policies, and related costs and
benefits for meeting the following energy objectives:
Energy
Access
Figure 1
Energy for Sustainable development
Climate Air Pollution
Sustainable means solving the four
Change and Health
Development main energy challenges
Energy
Security
providing almost universal access to affordable clean cooking fuel and electricity
for the poor,
limiting air pollution and health damages from energy use,
improving energy security throughout the world, and
avoiding dangerous climate change.
These objectives are defined as quantitative targets in the GEA pathways,
i.e., a schedule is specified for meeting each target by a certain point in time
(Table 1). The targets are of central importance, since they define the ambitiousness
and the magnitude and pace of the required energy system transformation.
They act as the major drivers of the pathways, defining the policy stringency and
portfolio of measures that are necessary to simultaneously respond to the multiple
energy challenges. Because the GEA objectives are strongly normative, the targets
are all designed to be ambitious. The GEA pathways nevertheless make clear that
all the targets can be reached, if appropriate policies are introduced and energy
investments are scaled up considerably.2
Table 1 Targets for the four main energy challenges, key characteristics of the corresponding transition pathways, and illustrative
examples of policies and investments.
Objective Target and timeline Pathway characteristics Examples of policies and investments
Improve energy Universal access to Diffusion of clean and efficient Microcredits and grants for low-emission
access electricity and clean cooking appliances biomass and LPG stoves in combination with
cooking by 2030 Extension of both high-voltage LPG and kerosene fuel subsidies for low-income
electricity grids and decentralized populations
microgrids Estimated cost to provide clean cooking: US$17
Increased financial assistance from billion to US$22 billion per year to 2030
industrialized countries to support Grants for high-voltage grid extensions and
clean energy infrastructure decentralized microgrids
Estimated cost to provide rural grid connections:
US$18.4 billion to US$19 billion per year to 2030
Reduce air Achieve global Tightening of technology standards Vehicles: Euro 3–4 standards for
pollution and compliance with WHO across transportation and vehicles in developing countries by 2030
improve human air quality standards industrial sectors (e.g., vehicles, (e.g., –60% NOx , PM reductions by 2030)
health (PM2.5 concentration shipping, power generation, Shipping: Revised MARPOL Annex
< 35 µg/m3) by 2030 industrial processes) VI and NOx Technical Code 2008
Combined emissions pricing and (–80% SOx , NOx reductions by 2030)
quantity caps (with trading) Industry/power: rapid desulfurization, de-NOx ,
Fuel switching from traditional and PM control around the world by 2030
biomass to modern energy forms Estimated cost to meet air pollution targets:
for cooking in developing countries US$200 billion to US$350 billion/year in 2030
(about 12% of energy costs); co-benefits of
stringent climate mitigation policies reduce
overall pollution control costs by about 50–65%
Avoid dangerous Limit global average Widespread diffusion of zero- Combination of cap-and-trade and carbon
climate change temperature change to and low-carbon energy supply taxes (with initial carbon price >US$30/tCO2,
2°C above preindustrial technologies, with substantial increasing over time)
levels with a likelihood reductions in energy intensity Upscaling of investments into low-carbon
>50% Energy-related CO2 emissions technologies and efficiency measures to
peak by 2020 and are reduced to >$US600 billion/year to 2050
30–70% by 2050 from 2000 levels Additional financial transfers to developing
Globally comprehensive mitigation countries of about 3–12% of total energy
efforts covering all major emitters systems costs to 2050, depending on the
Financial transfers from domestic commitment of industrialized countries
industrialized countries to support
decarbonization
Enhance energy Reduce energy import Increase in local energy supply Public procurement strategies and
security dependence; increase options (e.g., renewables to provide regulations to support local supplies
diversity and resilience 30–75% of primary energy by 2050) (e.g., renewable obligations)
of energy supply Greater diversity of imported fuels Interconnection and back-up agreements
(both by 2050) and reduction in dependency between energy network operators
(e.g., reduce share of oil imports Stockpiling of critical energy resources for
in primary energy by 30–80% by coordinated release during acute market
2050 from 2000 level) shortages
Infrastructure expansion Estimated cost of infrastructure upgrades for
and upgrades to support the electricity grid: >US$310 billion/year by
interconnections and backup, 2050, co-benefits of stringent climate mitigation
including increased capacity policies reduce overall security costs (import
reserves, stockpiles, and energy dependency and diversity) by more than 75%.
storage technologies
The Next Energy Transition3
The Pathways:
Taking a Holistic Approach to Energy
The GEA pathways are designed to describe transformative changes toward a more
sustainable future. A specific feature of these pathways is that they simultaneously
achieve normative targets related to all four major energy challenges. Emphasis is
given to the identification of potential synergies, or in other words, of integrated
solutions and “win–win” strategies in addressing multiple energy objectives
at the same time. The primary reasons for developing the transformational
pathways are, first, to provide a quantitative and qualitative framework for the
identification of policies and measures for a transition toward an energy system
that supports sustainable development, and second, to facilitate integration of
diverse energy issues and consistency across the different chapters of the GEA.
One possible way of understanding the GEA pathways is to regard them
as alternative interpretations of one overarching GEA scenario, in which There is only one GEA
the energy system is transformed under normative, sustainable goals. The scenario – an overarching
pathways highlight different degrees of freedom and routes to these goals. storyline of energy system
All economic and demographic changes are the same across the pathways, transformation to meet the
however. They share a common median demographic projection whereby
normative sustainability
the global population increases from almost 7 billion today to about 9 billion
by the 2050s before declining toward the end of the century (UN, 2009). targets. The GEA pathways
They also possess a common median economic development path, expressed – GEA-Efficiency, GEA-Mix,
in terms of world gross domestic product (GDP), that allows for significant GEA-Supply – represent
development in the 50 or so poorest countries in the world (Riahi et al., alternative descriptions
2012). Global real per capita income in the GEA pathways grows at an annual
of demand- and supply-side
average rate of 2% over the next 50 years. This socioeconomic development
pathway is chosen to be consistent with global aspirations toward a energy system transformations
sustainable future. under this umbrella.
Although some combination of both supply- and demand-side measures is
needed to transform the energy system, emphasis on one side or the other
constitutes an important point of divergence between different policy choices
that may drive the energy system in alternative directions. Thus, a critical factor is to
what extent demand-side efficiency measures together with lifestyle and behavioral
changes, can reduce the amount of energy used for mobility, housing, and industrial
services, thereby helping to fulfill the GEA’s aspirational goals across virtually the
whole range of sustainability objectives. If energy demand is low, any of a number of
alternative supply-side configurations might be able to fulfill the goals. By contrast,
a lower emphasis on reducing energy demand will require a much more rapid expansion4
of a broader portfolio of supply-side options. Hence, the successful implementation
of demand-side policies increases the flexibility of supply-side options, and, vice versa,
more rapid transformation of the supply side increases flexibility on the demand side.
Three GEA pathway groups are distinguished within the sustainable GEA scenario to
represent different emphases in terms of demand-side and supply-side changes. Each
group varies, in particular, with respect to assumptions about the comprehensiveness
of demand-side policies to enhance efficiency, leading to pathways of comparatively
low energy demand (GEA-Efficiency), intermediate demand (GEA-Mix), and high
demand (GEA-Supply). The GEA-Efficiency pathways show the most flexibility on
the supply side of the energy system, while GEA-Supply is more flexible on the
demand side, requiring much less pervasive introduction of efficiency measures to
reduce energy demand for services. The pathways thus explore not only alternative
combinations of supply- and demand-side policy portfolios, but also different choices
with respect to overall strategy and level of implementation. In this context, the
GEA-Mix pathways explore the degrees of freedom offered by more diverse energy
systems, from resource extraction to services delivered to end users. The emphasis
of GEA-Mix is on the diversity of the energy supply mix, to enhance the system’s
resilience against innovation failures or technology shocks. This emphasis also implies
that the GEA-Mix group of pathways is not necessarily intermediate between the
other two groups in terms of other salient scenario characteristics (e.g., the required
policy portfolio, costs, fuel choices, or deployment of individual technologies).
Within each larger group of pathways, a range of alternative pathways for the
supply-side transformation is explored. Moving to a specific pathway entails critical
choices, or “branching points.” The first branching point tests the flexibility of
different supply-side configurations to fulfill the GEA sustainability objectives, given
the levels of energy demand in the pathway group. One aim was specifically to use
the GEA Integrated Assessment Models (see Box 1) to explore whether any of the
Box 1 The GEA Scenario Development Process
The GEA scenario and pathways were developed in parallel by two integrated assessment
modeling frameworks and through an iterative and participatory process so as to achieve
integration across various chapters of the GEA (Figure 3). Important inputs to the GEA
scenarios include quantitative techno-economic information, such as technology costs, energy
resources, and potentials, which were provided by other GEA clusters. In addition, a series of
workshops and a scenario questionnaire were prepared by the GEA writing team and external
experts to solicit input for defining the main characteristics of the GEA scenario taxonomy
and the set of objectives for a sustainable energy system with specific targets and timelines.
These inputs are used by two modeling frameworks for the development of the GEA pathways:
MESSAGE (Messner and Strubegger, 1995; Riahi et al., 2007) and IMAGE (Bouwman et al., 2006).
The Next Energy Transition5
Branching point: Branching point: Branching point: Feasible supply-side transitions
Efficiency Transportation Supply (primary energy by 2050)
Conventional n=2
Transport
High
demand
n=6
Advanced
Transport
pl y
p
-Su
Supply-side Flexibility
GE A
n=6
Demand-side Flexibility
Conventional
Transport
Intermediate
demand
GEA-Mix
n=7 n=7
Advanced
Transport
GE
A- E
f fi c
n=10
Conventional
ien
Transport
cy
Low
demand
n=10
Advanced
Transport
n = number of feasible pathways (≤10)
Figure 2
Schematic illustration of the GEA pathways and the three branching points. The scenario setup features
alternative choices for the combination of demand-side efficiency improvements and supply-side
transformations, describing alternative policy emphases that would enable the transformation toward a
sustainable energy system. The pie charts represent primary energy portfolios of feasible transformation
pathways under different branching point assumptions
Participatory Iterations
Process for qualitative
Scenario
Taxonomy GEA Pathways
GEA-Supply
Models:
GEA Indicators quan + qual
GEA-Mix
(targets) IMAGE
MESSAGE
GEA=-Efficiency
Inputs from other Sensitivity Analysis
Chapters On specific issues
quantitative
(costs, potentials,
technology, etc..) Figure 3
Iterations
incl. uncertainties Policy Chapters The GEA scenario
development process6
supply options were mandatory. To do this, constraints were set on the portfolio of
supply-side options by prohibiting or limiting the availability of specific technologies,
including nuclear, CCS, biomass, and other renewables. Another branching point,
whose importance was revealed by this supply-side analysis, concerns changes in the
transportation system. A “conventional” transportation system relying on liquid fuels
(oil, biofuels, liquefied natural gas) has substantively different implications for supply
flexibility than an “advanced” system dominated by electric or hydrogen-powered
vehicles. The former represents the least discontinuity from current trends, in
terms of both end-use technologies and fuel supply and distribution infrastructure,
whereas the latter involves a more fundamental transformation, requiring largely
new infrastructure systems in the case of hydrogen fuel cell vehicles, or new uses for
existing infrastructure in the case of plug-in hybrids or fully electric vehicles. Although
any major transformation in an end-use sector that entails fuel switching will impact
the energy supply, the magnitude of the impact of such a transformation in the
transportation system alone warranted its inclusion as an explicit branching point.
The various branching points lead to a total of 20 alternate pathways within each
pathway group, giving a total of 60 alternative GEA pathways (Table 2, Figure 2).
Of these, 19 were rejected as they failed to fulfill the GEA objectives: that is,
no feasible solution could be found within these pathways that would meet the
normative GEA targets summarized in Table 1.
Table 2 GEA pathways and branching points.
Branching point 1: Branching point 2: Branching point 3:
What is the level of What are the dominant transportation How diverse is the portfolio of
energy demand? fuels and technologies? supply-side options?
GEA-Efficiency (low demand) Conventional (liquid fuels) Full portfolio (all options)
GEA-Supply (high demand) Advanced (electricity, hydrogen) Restricted portfolio
GEA-Mix (intermediate demand) (excludes or limits particular options):
No CCS
No BioCCS
No sinks
No nuclear
No nuclear and no CCS
Limited renewables
Limited biomass
Limited biomass and renewables
Limited biomass, no BioCCS, no sinks
The Next Energy Transition7
Key Features of the Energy Transition
Summary of Although simultaneous fulfillment of the GEA objectives poses an extremely ambitious task, the GEA
Findings scenario analysis shows it is technically possible. The full suite of GEA pathways, grouped according
to the aggressiveness with which energy demand can be reduced, highlights the potential role for
a range of energy conversion chains from primary energy sources to conversion technologies and
on to end-use technologies. Although there are a number of choices available to direct the energy
system transformation, there are also a large number of givens – nonnegotiable, nondiscretionary
components of an energy transition that must begin in 2010. These commonalities across all pathways
are summarized here:
Improvements to at least the historical rate of energy intensity reduction (more rapid improvements
in energy intensity, and thus aggressive efforts to improve end-use efficiency, would increase the
flexibility of supply as well as the overall cost-effectiveness of the energy system transformation)
A rapid shift from traditional biomass to widely accessible, clean, flexible energy forms
Important regional constraints on availability of energy resources, although such constraints do not limit
deployment on an aggregated global scale
A broad portfolio of supply-side options, focusing on low-carbon energy from renewables, bioenergy,
nuclear, and CCS
Strong growth in renewable energy beginning immediately; a rising requirement for storage
technologies to support the integration of intermittent wind and solar power into electrical grids
Strong bioenergy growth in the medium term, with extensive use of agricultural residues and, in the
medium term, nonagricultural feedstocks (second-generation bioenergy), to mitigate adverse impacts
on land use and food production
Nuclear energy as an important part of the supply-side portfolio in many transition pathways,
although it is also feasible to phase out nuclear completely
CCS as an optional bridging or transitional technology in the medium term – unless energy demand is
high, in which case CCS becomes necessary
Aggressive decarbonization in the electricity sector (especially in the high-demand case); a rapid
phase-out of conventional coal power (i.e., without CCS); natural gas power as a bridging or transitional
technology in the short to medium term
At least some electrification of the transportation sector, even in a conventional liquid fuels–based system
Continued dominance of oil among liquid and gaseous fuels into and beyond the medium term; strong
growth in liquid biofuels in the medium term; thereafter the mix of liquid and gaseous fuels depends on
transportation system choices and technological breakthroughs
Substantial increases in investment on both the demand and the supply side (including energy
infrastructure)
Concerted and aggressive policies to support energy system transformation, including strong regulation
and standards and externality pricing
The GEA transition pathways show that simultaneously achieving the multiple objectives for energy
sustainability – along the dimensions of climate change, energy access, energy security, and air
pollution and health – will require a scaling up of global energy investments:
Investment levels must increase by almost a factor of 2 compared with today, corresponding to annual
investments of between US$1.7 trillion and US$2.2 trillion, or about 1.8–2.3% of global GDP.
On the energy supply-side, the transformation of the system is achieved through pronounced shifts
of investment away from the upstream fossil fuel sector to downstream electricity generation and8
transmission. Consequently, the share of upstream fossil fuel–related supply-side investment in total
investment decreases from 30% at present to about 12–23% by 2050. At the same time, electricity
investment increases its share on average from about 42% to up to 68% by 2050.
Among all supply-side options, the largest increase in investment needs is for renewable power
generation, ranging from US$160 billion/year to US$800 billion/year in 2050 (compared with US$160
billion/year in 2010).
Global average electricity grid investment (including storage to allow the integration of intermittent
renewables) by 2050 increases to between US$310 billion and US$500 billion/year, compared with
US$260 billion in 2010.
Investment in CCS ranges from zero to about US$65 billion/year in 2050, and investment in nuclear is
between US$5 billion and US$210 billion/year.
Energy investments vary quite dramatically by region across the GEA pathways. Notably, with their
rapidly growing economies and populations, the investment needs in the developing world will be much
larger than in currently industrialized countries over the course of this century.
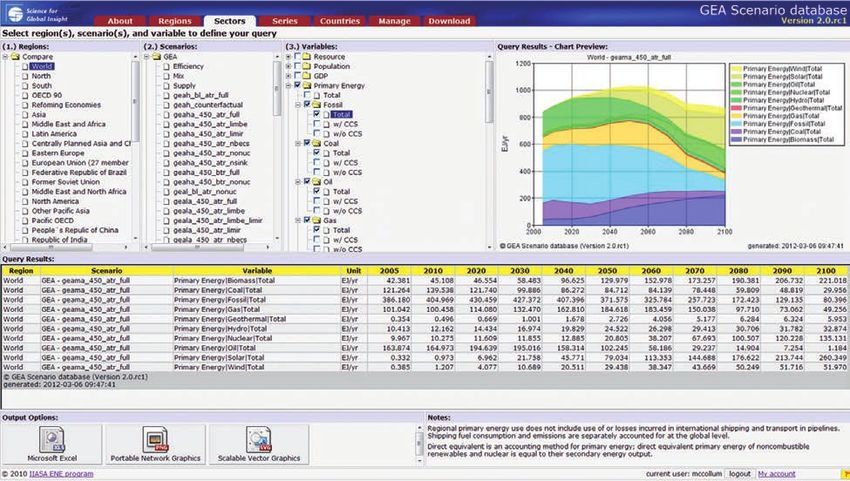
Box 2 The GEA Scenario Database
An interactive Web-based database tool allowing users to view, analyze, and export all output from the full suite of GEA
transition pathways
URL: www.iiasa.ac.at/web-apps/ene/geadb
Detailed scenario data for the individual GEA pathways are publicly available in the GEA database. This data includes socio-economic
indicators; resource, fuel, and technology utilization profiles, emissions trajectories and concentration pathways, prices of resources
and fuels, and various other types of information. The GEA database provides interactive features for data visualization and a user
interface for the download of scenario information in different formats.
The Next Energy Transition9
Energy Demand and Energy Efficiency
The adequate provision of energy services is a prerequisite for human well-being and
productivity, and ultimately it is the demand for these services that drives the energy
system and its continuing expansion. Increasing affluence has historically been
one of the major drivers of energy demand, and both the quantity and the quality
of energy services determine in turn the magnitude of environmental and social
impacts associated with the energy system. A subset of these impacts are addressed
by the normative objectives enshrined in the overarching GEA scenario.
Energy services are typically provided by end-use technologies, which convert energy
from a particular form (biomass, petroleum, natural gas, electricity, and so forth)
into services useful to a final consumer (heating and cooking, mobility, industrial
processing, entertainment, and others). Consequently, end-use technologies and
the efficiency with which they convert energy into useful services are inseparably
connected with the levels and types of energy services demand. As a result,
one can identify three broad and interrelated approaches to tackling
demand-side challenges in the energy system:
Reducing wasteful energy
Improve technological efficiency – e.g., increase vehicle fuel efficiency use in buildings, transport
Change the structure of energy services demand – e.g., substitute physical and industry is the single
mobility with “virtual” mobility enabled by electronic communications most important strategy
Reduce the level of energy services demand – e.g., reduce travel needs for achieving energy
by living closer to work or amenities.
sustainability, especially in
Although all three of these approaches are explored in the GEA pathways the near to medium term.
as means of reducing final demand for energy, the emphasis here is on
efficiency improvements. Through its potential to decouple energy demand from
economic growth, energy efficiency represents a central lever for policy to target.
Moreover, efficiency contributes to all the sustainability objectives. The degree to
which efficiency improvements can limit energy demand growth is – by design –
one of the main distinguishing characteristics of the GEA pathways.
Energy intensity metrics are widely used to represent the overall energy productivity
of an economy or sector. Energy intensity is defined as energy used per unit of
output and is typically expressed in megajoules per US dollar (MJ/US$) of GDP or
value added. The final energy intensity of the global economy has fallen historically
at a rate of about 1.2%/year since the early 1970s. However, some regions have
over certain periods experienced substantially more rapid reductions. For example,
China’s energy intensity declined at a rate of about 4%/year between 1990 and
2000 (followed by a slower decline in the subsequent period). Despite the energy10
efficiency and intensity improvements that have already been implemented to
date, energy intensity improvements can continue for a long time to come, as the
efficiency of the energy system remains far from the theoretical potential. Although
the full realization of this potential may never be possible, many estimates indicate
that energy intensity reductions of a factor of 10 or more may be possible in the
very long run (Nakicenovic et al., 1993; Gilli et al., 1995; Nakicenovic et al., 1996).
The degree of energy intensity improvement is a crucial uncertainty for the future.
All three groups of GEA pathways depict energy intensity futures that are driven by
policies to improve energy efficiency, leading to global energy intensity improvement
rates at or above historical experience. This is partly a result of increasing importance
of some low income regions with relatively high rates of intensity improvement – but
also of the assumed move away from inefficient traditional fuels in the developing
world. Energy intensity improvements, thus, vary significantly at the regional level,
with some regions developing also slower than the historical rate, particularly in the
GEA-Supply and Mix pathways. The resulting global average reduction in energy
intensity varies across the GEA pathways between about 1.5% and 2.2% annually
to 2050. The lower end of the range is slightly faster than the historical experience,
whereas the higher end is roughly double that and corresponds to a reduction in
energy intensity of 60% by 2050. Cumulatively, these intensity improvements lead
to substantial differences in per capita energy demand across the three pathway
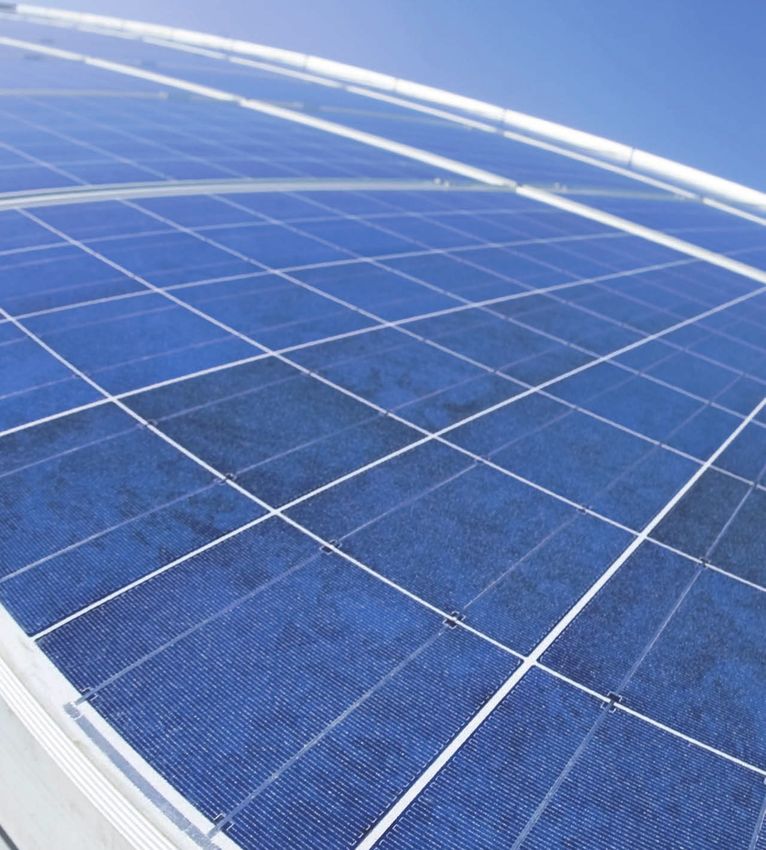
groups (see Figure 4).
18 140
Industrialized 2050 2100
16 GEA-Supply -1.4% -1.1%
-1.0%pa GEA-Mix -1.8% -1.4% 120
14 GEA-Efficiency -2.5% -2.0% Industrialized
Developing 2050 2100 100
12 GEA-Supply -2.6% -1.9% GEA-Supply
GEA-Mix -2.8% -2.1% GEA-Mix
MJ/US$2005
80
GJ/capita
10 GEA-Efficiency -3.1% -2.4% GEA-Efficiency
-1.7%pa
8 60
6
40
Developing
4
20
2
0 0
1960 1980 2000 2020 2040 2060 2080 2100 1960 1980 2000 2020 2040 2060 2080 2100
Figure 4
Historical and projected energy intensity (left panel) and per capita final
energy use (right panel) in the developing and industrialized worlds. Solid
lines denote the illustrative GEA pathways within each of the three pathway
groups; dashed lines show changes in energy intensity due to supply-side
variations. The inset in the left panel shows rates of improvement in energy
intensity (calculated using GDP at market exchange rates) between 2005
and 2050 and between 2005 and 2100. Source of historical data: IEA (2010).
The Next Energy Transition11 Studies have shown that it is possible to improve energy intensity radically through a combination of behavioral changes and the rapid introduction of stringent efficiency regulations, technology standards, and environmental externality pricing (in order to mitigate “rebound effects”1). The group of GEA-Efficiency pathways depicts such a development with a radical departure from historical trends. The overarching finding of the Global Energy Assessment is that the rapid energy intensity improvements depicted by the GEA-Efficiency group of pathways are feasible with currently available technologies. The necessary magnitude and pace of change, however, will require a fundamental shift in the way energy is used across all major sectors of the economy and will undoubtedly necessitate concerted and dedicated demand-side policies and measures (see Table 3). Because the GEA-Efficiency group of pathways deliberately explores the consequences of demand-side interventions, it leads to substantial declines in per capita energy use in the industrialized world (Figure 4). Yet, given expected economic growth in the developing world, per capita energy demand continues to increase in these regions over the course of the century, although at a considerably slower pace than in the other GEA pathways groups. If the GEA-Efficiency pathways group depicts the upper bound of potential efficiency improvements and the lower bound of energy demand in the GEA pathways, then the GEA-Supply pathways group depicts the opposite, that is, the lower bound of potential efficiency improvements, thereby giving rise to an upper bound of energy demand across all GEA pathways. The GEA-Supply pathways place much less emphasis on efficiency and other demand-side measures, focusing instead on supply-side transformations. In the GEA-Supply pathways, the long-term improvement rate in global energy intensity over the course of the century is slightly above the historical record. As a result, per capita energy use in the industrialized world stays at roughly 2005 levels, while per capita demand in the developing world catches up to the former, increasing by almost a factor of two in the long term (Figure 4). The GEA-Mix pathways group is characterized by intermediate efficiency improvements, giving rise to energy intensities, both economy-wide and per capita that lie between the aggressive GEA-Efficiency pathways and the less prescriptive demand-side trends of the GEA-Supply pathways (Figure 4). Table 3 summarizes the various sectoral measures to improve end-use efficiency that drive the GEA pathways, particularly the GEA-Efficiency group. The GEA-Efficiency 1 Rebound effects describe an increase in demand for energy services as improvements in efficiency lower their effective cost. These effects can be direct (the savings from greater efficiency are spent on the same energy service), indirect (the savings are spent on a different energy service), or economy-wide (the savings contribute to economic and income growth, which increases demand). Rebound effects can be mitigated by price and other policies.
12
pathways assume successful, rapid and widespread implementation of efficiency
and demand management policies and measures over the next several decades,
substantially reducing final energy demands below levels that would be expected in
an “efficiency-as-usual” baseline scenario (Figure 5). The GEA-Mix and GEA-Supply
groups are a bit less optimistic in this regard.
Table 3 Sectoral measures to improve end-use efficiency in the GEA pathways.
Buildings
(Residential & Commercial) Transportation Industry
Potential efficiency gains for In the GEA-Efficiency pathways Widespread adoption of best available technology
thermal demands in buildings group, about half of the overall for new investments (15% improvement).
are among the highest across improvement in transport energy Retrofit of existing plants to improve energy
all end-use sectors; however, intensity by 2050 comes about efficiency, e.g., use of combined heat and power,
electricity consumption for through technical efficiency pumps, fans, compressed air and steam systems,
appliances is expected to improvements across all modes and so on (15% improvement).
increase. of passenger transportation.
Optimization of energy and material flows through
Achieving these gains requires The compound global effect of
systems design, quality improvements, lifecycle
the rapid introduction of these efficiency gains reduces
product design, and enhanced recycling.
strict building codes and fuel consumption from about
1.7 MJ/km in 2005 to 1.3 MJ/km Further electrification and a switch to 25% renewable
retrofit standards for almost
by 2050. Gains are largest for road energy throughout the manufacturing industry
the complete global building
vehicles, with some significant (10% improvement, though balanced by a similar
stock over the period to 2050.
differences across world regions efficiency loss from widespread adoption of CCS).
The rate of retrofit would
need to increase to about 3% (the range is from 1.9 to 0.9 MJ/km). In the GEA-Efficiency pathways, energy efficiency in
annually, about three times the The other half of the overall the industrial sector improves by about 1.5%/year,
historical rate. intensity improvement is achieved by resulting in overall demand of about 200 EJ in
reducing demand for mobility as an 2050, around 20% below what it would be in the
In the GEA-Efficiency group of
energy service (e.g., by substituting absence of a concerted approach to demand-side
pathways, policies to improve
travel with teleconferencing) and transformation. This equates to a 50% reduction in
thermal insulation as well as
shifting demand for mobility to the overall energy intensity of industrial production.
retrofits to advanced building
types (passive house standards public transportation (e.g., trains Iron and Steel Making: new smelting reduction
or lower) lead to improvements and buses). Despite these actions, processes; wider application of gas-based direct
in energy use per unit of floor transport demand continues to grow reduced iron; electricity and hydrogen as process
area by a factor of 4 in the in absolute terms. fuels in the long term.
industrialized world, from Increasing affluence leads to a Chemical and Petrochemical Products: new
about 400–900 MJ/m2 down 5-fold growth in car ownership technologies such as membrane processes, new
to 100–230 MJ/m2 by 2050. in the developing world, even catalytic conversion routes, new olefin production
Improvement rates in the in the GEA-Efficiency pathways processes (e.g., based on ethanol feedstock)
developing world are a factor (from 2 to 11 cars per 100 people and process intensification.
of 2 to 3. by 2050). The expected growth Cement Making: increase the share of alternative
Demand for energy from in the absence of any policies to cementing materials including Bainite cement,
centralized sources and grids is support public transportation and volcanic ash, geopolymers, and limestone additives.
further reduced by the adoption limit car ownership would be some
30% higher still. Pulp and Paper Making: Process re-design for
of technologies that enable lignin removal in chemical pulping plants; more
space heating and cooling with In freight transport, there is a efficient use of black liquor residues, perhaps
net zero use of centralized pronounced switch toward higher through gasification, and new drying technologies
energy. These include solar shares of railway transportation for paper making; structural shifts from paper to
water heating, solar heating, combined with improvement in the electronic media.
air-source or ground-source overall efficiency by about a factor
heat pumps powered by of 2 by 2050, from 1.3 MJ/t-km Aluminum Making: adoption of wetted drained
solar photovoltaics, and (tonne-kilometers) on average in cathodes and inert anodes to eliminate carbon
biomass-based heating. 2005 down to 0.7 MJ/t-km in 2050. anode technology; potential for a further increase
in aluminum recycling rates is rather limited.
The Next Energy TransitionYou can also read