Firm-Level Exposure to Epidemic Diseases: Covid-19, SARS, and H1N1 - American ...
←
→
Page content transcription
If your browser does not render page correctly, please read the page content below
Firm-Level Exposure to Epidemic Diseases:
                         Covid-19, SARS, and H1N1∗

        Tarek A. Hassan†              Stephan Hollander‡               Laurence van Lent§

                       Markus Schwedeler¶                  Ahmed Tahounk

                                       November 20, 2020
                                             Abstract
      We introduce a new word pattern-based method to automatically classify firms’ pri-
      mary concerns related to the spread of epidemic diseases raised in their quarterly
      earnings conference calls. We construct text-based measures of the costs, benefits, and
      risks listed firms in the US and over 80 other countries associate with the spread of
      Covid-19 and other epidemic diseases. We identify which firms and sectors expect to
      lose/gain from a given epidemic and which are most affected by the associated uncer-
      tainty. Our new automatic pattern-based method shows how firms’ primary concerns
      (varying from the collapse in demand and disruptions in their production facilities or
      supply chain, to financing concerns) are changing over time and varying geographically
      as epidemics spread regionally and globally. We find that the Covid-crisis manifests
      itself at the firm-level as a simultaneous shock to both demand and supply. In prior
      epidemics, in contrast, firm discussions center more on shortfalls in demand. In 2020,
      supply and financing-related concerns are relatively more salient in regions where the
      spread of Covid-19 is less contained.

   ∗
     We thank seminar participants at the EAA Virtual Accounting Research Seminar, NBER SI 2020 Asset
Pricing, and INQUIRE’s seminar. We thank Steve Davis, Ken Kotz, and Tom Ferguson for helpful comments.
Aakash Kalyani and Luke Melas-Kyriazi provided excellent research assistance. Tahoun sincerely appreciate
support and funding from the Wheeler Institute for Business and Development. Tahoun and Van Lent
sincerely appreciate support from the Institute for New Economic Thinking (INET). Van Lent gratefully
acknowledges funding from the Deutsche Forschungsgemeinschaft Project ID 403041268 - TRR 266. The
data set described in this paper is publicly available on www.firmlevelrisk.com.
   †
     Boston University, NBER, and CEPR; Postal Address: 270 Bay State Road, Boston, MA 02215,
USA; E-mail: thassan@bu.edu.
   ‡
     Tilburg University; Postal Address: Warandelaan 2, 5037 AB Tilburg, the Netherlands; E-mail:
s.hollander@tilburguniversity.edu.
   §
     Frankfurt School of Finance and Management; Postal Address: Adickesallee 32-34, 60322 Frank-
furt am Main, Germany; E-mail: l.vanlent@fs.de.
   ¶
     Boston University; Postal Address: 270 Bay State Road, Boston, A 02215, USA; E-
mail:mschwed@bu.edu.
   k
     London Business School; Postal Address: Regent’s Park, London NW1 4SA, United Kingdom; E-
mail: atahoun@london.edu.
“[D]o you want to touch on cancellations and just the whole hype around coronavirus?”
—Colin V. Reed, Chairman and CEO, Ryman Hospitality Properties, February 25, 2020

      When the World Health Organization declared the outbreak of the Covid-19 virus a
pandemic on March 11, 2020, the disease had already wreaked havoc in large swathes of
China and in Northern Italy. At that point, 118,319 infections with the virus had been
confirmed, and 4,292 people had died from the disease. What started as a new illness in a
middling city in China, had grown within a few months to a global public health crisis the
likes of which had been unseen for a century. Stock markets around the world crashed. After
an Oval Office address by then US President Trump failed to calm markets on March 11,
major stock indices fell another 10 percent on the following day.1 Even though governments
rushed in equal measure to stem the further spread of the virus, locking down entire regions
and restricting (international) travel as well as to support a suddenly wobbling economy,
providing emergency relief measures and funding, it became quickly clear that the shock
would leave few untouched.
      While perhaps a singular event, the Covid-19 pandemic offers a unique opportunity to
study more generally how firms respond to large aggregate, unexpected “shocks.” Those
wishing to avail themselves of this opportunity, however, face two formidable challenges.
First, how to quantify the differences across firms in their exposure to a macro shock. Second,
how to disentangle whether the shock relates to demand contractions, supply disruption, or
credit tightening. To understand the dynamics in macro-variables during and after a shock,
such an understanding of determinants is essential.2
      Addressing these challenges, we have two objectives in this paper: (1) to construct a
time-varying, firm-level measure of exposure to epidemic diseases, as one example of such
a macro shock, and (2) to identify whether the firm-level exposure to the shock relates to
  1
     See Baker et al. (2020) and Ramelli and Wagner (2020) for an early discussion of the stock market
response to Covid-19.
   2
     Consider, e.g., the debate in the literature about whether the Great Recession was demand-driven or
due to a drop in productivity, see Mian et al. (2013) and Kaplan et al. (2020).

                                                   1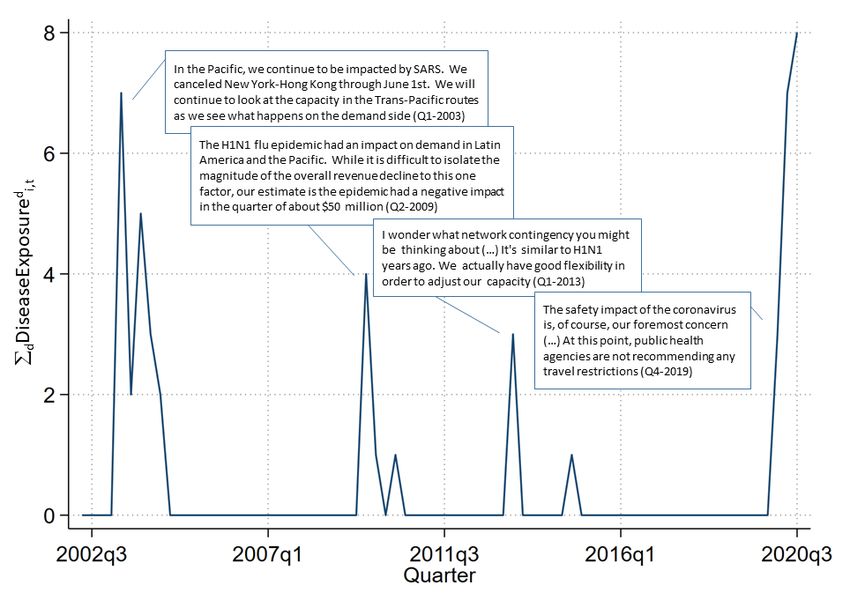
demand, supply, financing, or other concerns. We believe these efforts to be timely given
the concern in the literature that the extraordinary nature of the current crisis might have
rendered existing models and policy remedies ineffective (Adda, 2016; Barro et al., 2020).
Beyond the Covid-19 emergency, however, we believe that our approach offers opportunities
for studying the economic consequences of large shocks in general.
   The measure we introduce is based on a text-classification method and identifies the
exposure of firms to the outbreak of Covid-19 by counting the number of times the disease
is mentioned in the quarterly earnings conference call that publicly-listed firms host with
financial analysts. This approach has been validated in recent work by Hassan et al. (2019,
2020) in the context of measuring a firm’s exposure to political risk, Brexit, and to shocks
such as the Fukushima nuclear disaster.
   Intuitively, the idea of constructing a measure of firm-level exposure to a particular shock
from transcripts of periodic earnings calls rests on the observation that these conference calls
are a venue in which senior management has to respond directly to questions from market
participants regarding the firm’s future prospects. Not only are these disclosures therefore
timely, but as earnings calls consist of a management presentation and, importantly, a Q&A
session, they also require management to comment on matters they might not otherwise
have voluntarily proffered. In most countries in our sample, earnings conference calls are
held quarterly, which allows us to track changes in firm-level disease exposure over time.
To illustrate the flexibility of our approach, we also construct measures of a given firm’s
exposure to earlier significant epidemic diseases, namely SARS, MERS, H1N1, Ebola, and
Zika. In this way, we can examine whether firms learn from previous experiences with a
given type of shock, such as with earlier infectious disease outbreaks.
   In addition to this exposure measure, we also construct—per the method described in
Hassan et al. (2019, 2020)—measures of epidemic disease sentiment and risk. These measures
intend to capture the first and second moment, respectively, of a given firm’s exposure to an
epidemic disease outbreak. Doing so is important, not only because first and second moments

                                               2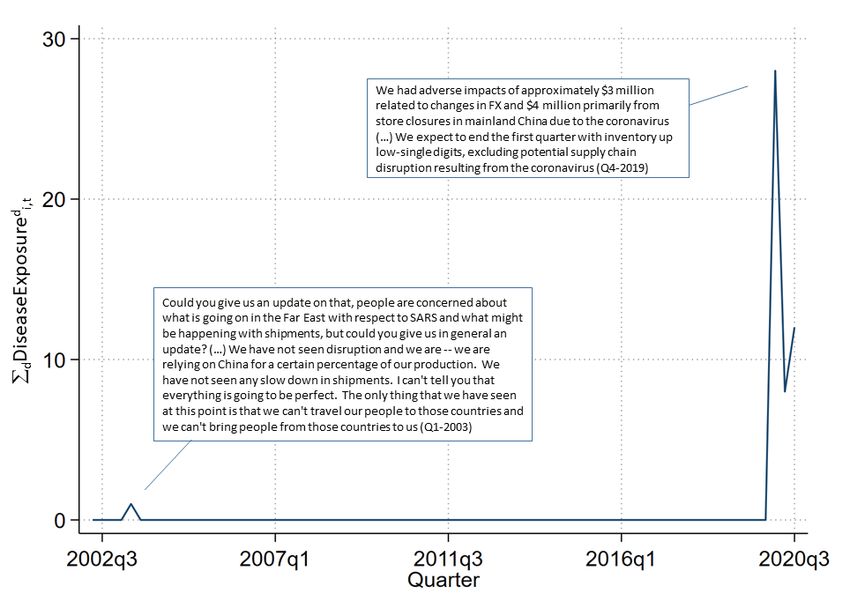
tend to be correlated and estimating the impact of uncertainty on firm outcomes requires
one to control for the effect of the outbreak on the mean of the firm’s expected future cash
flows, but also because it allows us to separate those firms which expect to gain from these
events from those that expect to lose. Once we identify these winners and losers, we can
then turn to the details of the conversation in their transcripts to systematically catalogue
the reasons why they believe they can benefit from or are harmed by the outbreak.
   For this purpose, we introduce a new automatic pattern-based method for classifying
the content of discussions in conference calls related to Covid-19 and use it to produce
evidence on which of these potential concerns are current for firms around the globe during
the coronavirus outbreak. Guided by the results of a pilot study, we label Covid-19 related
discussions into six topics: (1) demand, (2) supply chain, (3) production and operations, (4)
costs, (5) finance, and (6) government. Based on an automated reading of all text fragments
from transcripts that mention Covid-19, we document the frequency in which each concern is
voiced between January and September 2020, paying especial attention to over-time changes
in patterns.
   Based on the new firm-level epidemic disease exposure measures, we document a set of
empirical facts for the impact of outbreaks on firms in 84 countries, the most important
of which are as follows: First, the Covid-crisis is truly unprecedented in the breadth and
intensity of its firm-level impact, even when compared to the most virulent prior epidemics in
our sample. While discussions of prior outbreaks such as SARS and H1N1 were confined to
firms in specific regions and sectors, and never occupied more than 20 percent of the firms in
our sample at the same time, Covid-19 is at present a major topic of discussion for virtually
all firms in all parts of the world. In the second and third quarters of 2020, a remarkable
three percent of sentences in conference calls mention Covid-19.
   Second, on average, firms expect and report overwhelmingly negative impacts from the
spread of Covid-19 on their businesses, while also attributing a large increase in risks to the
spread of the disease. In this sense, Covid-19 represents a shock both to the mean and the

                                              3
variance of firms’ fortunes. After a peak in pessimism associated with Covid-19 in June of
2020, the tone of discussion recovered somewhat in the third quarter of 2020, lead by a slight
uptick in optimism among Asian firms.
Third, underlying these overwhelmingly negative aggregate trends, significant heterogene-
ity across firms and sectors exists. For example, firms are most pessimistic (have negative
sentiment) in the transportation sector, consistent with that industry being hit hard by
cancelled air routes and closed borders. Technology firms are the least pessimistic, perhaps
buoyed by the working-from-home orders issued by many governments and the accompany-
ing needed investments in software and hardware solutions. In fact, some tech firms such
as Apple, Intel, Microsoft, and Netflix, on average, discuss the impact of Covid-19 with a
markedly positive, rather than negative, tone.
We also find that short-window earnings-call stock returns, capturing the information
released during the earnings call, as well as first-quarter cumulative stock returns, are gen-
erally lower for firms with more negative sentiment and higher risk related to the Covid-19
outbreak. These firm-level exposures to the disease account for significant variation in the
cross-section of US and international stock returns.
Fourth, digging deeper into the specific concerns firms associate with Covid-19, we find
that the pandemic manifests itself at the firm-level as a simultaneous supply and demand
shock, with concerns roughly balanced between these two categories. In the early days of
the pandemic, many firms highlighted concerns relating to their supply chains. Later calls
(in the second and third quarter of 2020) instead emphasize concerns relating to production,
operations, and financing with relatively higher frequency. In regions of the world where
the outbreak is more virulent, financing and supply problems tend to be relatively more
significant (perhaps due to stricter lockdown measures or other public health restrictions). As
a result, concerns among Chinese firms relate relatively more to demand than supply, while
their peers in North America emphasize supply-related concerns relatively more frequently.
Finally, comparing the specific concerns firms associate with Covid-19 with those they
4associated with Ebola and other epidemic diseases, we find that Covid-19 stands out due to
its relatively large supply and financing-related impact. More broadly, the pattern emerging
suggests that those outbreaks affecting relatively fewer firms, such as Mers and Zika, have
relatively lower supply-side impact than outbreaks that affect many firms at once.
Stepping back, we hope that a deeper understanding of the various ways in which an
epidemic affects firms may facilitate developing effective government and/or corporate inter-
vention policies. Clearly, supply-side disruptions should be met with a substantially different
toolkit than what is appropriate for demand or finance-related shocks. More fundamentally,
however, our methodological innovation, in which we use word-based patterns to determine
whether a Covid-19 related text fragment discusses a given topic, has broader applications
and can be readily adapted for a range of tasks involving automatic classification of text
fragments in conference calls and other firm disclosures.
Related literature. The paper contributes to two fast-growing literatures in economics
and finance on Covid-19.3 One literature asks whether the Covid-19 recession is caused by
a demand shock, a supply shock, or a financial shock. Guerrieri et al. (2020) present a
theory of Keynesian supply shocks: they argue that deterioration of demand associated to
the Covid-19 pandemic will have larger economic effects than the supply shock that caused
it. The optimal policy, then, to face the pandemic in their model, combines loosening
of monetary policy and abundant social insurance. In a related study, Baqaee and Farhi
(2020) focus on complementarity, as opposed to substitutability (Guerrieri et al., 2020),
between sectors’ goods. In a stylized quantitative model of the U.S., they find supply and
demand shocks each explain about half the reduction in real GDP. Exploiting non-Gaussian
features of macroeconomic forecast revisions, Bekaert et al. (2020) attribute two thirds of
the decline in first- (second-) quarter 2020 GDP to a negative shock to aggregate demand
(supply). Other studies include Fornaro and Wolf (2020) (considering the pandemic as a
3
Of course, there is a large literature in development and health economics studying pandemics, either
in general or specific diseases, including papers like Fogli and Veldkamp (2020); Greenwood et al. (2019);
Philipson (1999).
5negative shock to the growth rate in productivity) and Faria-e Castro (2020) (modeling the
pandemic as a large negative shock to the utility of consumption).4 In finance, several studies
highlight the credit market access and liquidity consequences of the Covid-19 pandemic (Au
et al. (2020); Ferrando (2020); Kargar et al. (2020); Ma et al. (2020); Ozik et al. (2020)).
For example, Greenwald et al. (2020) argue, and show, that credit lines are central to the
transmission of macroeconomic shocks to firm credit, at both the aggregate level and in
the cross-section. For policymakers, then, it is essential to know what caused the Covid-19
recession to develop effective policy responses. This requires granular data, not just of which
firms are mostly affected by exposure to the pandemic, but also on what precisely describes
the main challenge(s) they face. Our paper complements this literature by identifying for
each firm the extent to which their Covid-19 exposure relates to demand, supply, or financing
shocks, as well as the extent to which policy interventions are on the mind of executives and
capital market participants.
Beyond the Covid-19 crisis, distinguishing empirically between supply, demand, and fi-
nancial impacts of specific shocks has long been an open question in macroeconomics (e.g.,
Blanchard and Quah (1989)). We believe that our work, and the empirical methods we
develop here may also be useful in this broader debate.
This paper also contributes to the literature on the impact and transmission of Covid-19
on the cross-section of equity returns (Alfaro et al. (2020); Bretscher et al. (2020)). The
consensus emerging from these studies is that, at the onset of the Covid-19 pandemic, stock
prices on average plunged, but since then have regained much of their value. This general
pattern, however, potentially masks important heterogeneity across firms. To examine firm-
level variation in Covid-19-related stock returns, Ding et al. (2020) use data on Covid-19 cases
from the John Hopkins University Cornonavirus Covid-19 Global Cases database, to measure
4
Atkeson (2020) and Eichenbaum et al. (2020) argue for integrating SIR models of the spread of a disease
with conventional macroeconomic models to study the effect of policy interventions in this context. Other
studies that investigate the policy response (and its economic impact) to the Covid-19 pandemic include
work that examines social distancing rules (Barro et al., 2020), lockdowns (Alon et al., 2020; Arnon et al.,
2020; Kaplan et al., 2020; Moser and Yared, 2020), and the Paycheck Protecton Program (Joaquim and
Netto, 2020).
6changes in the economy’s exposure to the pandemic. Davis et al. (2020), on the other hand,
rely on risk factor discussions in firms’ pre-pandemic financial disclosures (Form 10-K filings)
to characterize firm-level risk exposures, and find that pandemic-induced return reactions
covary with firms’ prior risk exposures. Our approach lends itself to quantifying firms’ current
exposure to Covid-19. Having a firm-level synchronous measure, as opposed to a historic or
aggregate measure, is especially important in view of the wide-ranging experiences of firms
dealing with the pandemic as suggested in the aforementioned studies. Despite the recovery
in aggregate stock prices, we find that exposure to Covid-19 accounts for large-scale variation
in the cross-section of stock returns.
Beyond this, as a methodological contribution, we introduce a novel approach to topic
identification: a new word pattern-based method, which enables us to automatically clas-
sify firms’ primary concerns related to the Covid-19 pandemic. Other topic classification
methods, in particular Latent Dirichlet Allocation (LDA), are viewed with suspicion by lin-
guistics—e.g., for involving considerable subjectivity and for being non-deterministic (i.e.,
repeating the same procedure multiple times may generate different topic word lists).
In sum, we provide new data and first evidence on the extent to which epidemic dis-
eases (and in particular the Covid-19 outbreak) affect the corporate world. The data show
that the scale of exposure to the coronavirus is unprecedented by earlier outbreaks, spans
all major economies and is pervasive across all industries. Using a new method to auto-
matically distinguish between supply- and demand-related impacts, we show the over-time
development in these concerns. Taking a step back, however, we show how our text-based
approach allows researchers, more generally, to investigate how corporations respond to large
unexpected macro shocks.
1. Data
We use transcripts of quarterly earnings conference calls held by publicly-listed firms to
construct our measures of firm-level exposure to epidemic diseases. These transcripts are
7available from the Refinitiv Eikon database and we collect the complete set of 333,626
English-language transcripts from January 1, 2002 to September 30, 2020 for 12,765 firms
headquartered in 82 countries.5 Earnings calls are key corporate events on the investor re-
lations agenda and allow financial analysts and other market participants to listen to senior
management presenting their views on the company’s state of affairs and to ask these com-
pany officials questions about the firm’s financial performance over the past quarter and,
more broadly, discuss current developments (Hollander et al., 2010). As epidemic diseases
potentially have a global impact, it is important that our data covers a significant propor-
tion of firms around the globe. Appendix Table 1 presents the details of the extensive global
coverage of listed firms in our sample.
We also use financial statement data, including data on firms’ total assets and the location
of the firm’s headquarters from Refinitiv Eikon.6 Stock return data are from the Center for
Research in Securities Prices (CRSP) and Refinitiv Eikon.
2. Measuring Firm-Level Exposure to Epidemic Diseases
We measure and characterize firm-level exposure to epidemic diseases by combining methods
described in our earlier work (Hassan et al., 2019, 2020) with a novel pattern-based approach
designed to isolate firms’ specific concerns relating to each disease.
2.1. Isolating discussions of epidemic diseases
The computational linguistic algorithms described in our two prior studies ultimately rest
on a simple count of word combinations in earnings call transcripts to measure a given firm’s
political uncertainty or exposure to Brexit in a given quarter, respectively. In Hassan et al.
(2019), a fundamental step is to determine which word combinations denote discussions
about political topics. These political “bigrams” follow from comparing training libraries of
5
This description applies at the moment of writing this paper. The publicly available data set on www.
firmlevelrisk.com is continuously updated as new transcripts become available.
6
Note that this latter variable is meant to measure the location of the operational headquarters rather
than the country of incorporation, which is often distorted by tax avoidance strategies.
8political text with those containing non-political text. In contrast, in Hassan et al. (2020),
the word needed to identify discussions about “Brexit” is self-evident.
To identify keywords informative about the discussion of epidemic diseases, we begin by
taking the list of pandemic and epidemic diseases maintained on the website of the World
Health Organization and focus on those outbreaks that occur within our sample period,
which starts in 2002.7 We then further restrict the list to diseases that, in our judgement,
attracted sufficient international audience and potentially were a concern to investors. This
restriction eliminates such outbreaks as the 2019 Chikungunya events in Congo and the 2018
Monkeypox in Nigeria.
For the remaining list of outbreaks, we identify the most common synonyms of each
disease in online resources and in newspaper articles at the time of the event. We also
perform a human audit on a limited sample of transcripts to verify that we are using the
disease word (combinations) that were in use during each of these outbreaks. Finally, we
verify that word combinations intended to capture diseases have no alternate meaning, such
as for example is the case for MERS and the “Malaysian Emergency Response Services 999.”
Appendix Table 2 lists the words (combinations) used per disease.
Having thus compiled our word (combination) list, our time-varying measure of a given
firm’s exposure to an epidemic disease d, denoted DiseaseExposured , is constructed by
parsing the available earnings call transcripts and counting the number of times the synonyms
from Appendix Table 2, associated with each disease d are used. We then divide this number
by the total number of sentences in the transcript to account for differences in transcript
length:
Bit
1 X
(1) DiseaseExposuredit = 1[b = Diseased ],
Sit b=1
where b = 0, 1, ...Bit represents the words contained in the transcript of firm i in quarter t
and S is the total number of sentences in the transcript.
7
www.who.int/emergencies/diseases/en/
92.2. Measuring risk and sentiment associated with discussions of each epidemic disease
To construct a measure of epidemic disease risk, denoted DiseaseRisk d , we augment this
procedure by conditioning on the proximity to synonyms for risk or uncertainty:
Bit
1 X
DiseaseRiskitd = {1[b = Diseased ] × 1[|b − r| < 10]},
Sit b=1
where r is the position of the nearest synonym of risk or uncertainty. Following the example
of Hassan et al. (2019, 2020), we condition on a neighborhood of 10 words before and after
the mention of an epidemic disease and obtain a list of synonyms for “risk” and “uncertainty”
from the Oxford English Dictionary.8
We also require a measure of shocks to the firm’s prospects, to gauge whether a disease
outbreak is considered good or bad news to the firm.9 Accordingly, the construction of
epidemic disease sentiment, denoted DiseaseSentimentd , closely follows the procedure for
DiseaseRisk d in that it counts the words associated with disease d ; however, instead of
conditioning on the proximity to words associated with risk, we condition on positive- or
negative-tone words to capture the first moment. These positive- and negative-tone words
are identified using the Loughran and McDonald (2011) sentiment dictionary:10
Bit
( b+10
!)
1 X X
DiseaseSentimentdit = {1[b = Diseased ] × S(c) ,
Bit b=1 c=b−10
where S assigns +1 if c ∈ S+ , −1 if c ∈ S− , and zero otherwise. Positive words include ‘good,’
8
See Appendix Table 3 for a list of these synonyms.
9
Having such a measure is also helpful to address the issue that innovations to the variance of shocks (risk)
are likely correlated with innovations to the conditional mean. Thus, teasing out the effects of disease-related
uncertainty on a firm’s actions also requires controlling for the effect of the disease event on the conditional
mean of the firm’s future earnings.
10
Thirteen of the synonyms of risk or uncertainty used in our sample earnings calls also have negative
tone according to this definition. Examples include ‘exposed,’ ‘threat,’ ‘doubt,’ and ‘fear.’ Our measures
thus explicitly allow speakers to simultaneously convey risk and negative sentiment. Empirically, when
we include both DiseaseRisk d and DiseaseSentimentd in a regression, any variation that is common to
both of these variables (as a result of overlapping words) is not used to estimate parameters of interest.
For this reason, overlap does not, in principle, interfere with our ability to disentangle DiseaseRisk d from
DiseaseSentimentd .
10‘strong,’ ‘great,’ while negative include ‘loss,’ ‘decline,’ and ‘difficult.’11,12 Appendix Table
4 show the most frequently used tone words in our corpus. As might be expected, descrip-
tive statistics suggest that disease-related discussions in earnings-call transcripts are domi-
nated by negative-tone words. Accordingly, in subsequent analysis, we sometimes bifurcate
DiseaseSentimentd into DiseaseN egativeSentimentd and DiseaseP ositiveSentimentd , sim-
ply by conditioning on either negative or positive sentiment words, respectively.
2.3. Measuring specific concerns relating to each epidemic disease
While our algorithm to measure firm-level exposure to epidemic diseases centers on counting
synonyms of each disease in earnings-call transcripts, having the full conversation between
management and market participants available, allows us to probe deeper into the underlying
concerns of firms and financial analysts to understand how a disease impacts corporate
policies and performance.
Doing so in a systematic way for all firms in our sample, presents a challenge, however,
because of the sheer volume of text fragments that need to be processed and classified to
identify the issues discussed by participants on a call. Indeed, focusing only on the 2020
coronavirus outbreak, 14,765 earnings call transcripts mention a Covid-19 synonym and
when we single out all text fragments within a given transcript that include these synonyms,
we find 174,582 sentence triples.13 Rather than relying on a human reading of these snippets,
we develop a word pattern based algorithm that automatically classifies sentence triples with
minimal human judgement. Indeed, human judgement is limited to just two instances in the
process.
11
We choose to sum across positive and negative sentiment words rather than simply conditioning on their
presence to allow multiple positive words to outweigh the use of one negative word, and vice versa.
12
One potential concern that has been raised with this kind of sentiment analysis is the use of negation,
such as ‘not good’ or ‘not terrible’ (Loughran and McDonald, 2016). However, we have found that the use of
such negation is not common in our sample, so we chose not to complicate the construction of our measures
by explicitly allowing for it.
13
We define a sentence triple as a set of three consecutive sentences, if available, by the same speaker such
that the middle sentence contains a Covid-19 synonym. We use this sentence triple as the unit of analysis for
our topic classification, because doing so provides slightly more context than the interval of 10 words before
and after the mentioning of the disease used in our definitions of DiseaseRisk and DiseaseSentiment.
11In a first step, we determine the set of topics that companies discuss when mentioning
a synonym for Covid-19. We randomly select Covid-19-related sentence triples with the
objective of finding broad categories that are simultaneously economically meaningful and
capture as many of the coronavirus-related discussions as possible. Further, the categories
should also be sufficiently sharply delineated to minimize classification ambiguity in our
automated reading of the sentence triples in the second step, as discussed below. Following
this procedure, we identify six key topics: (1) demand, (2) supply chain, (3) production
and operations, (4) costs, (5) financing, and (6) government support, where we sometimes
collectively refer to categories 2-4 as supply-related.
In the second step, we automatically classify all sentence triples into these six key topics
and a residual category that collects all other mentions of a disease, in particular those
that are unspecific as to the impact on the firm.14 This can be a difficult task even for the
human reader, let alone for a computer algorithm, because the way in which conference call
participants discuss each topic varies considerably. For example, there are subtle variations
in how corporate managers may discuss disruptions of their supply chains. Rather than
mention supply chains explicitly, they might instead mention that the SARS-crisis impacts
their ability to source components. The challenge of this second step, therefore, is to do
justice to such subtle variations when classifying sentence triples.15 To meet this challenge,
we develop an iterative procedure that combines limited human judgement with data-driven
decisions to identify a word pattern for each of our six specific topics.
A word pattern consists of two components: (1) a set of phrases (contiguous groupings of
words) that are directly related to a given topic, and (2) a set of (possibly non-contiguous)
word combinations that, when used together within a sentence triple, indicate the topic is
being actively discussed. For example, for a sentence triple to be assigned to the “supply
chain” category, we require it to either include a directly-related phrase such as “supply
14
For example: “There is no doubt that COVID-19 is impacting our business.”
15
With a sufficiently large labeled training data set, one could train a neural network, which tend to
perform well with supervised classification tasks. However, this would require hand-labeling thousands of
sentences.
12chain” or, for example, the combination of the words “component” and “impact.” In addi-
tion, we allow a word pattern to specify topic-specific constraints that need to be satisfied
in order for its match to be considered valid. For example, a pattern may specify that the
word “demand” is only valid if it is used as a noun as opposed to as a verb. Or, to give
another example, the word combination consisting of the words “cost” and “increased” may
be not valid if the phrase “last year” appears in between these words.
To obtain such word patterns for each of the six topics we read and hand-label 600 ran-
domly selected sentence-triples that mention Covid-19 from our conference call transcripts,
437 of which we can unambiguously assign to at least one of our six topics. This is our
training data set. For each topic, we then iteratively devise a word pattern with the goal
of balancing correctly predicting the labels of these hand-labeled sentence triples (training
dataset) with accurately predicting the content of previously unseen sentence triples (vali-
dation dataset). Balancing the predictive performance on these two data sets helps us to
prevent overfitting on the training dataset.
More specifically, we start by defining the word pattern as a small set of phrases that
frequently occur in a given topic’s training set and that are economically closely linked to the
topic (e.g., “stimulus” for the “government” category). We then check the fit of the pattern
in our training data. By examining false positives and false negatives, we update the pattern
(e.g., expand the set of phrases) such that it improves the in-sample fit.16 We continue this
process until the pattern predicts the labels in our training data with no more than 10 false
positives and negatives. Once this threshold is met, we audit the pattern with a validation
data set: We randomly draw 30 sentence triples that comply with the new pattern from the
population of sentence triples mentioning Covid-19 in our earnings conference call data. We
read these text excerpts and classify them as true or false positive matches to the predicted
topic. If this audit produces fewer than 8 false positives, we stop and save the pattern. If
16
To expedite this process of improving in-sample fit we found it useful to use embedding vectors trained
on conference calls as well as lexical databases to identify closely-related words that often co-occur with
words in the pattern.
13not, we adjust the pattern such that its predictive performance on the validation set meets
the threshold, before going back to examining the updated pattern’s performance on our
training data and, if needed, iterating and auditing again with another validation data set.
Once we have arrived at a pattern that meets both criteria the iteration ceases.
Table 1 shows our final word patterns for each of the six topics. To make the table easier
to read we abstract from stemming, although our algorithm allows for it, so that, for example
the word ‘challenge’ also allows for ‘challenges’ and ‘challenging,’ and all nouns apply both
in singular and plural. In addition to the words and phrases listed in the table, each topic
comes with a list of exclusions, which are somewhat more tedious to read and summarized
in Appendix Table 5.
Looking across Table 1 shows that the word patterns are largely intuitive, where for
example the “Production and Operations” topic features any discussions of [government]
permits, productivity, throughput, closures, and shutdowns in conjunction with a mention
of Covid-19 or other epidemic disease.
Appendix Figure 1 uses “confusion matrices” to report our algorithm’s fit to the training
dataset for each of our six topics after the final iteration. Each matrix shows the number
of true positives, false positives, true negatives and false negatives of each pattern. For
example, Panel A shows that the algorithm correctly labels 134 sentence triples as related to
demand, while producing six false positives and seven false negatives. 290 sentence triples
relating to one of the other five topics are correctly identified as not relating to demand.
Appendix Table 6 shows results of the last manual audit performed in our iterative process.
All but one topic are near or below five false positives; the highest number of false positives
is eight for the category Production and Operations.
Finally, given our pattern-based classification of all 174,582 sentence triples mentioning
Covid-19, we define each firm-quarter’s exposure to a given Covid-19-related topic as
Sit
1 X
COVID-19TopicExposureTit 1[s ∈ PT ] ,
=
Sit s=1
14where Sit is the total number of sentence triples in the transcript of firm i in quarter t and
and PT is the set of patterns associated with topic T .
3. Exposure to Epidemic Diseases
3.1. Descriptive evidence
Next, we use our newly developed measures of firm-level exposure to epidemic diseases to
document some salient empirical patterns present in the data. The emphasis in the discussion
is on the firm-level exposure to the coronavirus pandemic, but we have occasion to present
some findings on the earlier epidemic diseases in our sample period too.
Indeed, Figure 1 depicts the time-series of the percentage of transcripts in which a given
disease is mentioned in a quarter separately for Covid-19, SARS, H1N1, Ebola, Zika, and
MERS, respectively (moving from the top panel to the bottom).17 Reassuringly, these pat-
terns closely follow the infection rates for each of the diseases in the population. For example,
SARS, according to the WHO, was first recognized in February 2003 (although the outbreak
was later traced back to November 2002), and the epidemic ended in July 2003. Accordingly,
discussions of SARS in earnings conference calls peak in the first quarter of 2003 and quickly
trail off after the epidemic ends. SARS, which is also a disease caused by a coronavirus,
returns as a subject in earnings calls in the first quarter of 2020, when it becomes clear that
Covid-19 shares some commonalities with the former outbreak.
The figure highlights once more how exceptional Covid-19 is. Forty percent of transcripts
discuss the outbreak in the first quarter of 2020, and then almost 100 percent of transcripts
thereafter: a much larger proportion than in any of the previous outbreaks (with SARS as the
closest “competitor” at just over 20 percent). In Appendix Figure 2, we provide additional
detail for the separate cases of China, the United States, and Europe (including the UK).
Interestingly, SARS was a pervasive topic of discussion in China (at levels similar to Covid-
19), whereas the Ebola-virus did not feature at all in earnings calls of firms headquartered
17
Our sample currently ends with calls held through September 30, 2020.
15in China. Also, the time span during which diseases are discussed in earnings calls of China-
based companies is much tighter than for firms in Europe and in the US.
In Figure 2, we zoom in on the first few months in which a given disease occurs and com-
pare by region in which a firm is headquartered, the weekly average corporate exposure to
Covid-19, SARS and H1N1. One immediate takeaway that follows from comparing the plots
is that Covid-19 prevails in discussions in earnings calls. The “peak”—i.e., the maximum
value of frequency—is much higher than for any of the previous outbreaks: in the summer of
2020, more than three percent of all sentences in our sample transcripts contain discussion
of Covid-19. (For comparison, only 0.7 percent of sentences in the average transcript in our
sample mention ‘competition,’ ‘competitive,’ ‘compete,’ ‘competing,’ or ‘competitor.’) What
is more, the exposure to diseases during their epidemic episode is much less synchronised for
SARS and H1N1 than for Covid-19, which is rising simultaneously in all parts of the world.
The saw-tooth patterns in the cases of SARS and H1N1 signify that earnings call discus-
sions of the disease peaked sequentially in different regions around the world during these
outbreaks, with early peaks representing regions in which the disease was first discovered.
In contrast, Covid-19 exposure grows rapidly between April and May 2020 in all regions
except China, and remains high thereafter. For companies headquartered in China, much of
the acceleration in exposure occurs before April, consistent with the outbreak affecting the
country hard in the first months of the year. Firm-level exposure to SARS and H1N1, again
consistent with the development of infection rates in the population, climbs first in Asia and
Mexico respectively (the putative origin regions of the two diseases).
To assess the firm-level impact of exposure to Covid-19 in the opening months of 2020,
we plot the weekly average Covid-19 risk and sentiment scores in Figure 3. We observe
relatively low Covid-19 risk and slightly negative sentiment in January and February, but by
March, weekly average Covid-19 risk climbs quickly and reaches a maximum in early May.
These developments are mirrored in the weekly average sentiment during the same period,
which declines precipitously from March to early July. From June onward, Covid-19 risk
16remains high (although never reaching the levels of May again) until the end of the sample
period. In contrast, Covid-19 sentiment improves markedly during the summer months,
albeit that sentiment remains negative overall. In Appendix Figure 3, we document that the
improvement in sentiment after the first quarter is driven mainly by a more positive outlook
among Asian firms. Nevertheless, despite some recovery in firms’ assessment of the impact
of the pandemic on their future cash flows, their risk assessment continues to be unabated
high throughout the first three quarters of 2020. In this sense, for the average firm, Covid-19
is not only bad news but also confronts management with a major increase in uncertainty.
These aggregate patterns are important but mask interesting variation at the sector level
as shown in Panel A of Figure 4 (again using data for the first three quarters of 2020, up to
September 30). High Covid-19 risk is found in sectors such as education and healthcare, but
also in technology, whereas perceived risk associated with Covid-19 is noticeably lower for
energy and utilities and consumer cyclicals. Importantly, the average sentiment is negative
across sectors, but at the same time, outlooks are much less negative in technology and
consumer non-cyclicals than in transportation and energy and utilities. These patterns
make intuitive sense: while the crisis severely decreased travel by air and train, and the
demand for oil, some supermarkets and tech firms actually saw their businesses expand, as
people increasingly work and dine at home. At the same time, the education and healthcare
sectors face tremendous changes and volatility as Covid puts into question the ability to
deliver these services in person (high risk).
These by-sector figures, while documenting extensive variation in outlook across different
parts of the economy, still hide substantial heterogeneity between firms within a given sector.
We illustrate this point in Figure 5 in which we plot Covid-19 sentiment scores for firms in the
S&P 500 within the transportation (Panel A) and technology (Panel B) sector, respectively.
Reflecting the average sector scores in Figure 4, most of the transportation-related firms have
negative sentiment scores, whereas a substantial subset of technology firms cluster in the
positive region of the scale. Airline companies, such as United, American, and Delta feature
17prominently in Panel A. Accordingly, when connecting their Covid-19 sentiment scores with
the fragments in the earnings call transcript that weigh heavily into their position on this
scale, we find negatively toned discussions. For example, United Airlines Holdings mentions
in its May 2020 call: “... we became the first airline to respond to the coronavirus by
planning for a capacity cut drastically reducing capex for ...” and “as a strong quarter
quickly deteriorated as the spread of covid disrupted travel as well as the lives of everyone
around.” Delta likewise in July 2020 reports “... loss that we just posted reflects the severe
impact that covid is having on our company and our industry this June.” The negative
sentiment is not limited to airlines, however. The freight-hauling railroad Union Pacific
records in the same month “finally food and beverage was down primarily driven by covid
related production challenges for import beer and supply chain shifts.”
In contrast, to illustrate the (relatively) more optimistic tone in the technology sector,
consider Intel’s assessment about its role in the pandemic in April 2020: “some innovative
solutions that are helping the medical community tackle covid. One example is medical
informatics sickbay platform powered by Intel.” Apple, likewise, offered a rosy view with
comments such as “... Apple products and offerings to successfully navigate their business
through covid in health care we are seeing rapid acceleration of telehealth to ...” ServiceNow,
which develops a cloud computing platform to facilitate digital workflows for companies,
emphasizes in July that they had a “strong quarter for servicenow despite the macroeconomic
headwinds created by covid. We exceeded the high end of our subscription revenues and ...”
These illustrations do not only underpin our finding that Covid-19 exposure, risk and
sentiment vary across sectors, but also, significantly, across firms within a given sector.
Furthermore, they also hint at the driving factors behind the firm-level variation in Covid-
19 exposure scores and outlooks. Indeed, Union Pacific executives highlight production
challenges and disruptions of the supply chain; United reports severe financial impacts of a
dramatic drop in demand; and Apple and ServiceNow experience increased demand for their
products. We exploit these possibilities systematically in our topic-based analysis below.
18Before doing so, however, we first briefly discuss whether epidemic data (on infection and
mortality rates in the population) predict firm-level Covid-19 measures.
3.2. Infection rates and Covid-19 Exposure
Intuitively, the extent to which a population is exposed to a disease in a region should
be associated with the exposure of firms to the same. Thus, infection rates should be
correlated with our firm-level exposure measures. Indeed, our Covid exposure measures
could be subsumed by infection rates if what truly matters to understand the effects of the
pandemic on firms, is simply the aggregate incidence of infections in the economy. We explore
these questions closer in Appendix Table 7. In short, we find that infection and mortality
rates in a country are positively associated with COVID-19 NegativeSentimenti,t , implying
that more infections go hand in hand with negatively toned discussions about the coronavirus
in the earnings calls. As expected, COVID-19 Exposurei,t is also positively associated with
infection rates.
3.3. Two Case Studies
We further demonstrate the working of our DiseaseExposured measure by providing two
case studies. We choose two illustrative firms, plot their exposure scores to epidemic diseases
during the sample period (summing across all diseases d), and include text excerpts taken
from their conference call transcripts to explain the peaks in exposure. Figure 6, Panel A
depicts the case of United Airlines Holdings (and its predecessors), which has had significant
exposure to successively SARS, H1N1, and Covid-19. An interesting excerpt from the Q1-
2013 earnings call refers to United’s earlier experience with H1N1 and how the airline has
made sure it has flexibility in its capacity to deal with demand shocks. Both SARS and
H1N1 receive ample attention during their respective outbreaks as the firm discusses how
demand for air travel is (regionally) affected. The coronavirus makes its appearance in
the first quarter of 2020, but the firm indicates that travel has not been impacted yet by
19any restrictions imposed by public health agencies. Nevertheless, measured exposure to the
coronavirus remains very high throughout 2020.
The second case study, shown in Panel B of Figure 6, is on the US casual wear retailer
Abercrombie & Fitch. In some ways, this company provides a good illustration of how unique
the coronavirus outbreak is: its plot shows very little exposure to epidemic diseases before
Covid-19, yet a large peak in Q1 2020. There is some discussion of how company operations
are impacted during the SARS epidemic. The excerpt provided in the plot discusses how the
firm experienced little disruption in its supply chain, even though movement of employees
had been restricted. In the earnings call held in the first quarter of 2020, however, the
outlook is much different. Abercrombie & Fitch estimate a drop in earnings due to store
closures in mainland China, possible supply chain disruption, and increases in inventory.
Compared with the earlier SARS exposure, the amount of discussion of the disease in the
earnings call is much more extensive. Exposure scores decline somewhat as 2020 progresses,
but remains at levels far exceeding the SARS outbreak.
3.4. Stock market response to firm-level Covid-19 exposure
We next ask whether Covid-19 exposure, sentiment and/or risk can account for variation
in stock price changes as measured in (1) a long-window accumulated over the first three
quarters of 2020, (2) the first quarter only, or (3) over a short window centered on the
earnings call date (using earnings calls for all three quarters of 2020). Intuitively, standard
asset pricing models suggest that a change in stock price occurs when investors, on aggregate,
revise their views on expected future cash flows and/or on the expected discount rate. Thus,
a more positive sentiment about an epidemic disease should be associated with an increase
in returns, whereas a higher perceived risk is expected to be negatively associated with the
selfsame. Exposure, on the other hand, does not have an ex ante clear prediction with stock
prices, but given that the shock appears to have increased uncertainty and worsened the
outlook for the average firm, most likely is negatively associated with returns.
20We test these predictions using the following regression:
0
(2) Reti,t = α0 + δt + δj + δc + βCOVID-19 Xi,t + Zi ν + i,t ,
where Reti,t is either the cumulative quarterly return or the cumulative return over a three-
day (-1,1) window around the date of the earnings call; COVID-19 Xi,t , is either our coro-
navirus Exposure, Sentiment, or Risk score; and the vector Z includes our standard set of
control variables. We also split COVID-19 Sentimenti,t into a negative and positive senti-
ment variable, to document the association between positive (negative) Covid-19 news and
returns. Return variables are winsorized at the first and last percentile.
The vector Z contains the natural logarithm of the firm’s assets, as a control for the size
of the firm, and the stock return beta, calculated by regressing daily returns in 2018 for firm
i on the S&P 500 index (to measure the firm’s exposure to the US capital market). Where
possible, we include both quarter (δt ) and two-digit SIC sector (δs ) fixed effects, as well as
headquarters country fixed effects (δc ) when we do not focus specifically on the sample of
US firms. In all regressions, standard errors are robust.
Summary statistics for all variables are reported in Table 2. For ease of interpretation, we
multiply all firm-level exposure, sentiment, and risk variables by 100, so that, for example,
the mean of COVID-19 Exposurei,t of 2.221 means that during the first three quarters of
2020, there are on average 2.221 Covid-19-related words per 100 sentences in an earnings
call.
Table 3, Panel A presents our estimation results using the quarterly returns over the
first three quarters as the dependent variable, which we detail for the full sample (columns
1-3) and separately for the US (columns 4-6). We document a significantly negative asso-
ciation between a firm’s coronavirus Exposure and its stock return (in columns 1 and 3).
Thus, firms with more extensive discussions in their earnings call about the Covid-19 out-
break experience a greater stock price decline than firms with less exposure; and this holds
21even more so true for the US sample. For example, in column 1, a one standard devia-
tion increase in COVID-19 Exposurei,t (0.023) is associated with a 1.92 percentage point
lower return in the quarter of the conference call. Next we consider whether this return re-
sponse derives from investors revising their expectations of future cash flows, as measured by
COVID-19 Sentimenti,t , or their expectations of the firm’s required rate of return, captured
by COVID-19 Riski,t .
When regressing each of these variables onto the cumulative returns, results show that
both explain variation therein (columns 2 and 5). Note, however, that when we sepa-
rate out positive and negative sentiment in columns 3 and 6, only the association between
COVID-19 NegativeSentimenti,t and returns remains consistently negative and significant in
both the full and US samples (though the magnitude of the coefficients tends to remain
stable across specifications). For example, in column 2, a one standard deviation increase in
negative covid sentiment (1.225) is associated with a 1.9 percentage point decrease in stock
returns.
We repeat this analysis in Table 3, Panel B. In this panel, our attention is on the first-
quarter stock price response only. In this period, especially in January and February 2020,
arguably, much of the impact of Covid-19 on the corporate world in the US was still un-
clear, whereas elsewhere in the world, most notably of course in China, the pandemic’s
consequences were already manifest. Accordingly, we observe some more pronounced dif-
ferences between columns 1-3, reporting on the full sample, and columns 4-6, for the US
only.
COVID-19 Exposurei,t is significantly negatively associated with first-quarter returns in
the full sample (column 1), but not in the US (column 3). Although the coefficient estimate
for the US sample is sizeable, standard errors are about 35 percent higher than in the full
sample. In the full sample, when we consider COVID-19 Sentimenti,t and COVID-19 Riski,t
separately, both are significantly associated with first-quarter cumulative returns, with the
predicted signs (column 2). Moreover, consistent with a much larger swing in aggregate
22stock prices in the first quarter, all estimated coefficients are about three times larger than
those in Panel A.
In Panel C, finally, we examine the short window returns surrounding the earnings call in
which Covid-19 is discussed. We use earnings calls from all three quarters of 2020. Both in
the full sample and the US sample, we document a significant negative association between
COVID-19 Exposurei,t and three-day returns (columns 1 and 4), consistent with the view
that conference calls reveal some incremental information about firms’ Covid-19 exposure.
In column 1, the estimated coefficient implies that a one standard deviation increase in
COVID-19 Exposurei,t (0.023) is associated with a 0.54 percentage point lower return in this
narrow window around the conference call.
Next, we consider whether this return response derives from investors revising their ex-
pectations of future cash flows, as measured by COVID-19 Sentimenti,t , or their expectations
regarding the firm’s required rate of return, captured by COVID-19 Riski,t . We find, both in
the full sample and the US sample, that the short-window returns are significantly associated
with COVID-19 Sentimenti,t but not with COVID-19 Riski,t (columns 2 and 5), though even
the latter retains the predicted sign.
Across all the panels of Table 3, the conclusion emerges that our measures of Covid-19 risk
and sentiment indeed contain information relevant to firms’ fortunes during the coronavirus
pandemic, and that some of this information may in fact be originally transmitted to markets
through earnings conference calls (Panel C). The association between stock returns and
our measures is strongest in the first quarter, when markets world-wide first crashed in
response to the outbreak, but remains significant throughout all three quarters. That is,
the fall and subsequent recovery in aggregate stock prices in the winter and summer of
2020 mask significant covid-induced heterogeneity in the cross-section of firms. We aim
to systematically exploit the discussions of how a firm is affected by the pandemic in the
earnings call transcripts in the next section, in which we identify the content of covid-related
concerns and use this to shed light on how the speed of recovery and the type of concern are
23related.
4. The Supply, Demand, and Financing Impacts of Epidemic Diseases
Table 4 presents the findings from our automated reading of the full sample of coronavirus
sentence triples. We assess the frequency with which a topic category is mentioned in the
earnings conference call by computing the percentage of Covid-19 related sentence triples
with a given topic label among all Covid-19 related sentence triples in our corpus. As shown,
the most commonly voiced concern when the discussion turns to the possible impact of the
pandemic on the firm is the sudden change in demand. Indeed, 30.91 percent of all sentence
triples mention demand, as witnessed in our showcased sentence triple in Table 4, which
explicitly links a negative impact on revenues to Covid-19 .
Financial analysts also question management about disruptions to the supply chain (4.14
percent) and operations or the closure of a given firm’s own production facilities and stores
(20.00 percent). A typical example is management noting that “traditional and convenience
stores are closing or suffering from a significant in-store traffic decline” and “several of our
factories and warehouses are closed to comply with local government regulations.” Higher
costs, and cost-saving measures, due to Covid-19 represent a further “supply side” concern,
that is discussed in 9.44 percent of the sentence triples. In some cases, firms explicitly
mention that they have taken precautionary measures to diversify their supply lines based
on their prior experience with an epidemic disease (most often SARS).
Turning to financing frictions, a concern that becomes more prominent for takeway sec-
ond quarter of 2020, as we will document below, we classify 10.08 percent of sentence triples
in this category. A relatively small percentage of triples (viz., 1.41 percent) discusses issues
regarding government interventions to support the economy or counter the adverse economic
effects of the pandemic. Thus, when call participants discuss programs such as the CARES
Act or the Paycheck Protection Program, this counts towards their government topic score.
Figure 7 provides a visualization of the changes in frequency in which each of these afore-
24You can also read