Mapping artisanal mining areas and mineral supply chains in eastern DR Congo - Impact of armed interference & responsible sourcing
←
→
Page content transcription
If your browser does not render page correctly, please read the page content below
Mapping artisanal mining
areas and mineral supply
chains in eastern DR Congo
Impact of armed interference & responsible sourcing

          International Peace Information Service vzw
EDITORIAL

Mapping artisanal mining areas and mineral supply chains in Eastern DR Congo
Impact of armed interference & responsible sourcing

Antwerp, April 2019

Cover image: Gold Mine in Kalehe, South Kivu (Photo: IPIS)

Authors: Ken Matthysen (IPIS), Steven Spittaels (IPIS associate researcher), Peer Schouten (DIIS)

Coordinator field research: Zacharie Bulakali Ntakobajira

Map, database and graphs: Manuel Claeys Bouuaert, Stef Verheyen

The International Peace Information Service (IPIS) is an independent research institute providing
tailored information, analysis and capacity enhancement to support those actors who want to realize a
vision of durable peace, sustainable development and the fulfilment of human rights.

The Danish Institute for International Studies (DIIS) is an independent research institute that pro-
vides analysis of international politics. The research is organized around a large number of programs
that cover topics ranging from natural resources and the environment, to terrorism and migration.

The 2016-2018 mapping of artisanal mining sites in eastern DRC was funded by the International Or-
ganization for Migration- IOM in the DRC through the United States Agency for International Develop-
ment-USAID funded Responsible Minerals Trade (RMT) project. Case studies were funded through a
Conflict Research Fellowship of the SSRC for the LSE-based Conflict Research Programme.

D/2019/4320/07

                                                     2
TABLE OF CONTENTS
Editorial.................................................................................................................................................. 2
Key concepts.......................................................................................................................................... 5
List of acronyms..................................................................................................................................... 6
Executive Summary............................................................................................................................... 7
    Armed interference in mining.........................................................................................................................................7
    Link between armed conflict and armed interference...........................................................................................8
    Impact of responsible sourcing on armed interference.........................................................................................8
    Socio-economic aspects....................................................................................................................................................8
    Challenges for responsible supply chains...................................................................................................................9
    Concluding remarks..........................................................................................................................................................10

1. Introduction and background....................................................................................................... 12
    1.1.     Scope and key findings.........................................................................................................................................12
    1.2. Background...............................................................................................................................................................12
    1.3. IPIS’ Methodology ..................................................................................................................................................13
    1.4. Data gathered..........................................................................................................................................................13

2. Armed interference in eastern DR Congo’s artisanal mining sector.......................................... 15
    2.1. Armed interference at mining sites..................................................................................................................15
             2.1.1.      Armed interference: provincial differences.............................................................................................................................. 15
             2.1.2.      Armed interference: different actors..........................................................................................................................................18
    2.2. Roadblocks: the militarization of supply chains.......................................................................................... 20

3. Comparing armed conflict with armed interference at mining sites......................................... 24

4. Responsible sourcing: does it mitigate armed interference?..................................................... 28
    4.1.     Armed interference and responsible sourcing............................................................................................ 28
             4.1.1.      Responsible sourcing over time: decreasing interference....................................................................................................29
             4.1.2.      Armed interference: geography matters.................................................................................................................................. 31

5. Socio-economic aspects................................................................................................................ 32
    5.1.     Social and economic indicators related to mineral exploitation.......................................................... 32
             5.1.1.      Miners’ mobility..............................................................................................................................................................................32
             5.1.2.      Cooperatives....................................................................................................................................................................................32
             5.1.3.      Women..............................................................................................................................................................................................34
             5.1.4.      Mining site owners and the distribution of revenues............................................................................................................34
    5.2. Economic indicators related to mineral trade.............................................................................................. 35
             5.2.1.      Pricing along the trading chain..................................................................................................................................................36
             5.2.2.      The impact of traditional customs and local dynamics.......................................................................................................38
             5.2.3.      The impact of exchange rates.....................................................................................................................................................38
             5.2.4.      The impact of world market prices............................................................................................................................................39
             5.2.5.      The impact of distance/enclavement........................................................................................................................................40
             5.2.6.      The impact of the quality of the minerals................................................................................................................................41
             5.2.7.      The impact of monopolies...........................................................................................................................................................41
             5.2.8. The impact of responsible sourcing...........................................................................................................................................43

                                                                                                          3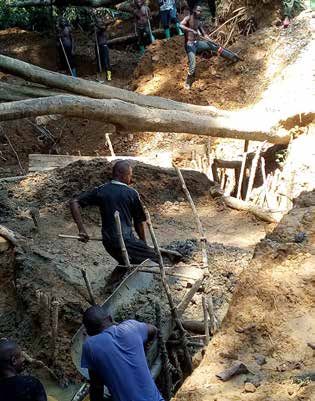
5.3. State control and formalization of the ASM sector.................................................................................... 44
             5.3.1.    Presence of state services..............................................................................................................................................................44
             5.3.2.    Carte de creuseur............................................................................................................................................................................45
             5.3.3.    Cooperatives....................................................................................................................................................................................46
             5.3.4.    Taxation............................................................................................................................................................................................46

6. Responsible sourcing challenges.................................................................................................. 50
    6.1. Mineral traceability at a distance...................................................................................................................... 50
    6.2. Commercialisation of tags.................................................................................................................................. 50
    6.3. Contamination of responsible supply chains................................................................................................51

7. Conclusions..................................................................................................................................... 53
    7.1.     Armed interference............................................................................................................................................... 53
    7.2. Mining and mineral trade................................................................................................................................... 54
    7.3. How sustainable is the situation?..................................................................................................................... 55

                                                                                                         4
KEY CONCEPTS
Below is a list of some terms that are regularly used throughout the report. These are no official defini-
tions, but rather denominations that make it easier to refer to certain types of mines or initiatives.
Armed interference: this term is used to describe all cases where a non-state armed group, an army unit
or an armed criminal network make (illegal) profits from mineral exploitation or trade, through their
physical presence in mining zones, or through more indirect interferences;
Non-armed interference: this term is used to describe all cases where unarmed officials make (illegal)
profits through their presence in mining zones;
Militarisation of mining sites: this term is used to point out that an armed group or army unit controls a
mining zones, either through permanent presence or regular visits. Militarisation often, but not always,
implies armed interference;
Responsible sourcing (initiatives): Initiatives that have been implemented to address armed interference
in mineral supply chains. In this report we focus on iTSCi traceability and the validation of mining sites;
iTSCi mines: Mines that are covered by the iTSCi Programme for Responsible Mineral Supply Chains. The
International Tin Association (ITA)’s programme iTSCi monitors mineral supply chains in eastern Dem-
ocratic Republic of the Congo (DRC). It implements traceability by providing labels to Congolese state
agents, so that they can tag 3T mineral production at the mine site and along the trade route to verify
the origin of the minerals further down the chain. Furthermore, it also implements related activities to
monitor the supply chains, including incident reporting, risk management, etc. iTSCi has been very suc-
cessfully deployed, as it already covers a few hundred mines in eastern DRC
Validated mines: Mines visited periodically by ‘joint validation teams’, which include representatives from
the government, state agencies, and international partners working in the natural resources sector.
These teams assess the security situation at the site and its surroundings, as well as socio-economic risks
such as child labour, depth of pits, presence of pregnant women and environmental issues. They classify
sites as red, yellow or green depending on their observations.

                                                    5
LIST OF ACRONYMS

     ANR		     Agence Nationale de Renseignements
    APCLS      Alliance des patriotes pour un Congo libre et souverain
     ASM       Artisanal and Small-Scale Mining
    CNRD       Conseil national pour le renouveau et la démocratie
   DGR-NK		    Direction Générale des Recettes du Nord Kivu
     DRC		     Democratic Republic of the Congo
    FARDC		    Forces Armées de la République Démocratique du Congo
       FC		    Congolese Francs
     FDLR      Forces Démocratiques de Libération du Rwanda
     FRPI		    Forces de Résistance Patriotique d’Ituri
    ICGLR      International Conference on the Great Lakes Region
      ITA      International Tin Association
     iTSCi		   ITA Tin Supply Chain Initiative
     NDC		     Nduma Defense of Congo
    NDC-R		    Nduma Defense of Congo-Rénové
    OECD		     Organisation for Economic Co-operation and Development
     PDG		     Président Directeur Général (a mine shaft manager or pit boss)
     PNC		     Police Nationale Congolaise
  SAEMAPE      Service d’Assistance et d’Encadrement des Mines Artisanales et de Petit Echelle
   SAKIMA		    Société Aurifère du Kivu et du Maniema
     SMB		     Société Minière de Bisunzu

                                             6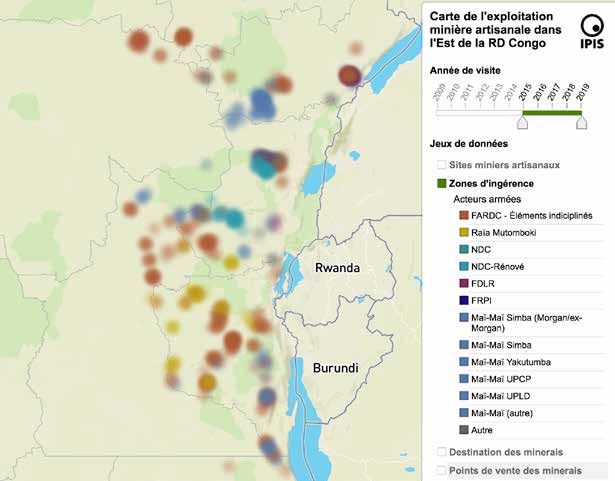
EXECUTIVE SUMMARY
For ten years IPIS has researched, and gathered extensive data on, the linkage between conflict and
mineral resources in the eastern Democratic Republic of the Congo (DRC). The current report draws a
number of key lessons about this linkage, and about the impact of responsible sourcing efforts that aim
to tackle this issue.
IPIS’ unique cumulative dataset includes data on 2,700 mines - employing an estimated 382,000 artisanal
miners, 945 roadblocks and 71mineral trading centers.

Armed interference in mining
The report provides detailed figures about the levels of armed interference in the different provinces of
eastern DRC. The frequency of armed interference at the visited mining sites was highest in North Kivu,
South Kivu and Ituri, where armed interference was reported at at least a third of the visited mines. The
relative number of cases of armed interference in the Province of Maniema is significantly lower at 17%,
and there was almost no reported armed interference in the former Katanga Province.
In North Kivu, several non-state armed groups still interfere in the mining sector including the Mai Mai
Simba, commanded by Mando, the two Nduma Defense of Congo (NDC) factions, and the Nyatura mili-
tia. The Forces Démocratiques de Libération du Rwanda (FDLR), on the other hand, lost control over most
of its mining areas over the past three years. South Kivu’s artisanal mining sector has been affected by
two important armed groups, i.e. Raia Mutomboki - mostly in Shabunda territory, and Mai Mai Yakutum-
ba in Fizi. Finally, in Ituri FRPI rebels and Mai Mai rebels commanded by Manu (former Simba rebels of
the deceased rebel leader Morgan) continue to interfere in mining.
Overall, however, units of the Congolese army
(FARDC) are the main culprits of armed interfer-
ence, at 66% of the affected mining sites (198 out
of 265) in the 2016-2018 sample. This is perfect-
ly illustrated by the Province of Maniema, where
armed conflict is very limited, but 38% of the
mines is still ‘militarised’ by army units.
IPIS’ data also illustrates that artisanal mining
only constitutes one among many sources of
financing for conflict actors in eastern DRC, such
as roadblocks and the taxation of other kinds of
natural resources. The research on roadblocks
demonstrates that armed actors do not need to
have direct control over mining sites to benefit
from the artisanal mining sector. While armed ac-
tors, and especially army units, might not be phys-
ically present at some mines in militarised mining
areas, IPIS notes a consistent pattern whereby the
army instead consistently erects roadblocks some
distance away from these mining sites. The Con-
golese army is present at almost half of the total
number of roadblocks that were mapped, and is
responsible for nearly half of all the instances in
which minerals were taxed.                                Cassitérite Mine in Kailo, Maniema Province (Photo: IPIS)

                                                      7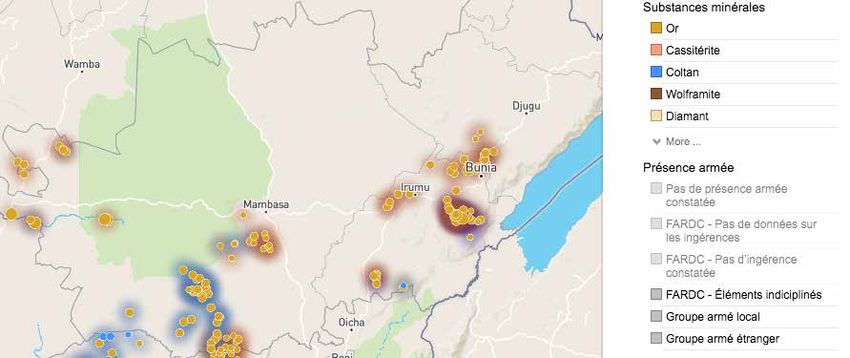
Link between armed conflict and armed interference
Remarkably, IPIS’ data reveals that, currently, armed conflicts are often not related to interference in
the artisanal mining sector. Comparing the IPIS data with available conflict event data suggests that
the control over mining sites is not a frequent battle objective for several of the most active conflict par-
ties. Instead armed interference in artisanal mining often takes shape as illegal ‘protection rackets’, while
armed confrontations largely take place elsewhere and for other stakes.
Nevertheless, these illegal ‘protection rackets’ do contribute to the overall insecurity in eastern DRC and
reinforce its reputation as a region where it is nearly impossible to conduct ethically responsible busi-
ness. In addition, some of the frontlines do appear to be related to the control over mining sites. The
NDC-R, for example, has specifically targeted mining areas controlled by rival armed groups.

Impact of responsible sourcing on armed interference
IPIS has been gathering systematic data on the issue of armed interference from before 2010, when the
first cautious initiatives on responsible sourcing of minerals were launched. Therefore, IPIS’ data provides
the opportunity to assess the impact of responsible sourcing on armed interference, even though it has
not been specifically designed to make such an exercise.
‘iTSCi mines’ and ‘green validated mines’ will be compared with non-validated and non-iTSCi mines. This
report represents in no way an evaluation of the impact of these initiatives. These initiatives are rather
the only ones that have been scaled sufficiently, and managed to include a wide range of mines, in order
to make meaningful comparisons. iTSCi and ‘green’ validated mines are considered to be mines that are
covered by responsible sourcing efforts
It appears that responsible sourcing initiatives have had a positive impact, reducing the level of
interference by armed actors at mining sites.
Mines covered by responsible sourcing programmes experience considerably lower levels of armed in-
terference. Yet this does not necessarily mean that responsible sourcing programmes are the cause of se-
curity at mining sites. Often, it is precisely the (pre-existing) absence of armed interference that attracts
validation and iTSCi involvement in the first place.
Nevertheless, IPIS data also shows that armed interference is decreasing over time in areas with more
scrutiny - where responsible sourcing initiatives are being implemented.
Many problems with regards to armed and illegal interference remain, however, despite responsible
sourcing.
Notwithstanding the positive evolutions that have been described above, armed interference in artis-
anal mining persists. IPIS data shows that responsible sourcing targets accessible sites. Armed interfer-
ence in mining seems to continue undisturbed in more remote areas.
Furthermore, some other specific issues continue, including illegal taxation by armed actors at road-
blocks, and the interference by Congolese army units. Moreover, non-armed interference by state offi-
cials remains an issue, which contributes to the overall levels of insecurity, facilitates illegal trade, and
tolerates criminal networks.

Socio-economic aspects
IPIS’ data also enables to obtain a better understanding of the mineral supply chain, including the par-
ticipation of different supply chain actors, revenue distribution, price setting and the role of state actors.
So far, increasing regulation of the artisanal mining sector and responsible sourcing efforts, have rather
had a negative overall effect on the socio-economic position of artisanal miners.

                                                      8
The widespread establishment of cooperatives could potentially contribute to social and economic de-
velopment. However, generally speaking, cooperatives in the DRC do not reflect the idea of a coop-
erative as described under international standards. They have rather become vehicles that exploit
miners, and can potentially further fuel already existing tensions.
The report also analyses the complexity of revenue distribution along the mineral supply chains in
eastern DRC.
Already at the level of the mine a wide range of production sharing agreements exist between miners
and site managers. These agreements define the revenue of several stakeholders at the site, including
miners, pit bosses, landowners, customary authorities and armed actors.
Furthermore, the actual price per unit that traders pay to mineral producers is also subject to a wide
range of parameters that influence ASM stakeholders’ income. IPIS’ data allows us to have better un-
derstanding of the impact these parameters on price setting, including: local customs, exchange rates,
world market prices, distance from the mine to the trading hub, the quality of the mineral production,
trade monopolies, and responsible sourcing. IPIS data shows that responsible sourcing has not managed
to provide noticeably better prices for minerals. At the local level, power relations and bargaining power
between supply chain actors rather define actual mineral prices.
Qualitative case studies revealed that various local stakeholders feel as if responsible sourcing and
increasing regulation has decreased their revenues. Artisanal miners have the perception that re-
sponsible sourcing has affected mineral prices as the number of buyers decreased. Furthermore, local
stakeholders explained that recent mining reform has introduced some additional stakeholders, who
ask for additional contributions. Miners claimed that landowners, cooperatives and state officials have
raised their levies.
Consequently, people complained that responsible sourcing has mostly benefited local elites.
Over the last 15 years, many observers have referred to the heavy tax burden as one of the reasons for
artisanal miners and mineral traders not to work in the formal sector. IPIS data reveals that responsible
sourcing efforts have managed to address the issue of illegal taxation to some extent. A higher num-
ber of state services have been reported to levy taxes at non-validated and non-iTSCi sites.
Nevertheless, many miners feel as if responsible sourcing has brought them more levies (e.g. for coop-
eratives), and at several validated mines, there have even been reports of the persistence of clear illegal
taxation by state services.
Furthermore, the perception that taxes are too high, is also a consequence of local stakeholders’ feeling
of receiving nothing in return for the taxes they pay. This is part of the wider distrust of people with
regards to the Congolese state, which will not be addressed solely by more transparent supply chains.
Responsible sourcing does not seem to sufficiently recognise the dire need to improve governance,
and hardly addresses the limited capacity of mining state agencies, particularly SAEMAPE. This seriously
affects successful implementation of responsible sourcing.

Challenges for responsible supply chains
The report also discusses some specific challenges related to the implementation of responsible sourc-
ing in eastern DRC - besides the impact and challenges related to armed interference and the socio-eco-
nomic situation of ASM, discussed above.
Due to the limited number of state agents, mineral bags were not sealed at the level of the mine with
traceability tags at 42% of the iTSCi mines visited by IPIS teams in 2016-2018.
Consequently, tagging is often done at a large distance from the mine. Alternatively, it is quite common
that miners stock minerals at the site, or in their houses, awaiting SAEMAPE agents to pass by to tag the
minerals. During the visits in 2017, it even seemed quite common that négociants held the tags them-

                                                    9
selves (after they bought them from the state agents), and auto-tagged their mineral bags. These issues
raise questions about the effectiveness of traceability.
Furthermore, several state agents reportedly sell tags, or ask a small contribution in exchange for tag-
ging. It is striking that a mechanism to fight illegal interference has been abused to levy illegal
taxes. It illustrates how new regulation and technical interventions can encourage state agents to abuse
their position of power.
The above reveals the high risk of contamination of responsible supply chains. In some cases, these
contaminations do not involve minerals that have been affected by armed interference, or serious abus-
es - for example in Maniema province. However, in other areas, risks of contamination are more problem-
atic, and are actually linked to armed interference.

 Gold mine in Pangi, Maniema (Photo: IPIS)

In many cases, contamination of responsible supply chains is not only due to absence of state control
(e.g. absence of state agents at the mine), but also tolerated, or in some cases even organised by state
agents.

Concluding remarks
The above findings show that responsible sourcing has made considerable progress over the past years,
and indicate that it is possible to source minerals (more) ethically from eastern DRC.
On the other hand, the trends described above also reveal that a lot of the drivers of armed interference,
corruption, and illegal trade are not addressed. Therefore, the current situation is not sustainable.

                                                   10
Responsible sourcing efforts have improved the personal security of groups of artisanal miners in several
provinces. However, these are relatively fragile gains and the underlying problems remain unchanged.
Armed conflicts, including those related to the control over natural resources, persist.
Although mining reform and responsible sourcing have increased the level of organization of ASM, it
seems to have been particularly instrumental to local elites. The limited impact of responsible sourc-
ing on local development once again raises doubts about the sustainability of the current situation.
In conclusion, it raises the question: how ambitious should responsible sourcing initiatives be?
On the one hand, it is unlikely that responsible sourcing will resolve an armed conflict. On the other
hand, responsible sourcing should be more ambitious in its efforts to increase sustainability, for example
through their integration in wider efforts to address insecurity.
Furthermore, is it sufficient if responsible sourcing initiatives solely rebuild consumers’ confidence in
DRC’s mineral production? In order to increase sustainability, it is rather important that they also uplift
artisanal mining populations.
111. INTRODUCTION AND BACKGROUND
1.1. Scope and key findings
This report is based on ten years of research on the linkage between conflict and mineral resources in the
eastern Democratic Republic of the Congo (DRC). It draws a number of key lessons about this linkage,
and takes stock of the efforts to break it, from IPIS’ unique cumulative dataset. It has collected this data
through the single largest sustained mapping effort of the on-the-ground situation at mining sites and
the trade routes in eastern DRC. In total, IPIS mapped about 2700 mines, employing 382,000 artisanal
miners. IPIS also mapped 945oadblocks and 71 mineral trading centers.
The remainder of the first chapter will present the background of IPIS’ project on mapping of artisanal
mines in eastern DRC, its methodology, as well as a general overview of the data that has been gathered.
From this data, IPIS will analyse the issue of armed interference in the DRC’s artisanal mining sector more
in detail (chapter 2). Chapter 3 will look at the larger picture of armed conflict in eastern DRC, and assess
to what extent it is actually related to interference in the artisanal mining sector. The next chapter (4), will
assess to what extent responsible sourcing has actually had an impact on the militarization of mining
sites over the last decade.
Besides these tip-of-the-spear dynamics, it is also important to ask how artisanal miners fare under the
vagaries of shifting patterns of interference and efforts to mitigate it. Chapter 5 delves into tendencies
in revenue distribution along the mineral supply chain, state control and broader questions linked to
socio-economic development. Next, chapter 6 will discuss some of the main challenges for responsible
sourcing that IPIS teams encountered in the field.
Finally, a concluding chapter will discuss the main lessons learned from the data gathered by IPIS, and
will raise some questions about the future of responsible sourcing.
1.2. Background
Ten years ago the Belgian research institute International Peace Information Service (IPIS) started map-
ping militarized mining areas in the Kivu provinces of eastern DRC.1 At that time, Western consumers and
governments had started to pay attention to Congolese minerals, especially tin and tantalum, as they
learned that armed groups were financing themselves through their mineral exploitation and trade.2
How big was this phenomenon? What exactly was the role of minerals in financing armed conflict? Lack
of data was a key issue. To help answer basic questions, IPIS collected coordinates of the most import-
ant mining areas in North and South Kivu, along with information such as minerals mined, numbers of
workers, trade routes and centers, and the on-site security situation for its map. In 2010, IPIS extended
the exercise to the adjacent provinces, including Tshopo, Ituri, Maniema, Tanganyika and Haut-Lomami.3
By 2012, interest in a better understanding of conflict-financing through mineral exploitation and trade
in DRC increased considerably. A series of policy initiatives to curtail international trade in ‘conflict min-
erals’ in the Great Lakes region had been launched by international organizations such as the UN, ICGLR,
and OECD, as well as by the United States government (with Section 1502 of the Dodd-Frank Wall Street
Reform and Consumer Protection Act). The DRC government and international businesses had little op-
tion but to try to implement them. Although IPIS’ 2009 map was still in circulation, it had become less
1 Interactive Map of Militarized Mining Areas in the Kivus (MiMiKi) and Accompanying Note available at: http://ipisresearch.
be/publication/accompanying-note-interactive-map-militarised-mining-areas-kivus/.
2 The link was first established by the 2001 UN Panel of Experts, which had been tasked explicitly with investigating how
the illegal exploitation of mineral resources fed into the conflict at the time.
3 IPIS/International Alert, The Complexity of Resource Governance in a Context of State Fragility: An analysis of the mining
sector in the Kivu hinterlands, November 2010: report and interactive web maps available at http://ipisresearch.be/
publication/complexity-resource-governance-context-state-fragility-analysis-mining-sector-kivu-hinterlands/.
12useful: armed group positions and conflict financing can shift from one area to another in the course
of a few months. Artisanal mining, too, can be subject to sudden large migrations of miners, following
changes in security, rainfall, production, and world market prices.
In order to provide more accurate and up-to-date information, IPIS has since partnered with the Con-
golese Ministry of Mines4 and civil society organisations, funded by a variety of donors of whom most
recently the International Organisation for Migration (IOM).5
IPIS developed a permanent monitoring system for artisanal mining activities and the involvement of
armed groups and criminal networks in mineral exploitation and trade. The collaboration resulted in
an interactive map published in 2013, with updates in 2014, 2015, and 2018, each with a different geo-
graphical focus and accompanied by an analytical report.
Furthermore, in collaboration with the Danish Institute for International Studies (DIIS), IPIS has begun
to map roadblocks in the eastern DRC, to better understand political economy of – minerals and other -
supply chains in conflict affected and high-risks areas. To date, over 900 roadblocks have been mapped
in the two provinces of North and South Kivu alone.6
1.3. IPIS’ Methodology
Over the years, IPIS has developed a sophisticated integrated methodology spanning the work flow
from data collection to visualization. Data is collected by ‘field teams’, most of them composed of a SAE-
MAPE or Division des mines agent and a civil society representative. Each team is equipped with Android
smartphones and satellite communicators for mobile data collection on production and the destination
of the minerals, and interviews several respondents per mining site on the presence and interferences
of armed groups, among other things. The teams take pictures at each of the visited sites and to collect
phone numbers of their respondents for subsequent triangulation and verification of the data. IPIS also
organizes intensive training on mobile data collection and GIS database management for mining offi-
cials in Kinshasa, preparing them to gradually start managing data collection and the publication of the
maps themselves.
Finally, IPIS systematically collects qualitative data to contextualize and triangulate survey-based find-
ings, give voice to affected communities, and to provide in-depth case studies to illustrate broader pat-
terns in its analytical reports.
1.4. Data gathered
Since 2013, IPIS has collected data from over 2,400 mining sites, thereby covering virtually all relevant
areas of eastern DRC. Between December 2016 and December 2018, IPIS visited a total of 711 mines,
which employed an estimated total of 126,201 miners.
Table 1: iTSCi and non-iTSCi mines visited by IPIS, 12/2016 – 12/2018
Number of mines Number of miners
iTSCi 272 38% 35,207 28%
non-iTSCi 439 62% 90,994 72%
4 Through its technical services Cadastre Minier (CAMI), Service d’Assistance et d’Encadrement des Mines Artisanales et de Petit
Echelle (SAEMAPE) and Divisions provinciales des mines.
5 Research for the 2013-14 maps was financed by the World Bank through its PROMINES programme and the Belgian
Ministry of Foreign Affairs; the subsequent updates by the International Organisation for Migration (IOM) and PROMINES.
The more recent updates include both the mapping of militarization, the monitoring of responsible sourcing, as well as
additional socio-economic parameters.
6 Analysis and downloadable printed maps on the political economy of roadblocks in North and South Kivu can be
accessed at: http://ipisresearch.be/publication/everything-moves-will-taxed-political-economy-roadblocks-north-south-kivu/
and http://ipisresearch.be/publication/barrieres-routieres-et-sites-miniers-artisanaux-provinces-du-nord-et-du-sud-kivu-2018/
13Table 2: Validated and non-validated mines visited by IPIS, 12/2016 – 09/2018
Number of mines Number of miners
Yellow 13 2% 1,237 1%
Red 3 0% 1,080 1%
Green 174 24% 27,349 22%
Non-validated 521 73% 96,535 76%
Out of the 711 sites visited 38% were iTSCi sites, employing 35,207 miners - 28% of the total number of
miners in the survey.
Out of the 711 mines, 24% were validated green, and 73% had not been validated.
It is important to note these figures reflect a certain selection bias: IPIS has partially tried to align its
mapping priorities with the work of the joint validation missions of the Congolese government. In terms
of case selection, this has entailed a focus on areas with a large concentration of validated sites, or where
future validation missions were planned. Nevertheless, IPIS has still performed site visits in other areas
as well, and has systematically collected case study material and conducted in-depth interviews with
stakeholders in those areas.
To allow users to explore its data, IPIS maintains a free interactive webmap and all of the data on the
webmap can be downloaded at IPIS’ Open Data web page.7
7 http://ipisresearch.be/home/conflict-mapping/maps/open-data/
142. ARMED INTERFERENCE IN EASTERN DR CONGO’S
ARTISANAL MINING SECTOR
This chapter takes a closer look at armed interference at mining sites. The term ‘armed interference’ in
mineral supply chains is vague and needs to be specified. How exactly do armed actors interfere in sup-
ply chains? Armed interference can take place at any moment in mineral supply chains, but the OECD de-
fines certain ‘bottlenecks’ at which such interference is particularly feasible, ranging from mining sites to
transport and trading centers. Within this report, we consider ‘armed interference’ as a non-state armed
group, an army unit or an armed criminal network that makes (illegal) profits from mineral exploitation
or trade, through their physical presence in mining zones, or through more indirect interferences.
IPIS’ data enables to analyse armed interference, its main authors, and the key factors influencing them.
We will discuss the difference between physical presence at mines and ‘predation at a distance’ on min-
eral supply- and evacuation routes, and indicate recent tendencies as well as the role of relative accessi-
bility as a factor driving the incidence of militarization.
2.1. Armed interference at mining sites
Since 2009, IPIS has collected data on armed interference at mining sites. In this section, we will discuss
general patterns of militarization and insecurity in the artisanal mining sector in eastern DRC. The analy-
sis focuses on data from the last reporting cycle, i.e. December 2016 - December 2018. At times, however,
it is necessary to include older data from previous reporting cycles, i.e. 2015 and 2013-2014, because not
all areas of eastern DRC were covered during the 2016-2018 research. Obviously, the 2013-2015 data will
be less accurate as the situation may have changed. However, on the whole, sampled data shows the
older data is still relevant and largely reflects the current situation. We specifically highlight it whenever
we believe the 2013-2015 data is no longer relevant.
It is important to note that solely focusing on
armed interference at mining sites risks to ignore
part of the problem of conflict financing from
mineral supply chains. This will be addressed un-
der section 2.2.
2.1.1. Armed interference: provincial differences
As figure 1 shows, the frequency of armed inter-
ference at the visited mining sites was highest in
North Kivu, South Kivu and Ituri, where armed in-
terference was reported at at least a third of the
visited mines. The relative number of cases of
armed interference in the Province of Maniema is
significantly lower at 17%. There was almost no re-
ported armed interference in the former Katanga
Province. Out of all the Provinces concerned, it is
probably the most stable and secure one, espe-
cially after the second surrender of the warlord
Gedeon Kyungu Mutanga in October 2016.
Figure 1: Armed interference per province, 2016/188
8 IPIS’ mining site visits since December 2016 did not cover all the provinces of eastern DRC to the same extent. 278 (39%) of the
711 sites visited by IPIS’ research teams are located in South Kivu. 123 mining sites were visited in Maniema, 119 in the former
Katanga province and 130 in North Kivu. Finally, during this reporting cycle, only 61 sites were visited in the Ituri Province.
15In North Kivu, the percentage of miners affected
by armed interference is very high and almost
double to that of any other province. However,
this high percentage is mainly due to two large
gold mining sites in northern Walikale under the
control of the Mai Mai Simba, commanded by
Mando.9 Together they ‘employ’ approximately
6,500 workers, which is almost a third of the total
number of workers in North Kivu covered by the
2016/2018 data sample. This explains the large
difference in North Kivu between the percentage
of workers vs the percentage of mining
sites suffering from armed interference. As a
consequence, the above figures somewhat distort
the true extent of the problem. Furthermore, the
two NDC factions10 also interfere in gold mining in
an area including northern Walikale and southern
Lubero territories. (See Figure 2, ‘NDC-control’ is
indicated in cyan)
The 2015 sample had identified an additional
armed group known for interfering with artisanal
mining, the Forces Démocratiques de Libération du Gold mine in Walikale, North Kivu
Rwanda (FDLR)11 in the (southern part of the) terri- (Photo: IPIS)
tory of Lubero. However, FDLR lost control over its
Lubero mining sites in the past three years, mostly
to the NDC.
The 2015-2018 data shows the strong control of
non-state armed groups over several of North
Kivu’s gold mining areas. It is the only province
where the FARDC appears to be less involved in
gold mining than the armed groups. However, it
remains the main armed ‘stakeholder’ in tin min-
ing, and still interferes in some gold mines as well.
For South Kivu, it is worth mentioning that about
half of the reported cases of armed interference oc-
curred in the (large) territory of Shabunda. As sever-
al artisanal mining zones had not yet been mapped,
this territory was a focus area for the IPIS teams,
who visited a total of 117 mining sites there. More
than 60% of these sites were affected by armed
interference, which was distributed between the
FARDC and Raia Mutomboki.12 (See Figure 2, ‘Raia
Mutomboki-control’ is indicated in yellow) There-
fore, the focus on Shabunda has certainly inflated
the overall percentage for South Kivu.
The 2015 data show high levels of FARDC interfer- Gold Mine Murondo, Irumu, Ituri (Photo: IPIS)
ence in large gold mining sites in the territory of
9 The oldest active militia in Congo, starting out in 1964. ‘Mai Mai’ is an umbrella term that Congolese self-defense groups
and militia often adopt.
10 Nduma Defense of Congo and Nduma Defense of Congo-Rénové
11 An ethnic Hutu armed group comprising some surviving Rwandese interahamwe.
12 Raia Mutumboki (‘outraged citizens’) is a Mai Mai group at the border of North and South Kivu.
16Fizi. Although these findings are somehow confirmed in the data from the 2018 sample, the trend is less
obvious. Furthermore, in 2016-2018 IPIS teams observed more interference from Mai Mai Yakutumba in
Fizi (Mai Mai groups are displayed in blue on Figure 2).
Figure 2: Concentration of armed interference at mining sites, 2016/2018
Concerning the Province of Ituri, mostly mining sites in the Territory of Irumu were visited in the frame-
work of the 2016-2018 sample. These visits showed significant armed interference in Irumu. Analysis of
the 2015 sample for Ituri also showed that the artisanal gold mining sector in the Territory of Mambasa
was experiencing very high levels of armed interference.13 In 2018, IPIS did visit a few gold mines in
Mambasa. Those in the west of the territory experienced interference from both the FARDC and Mai Mai
rebels commanded by Manu (former Simba rebels commanded by the deceased rebel leader Morgan).
Around Mambasa town, a large number of mines had been visited in 2017, within the framework of IPIS’
‘Artisanal Gold Monitoring Pilot’.14 Only a few of them were subjected to interference of FARDC elements.
The 2015-2018 data shows that in the north of Maniema, particularly in the Territories of Punia and
Lubutu, armed interference in artisanal mining by the FARDC persists. (See Figure 2, FARDC interference
is indicated in red) The interactive webmap however also hides a part of the problem. IPIS’ teams have
reported about members of the DRC’s Police services (and officials of other services) who intervene in
mining activities. Although the police is not included in our definition of ‘armed interference’, some of
these police officers are in fact armed, and abuse their position of power to extort people.
13 Beyond Ituri, such interference was equally high in the territory of Bafwasende of the neighboring Tshopo Province.
Mining sites in the northern territories of Mahagi, Aru and Djugu appeared to be much less militarized.
14 http://ipisresearch.be/publication/artisanal-gold-monitoring-pilot/ , the area is also the project area of IMPACT’s Just Gold
project.
172.1.2. Armed interference: different actors
In terms of those responsible for armed interference, units of the Congolese army (FARDC) are the main
culprits at 66% of the affected mining sites (198 out of 265) in the 2016-2018 sample. 46% of the mines
with armed interference are controlled or frequented by different armed groups—especially the Raia
Mutomboki, NDC-Rénové, Mai Mai Yakutumba, and Mai Mai Simba. These trends are clearly visible
on the latest update of IPIS’ webmap from the new layer ‘zones of interference’ (see Figure 2). Finally,
while obviously not covered by our definition of ‘armed interference’, unarmed state services as well as
traditional authorities are also structurally involved in illegal taxation of artisanal mining.
Congolese army
The illegal interference of FARDC units (appointed as ‘elements indisciplinés’ on the webmap, units known
for conducting illegal or criminal activities) remains a chronic problem for eastern DRC’s ASM sector.
Nevertheless, direct and open control over mining sites seems to have diminished over the last years,
something which might have been spurred by responsible sourcing initiatives (see chapter 4). However,
the army has found creative ways to substitute on-site taxation with ‘predation at a distance’.15 This in
part comprises the erection of roadblocks on the access roads to mining sites (see section 2.2), but also
other forms of accommodation such as periodic ‘patrols’ to collect contributions (see Text box 1).
How the army profits from mining without being present: some examples
In the Itebero area of southern Walikale, for instance, people reported in 2018 how direct control
over mines has seriously diminished since mines have been validated. FARDC however still
organizes monthly patrols that pass by the mines to collect a contribution. These contributions
are often not levied directly, but rather secretly collected from either the mine boss or authorities
with a legal mandate to tax mining. Mine managers often organize a collection, to which all miners
have to contribute, in order to continue paying the FARDC, despite them not being present at the
mining site on a daily basis, or else the monthly army patrols can turn out badly.16
Furthermore, in the nearby trading hub of Itebero, traders allegedly pay 10 US$ per ton of coltan to
the president of their association, who distributes this to the FARDC, Intelligence Service (ANR) and
Immigration service (DGM). Finally, some army commanders appoint a ‘commissionaire’, a civilian
with no overt connection to the commander but who still covertly manages his interest at mining
sites. This is reportedly the case for instance at the mining site Mutiku, some 30km from Itebero in
Walikale.17
CNDP militia guarded the Rubaya mine in 2008. Some of them continue being present at ‘official’
checkpoints just outside the concession after having been integrated into the FARDC, while others
have become private security guards. The army maintains a permanent presence in the village
Kisura at only 500m from the important Rubaya pit B3 Bibatama, making it difficult to ascertain
whether its presence has any influence or not. Local stakeholders claimed that whenever artisanal
mining is productive in the area, the Military Intelligence (T2) increases random inspections for
which they extort ‘mission fees’ to their suspects. 18
Artisanal miners have a role to play in sustaining the army’s interference as well. Reflective of a broader
deeply engrained culture, our qualitative research showed mining pit bosses sometimes prefer to pre-
empt potential harassment and insecurity from rebels, soldiers, policemen, or administrative authorities
by offering their commander a periodic envelope. In some cases, such payments are more structured
15 A tactic first noticed in Spittaels S and Hilgert F. (2009) Are Congo’s mines the main target of the armed groups on its
soil? The Economics of Peace and Security Journal 4: 55-61.
16 Interviews with several stakeholders, Secteur Bakano, Walikale territory, September 2018.
17 Interviews with several stakeholders, Secteur Bakano, Walikale territory, September 2018.
18 Interviews with several stakeholders, Rubaya, Masisi territory, September 2018.
18forms of ‘political umbrellas’ shielding their claim to mine against harassment or claims from others.19
Armed groups
As indicated, armed groups still consistently practice armed interference in artisanal mining. Over the past
years, some important shifts have taken place. In the past, the FDLR controlled important mining sites in
both North and South Kivu. But since 2015, it has been chased away from these mines by other armed
groups and the FARDC.20 Although it has lost virtually all significant mining areas in recent years following
sustained military pressure and an internal split, it now endures mainly by taxing the supply chains of other
natural resources, mostly charcoal (makala) and tropical hardwood (see section 2.2 below).
Many of the mines this group formerly occupied are now under control of the NDC-Rénové. Originally
from Walikale, the NDC-R has expanded its area of control to southern Lubero, including important min-
ing areas previously occupied by the FDLR and Mai Mai groups. IPIS found the territory under the control
of the NDC-R to have grown larger than that of any other armed group in the DRC, and it is estimated to
control over 100 gold mining sites in Walikale alone. The group has organized an extensive system of tax-
ation, which is certainly not limited to the gold mining sector alone but comprises systematic roadblocks
and access control through tickets (jetons).21
The Congolese Hutu militia Nyatura retains an important presence at the tin and coltan mines around Ru-
baya in North Kivu, where it occupies a number of mining sites. As will be discussed below (see 4.1.1), the
armed group even interferes systematically in a number of recently validated mining sites. In the context of
complex local conflicts around access to land and natural resources, many within the local Hutu population
seem to consider the presence of Nyatura as offering more security than the Congolese army.
The Mai Mai Simba of commander Mando (‘Forces Divines’) have for decades been involved in taxing
gold mining in the west of Walikale and Lubutu territory (Maniema), also taxing semi-industrial gold
exploitation on the river.
A significant change is also the decline of Raia Mutumboki and its subsequent loss of control over min-
ing sites at the border between North and South Kivu. In 2015, it occupied significant numbers of gold
mining sites, but its key figures have since fled into the remote forest, relinquishing influence over mines
to the Congolese army. It still however retains some influence on gold mining south of the river Lowa in
Walikale.
IPIS noted the expansion of Mai Mai Yakutumba from its heartland around Misisi (Fizi) in South Kivu,
through shifting alliances with other Mai Mai militia in Shabunda and Maniema. Control over the gold
mining sites in Misisi has been an important source of revenue for Yakutumba—sometimes through
profit sharing agreements with FARDC units in place.
The Forces de Résistance Patriotique d’Ituri (FRPI), an armed group localized in the Irumu territory of Ituri,
has consistently occupied gold mining sites such as those around the urban hub of Bavi.
State officials
Finally, non-armed interference by state officials remains an issue, including at sites where respon-
sible sourcing initiatives are introduced. The mining division and SAEMAPE are supposed to frequent
mining sites, to support miners and register production. However, they mainly focus on collecting legal
or illegal taxes. SAEMAPE and the Mining Division regularly collect taxes without returning a receipt,
or they ask for a ‘motivation’ to tag mineral bags (See sections 5.3.1 and 5.3.4). Many other officials also
19 Schouten P. (2017) Parapluies politiques: the everyday politics of private security in the Democratic Republic of Congo.
In: Higate P and Utas M (eds) Private Security in Africa: From the Global Assemblage to the Everyday. London: Zed Books,
142-163.
20 Its influence became largely confined to Masisi and Rutshuru following attacks by the armed group NDC-R (Nduma
Defence of Congo-Rénové) and the creation of the CNRD (Conseil national pour le renouveau et la démocratie) breakaway
faction. It has however cemented a new alliance with the Congolese Hutu militia Nyatura.
21 http://www.un.org/ga/search/view_doc.asp?symbol=S/2018/531; Schouten P., Murairi J. and Kubuya Batundi S., Pillage
route : l’économie politique des barrages routiers à Walikale et Masisi, IPIS, DIIS, ASSODIP, February 2017.
19profit through interfering. Some of those, like the intelligence service or the anti-fraud unit, have no
mandate to be involved with the mining activities. Table 23 shows that the chieftaincies (chefferies) and
the ANR also engage in systematic taxation of minerals at roadblocks, without a mandate to do so.
Although less threatening, this non-armed interference is also part of power dynamics in which the ar-
tisanal miners are often the weakest side. Indeed, cases of interference by unarmed state officials often
imply the threat of force through the abuse of power. As a consequence, they contribute to the overall
insecurity.
Finally, state officials often also play a crucial role in the persistence of illegal trade, and the contami-
nation of responsible supply chains, in exchange for a bribe. Even though it might only concern small
amounts of money for agents that are badly paid, these elements implicitly authorize illegal trade and
tolerate criminal networks. As an example, the Mining Police in Rubaya requires periodic ‘small sums’
from artisanal miners in the Société Minière de Bisunzu (SMB) concession, which then also allows the min-
ers to illicitly work by night, when the mine is officially closed.22
2.2. Roadblocks: the militarization of supply chains
Besides mining it is crucial to assess the rest of the supply chain. The OECD singles out upstream trans-
port as particularly vulnerable to armed interference. As no substantive research has been conducted
to date, IPIS proceeded to investigate the issue. The transport of minerals, it turned out, is structurally
subjected to illegal taxation at strings of roadblocks operated by both armed groups and members of
the Congolese security forces. An IPIS/DIIS study from December 2017 identified 798 roadblocks in the
Provinces of North and South Kivu alone. The large majority of these roadblocks are used for (illegal)
taxation. Furthermore, roughly 75% of the roadblock has a presence of armed men, from either armed
groups or Congo’s security forces—a higher overall rate of militarization than mining sites. Out of the
239 instances in which natural resources were taxed at roadblocks (see Table 3 below), minerals pre-
vailed with 122 instances (51%).
The Congolese army is present at almost half of the total number of roadblocks, and is responsible for
nearly half of all the instances in which minerals were taxed.23 While the army might not be physically
present in some of the mining sites controlled by armed groups, IPIS notes a consistent pattern whereby
the army instead consistently erects roadblocks some distance away from these mining sites, usually at
the junction of the footpath leading to the mine and a main road.
Army roadblocks along mineral supply chains: some examples
In Kalehe Territory, for example, the threat of several armed groups results in a high number of
roadblocks by FARDC to guard over security. These units however levy taxes to earn their living.
Such roadblocks also affect responsible sourcing:
• CENADEP reported on roadblocks in the areas of Numbi and Lumbishi (in Kalehe territory),
which hold a lot of validated mines.24 At the crossing at Kalungu, FARDC units ask mineral traders
somewhere between 5,000 and 50,000 Congolese Francs (FC)25. Next, before arriving at Bukavu,
at the Kazingo roadblock, FARDC allegedly also levies a tax between 10,000 and 100,000 FC;
22 Interviews with artisanal miners, Rubaya, Masisi territory, September 2018.
23 Schouten P., Murairi J. and Kubuya S., “Everything that moves will be taxed”: the political economy of roadblocks in North and
South Kivu, IPIS, DIIS, ASSODIP, November 2017.
24 CENADEP, La fraude et la contrebande minière dans le territoire de Kalehe (Sud-Kivu): Cas de la chaîne d’approvisionnement de
Numbi/Lumbishi, IPIS, April 2018, pp. 15-16.
25 FC, or Franc Congolais. At the start of the current dataset, late November 2016, 1 US$ equaled less than 1,000 FC. Since
mid-July 2017, however, 1 US$ has never been below 1,550 FC. 5,000 50,000 FC, equaled 3 US$ and 31 US$ at the time of
the research.
20You can also read