Conflict analysis and stakeholder mapping in South Kivu and Ituri
←
→
Page content transcription
If your browser does not render page correctly, please read the page content below
Conflict analysis and
stakeholder mapping
in South Kivu and Ituri

                      Justice-Plus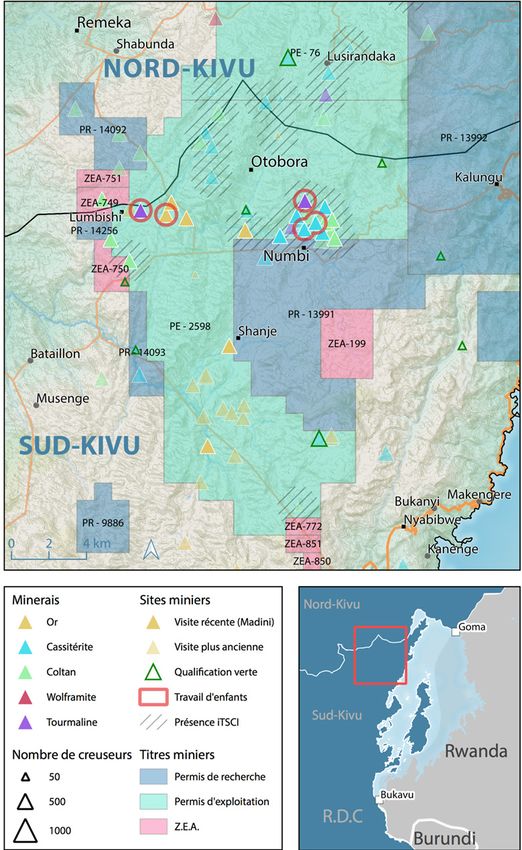
EDITORIAL
Conflict analysis and stakeholder mapping in South Kivu and Ituri
Antwerp, April 2021
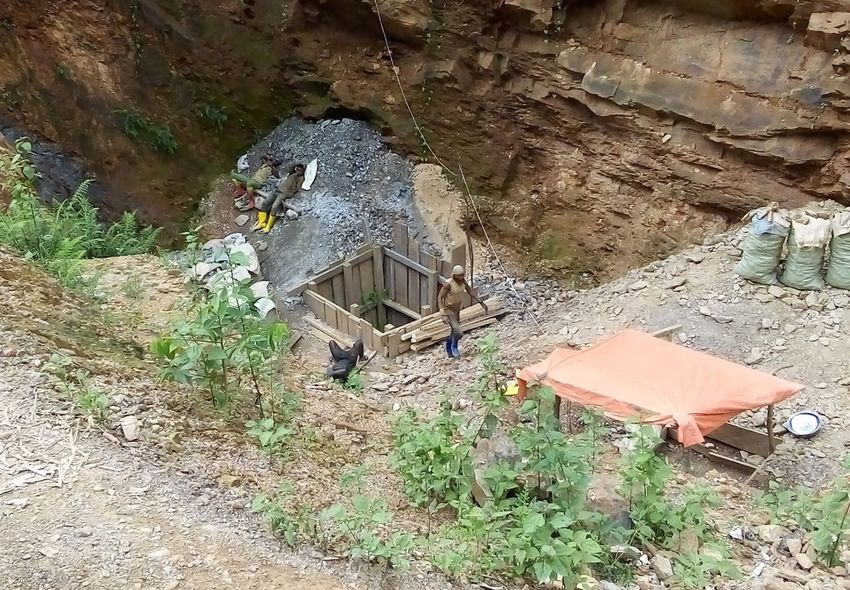
Front cover image: 3T mine in South Kivu (Photo: IPIS)
Author: Guillaume de Brier
Maps, database and graphics: Alexandre Jaillon, Thomas Muller
For more information, please contact: guillaume.debrier@ipisresearch.be
Layout: SAKADO (https://www.sakado.be/)
Recommended citation - G. de Brier, Conflict analysis and stakeholder mapping in South Kivu and Ituri,
IPIS, Antwerp, April, 2021.
The International Peace Information Service (IPIS) is an independent research institute that provides
tailored information, analysis and capacity building to support stakeholders who want to achieve a vision
of continued peace, sustainable development and respect for human rights.
D/2021/4320/05
2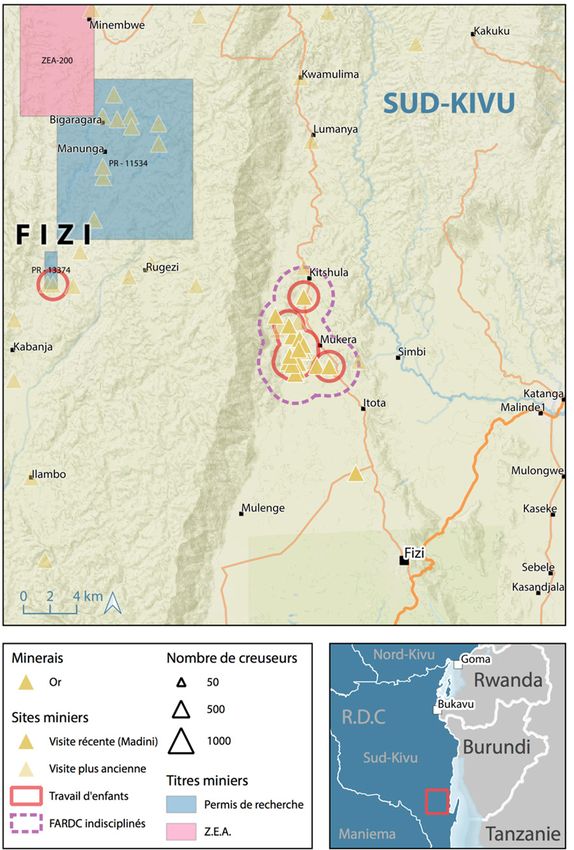
TABLE OF CONTENTS
Editorial ................................................................................................................................................. 2

List of Acronyms ................................................................................................................................... 5

1. Introduction ..................................................................................................................................... 6
    1.1.      Introduction to the Madini Project ....................................................................................................................6
    1.2. Research Objectives, Structure and Methodology ......................................................................................7

2. Overview of quantitative data from the mining sites visited. ..................................................... 9

3. Context analysis of the conflict in eastern DRC .......................................................................... 15
    3.1.      What are the means of subsistence in a remote mining area? ...............................................................16
    3.2. Assessment of the value of gold production and 3T ................................................................................17
    3.3. Reinvesting in mining areas for the benefit of the local population:
         A mining royalty for 3T, but what about artisanal gold? ..........................................................................18
    3.4. The mining enclave: “a glocalised space” ..................................................................................................... 20

4. Territorial analysis of immediate causes of conflict and
   stakeholders in the artisanal mining sector. ............................................................................... 21
    4.1.      SHABUNDA ...............................................................................................................................................................21
    4.2. KALEHE ..................................................................................................................................................................... 26
    4.3. FIZI .............................................................................................................................................................................. 28
    4.4. Djugu ......................................................................................................................................................................... 33
    4.5. Mambasa .................................................................................................................................................................. 35

5. PRELIMINARY RECOMMENDATIONS ............................................................................................ 38
    5.1.      To national authorities ........................................................................................................................................ 38
              5.1.1.      Concentrate payment of taxes at the point of export and prohibit them at mining sites. ..........................................38
              5.1.2.      Redistribute the share of the mining royalty owed to the DTE. ..........................................................................................38
              5.1.3.      Consolidate efforts for successful DDR programmes in eastern Congo. ..........................................................................39
              5.1.4.      Increase the number of Artisanal Mining Zones (AMZ) and improve their management. .........................................39
              5.1.5.      Accelerate the formalisation of mining sites and encourage the “blue mine” qualification system. .......................40
              5.1.6.      Reorient the missions of state agencies in the mining sector. ............................................................................................41
              5.1.7.      Combat the illegal establishment of Chinese companies. ..................................................................................................41
              5.1.8.      Restore the authority of the Mines and Hydrocarbons Police. ...........................................................................................41
              5.1.9.      Pay the salaries of state employees and support local structures. ....................................................................................41
    5.2. Recommendations for the Armed Forces of the DRC (FARDC) ............................................................. 42
              5.2.1.      Sanction the FARDC involved in the artisanal mining sector. ............................................................................................42
              5.2.2.      Withdraw from all mediation and stop closing pits. ............................................................................................................42
              5.2.3.      Strengthen the role and authority of officers responsible for civil-military affairs in number and means..............42
              5.2.4.      Disseminate and publicise arrests of military personnel related to interference in the artisanal mining sector. .42
    5.3. Recommendations for the provincial authorities of South Kivu .......................................................... 43
              5.3.1.      Coordinate political, military and multilateral support to combat the Yakutumba. ...................................................43
              5.3.2.      Coordinate the DDR-C of the Nyatura and other Mai-Mai groups with international, national and local partners..43
              5.3.3.      Maintain dialogue between local populations and mining companies holding mining rights................................43

                                                                                              3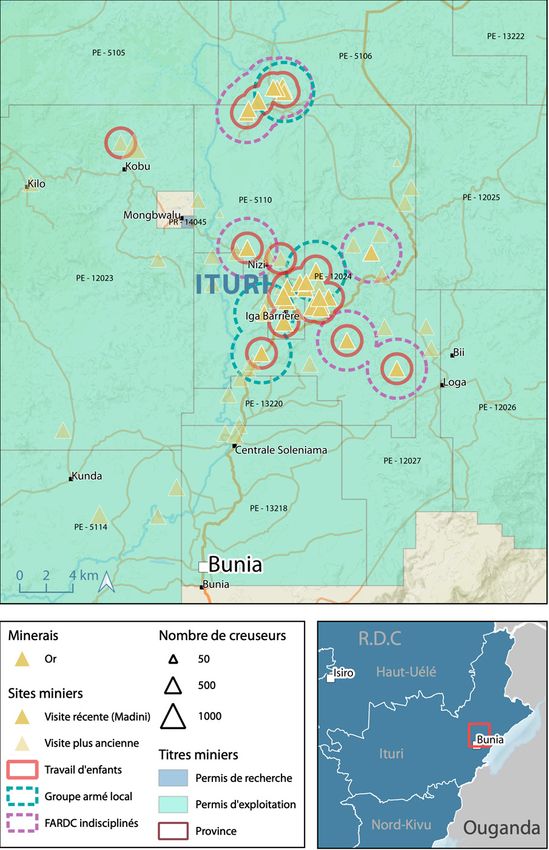
5.4. For the provincial authorities of Ituri .............................................................................................................. 43
        5.4.1.     Encourage peace initiatives between Lendu and non-Lendu. ...........................................................................................43
        5.4.2.     Coordinate political, military and multilateral support to combat armed groups.......................................................43
        5.4.3.     Invest in the mining authority for more effective control of properties and property boundaries. ..........................44
5.5. Recommendations for the Madini Consortium .......................................................................................... 44
        5.5.1.     Create partnerships with the existing traceability systems.................................................................................................44
        5.5.2.     Create partnerships with existing programmes and projects. ...........................................................................................44
        5.5.3.     Support local projects and initiatives that contribute to peace and the traceability of minerals..............................45
5.6. Recommendations for foreign-owned industrial companies (Leda Mining, MGM) ...................... 45
        5.6.4.     Maintain a dialogue with local people and contribute to local development. ..............................................................45
5.7.    Recommendations for Congolese-owned industrial companies (SOKIMO, SAKIMA) .................. 46
        5.7.5.     Open a dialogue with the FEC on SAKIMA agreements with processing plants. ...........................................................46
        5.7.6.     Finalise an agreement with farmers active on SAKIMA concessions in Kalehe...............................................................46
        5.7.7.     Make their action for local development more visible. ........................................................................................................46
5.8. Recommendations for cooperatives .............................................................................................................. 46
        5.8.8. Encourage transparency in management and the identity of managers. .....................................................................46
5.9. Recommendations for civil society organisations ..................................................................................... 46
        5.9.9.     Advocate for the payment of mining royalties to the DTE, including taxes levied on artisanal gold. ......................46
        5.9.10. Advocate for greater transparency in the use of DTE funds ................................................................................................47
        5.9.11. Invest in the traceability of artisanal minerals. ......................................................................................................................47

                                                                                        4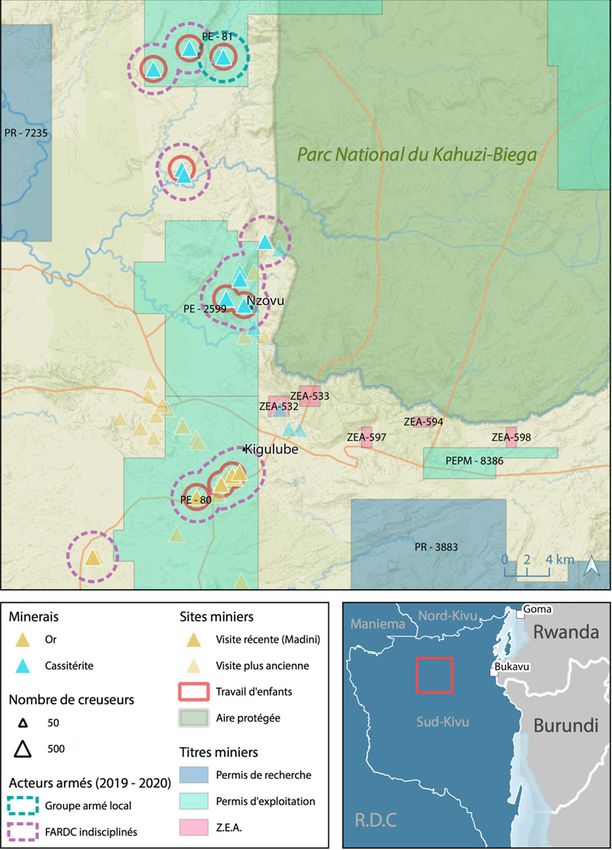
LIST OF ACRONYMS
AFM        Administrateur de Foyer Minier

LSC        Local Security Committee

PSC        Provincial Security Committee

ICGLR      International Conference of the Great Lakes Region

DDR (-C)   Demobilisation Disarmament Rehabilitation (- Community)

EPRM       European Partnership for Responsible Minerals

DTE        Decentralised Territorial Entity

FARDC      Armed Forces of the Democratic Republic of Congo

CDF        Congolese Franc

FDLR       Democratic Front for the Liberation of Rwanda

FRPI       Patriotic Resistance Front of Ituri

IPIS       International Peace Information Service

MGM        Mongbwalu Gold Mines

NDC (-R)   Nduma Defence of Congo (- Rénové)

MP         Mining Permit

KBNP       Kahuzi Biega National Park

MHP        Mines and Hydrocarbons Police

CNP        Congolese National Police

DRC        Democratic Republic of Congo

RMI        Responsible Mineral Initiative

UPDF       Ugandan People’s Defence Force

AMZ        Artisanal Mining Zone

                                                 5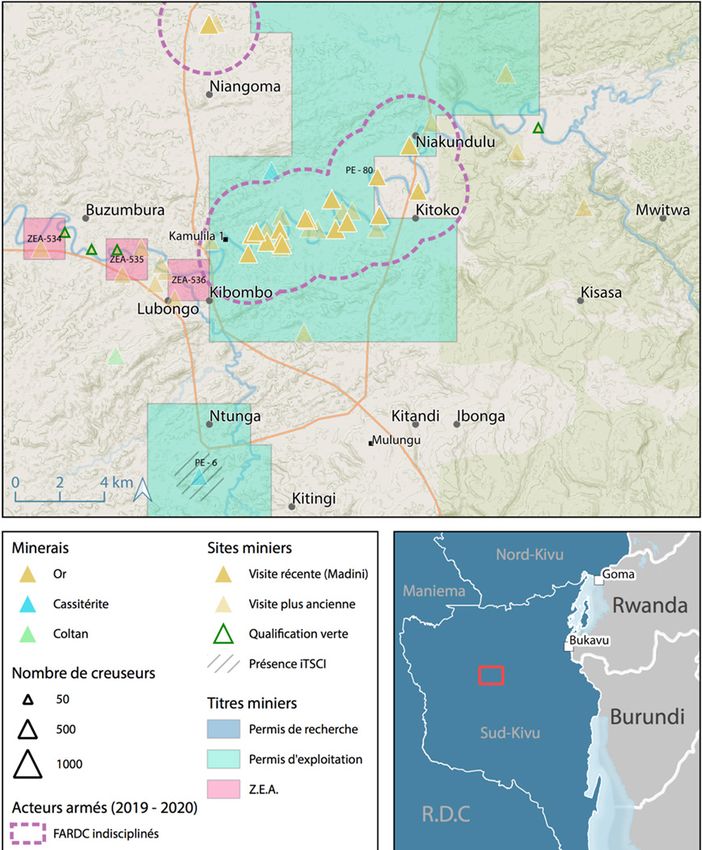
1. INTRODUCTION

1.1. Introduction to the Madini Project
Poor governance of the mining sector is one of the main factors contributing to the conflict in eastern DRC
today. In South Kivu and Ituri, there are four key minerals, gold and the 3Ts (tin, tungsten, tantalum), which
provide a livelihood for hundreds of thousands of Congolese artisanal miners, but whose trade and mining
are subject to large-scale corruption and human rights abuses perpetrated by armed groups, including
undisciplined elements of the national army, the FARDC. Despite responsible sourcing initiatives, such as
the OECD’s Due Diligence Guidance, the International Conference of the Great Lakes Region (ICGLR) and
its Regional Certification Mechanism, existing legislation and policies adopted by the DRC Government,
the Responsible Mineral Initiative (RMI), the World Gold Council Conflict-Free Gold Standard and the EPRM,
minerals mined under unacceptable working conditions are still finding their way into the major global
supply chains. While human rights abuses of artisanal miners take place at local level, i.e. in the mines, the
issues and stakeholders go all the way up to provincial, national and international levels (see next chapter).
Given this interconnection, the main objective of the Madini kwa Amani na Mandeleo (Minerals for Peace
and Development) project is to strengthen regional stability in the Great Lakes region by improving securi-
ty and stability around mining sites in eastern DRC, and by contributing to more responsible mineral chains
by reducing levels of smuggling in the Great Lakes region.
Figure 1: Madini project diagram of objectives

The first pillar of work focuses on improving security around mining sites. This involves bringing together
communities, artisanal miners, local authorities and security stakeholders (including armed groups, or at
least their trusted intermediaries for such communication, and the FARDC and MHP) to develop joint secu-
rity plans. These plans will form the basis for a series of strategic activities aimed at developing mutual trust
to identify, mitigate and resolve conflicts so that mining supply chains no longer provide the resources that
currently enable insecurity and human rights abuses. Alongside the plans, the project will provide training
to build the capacity of state stakeholders - including security stakeholders and local government – so that
they can play their role more effectively and fulfil their responsibilities in securing mining areas, and to work
towards the demobilisation of illegal armed militias operating in the targeted sites.
If security in these areas is to be sustainable, it is therefore important to address the economic incentives
that encourage illegal and potentially deadly practices at mining sites. These economic incentives cross
borders and require a national, regional and international approach. Therefore, the second pillar, which is

                                                       6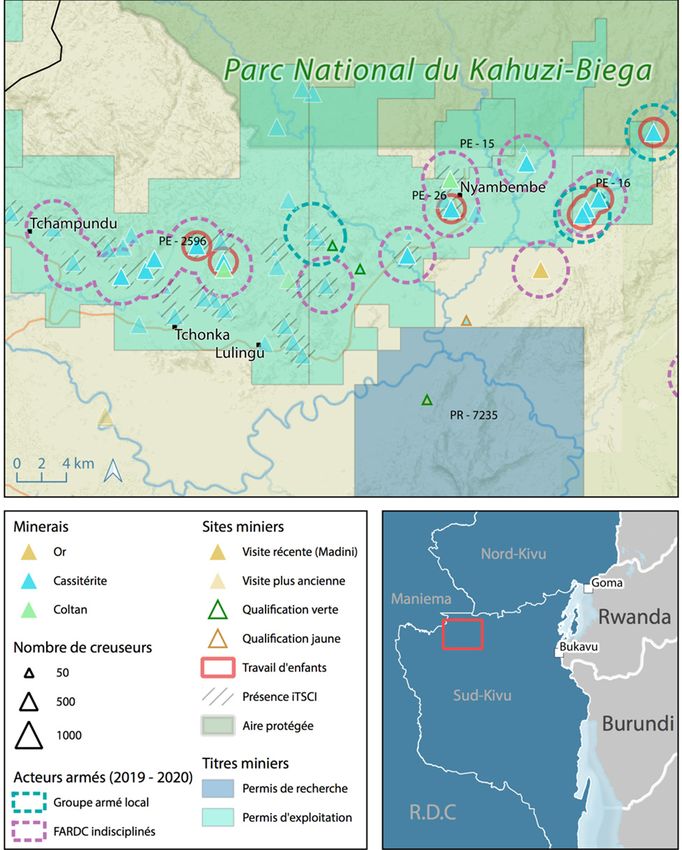
complementary to the main objective, seeks to make the mineral supply chains that run through eastern
DRC responsible, by identifying the stakeholders and interests that encourage the contamination of the
chains and highlighting these practices in order to put pressure on the private sector and government
stakeholders to change their behaviour. Lobbying and advocacy will therefore be essential tools to ac-
complish this change. Within this pillar, the project will include a specific set of activities to determine
how national governments can better work together to harmonise tax systems to reduce the economic
incentives for smuggling - which is now a major driver of contamination in these chains.
The project has identified five territories spread over two provinces in Eastern Congo. In South Kivu, Ma-
dini will be implemented in the territories of Shabunda, Kalehe and Fizi, and in Ituri, it will be present in
Djugu and Mambasa.
The Madini project is supported by The Netherlands Ministry of Foreign Affairs and is implemented by a
consortium led by International Alert, consisting of the International Peace Service Institute (IPIS), EurAC,
the Observatory for Governance and Peace (OGP) and Justice Plus. The project started in December 2019
and will continue for four years.

1.2. Research Objectives, Structure and Methodology
The objectives of this context analysis are, firstly, to place the conflict sensitivity of South Kivu and Ituri
at the centre of the activities’ implementation to ensure that the Madini activities do no harm to existing
and functional structures or relationships. Following the conflict sensitivity approach, the conflict analy-
sis and its context aims to give Madini implementers the tools to understand the tensions between differ-
ent groups, the divisive and potentially conflictual issues, and the forces that contribute to social peace.
Thus, after the introduction and overview of the results of the quantitative data collected in the 182 sites
(see below for the methodology), the third part of this report will focus on identifying the structural caus-
es of the conflict in Ituri and South Kivu, its immediate causes, and the stakeholders. In order to identify
the origins and causes of the conflict, this part will review the history of eastern DRC since the first Con-
golese war (1996-1997). Finally, it will assess the value of the production of the 182 sites visited and the
losses the war economy inflicts on the Congolese state.
In the fourth part, the immediate causes and stakeholders of the conflict will be identified at territorial
level (Shabunda, Kalehe, Fizi, Djugu, Mambasa). As the geographical coverage is more limited, we shall
also study the events that triggered the conflict.
The fifth part brings together our recommendations to the different stakeholders, and serves as a con-
clusion. For the recommendations, we have opted for short paragraphs where we explain once again the
problem that the recommendation is supposed to solve.
This conflict analysis and its context is the result of research conducted during the summer of 2020 with
the aim of collecting quantitative and qualitative data. This data is the subject of eight quantitative re-
ports (one for each group visited, i.e. three for Shabunda, two for Fizi and one each for Kalehe, Djugu
and Mambasa) and two qualitative reports (one for each province) in which more precise (and sensitive)
information useful to the Madini project implementers can be found. Finally, an in-depth context analy-
sis has also been written, in which causal and tangential issues that reflect conflict sensitivity, and which
may or may not be within the area of control of a project like Madini, are identified. The present report
is a compendium of these documents and aims to share the findings of the IPIS teams during their field
missions, and to explain the directions that the Madini project will take in the coming years.
For the collection of quantitative data, 16 experienced investigators travelled through the five territories
targeted by the project and visited 182 mining sites. The data collected concerns: the security situation
(presence/absence of armed groups), types of interference by different stakeholders (types and prices of
taxes, forced labour, etc.), coverage of state agents (which agents visit the site, how do they behave, etc.),
production (number of miners disaggregated by gender, average production, etc.), trade (price of min-
erals, number of traders visiting the site, destination of minerals), working conditions (child labour, use of

                                                      7
mercury, number and types of accidents, etc.), type of mining, status of the mine (in an AMZ, validated
site, etc.)
Two other IPIS teams travelled through the same areas to collect qualitative data. These teams were com-
posed of a Congolese university professor, an expert in the mining sector and his target province, and
an IPIS investigator who knew the terrain and the mines to be surveyed. One team covered South Kivu,
the other Ituri. Among the data to be collected, it was a question of understanding the current conflicts,
their causes, their origins, the stakeholders and how they related to each other, and the “puppeteers”
who should be taken into account in the conceptualisation and implementation of the Madini project.
These six-week visits for South Kivu and four-week visits for Ituri took place from September to October,
and from October to November 2020 respectively. For interested readers, it is possible to view the mining
sites visited by Madini on the IPIS interactive page (select the year 2020 in the timeline to only see the
182 sites),1 or to obtain the raw results of the data collection on the IPIS dashboard (select 2020 in the
timeline)2.
To contextualise this data in the recent history of eastern DRC, we also took the time to review the ex-
isting literature, drawing in particular on the reports of the UN Group of Experts for the DRC, the Kivu
Security Tracker reports, previously collected IPIS data, academic articles and studies, and reports from
NGOs and international partners specialising in minerals in Congo (IMPACT, ITSCI, Pact).

1   Link to the IPIS interactive map: https://www.ipisresearch.be/mapping/webmapping/drcongo/v6/#-3/28/5/4/1/
2   Link to the IPIS dashboard with all IPIS data collected on artisanal mining sites in eastern Congo since 2009: https://
    ipisresearch-dashboard.shinyapps.io/open_data_app/

                                                               8
2. OVERVIEW OF QUANTITATIVE DATA FROM THE
   MINING SITES VISITED.
The criteria for selecting target areas for the Madini project were based on: insecurity as evidenced by the
interference of armed men, high production of 3T or gold or both, characterised by an abundant labour
force and a dynamic trade, whether official or unofficial, and where a majority of the sites had not been
certified or validated (see below). Of the 182 mines visited, 144 produced gold (79 %), 36 produced cassit-
erite (20 %), and 15 produced coltan (8 %). The total number of mines is higher than 182 (100 %) because
14 mines produce two minerals, and one mine produces three.
Firstly, the high proportion of gold sites is logical as they represent the majority of artisanal mining sites,
and all of the sites in Ituri. Secondly, for the Madini project, gold is of particular interest because it is main-
ly this mineral that is the subject of illegal trade, which contributes to the illicit financing of armed groups
but also of large-scale smuggling.

Figure 2: Number of sites visited per territory and minerals

While traceability projects have been created for the 3T (BSP, ITSCI), the gold chains have not yet gone
beyond the pilot phase.3 With the exception of the six gold sites in Mambasa which were part of IMPACT’s

3   To our knowledge, the other gold traceability pilot projects, other than “Just Gold”, are those of BGR in Kampene
    (Maniema province), and Tetratech in Nyamurale (South Kivu).

                                                             9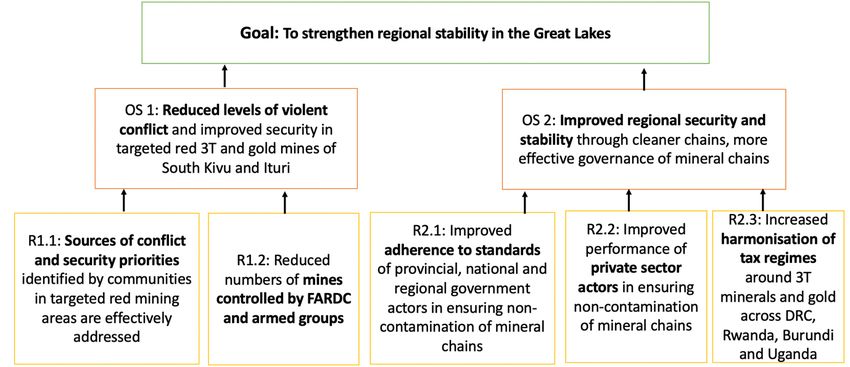
“Just Gold” project, no gold site is part of a legal and formal support project among the Madini sites. For
the 3T, 19 of the 36 sites were part of the ITSCI programme: 13 in Kalehe and six in Shabunda. Given the
selection criteria for the Madini project’s target sites, it is logical that the number of certified or validated
sites (37 green, three yellow and one red) is only a minority. Nevertheless, recommendation 5.1.5 shows
how rare these certification and validation missions are.
Figure 3: Number of certified sites per mineral

According to the mining code, artisanal mining is only allowed in an Artisanal Mining Zone (AMZ) or
on plots covered by a mining permit (MP) or an exploration permit (EP) where the owner of the mining
rights and the approved cooperative have signed a Memorandum of Understanding. In practice, miners
mine the minerals where they find them. In some cases, the location of their site is not disputed, but in
other cases, it is on the concession of an owner of mining rights. SAKIMA and SOKIMO are Congolese
companies that allow artisanal miners, but for other mining companies, such as Leda Mining in Fizi or
Mongbwalu Gold Mine (MGM) in Djugu, there are cohabitation problems.

                                                       10
Figure 4: Location and status of the mining site
In the 182 sites targeted by the Madini project, over 31,000 workers were counted, with women account-
ing for 12 % of the workforce and children for 7 %. However, Figure 5 shows that more than a third of
the workforce is concentrated in Djugu, while in Kalehe, where 3T (and tourmaline) production predom-
inates, the workforce is significantly smaller.
11Figure 5: Number of men, women and children working in artisanal mines
FARDC ont
Given the ambition of the Madini project to improve security in mining regions, the mining sites select-
ed for the implementation of the project are particularly prone to interference from the FARDC. As in
the rest of eastern DRC, the primary “troublemaker” is undisciplined elements of the FARDC. While the
FARDC are present in 95 % (99 out of 104) of the sites in South Kivu and 66 % in Ituri (52 out of 78), this
presence is very often accompanied by interference of all kinds, including the tax on people which is the
most recurrent (see figure 6).
Figure 6: Number of sites where FARDC are present and interfere
12There are also non-state armed groups involved in the trade and/or artisanal production of minerals.
However, there are significant territorial disparities. In South Kivu, Fizi is particularly affected by the Ya-
kutumba, while a multitude of Raiya Mutomboki groups are active in Shabunda. In Kalehe, the Nyatura
come and go with the DDR programmes in place.
In Ituri, the CODECO are the main source of insecurity in Djugu. With a Lendu majority, this group stirs
up hatred against the Hema. In contrast, the territory of Mambasa is relatively unaffected by non-state
armed groups.4 The conflict analysis mentions a few incursions by Mai-Mai groups from North Kivu, but
these groups do not permanently, or at least regularly, occupy the mining sites. The rest of the report will
provide more information on the actions of each of these non-state armed stakeholders.
Figure 7: Number of mining sites where state and non-state armed groups are present
The mining code only recognises the following as having the right to be present on a mining site, and
to collect taxes: the mining authority (SAEMAPE and the Division des Mines), and the Mines and Hydro-
carbons Police (MHP) to enforce the law. However, the investigators reported 14 different state agencies
at the mining sites. Only 32 sites had not been visited by a state agent in the six months prior to the IPIS
survey. The third part of the report devotes a significant section to the actions of state agents.
Regarding production, IPIS teams collected data on weekly production estimates for minerals, distin-
guishing between the dry season (four months) and rainy (eight months) season5. Concerning gold, we
estimated that miners extracted an annual production of USD 31 million, at production prices.6 For
cassiterite (tin) and coltan, we estimated annual values of almost USD 3.5 million and over USD 1 million
respectively.7 In total, the production value at the 182 sites is estimated at over USD 35.5 million.
4 For example, the Mai-Mai Alaise and Mai-Mai Simba, present in the Bandadaka Chiefdom
5 And each month corresponded to 4.348 weeks.
6 I.e., at the selling price per gram of gold at the mining site.
7 At the price of cassiterite at the mining site
13Table 1: Estimates of the production value per mineral from the mines visited by Madini
Minerals Number of active sites Estimated number of workers Estimated value of annual production
(at-site price, in dollars)
Gold 144 28 646 31 041 000
Cassiterite 36 3 109 3 450 000
Coltan 15 1 174 1 025 000
Total 182 32 929 8 35 516 000
This data was collected during the summer of 2020, which gives a fairly objective view of the recent situ-
ation of the mining areas covered. The quantitative analysis of the 182 sites shows several things. Firstly,
the importance of gold in terms of the number of workers and production value is obvious when com-
pared to other artisanally mined minerals. Secondly, the isolation of the mines must be put into perspec-
tive as 82 % of them are visited by state agencies and the FARDC. At local level, we can therefore assume
that the state manages to cover its territory. What is lacking is the quality and legality of this coverage,
and also the infrastructure between villages and urban centres. The third part will focus on the contextu-
al analysis of the conflict in eastern DRC and will interpret the data shared above.
8 The total number of 32,929 is higher than the figure mentioned above (31,000) because miners from sites where two
minerals (15 sites) and three minerals (one) are extracted, are counted twice as we are not able to identify the number of
workers per mineral.
143. CONTEXT ANALYSIS OF THE CONFLICT IN
EASTERN DRC
Analysts agree that eastern DRC, including the provinces of South Kivu and Ituri, reflects war economies,
where local armed groups, undisciplined security and public services, and foreign armed groups sup-
port their activities, in part or in a significant way, through extortion or racketeering activities. These war
economies increase insecurity and are a source of human rights abuses against the general population,
among other factors, but they also represent a significant loss of transparent public revenues for private
and public stakeholders in the region. Economically, the unregulated artisanal mining of natural miner-
al resources (both renewable and non-renewable) in eastern DRC represents a significant loss of DRC’s
natural assets. More sustainable management of these resources could generate greater benefits for all
stakeholders, from the miners to the central state, and the local community.
The sustainable management of natural resources on an economic and environmental level has been
plagued by constant instability since 1996. In 2019, the Congo Study Group counted 125 non-state armed
groups in North and South Kivu alone.9 This figure alone is an indicator of the complexity of the conflicts
in eastern Congo since 1996. The various armed groups can be classified into three categories accord-
ing to their origin and objectives: 1. Foreign armed groups or groups of foreign origin: either they
are seeking to (re)take power in their country of origin (for instance, the FDLR for Rwanda, the ADF for
Uganda, RED Tabara from Burundi), or they are of Congolese origin and supported by a foreign pow-
er working for the interests of that country (Rwanda’s support for the M23, for example) 2. Congolese
armed groups that did not agree to disarm after the Sun City Agreement (2003) ending the Second
Congo War (1998-2003). The Yakutumba, present in the Fizi region, which the consortium has identified
for the Madini project, fall into this category. This armed group can trace its history back to the 1960s.10
After the dialogue started in Sun City (2002-2003), some soldiers from Fizi were disappointed and felt that
the grievances and demands of the Mai-Mai were not taken into account, and that their military officers
were treated ruthlessly in the military integration process.11 And finally, 3. Congolese armed groups
identifying themselves as “self-defence groups”, created in reaction to abuses committed by other
armed groups and which the FARDC were unable to stop. This is the case of the Raia Mutomboki, whom
Madini met in Shabunda, who are autonomous self-defence groups that were formed around 2006 to
drive out the FDLR, and succeeded in doing so around 2011-2012.12 However, even when the objective
was achieved, these self-defence groups did not want to disarm and continued to justify their presence
to “drive out foreigners”. 13
This justification of “driving out foreigners” is malleable. In South Kivu, the armed group Yakutumba
considers the ethnic Banyamulenge as foreigners, and more precisely as Rwandan Tutsis. Since then,
almost all the warring groups have claimed to be either fighting against the Banyamulenge (Mai-Mai
Yakutumba, Mai-Mai Ebuela) or protecting them (e.g. the Ngumino and Twigwaneho groups).14 This rhet-
oric of “driving out foreigners” can also be applied to foreign-owned industrial companies. In a context
of widespread poverty, poor governance, and a tradition of conflict (eastern DRC has been almost con-
tinuously at war since 1996), these armed groups have no difficulty recruiting young people seeking to
survive. Over time, illegal predation has become the main objective of some rebel groups and has almost
entirely supplanted the ideological factor. This analysis confirms Collier and Hoeffler’s theory according
to which predation – i.e. greed (defined as the pursuit of profit and the ability to finance a rebellion) –
9 DW , “ Une centaine de groupes armés dans l’est de la RDC”, 13 December 2019, https://www.dw.com/fr/une-
centaine-de-groupes-arm%C3%A9s-actifs-dans-lest-de-la-rdc/a-51664664#:~:text=Selon%20les%20chiffres%20
publi%C3%A9s%20par,ces%20rebelles%20seraient%20encore%20actifs.&text=Les%20rebelles%20les%20plus%20
connus,ougandais%20et%20les%20FDLR%20rwandais.
10 See J. Stearns, Les Maï-Maï Yakutumba: Résistance et racket au Fizi, Sud Kivu, Rift Valley Institute, 2013
11 See J. Stearns, Les Maï-Maï Yakutumba: Résistance et racket au Fizi, Sud Kivu, Rift Valley Institute, 2013, p. 29
12 J. Stearns, Les Raïa Mutomboki : déficience du processus de paix en RDC et naissance d’une franchise armée, Rift Valley
Institute, 2013, p.13
13 This ideology of “driving out Rwandans” or foreigners is also found among the Mai-Mai Yakutumba of Fizi. See J. Stearns,
Les Maï-Maï Yakutumba: Résistance et racket au Fizi, Sud Kivu, Rift Valley Institute, 2013
14 J. Stearns, Repenser la crise au Kivu : mobilisation armée et logique du gouvernement de transition, in Politique Africaine,
no. 129, 2013/1.
15outweighs injustices or grievances, based on ethnic or religious divisions or political repression to explain
the causes and predict a civil war.15 In Bisie, North Kivu, circa 2007-2008, there were up to four non-state
armed groups that were supposedly antagonistic, who agreed not to attack each other so that each
could focus on cassiterite in the territory they controlled.16 In Fizi, South Kivu, the IPIS investigations for
Madini found that the FARDC and Yakutumba divided the taxation days between them at at least three
particularly productive sites, to avoid coming face to face and having to engage in combat. In some cases,
the FARDC and armed groups even work hand in hand to fight a common enemy. This is the case in North
Kivu, in the Walikale region, where the rebel group NDC Rénové collaborated with the FARDC to drive out
the FDLR (from Rwanda). In the Minembwe region (South Kivu) some roadblocks are jointly held by the
FARDC and the armed group Ngumino.
The main victims of these economic wars are the local populations, as they are the primary targets of the
activities of these non-state armed groups, whether in a violent way, by looting villages or mining sites, or
in a more “regulated” way, by imposing periodic, fixed and regular taxes at roadblocks or at mining sites.
In the past, conflict analysts, and especially NGOs advocating the adoption of the Dodd-Frank Act, have
seen this predation as evidence that minerals finance armed groups and therefore prolong and/or cause
war, hence the term “conflict minerals”. We propose an alternative analysis, where minerals are not the
cause of conflict, but only a symptom, and where the structural causes of violence in mining regions are
poverty, poor governance, and a tradition of conflict. To define the socio-economic context of eastern
Congo as “poor” is an understatement; nevertheless, to recognise this is to understand the opportunity
that artisanal mining provides for social and economic improvement (more on this later).
3.1. What are the means of subsistence in a remote mining area?
In remote and hard-to-reach areas such as the mining regions of South Kivu, the sector that employs the
most people after agriculture is artisanal mining.17 After these two sectors, opportunities for financial in-
dependence and social advancement are rare. For people who are well connected and/or have a degree,
being recruited into the civil service can be seen as a guarantee of job security. However, when analysing
the predation of state agents on the profits made by artisanal miners, it becomes obvious that their civil
service salary is not enough for them to survive on, as it is either insufficient or not paid, or both. As of
March 2020, only seven of the 128 agents of the Ituri mining authority were receiving their civil servant
salary.18 The unpaid civil servants, encouraged by their hierarchy, therefore find their own means to get
paid by taxing the miners and/or the cooperatives, traders or processing entities. For South Kivu and Ituri
(182 mines visited), IPIS counted 150 mining sites where at least one state agency had visited the mine
in the last six months.19 At 100 % of the sites (n =150), state agents come to collect “lump sum” taxes or
to interfere in the mine’s affairs in order to collect money.20 As mentioned above, only SAEMAPE and the
Division des Mines and MHP are allowed to visit the mines. However, IPIS has counted no less than 14
different state agencies taking money from miners to pay their salaries.
After artisanal mining, agriculture and the civil service, there is still a fourth way to survive: by joining an
armed group and taxing and looting the civilian population to get by. In 69 out of 182 mines (38 %), at
least one armed group was present. With the exception of the mines where the Nyatura (Kalehe) behave
appropriately (five mines), all other mining sites (64) are victims of illegal taxation by armed groups. The
most recurrent tax is a regular payment (often weekly, varying from CDF 500 to 1500) demanded from
15 Cited in S. Mwachofi Singo and S. Okhoth Opondo “Ambiguity of the Soil, Ambiguity of Belonging: Grievance, Resource
Avarice and Conflict in Eastern Democratic Republic of Congo”, in The Roots of Ethnic Conflict in Africa, from Grievance
to Violence, Palgrave, 2015, p. 78.
16 Testimony obtained by IPIS in October 2015, in Bisie.
17 According to the FAO, 70 % of the active Congolese population are employed in peasant agriculture. (2021) http://www.
fao.org/republique-democratique-congo/fao-en-republique-democratique-du-congo/le-pays-en-un-coup-doeil/fr/
18 J. Tilouine, “Le florissant business de l’or des conflits”, Le Monde, 6 March 2020
19 The remaining 32 sites are not visited because they are too far away or it is too dangerous to go there because of the
presence of a non-state armed group.
20 It should, however, be noted that the state agencies based in Kalehe behave appropriately with the miners by not
systematically taxing them. There is, however, double taxation on motor pumps.
16each person. In Shabunda, the system is so well established that the Raia Mutomboki even give advance
notice of the day of their arrival by text message so that the site manager can collect the money.21 In some
cases, armed groups set up roadblocks. In a 2017 study, IPIS counted 40 roadblocks controlled by non-
state armed groups out of the 312 identified (or 13 %) in South Kivu. 22
To counter these armed groups, the Congolese state has sent in battalions of the Armed Forces of the
Democratic Republic of Congo (FARDC) and its omnipresence is reflected in patrols of sites and road-
blocks.23 However, these soldiers are in the same situation: because they are not being paid, they are tax-
ing the population to pay themselves directly. In South Kivu and Ituri, the FARDC are present respectively
in 95 % (N=104) and 66 % (N=78) of the sites visited within the framework of the Madini project. In places
where the FARDC patrol, they impose taxes, of varying frequency and amount depending on the area, in
75 % (n=99) of the mining sites in South Kivu and in 85 % (n=52) of the sites in Ituri. Posted uninterrupt-
edly in these regions since 2004-2005, the FARDC have gradually gained other forms of power, especially
judicial (see reports on South Bamuguba and Baliga, in Shabunda).
For the miners, armed groups and undisciplined soldiers are the “triggers” of “immediate” conflicts be-
cause they impose themselves as mediators in disputes between stakeholders in the mine, and this “me-
diation” becomes a new source of income. For example, a state agent, with the support of undisciplined
FARDC soldiers, will close down a pit without any legal authority24, supposedly to solve the problem
of the pit’s ownership, and demand USD 5,000 - 10,000 to reopen it, or a soldier will arrest a miner and
demand USD 5,000 for his release. Since the presence of the FARDC is only justified by the presence of
armed groups, we find ourselves in the paradoxical situation where the presence of an armed group has
become a source of enrichment for FARDC soldiers.
In this local war economy context, artisanal mining manages to support the miners and, indirectly, the
unpaid state and military agents without rank (whether FARDC or militia), but not lift them out of poverty
in the long term. In 2020, IPIS calculated that a 3T miner earned between USD 71 and USD 86 per month,
and that USD 243 per month was needed to support a household of six people.25 And yet, the value
of minerals extracted from artisanal mines is in the millions of dollars. While this upstream production
generates significant revenue in taxes and illegal payments for Congolese state services and agents, its
export is actually illegal and avoids the legal and formal imposition of export taxes and mining royalties.
3.2. Assessment of the value of gold production and 3T
The tables below calculate the values of the minerals produced at the 182 sites in South Kivu and Ituri
visited by the Madini project in the summer of 2020. Normally, the mining royalty is based on the export
value of the mineral, but since IPIS collected data from the mining sites, it could only calculate the produc-
tion value, which is lower than the export value. Hence, all the figures mentioned below are low ranges
of the Congolese state’s loss of revenue on the mining royalty.
21 Observations of IPIS investigators during the summer of 2020 concerning field visits to South Bamuguba for the Madini
project.
22 IPIS, Everything that moves must be taxed: The political economy of the roadblocks in North and South Kivu, Antwerp,
November 2017, p. 16
23 https://www.radiookapi.net/2020/10/07/actualite/societe/shabunda-la-societe-civile-demande-le-retrait-des-45-
barrieres-erigees
24 According to the law, it is the Division des Mines, under the advice of SAEMAPE or the governor, that has the power to
close a site by sending its agents there.
25 G. de Brier, et al, How much does a miner earn? Assessment of miner’s revenue and basic needs study in the DRC, IPIS-
Fairphone-Levin Source, 2020.
17Table 2: Annual production and value of 144 gold sites visited in summer 2020 26
Number of sites Annual production (kg) 27 Values in $ (in millions) 28
Ituri 78 309.62 12 878 918
South Kivu 66 419.16 18 162 903
Total 144 728.78 31 041 821
The table above shows that the 144 gold sites visited by IPIS during the summer produce almost 729
kilograms of gold, worth over USD 31 million. 29
Table 3: Annual production and value of the 36 cassiterite sites visited in summer 2020 30
Number of sites Annual production (in kg) Values in $ (in millions)
South Kivu 36 930 872 3 452 614
Table 4: Annual production and value of the 15 coltan sites visited in summer 2020 31
Number of sites Annual production (kg) Values in $ (in millions)
South Kivu 15 53 672 1 024 332
According to these production value tables estimated by IPIS, the combined value of the artisanal miner-
als produced amounts to over USD 35.5 million per year.
3.3. Reinvesting in mining areas for the benefit of the local population: A
mining royalty for 3T, but what about artisanal gold?
For 3T, the mining code obliges exporters to pay 3.5 % as a mining royalty for cassiterite and wolframite
and 10 % for coltan, which is considered a strategic mineral. Since we have calculated the total produc-
tion value, we can therefore estimate the expected revenue from the mining royalty. This royalty is divid-
ed as follows: 50 % for the Congolese state, 25 % for the provincial authority, 15 % for the Decentralised
Territorial Entity (DTE), and 10 % for the Mining Fund for Future Generations. The table below details the
estimates.32
26 Based on interviews with miners and site managers. The specific questions were: “In the rainy season, what is the average
production of your site?”, and then the same question for the dry season. For the annual production estimate, IPIS
considered the dry season to last four months and the rainy season eight months, at a rate of 4.348 weeks per month.
27 While South Kivu and Ituri have an almost similar weekly production during the dry season (8,656 grams and 8,660
grams), weekly production in the rainy season decreases by 47% in Ituri (4,570 grams) and only by 11% in South Kivu
(7,721 grams). There is a clear difference in annual since the rainy season lasts eight months and the dry season four
months.
28 The estimate of the total value is based on the estimated production (see footnote 7) and on the answers, at each site, to
the questions “what is the average price per gram of gold in the dry season” and “what is the average price per gram of
gold in the rainy season”. When prices were given in Congolese francs, we used the conversion of USD 1 = CDF 1956.
29 Value at the mining site as traders (cooperatives, official or illegal traders) increase the selling price to give them a profit
margin.
30 Based on interviews with miners and site managers. The specific questions were: “In the rainy season, what is the
average production of your site?” and then the same question for the dry season. For the annual production estimate,
IPIS considered the dry season to last four months and the rainy season eight months, at a rate of 4.348 weeks per
month.
31 Based on interviews with miners and site managers. The specific questions were: “In the rainy season, what is the
average production of your site?” and then the same question for the dry season. For the annual production estimate,
IPIS considered the dry season to last four months and the rainy season eight months, at a rate of 4.348 weeks per
month.
32 Articles 240 and 241 of the Congolese Mining Code: http://droitcongolais.be/Legislation/Droit%20economique/
Code%20Minier/Loi.18.001.09.03.2018.html
18Table 5: Estimated potential earnings and distribution of the mining royalty if production from the “Madini”
sites were properly recorded and taxed.33
Total Congolese Provincial Decentralised Mining Fund for Future
(100%) in $ central authority Territorial Entity Generations (10%) in $
government (25%) in $ (15%) in $
(50%) in $
Cassiterite (South Kivu) 120 841 60 421 30 210 18 126 12 084
Coltan (South Kivu) 102 433 51 217 25 608 15 365 10 243
TOTAL 223 274 111 637 55 818 39 491 22 327
The South Kivu mining royalty for the coltan and cassiterite sites visited by Madini is sizeable, amounting
to more than USD 223,000. The DTE portion, on the other hand, is modest: almost USD 40,000. In reality,
as mentioned above, the artisanal mine’s value lies more in gold. However, the trading houses that ex-
port the gold are not subject to the mining royalty.
The biggest contradiction in the tax regime for artisanal gold is that nothing is paid back to the DTE
where the gold originates, even though this gold is highly taxed. Impact’s “Just Gold” project reports in
detail on all the difficulties and steps involved in exporting artisanal gold legally.34 According to the Ca-
nadian NGO’s report, there are 26 different taxes, representing between 8 and 11 % of the export value.
The rate is degressive in relation to volume. In theory, the gold from the 144 gold sites visited by Madini
therefore brings in approximately USD 2.5 to 3.4 million.
Table 6: Estimated amount of taxes on artisanal gold at rates calculated by Impact
Values in $ (in millions) 35 8 % rate 11 % rate
Ituri 12 878 918 1 030 313 1 416 681
South Kivu 18 162 903 1 453 032 1 997 919
Total 31 041 821 2 483 345 3 414 600
Regarding official figures, for South Kivu, in 2019, declared production amounted to only 8.105 kg, and
exports to 48.79 kg.36 Despite the obvious contradiction between production and export figures, this
data shows the extent of the fraud. In our estimates, the 66 gold sites in South Kivu alone produce 419
kg annually. In 2013, the UN Group of Experts for the DRC estimated that 98 % of artisanal gold was be-
ing exported illegally. Almost 10 years later, it seems that nothing has really changed.37 The same panel
estimated in 2020 that total production in Ituri was between 768 and 1,152 kg per year, but that only
48 kg was declared.38 Based on the high estimate, this means that around 96 % (or 1,104 kg) of artisanal
gold was being smuggled out of the province, representing a loss of between USD 4.3 and 5.9 million in
costs to the state.39 It should be noted, however, that it is precisely this multitude of taxes and their high
amounts that drive traders and trading houses into illegality.
33 This is a very conservative estimate as it takes into account the value of production and not the value of export on which
the mining royalty is based, which is obviously higher.
34 Impact, The Just Gold Project: Lessons Learned for the Future of Artisanal Gold in the Democratic Republic of Congo,
March 2021, p. 31 The Impact report goes further by saying that transport costs account for 8 to 11 % of the export value,
making Congolese artisanal gold 16 to 22 % more expensive than the market price.
35 The estimate of the total value is based on the estimated production (see footnote 7) and on the answers, at each site, to
the questions “what is the average price per gram of gold in the dry season” and “what is the average price per gram of
gold in the rainy season”. When prices were given in Congolese francs, we used the conversion rate of USD 1 = CDF 1956.
36 Report of the UN Group of Experts for the DRC, S-2020-482, annexes 16 and 17, June 2020
37 S-2017-672, para. 26, August 2017
38 S-2020-482, annex 18
39 S-2020-482, annex 19, June 2020. The group of experts calculated a gram of gold at USD 48.9656. The range of USD 4.3
and 5.9 million is calculated as follows: 48.9656 (price per gram) *1,104,000 (production per gram) *0.08 (8 % tax, and
*0.12 for 12 % tax).
19To better understand the issue of artisanal gold taxation, Madini is planning a study of field practices and
the laws governing artisanal gold taxation in order to propose more precise and appropriate recommen-
dations.
3.4. The mining enclave: “a glocalised space”
In the Madini project, for the 182 mines visited, we estimated that over 31,000 people (men, women,
children) generated an annual production of more than USD 35 million for all minerals (gold, coltan,
cassiterite). Given the level of local poverty, and the sums involved in the artisanal minerals sector, it is
therefore undeniable that national and regional stakeholders connected to the mines, but physically
absent from them, are becoming illicitly rich. Thus, a mine should not be seen as an “isolated enclave”
but as a “glocalised space”,40 in the sense that the local exploitation of natural resources is connected to
national, regional and global economic, political and/or military stakeholders, to an elite that has been
able to seize the state and control the checkpoints and revenues for its own benefit.
These “disruptive” stakeholders, i.e. state agents, armed militia groups41 and undisciplined soldiers, op-
erate at local level but are put in place (or manipulated) by a hierarchy whose influence and impact is
visible at provincial, national and regional levels. While these state agents, militiamen and soldiers come
to collect their wages from the artisanal miners, they are also required to bring back a minimum amount
to their superiors. Supported, or even pushed, by a provincial or national hierarchy, these three local
stakeholders (the state agent, the militiaman and the undisciplined FARDC soldier) act with impunity.
These illegal seizures by these “disruptive stakeholders” contribute to increased insecurity and sabotage
the governance of the economic sectors (including mining) in eastern DRC.
Before moving onto the analysis by territory, we can conclude that the presence of natural resources, in
a context where the state is failing and relies on an unpaid army to assert its authority, leads to a milita-
risation of society and the economy, where poverty and the tradition of conflict drive new recruits into
armed groups.42 This militarisation of society has developed in tandem with the decline of the state,
reaching a stage where armed violence has become the solution to socio-economic problems. A study
by the University of Antwerp conducted in 2019 in Kamituga (South Kivu) concluded that a majority of
artisanal miners were willing to take part in violent actions (attacking industrial companies coming to
their area, joining an armed group) for socio-economic or material reasons.43 The study shows that the
intention to take part in violent actions depends on each miner’s exposure to violence, as a perpetrator
or victim of it. Given that South Kivu and Ituri have more or less been at war since 1996, there is undoubt-
edly a high exposure to violence, which therefore explains this propensity to create armed “self-defence”
groups and the ease of finding new recruits.
The economic and socio-cultural context and the tradition of conflict presented above apply to all five
territories (Kalehe, Shabunda, Fizi in South Kivu, and Djugu and Mambasa in Ituri). Consequently, the fol-
lowing section will focus on a territory-by-territory analysis of the immediate causes of the conflict and
their triggers; on the stakeholders and their interests, but also on their relations and interactions with
each other, and their role as a disruptive or peace-making factor in the territory; and, finally, on the factors
and dynamics of potential peace.
40 While the traditional Local-Regional-National-Global hierarchy is built on the criterion of physical/
geographical proximity, we use this neologism (global + local) to demonstrate the coexistence of global and
local dynamics at the same time, in the same place.
41 The qualitative report establishes that the Yakutumba opposition to Leda Mining in Misisi (local level) is driven by at
least one FARDC general (decentralised national stakeholder)
42 Amnesty International, “Democratic Republic of Congo: Children at War”, 2003, p. 6
43 N. Stoop and M. Verpoorten: “Would you fight? We asked aggrieved artisanal miners in eastern DRC”, forthcoming in the
Journal of Conflict Resolution, 2021.
204. TERRITORIAL ANALYSIS OF IMMEDIATE CAUSES
OF CONFLICT AND STAKEHOLDERS IN THE
ARTISANAL MINING SECTOR.
4.1. SHABUNDA
Map 1: Sites visited by the Madini project in the North Bamuguba grouping
21IPIS research has identified four major conflicts that we consider to be immediate causes of conflict.
These are:
1. Opposition to the extension of the Kahuzi Biega National Park (KBNP)
2. Rivalries over the ownership of the Tukutu site
3. Tensions between the miners, the processing entities, and SAKIMA (owner of the mining rights).
4. The failures of the Nyambembe trading centre, which benefit the Tchonka trading centre, encouraging
the contamination of mineral supply chains.
Opposition to the extension of the Kahuzi Biega National Park (KBNP) dates back to 1975.44 The popula-
tions and the miners are against this extension because it encompasses farmland and artisanal mines.
In addition, the extension of the KBNP also includes mining concessions belonging to SAKIMA. Violent
clashes sometimes occur between the KBNP eco-guards and the Raia Mutomboki, who claim to protect
the rights of the people (whether miners or farmers), or between eco-guards and the population directly.
Several events can be triggers for violence. Among these, we have identified :
• KBNP demarcation activities: the last demarcation activity was in 2003, but the population removed the
signs. In 2007, the KBNP decided to demarcate the park again but this turned into violent clashes. 45
• The installation of eco-guard camps in and around Nyambembe: in March 2018, the Raia Mutomboki
succeeded in convincing young people to participate in the destruction of the Nyambembe eco-guard
camp. Eco-guards were abducted by the Raia Mutomboki. 46
• Arrests of miners, poachers or farmers active in the park. The population takes up the cause of these three
profiles. Their arrests are considered arbitrary, and can cause violence, especially if the Raia Mutomboki
intervene “to protect the population”.
These three triggers are independent of the Madini project, but project representatives will need to keep
abreast of the progress of negotiations and events related to the KBNP as they may have a direct impact
on the project. A fourth possible trigger, which is directly related to the Madini project activity, is the
exclusion of mineral production originating from the KBNP from the supply chain created/promoted by
Madini.
While the KBNP’s opposition is an immediate cause of conflict, and the recent past allows us to iden-
tify what triggers the violence, the other three major conflicts (local family rivalries, tensions between
the population and the mining companies, the failures of the trading centre) have not been the direct
cause of known violence. However, these conflicts fuel smuggling, illicit profit (a structural cause of the
conflict) and the contamination or infiltration of supply chains. The risk is that undisciplined FARDC or
Raia Mutomboki encourage stakeholders in the artisanal mineral chain (miners, traders, cooperatives) to
contaminate these chains, and thus sell minerals on the international market for profit.
The second cause of conflict relates to the rivalry between two influential families over the highly pro-
ductive Lutukutu mining site. The disagreements between the two families have not yet led to violence
that could destabilise the region, but there have been arrests and prison sentences handed down. In ad-
dition, the territorial and provincial authorities have been involved in mediation, and each side has been
able to broker political support at provincial level. In 2020, one of the parties created the COMINYALU
cooperative and the latter claims ownership of sites currently managed by COOMIMBE, which increases
the risk of violent flare-ups.
The third immediate cause of conflict involves the mining company SAKIMA, a company owned by the
Congolese state. Financially unable to initiate an industrial mining activity, it allows miners, under the
44 E. Mushagalusa et al, Analyse critique du processus de cogestion du parc national de Kahuzi-Biega en République
démocratique du Congo, Open Edition Journal, Hors-Série, no. 17, September 2013.
45 Testimony gathered during the qualitative mission.
46 Idem
22You can also read