Visioning and Backcasting for Transport in Jinan Jimin Zhao, Jian Liu, Robin Hickman, David Banister
←
→
Page content transcription
If your browser does not render page correctly, please read the page content below
Visioning and Backcasting for
        Transport in Jinan

    Jimin Zhao, Jian Liu, Robin
     Hickman, David Banister

Transport Studies Unit, University of Oxford.

          Working Paper N° 1061

                September 2012

               Transport Studies Unit
     School of Geography and the Environment
             http://www.tsu.ox.ac.uk/

                                                |1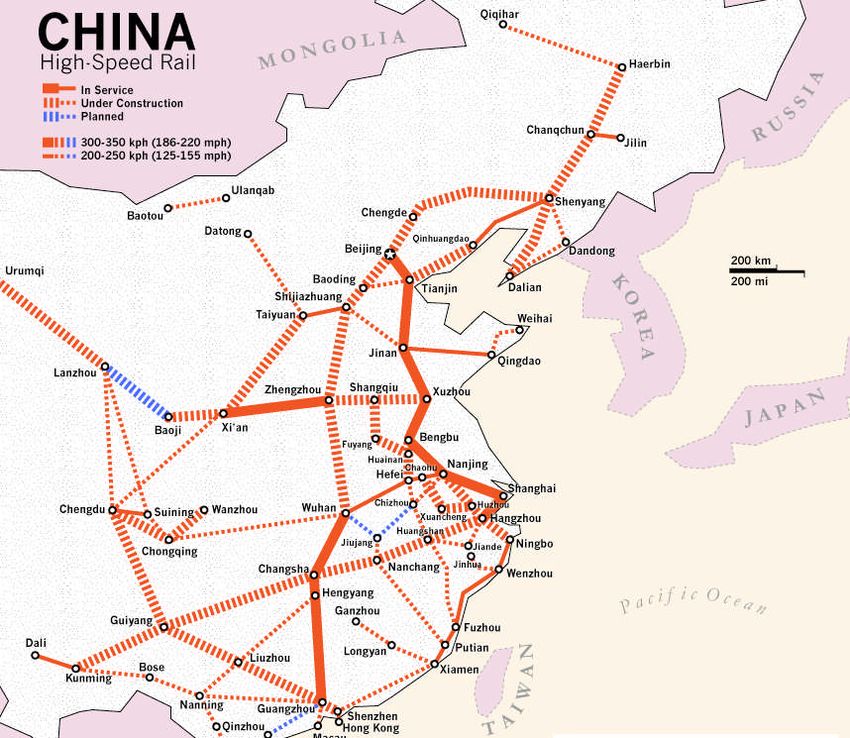
Visioning and Backcasting for
Transport in Jinan
VIBAT-JINAN

Jimin Zhao, Jian Liu, Robin Hickman, David
Banister, Zhou Yong and Liu Zhengling
Final Report
August 2011

                                             |2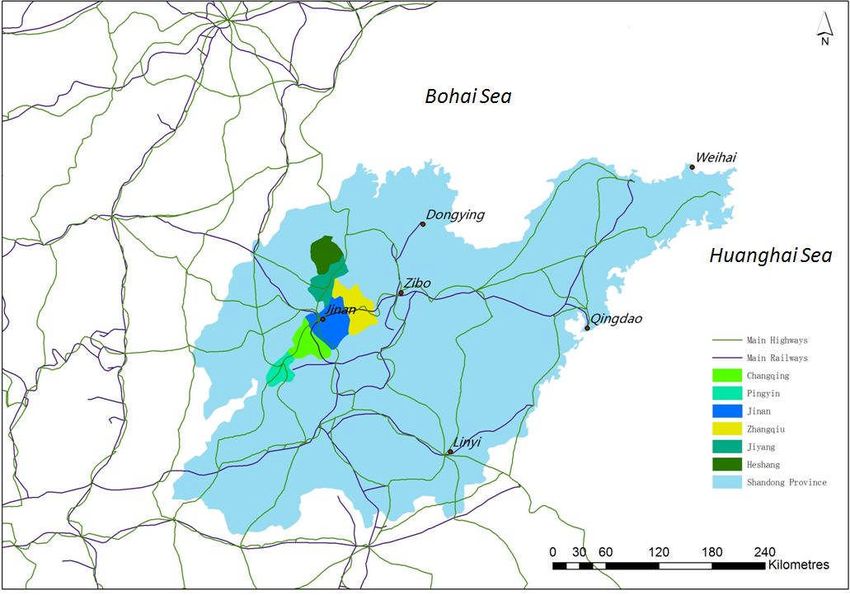
CONTENTS

01. TRANSPORT AND THE FUTURE OF CITIES                                             4
      1.1. INTRODUCTION                                                            4
      1.2. THE ROLE OF TRANSPORT                                                   4

02. THE CASE STUDY: JINAN, CHINA                                                 10
      2.1. THE CHINESE CONTEXT                                                   10
      2.2. THE JINAN BASELINE AND PROJECTION                                     14
      2.3. DEVELOPING SCENARIOS                                                  19
      2.4. EXPLORING THE SCENARIOS                                               22

03. CONCLUSIONS AND NEXT STEPS                                                   36
      3.1. TRANSPORT IN SUPPORT OF THE CITY                                      36

BIBLIOGRAPHY

Acknowledgements
Thanks to Steve Rayner, Idalina Baptista and Anne-Marie McBrien from the University of Oxford
Future of Cities Programme (http://www.futureofcities.ox.ac.uk) for providing funding for this
exploratory work. Thanks to our colleagues at the Shandong Academy of Science and the team of
researchers who carried out the fieldwork in Jinan, including Han Qiang and Huang Na. Thanks also to
the participants in our meetings in Jinan and Oxford who have helped shaped the work, including
Yang Jun from the Jinan Economic and Information Technology Committee; Zhao Youchun from the
Department of Science and Technology, Shandong Province; Xuan Shengwu Xuan from the Planning
Division of the Jinan Transportation Department.

The views expressed in this report, and any errors, are from the authors and do not necessarily reflect
those of any of the organisations or individuals who very kindly gave data, inputs and comments.

                                                                                                     |3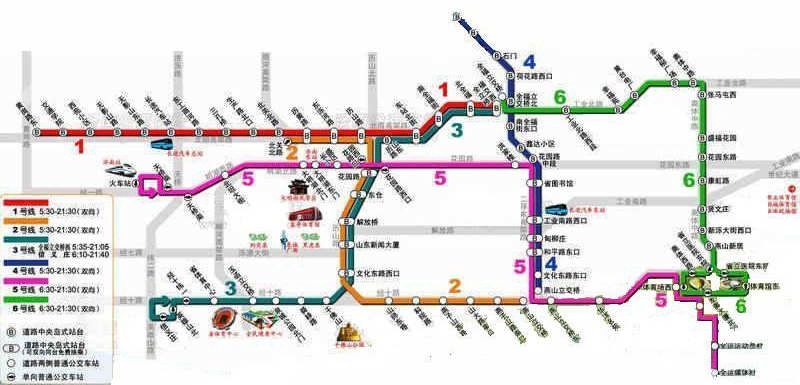
01. TRANSPORT AND THE FUTURE OF CITIES
1.1. INTRODUCTION
Cities are undergoing a renaissance with a huge growth in urban population, and the emergence
of the ‘Megacity’ (over 10 million population), the ‘Metacity’ (over 20 million population) and the
‘Megacity Region’ (with an aggregate population over 80 million). Examples can be seen in Japan
(Tokyo to Nagoya and Osaka), in China (the Pearl River Delta), and in Brazil (São Paulo to Rio de
Janeiro) where city regions are now reaching 40-50 million. In 1900, about 13 per cent of the
global population was urban, but by 2000 this proportion was 47 per cent, and the 50 per cent
threshold was reached in 2007 when 3.3 billion people were ‘urban’. By 2030, the 60 per cent (4
billion) threshold will be crossed, and by 2050 nearly 70 per cent (6 billion) of the global
population (9 billion) will be living in urban areas. This enormous urban growth will be fuelled by
population growth, longer lives and migration into the city. Cities will provide the main sources
of employment in manufacturing and service provision, the centres of social interaction, and the
new growth in the knowledge economy and the networked society.

This rapid urbanisation of global life means that cities are the centre of energy consumption and
emissions; they account for 75 per cent of the global energy consumption and nearly 80 per cent
of Greenhouse Gas (GHG) emissions. It is against this background that this research is set, but the
focus is on the instrumental role that transport can and should play in the sustainable city, and
transport’s future contribution to carbon reduction ambitions. The strategic policy challenges -
including climate change, peak oil and energy consumption, economic growth and inclusivity – all
demand action in the transport sector. Transport has been viewed as the ‘maker and breaker of
cities’ (Clark, 1957), and this is taken as our premise.

1.2. THE ROLE OF TRANSPORT
Internationally, the transport sector is using a large share of (finite) oil resources, accounting for
over 61% of total oil demand in 2008. This represents a huge increase in transport, from 1,021
million tonnes of oil equivalent (Mtoe) in 1973 to 2,162 Mtoe in 2008, an increase of 111%
(Figure 1.1) (International Energy Agency, 2010). Clearly oil is a finite resource, and there is much
debate in the literature about the future supply of oil. Estimates for the peaking of oil supply
range from ‘2007-08’ to ‘after 2010’ (World Energy Council) and ‘2025’ (Shell) (Strahan, 2007). Oil
peaking is likely to result in dramatically higher oil prices as suppliers and consumers react to
perceived supply shortages. There has been a doubling of CO2 emissions over the 35 years
between 1973 and 2008, and the change in regional CO2 emissions 1973-2008 illustrates the rise
                                                                                         1
in importance of Asia in aggregate terms and the relative decline of OECD countries (Figure 1.2).
China’s contribution rose from 5.7% in 1973 to 22.3% in 2008.

The ‘average world citizen’ in 2050 may travel as many kilometres as the average European did in
2005 (Schäfer and Victor, 2000; Schäfer et al., 2009). In 2005, the average West European
travelled 14,000 km, and by 2050 this level will be about the average for all global citizens
(between 11,400 km and 16,400 km), and over this period there will be an increase of 44% in the
global population to 9,109 million. This means that the overall levels of mobility will be over
three times those in 2005 (from 38,000 billion passenger km to between 104,000 and 150,000
billion passenger km in 2050). Sperling and Gordon (2009) predict two billion cars globally by
2030, with many more vehicles and motorised two-wheelers, and Dimitriou (2006) notes the
difficulties with the growth of motorisation in Asia, with fast-rising numbers of middle class
inhabitants within cities, and rapidly changing lifestyles and consumption patterns of ‘the
fortunate’. The net result is a rapidly rising demand for travel and this has major implications for
energy usage and oil consumption

1
  There are 34 OECD (Organisation for Economic Co-operation and Development) countries, representing the
‘Industrialised West’, including countries in Europe, Canada, United States, Japan, Australia, New Zealand, Mexico, Czech
Republic, Hungary, Poland, South Korea, Chile and Israel.

                                                                                                                       |4
Figure 1.1 Transport Share of Oil Consumption

        Transport                        1973                        Transport
                                                                     Industry
                                                                                                   2007
        Industry
                                                                     Non-energy Use
        Non-energy Use
                                                                     Other Sectors
        Other Sectors                                                                           12.8%
                                 23.2%

                                                      45.4%                           16.8%

                           11.5%
                                                                                                               61.3%
                                                                                         9.2%

                                    19.9%

                           2,248 Mtoe                                       3,352 Mtoe
                           Mtoe                                             MtCO2 Mtoe

          Figure 1.2: Regional Share of CO2 Emissions

                                                       1973
                                  2.7%      1.9%
                          3.0%
                                                                           OECD
                             5.7%
                                                                           Bunkers
                                                                           Middle East
 15,643 MtCO2
 Mtoe                        14.4%                                         Non OECD Europe
                1.7%                                                       Former Soviet Union
                      1.0%                           65.8%
                                                                           China
                   3.8%                                                    Asia*
                                                                           Latin America

                                                        2008
                                    3.6% 3.0%                              OECD
                                                                           Bunkers
                                   10.3%                                   Middle East
                                                      43.0%                Non OECD Europe
29,381 MtCO2                 22.3%                                         Former Soviet Union
                                                                           China
                                         8.3%                              Asia*
                                                                           Latin America
                                    0.9%        5.1% 3.5%

          *Asia excludes China. ** World includes international aviation and marine bunkers, which are shown
          together as Bunkers (Data from International Energy Agency, 2010).

                                                                                                                  |5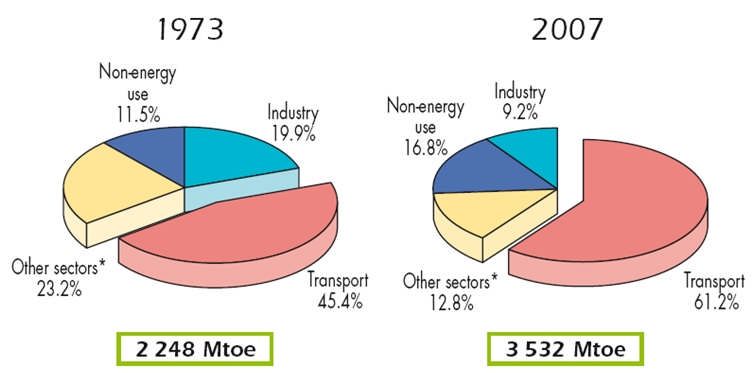
1.3. INCREASED MOTORISATION
One of the main driving forces in the transport sector has been the growth in motorisation. This
does not only include cars, as there are large numbers of two (and three) wheeled motorised
vehicles in developing countries, and these are augmented by vans, trucks and many other types
of vehicle. The global picture is one of consistent growth in vehicle ownership and energy
(carbon) use. The current and potential motorisation levels pose serious difficulties. China and
India, for example, have vehicle fleets of around 100 million and 50 million respectively, but very
low motorisation rates at less than 100 vehicles per 1000 population (v/1000). The projections
are for motorisation rates to rise to somewhere between 200-300 v/1000 by 2030 (a 2-3 fold
increase). Hao et al. (2011) give slightly different projections with China’s vehicle population
reaching 185 million, 364 million and 607 million by 2020, 2030, and 2050 respectively, exceeding
the vehicle population of the U.S. by around 2025. If North American motorisation levels are
reached (>600 v/1000) then the vehicle fleet numbers become huge, and unsustainable, both in
terms of the availability of road space and the levels of CO2 emissions (Figure 1.3). This means
that the pathway of increased mobility must be reduced against current growth trends and also
include a decarbonisation of the transport sector, so that the overall levels of emissions are
halved by 2050 – this is the challenge. Mumford (1968) points to the central problem facing
motorisation projections in Asia:

 “As long as motorcars were few in number, he who had one was a king: he could go where he
 pleased and halt where he pleased; and this machine itself appeared as a compensatory device
 for enlarging an ego which had been shrunken by our very success in mechanisation. That sense
 of freedom and power remains a fact today in only low density areas, in the open country; the
 popularity of this method of escape has ruined the promise it once held forth. In using the car
 to flee from the metropolis the motorist finds that he has merely transferred congestion to the
 highway; and when he reaches his destination, in a distant suburb, he finds that the
 countryside he sought has disappeared: beyond him, thanks to the motorway, lies only another
 suburb, just as dull as his own. To have a minimum amount of communication and sociability in
 this spread-out life, his wife becomes a taxi driver by daily occupation, and the amount of
 money it costs to keep this whole system running leaves him with shamefully overcrowded,
 under-staffed schools, inadequate police, poorly serviced hospitals, underspaced recreation
 areas, ill-supported libraries. In short, the American has sacrificed his life as a whole to the
 motorcar, like someone who, demented with passion, wrecks his home in order to lavish his
 income on a capricious mistress who promises delights he can only occasionally enjoy.” (p.93)

                                                                                                |6
Figure 1.3: Regional Motorisation Trends and Vehicle Population

450                                                                                                                                              800

400                                                                                                                                              700

350
                                                                                                                                                 600

300
                                                                                                                                                 500
250
                                                                                                                                                 400
200
                                                                                                                                                 300
150

                                                                                                                                                 200
100

 50                                                                                                                                              100

  0                                                                                                                                              0
      200520082015202520352005200820152025203520052008201520252035200520082015202520352005200820152025203520052008201520252035

         Southeast Asia*             China                       India       OECD North America           OECD Europe             OECD Pacific

                                 Total Vehicles (millions) (Left Axis)               Motorisation Index (V/1000 P) (Right Axis)

                 *Indonesia, Philippines, Thailand, Vietnam
                 (CAI-Asia et al., 2009)

                 1.4. STUDY APPROACH
                 The aim of this study is to arrive at a better understanding of how transport can contribute to
                 sustainability in cities, with a focus on Chinese cities, and the city of Jinan in particular. This
                 involves understanding the baseline that Jinan is starting from, the potential policy interventions
                 on offer, the different approaches for the context, and the most effective means of packaging
                 interventions to achieve strategic targets. Scenario analysis methodologies are utilised to help
                 explore the issues. We hope this improved understanding will assist us in moving beyond our
                 current and prospective unsustainable transport behaviours, in Jinan and elsewhere.

                 The research combines a quantitative backcasting scenario-building approach and a qualitative
                 analysis of drivers and challenges and potential policy changes. Backcasting approaches have
                 been developed to look at normative scenarios and explore their feasibility and implications for
                 the longer-term future (20-40 years) (such as Robinson, 1982; Robinson, 1990; EU POSSUM,
                 1998; Organisation for Economic Co-operation and Development, 2000; Åkerman and Höjer,
                 2006). Instead of starting with the present situation and projecting prevailing trends
                 (forecasting), the backcasting approach defines and evaluates alternative images of the future,
                 and ’casts back‘ to the present. Policy pathways are then developed to determine different ways
                 in which these ’visioned‘ futures can be achieved. This methodology is particularly suitable where
                 radical trend-breaks (e.g. sustainable transport) are needed, and when the problem to be studied
                 is complex and current trends, actions, and plans are part of the problem. A scenario analysis
                                             2
                 and backcasting approach can help us avoid adverse path dependency, and increase flexibility
                 and innovation in decision-making for policy makers and business. It can enhance the discourse
                 in increasing our understanding of long-term drivers and barriers that underlie the successful
                 shift to a sustainable transport future. These are some of the key themes of the wider Future of
                 Cities programme The methodology is participatory, as key stakeholders are involved in the

                 2
                  A series of related studies have been developed by the study authors in different contexts, for example in the UK
                 (Department for Transport 2004-06); London (UrbanBuzz, Hefce 2007-09); Oxfordshire (Oxfordshire County Council,
                 2009-10); Victoria, Canada (Transport Canada, 2008-09); Auckland (Auckland Council, 2009-10); and Delhi (Asian
                 Development Bank 2008).

                                                                                                                                      |7
scenario-building process, encouraging knowledge exchange and a deeper understanding of the
central issues important to the future. Expert workshops with stakeholders have been run in
conjunction with the analysis to allow feedback on ideas. These have taken place in Jinan and
Oxford.

Data collection has involved three main components: the collection of secondary data for the
basic contextual analysis and city transport model building (Darido et al., 2009; China National
Bureau of Statistics, 2009; China National Bureau of Statistics, 2010; Jinan National Bureau of
Statistics, 2009; Jinan National Bureau of Statistics, 2010; International Energy Agency, 2010);
expert workshops with stakeholders to identify and test likely policy options; and in-depth semi-
structured interviews with local stakeholders (e.g. municipal government officials, managers of
corporations, and civil society) to understand the feasibility of different policy packages and
scenarios. The project is composed of five connected stages: review of context and baseline,
inventory of measures, development of city model, scenario development, and conclusions and
dissemination (Figure 1.4).

Figure 1.4: Study Approach

                                                                                              |8
SUMMARY OF STAKEHOLDER LIAISON AND KEY DATES
The study was developed by two teams of researchers, from University of Oxford (Transport
Studies Unit) and China (the Shandong Academy of Science and Shandong University of Finance),
with work commencing in April 2010 and completing by July 2011. The PI of the Oxford team met
the Jinan team and talked about the project requirements, and went through the project tasks
and schedule during the visit to Jinan in April 2010. The PI also had meetings with government
officials in related departments such as the Jinan Transport Bureau and researchers in other Jinan
Transport Research Institutes so that their views on Jinan’s transport futures could be obtained.

Between April-August 2010, the China team worked on information for the literature review and
secondary data collection for Stages 1, 2 and 3 of the work schedule. The Oxford team worked on
developing the reporting and city transport model. The China team provided data for the
modelling alongside other sources such as the World Bank. During this period, the PI went to
China to check on project progress and had meetings with Jinan officials about the inventory of
measures, existing transport policies and governance, and problems in policy implementation.

In September 2010, the Oxford team organised a workshop at Oxford to review progress in Stage
1, 2, and 3, and to obtain comments on scenario development from the Jinan stakeholders. The
China team researchers and officials from Jinan, the Oxford team, some experts in Oxford, and
the Director of the Future City Programme joined the workshop.

Between September and December 2010, the Oxford team continued to work on the transport-
CO2 model and scenario development, and designed a questionnaire for a household travel
survey. In November 2010, the PI visited Jinan and discussed with the China team about the
scenario development and the household survey. Interviews with officials and experts in the
transport field were conducted by the PI and the China team. The China team put together
information collected on the context, baseline and inventory of measures.

In January and February 2011, the Oxford team developed an initial draft baseline report using
information provided by the China team. The China team worked on the household survey and
presented the survey results in March, and the Oxford team completed the draft baseline report.

In April and July/August 2011, the PI visited Jinan to present preliminary research conclusions and
recommendations to Jinan city officials and revised the report based on the comments from the
Jinan city government. During the April visit, Jinan officials and Jinan partners offered to organise
a workshop on China’s urban transport to disseminate the project results to Jinan officials and
Chinese experts on urban transport and to discuss future urban transport in China; this has
subsequently been planned for December in 2011.

In August/September 2011, a final report and executive summary, the latter translated into
Chinese, was completed and disseminated and journal papers drafted. A teleconference and/or
seminar is planned to present the study findings to Jinan officials and transport experts. Further
project dissemination is planned at Oxford alongside other studies in the Future City Programme.

.

                                                                                                  |9
02. THE CASE STUDY: JINAN, CHINA
2.1. THE CHINESE CONTEXT
The first urban settlements in the People’s Republic of China emerged some four thousand years
3
ago , ranking as one of the earliest civilisations globally. The area around the Yellow River was
the cradle of Chinese development, with a written history emerging as early as the Shang
Dynasty (1700 – 1046 BC) and the origins of Chinese culture, literature and philosophy developed
during the Zhou Dynasty (1045-256 BC). In the years since there has been successive waves of
dynasties, immigration, expansion and assimilation; innovation and cultural development; and
huge change in terms of lifestyles and travel. Many Chinese cities are now developing rapidly. In
terms of transport they are suffering from severe and worsening transport problems, including
congestion, increasing energy use and emissions, a lack of mobility for excluded groups and an
increasing casualty rate. This urban transport crisis results from continuing population growth,
suburban sprawl, rising incomes and increased motorisation and use (Pucher et al., 2007).
Achieving sustainable mobility in urban areas in China is one of the most challenging problems
facing international city development, and, as a result, humanity. The scales of growth in the
Chinese economy and the resulting developmental aspiration and traffic growth are
unprecedented; the economy is the fastest growing in the world. China is experiencing rapid
urbanisation with a massive expansion of existing urban areas and the building of new cities.
Table 2.1 shows the level of urbanisation in China, with 11 cities currently (2009) at over 5 million
population within the urban area, and three of these over 10 million – Shanghai, Beijing and
Chongqing. The wider metropolitan area populations are even larger, including the surrounding
countryside populations. For example, Baoding, a city in Hebin Province, has 11.6 million
population in the metropolitan area but only 1.1 million in the urban area. An additional 300
million Chinese rural dwellers are likely to move to cities over the next 20 years, meaning that up
to 75% of the population will live in urban areas. The scale of urban development in China is thus
much larger than that being considered elsewhere, with important transport implications again
because of the scale. The urban developmental experience is also unique in China, with
components of population growth, migration and ‘nation building’ (Ma, 2009). Today China’s
CO2 emissions are largely industrial, the by-product of an industrial power on the rise, similar to
a Manchester or London in the 1800s (Glaeser, 2011). Only a tenth of China’s CO2 emissions
come from the transport sector; if this rises to the levels found in the US (40% and upwards),
then, again, the rise in emissions will be dramatic.
Table 2.1: The Urbanisation of China 2009 (million)
Urban Scale City Urban Area Metropolitan City Urban Area Metropolitan
Area Area
3 ‘Mega’ Cities Chongqing 15.43 32.76
(population above 10 Shanghai 13.32 14.01
million persons Beijing 11.75 12.46
within urban area
8 ‘Super Large’ cities Tianjin 8.03 9.80 Chengdu 5.21 11.40
(population 5-10 Guangzhou 6.55 7.95 Wuhan 5.15 8.36
million within the Xian 5.62 7.82 Shenyang 5.12 7.17
urban area) Nanjing 5.46 6.30 Shantou 5.03 5.11
114 ‘Large’ Cities Haerbin 4.75 9.92 Heze 1.50 9.39
(population 1-5 Hangzhou 4.29 6.83 Zhongshan 1.48 1.48
million persons Fushan 3.68 3.68 Handan 1.47 9.43
within urban area) Changchun 3.62 7.57 Anshan 1.47 3.52
Jinan 3.48 6.03 Xinyang 1.46 8.61
Tangshan 3.07 7.34 Luzhou 1.46 4.97
3
The early Chinese towns emerged during the Longshan period (3,000-2,000 BC) in the central plain in modern Henan
province, and also the Shandong peninsula, mid-Yangzi River Valley and Inner Mongolia. They were known as Chengbao
(walled fortresses), and included signs of state formation, urban planning and complex societies with social stratification
and product specialisation Ma, L. 2009. Chinese Urbanism. In: Kitchen, R. and Thrift, N. (eds.) Encyclopaedia of Human
Geography. Oxford: Elsevier.
| 10Daliang 3.02 5.85 Wenzhou 1.45 7.79
Taiyuan 2.85 3.65 Bazhong 1.43 4.01
Zhengzhou 2.85 7.31 Qiqihaer 1.42 5.72
Zibo 2.79 4.21 Neijiang 1.42 4.26
Qingdao 2.75 7.63 Baotou 1.41 2.20
Huaian 2.75 5.34 Baoji 1.41 3.79
Nanning 2.67 6.98 Changde 1.41 6.17
Kunming 2.50 5.34 Luohe 1.39 2.76
Shenzheng 2.46 2.46 Fushun 1.39 2.23
Shijiazhuang 2.43 9.77 Jiangmen 1.38 3.92
Changsha 2.41 6.52 Qinzhou 1.35 3.71
Suzhou 2.40 6.33 Yiyang 1.33 4.71
Wuxi 2.38 4.66 Daqing 1.33 2.80
Wulumuqi 2.32 2.41 Maoming 1.31 7.35
Changzhou 2.27 3.60 Huizhou 1.29 3.24
Nanchang 2.23 4.97 Laiwu 1.26 1.26
Ningbo 2.22 5.71 Guangan 1.26 4.70
Xiangfan 2.22 5.89 Tianshui 1.26 3.60
Zaozhuang 2.20 3.87 Yichang 1.25 4.01
Guiyang 2.19 3.67 Rizhao 1.23 2.86
Putian 2.13 3.20 Mianyang 1.22 5.45
Nantong 2.12 7.63 Yangzhou 1.22 4.59
Lanzhou 2.10 3.24 Chifeng 1.21 4.59
Hefei 2.09 4.91 Jining 1.20 8.31
Fuyang 2.04 10.01 Huhehaote 1.19 2.27
Linyi 1.99 10.42 Jingzhou 1.17 6.62
Nanchong 1.93 7.54 Leshan 1.15 3.53
Fuzhou (Fujian) 1.87 6.38 Xining 1.14 1.94
Xuzhou 1.86 9.58 Fuzhou 1.11 3.99
(Jiangxi)
Guigang 1.86 5.10 Yongzhou 1.10 5.87
Nanyang 1.85 11.68 Huaibei 1.09 2.18
Liuan 1.85 7.06 Ziyang 1.09 5.01
Jilin 1.85 4.37 Huzhou 1.09 2.59
Suzhou 1.84 6.35 Anyang 1.08 5.73
Weifang 1.81 8.68 Ezhou 1.07 1.07
Huainan 1.81 2.43 Hezhou 1.07 2.24
Yantai 1.79 6.52 Baoding 1.06 11.55
Dongguan 1.79 1.79 Laibin 1.05 2.55
Xiamen 1.77 1.77 Liaocheng 1.05 5.91
Shangqiu 1.73 9.11 Wuhu 1.05 2.30
Yancheng 1.63 8.12 Hengyang 1.04 7.40
Luoyang 1.60 6.95 Yichun 1.04 5.50
Haozhou 1.60 5.97 Liuzhou 1.04 3.68
Suqian 1.60 5.41 Wuwei 1.04 1.99
Taian 1.59 5.56 Zhenjiang 1.03 2.70
Haikou 1.58 1.58 Quanzhou 1.03 6.81
Datong 1.55 3.16 Zhuhai 1.03 1.03
Taizhou 1.54 5.78 Pingdingshan 1.02 5.32
Zhanjiang 1.52 7.63 Xinxiang 1.01 5.97
Suining 1.51 3.87 Zhuzhou 1.00 3.83
Zigong 1.51 3.28 Ankang 1.00 3.04
(China National Bureau of Statistics, 2009)
Some of the key socio-demographic statistics for China are given in Table 2.2. Population growth
in China remains limited at 0.5% per annum, but of course this is on a large existing population of
1.3 billion persons. The level of urbanisation was at 46.6% in 2009 and, in recent years, growth is
mainly a result of migration from rural areas. The urban population growth rate is at around
2.5%. Gross National Income (GNI) is relatively low at just over US$3,350 (22,000 yuan) per
capita, with much variation nationally. Gross Domestic Product (GDP) growth is averaging
around an incredible 9-10% per annum in recent years. Material aspiration and consumption is
growing rapidly. For example mobile phone subscriptions are at over 50 per 100 persons and
| 11internet use stands at 30 per 100 persons (2010). CO2 emissions are still relatively low at 5 tons
per capita, but rising rapidly; in aggregate terms China is the world’s largest CO2 emitter
(2007/2008 data, World Bank, 2010a). The enormous challenge for China is in developing a
society that allows ‘development’ at the individual and national levels, including income levels
and economic growth, but is also inclusive and does not have huge adverse impacts on the
environment.
Similar to other contexts, the transport sector is perhaps the most difficult sector in China in
terms of achieving greater carbon efficiency. The large current and projected population,
combined with a current small absolute number of vehicles, means an enormous and rapid
growth in vehicle ownership and use. These will result in huge strains on urban infrastructure,
energy use and CO2 emissions (Ng and Schipper, 2005).
Table 2.2: China – World Development Indicators
1990 2000 2005 2008 2009
Population, total (Billion) 1,135.185 1,262.645 1,303.720 1,328.020 1,334.740
Population growth (annual %) 1.5 0.8 0.6 0.5 0.5
GDP per capita (current US$) 314 949 1,731 3,414 3,879
GDP growth (annual %) 3.8 8.4 11.3 9.6 9.1
Life expectancy at birth, total (years) 68.1 71.3 72.6 73.1 ..
Fertility rate, total (births per woman) 2.3 1.8 1.8 1.8 ..
Energy use (kg of oil equivalent per capita) 760 865 1,296 1,616 1,687
CO2 emissions (metric tons per capita) 2.2 2.7 4.3 .. ..
Motor vehicles (per 1,000 people) 4.8. 12.7 24.2 38.4 47.1
Mobile cellular subscriptions (per 100 0.0 6.8 30.2 48.4 52.4
people)
Internet users (per 100 people) 0.0 1.8 8.6 22.5 28.8
(World Bank, 2010; China National Bureau of Statistics, 2010)
China hence has a unique opportunity and urgency to tackle and provide a response to
sustainable mobility aspirations – on the grand scale – creating unique pathways towards
sustainability. These can act as models for international application, across Asia and also in the
West. Transportation in most cities in China is still dominated by public transport (mostly the
bus) and walking and cycling. Many of the larger cities have good transport systems, including
some Metro systems and local rail that extends across the surrounding greater regions. Virtually
all intercity travel is by rail or air. The average Chinese person travels around 1,000 kilometres
per year (2005), very low levels when compared with around 14,000 km per year for Europeans
and over 27,000 km for North Americans (Ng and Schipper, 2005). Urban private vehicles will be
the main driving force for vehicle population growth, accounting for the majority (nearly 90%) of
the total vehicle population in 2020, 2030, and 2050. Continued growth in motorisation is almost
inevitable, but the rate of growth and level of saturation can vary markedly according to policy
direction.
The Chinese car manufacturing industry is one of the most rapidly growing in the world, largely
serving domestic consumption, and includes leading firms such as FAW-Volkswagen (First
Automotive Works), Shanghai Volkswagen, Shanghai GM, Chery, FAW Toyota, Dongfeng Nissan,
and Guangzhou Honda. An increasing number of Chinese residents are aspiring to and following
lifestyles and travel behaviours that are high in energy consumption and CO2 emissions,
consistent with the ‘industrialised western’ model. More new vehicles are now being sold in
China than anywhere else in the world. China has overtaken the US to become the biggest car
4
market in the world, with the sale of 13.5 million vehicles in 2009 and 18.1 million in 2010 . This
is a primary driver for China’s increasing demand for oil; over half of China’s oil consumption is
currently imported and this could rise to 75% by 2030 (Zhao, 2011).
Motorisation has resulted from population and income growth, and been supported by
economic reforms, with private vehicle usage growing at rapid rates. Motor traffic in Shanghai,
4
From www.marketwatch.com/story/china-2010-vehicle-sales-surge-32
| 12Beijing, Guangzhou and other cities is already severely congested. Non-motorised transport has
ironically been discouraged in the 1990s and early 2000s, with walking and cycling viewed as
‘out-dated’ modes. The State Planning Commission (current National Development and Reform
Commission) announced in the 1990s that it planned to see ‘a private car for every family in
China’, reminiscent of the earlier Fordist vision in the West. In Beijing the tree-lined median
strips which used to separate bicycle paths from the motorised vehicle lanes have been removed
to make space for additional vehicle lanes (Hook and Replogle, 1996), and this reflects attempts
to support motorisation.
However, in recent years, there have been major efforts to introduce more sustainable transport
initiatives, particularly in cities such as Shanghai, including the development of extensive subway
and bus rapid transit systems, walking and cycling facilities, mass cycle hire schemes, urban
planning based on ’eco-town’ principles, vehicle registration schemes and the use of fuel
economy standards. Beijing remains a much more car dependent city, so there are different
developmental paths being followed, but even in Beijing there are major investments taking
place in public transport network. For example, Beijing has adopted a new vehicle quota system
since January 2011. Under the new policy, the city will issue 240,000 plates for vehicles in 2011,
which translates into 20,000 new plates each month allocated through a lottery system. The
projected growth in motorisation however remains rapid across all major urban areas in China.
Avoiding the move towards carbon intensive travel – based largely on the ICE petrol car – will be
extremely difficult.
Some of the trends are explored below. Within major urban areas in China, overall trips are
growing at over 5% per annum, higher than population growth and just below income growth.
Vehicle km travelled is increasing at around 10% per annum, with some cities experiencing
higher growth (Beijing and Shanghai at over 15% per annum); non-motorised travel continues to
decline in favour of public and private motorised travel. All of the major cities still have large
mode shares for cycling by trip, Jinan at around 40%, but the shares are declining rapidly.
Vehicle ownership differs considerably by city, with Shanghai having a level of vehicle ownership
less than one third that of Beijing. The trends in aggregate transport CO2 emissions and
emissions per capita also show much variation, with Beijing experiencing high growth and
aggregate transport CO2 emissions at just under 1,400 kg per capita; Shanghai has much lower
transport CO2 emissions at 600 kg per person. Related to these trends is China’s transition to a
market economic system (post 1978) and state-sponsored capitalism. This has generated
enormous economic growth, urban expansion and also changed movement behaviours. It has
5
included cultural change, including a less restrictive hukou system and the break-up of the
6
danwei system and the long term land leasing system. The result for travel behaviour, for
example, is that many urban Chinese residents no longer tend to live near to their workplaces,
resulting in longer commutes and other trip lengths (Darido et al., 2009).
5
A Hukou refers to the system of residency permits which dates back to ancient China. A household registration record
officially identifies a person as a resident of an area and includes information such as the name, parents, spouse, and
date of birth. In 1958, the Chinese government modified the Hukou system to control the movement of people between
urban and rural areas to ensure some structural stability. After the Chinese economic reforms in late 1970s, it became
possible for some to unofficially migrate and gain employment without a valid permit. The system has undergone further
relaxation in the mid 1990s and again in the early 2000s. Rural residents can buy temporary urban residency permits to
work legally. By 2004, the Chinese Ministry of Agriculture estimated that over 100 million people registered as ‘rural’
were working in cities. However, these reforms have not fundamentally changed the Hukou system. Instead, reforms
have only decentralised Hukou control to local governments. It has been argued that the system will have to be further
relaxed in order to increase availability of skilled workers to industries.
6
Danwei was the name given to a place of employment in the PRC prior to the economic reforms introduced by Deng
Xiaoping, although it is still in use today. The Danwei work unit acted as part of the hierarchy linking each individual with
the central Communist Party infrastructure, and assisted in implementing party policy; they are typically based around a
factory, state agency or university. Workers were bound to their work unit for life, with each creating their own housing,
child care, schools, clinics, shops, services, post offices, and other facilities. Work-unit housing was usually built to
standardised space standards and building styles. The Danwei had much influence, for example permission had to be
obtained undertaking travel, marriage, or having children. The move from a socialist ideology to ‘socialism with Chinese
characteristics’ has weakened the Danwei system – in 2003 it became possible to marry or divorce without needing
authorisation.
| 132.2. THE JINAN BASELINE AND PROJECTION
Context
The case study used to illustrate the transport issues associated with projected urbanisation in
China is the city of Jinan. Jinan is a sub-provincial city and capital of Shandong province, located
on the east of the country, 400km south of Beijing, and 200km from the east coast (Figures 2.1
and 2.2). Jinan in recent years has evolved into a major administrative, economic and
transportation centre, with a population of 6.4 million and average annual GDP per capita of
US$9,800 (64,000 yuan). The city is booming economically, with a current GDP growth rate of
17.7% (China National Bureau of Statistics, 2009, Figure 2.3). Jinan experienced rapid
development of its urban infrastructure due to the hosting of China’s national sports competition
in 2009. Jinan is regarded as one of 30 cities in China with a high development potential in real
estate investment and in new transport infrastructure. The modern day name of Jinan derives
from ‘south of the Ji’ (waters), referring to the old Ji River that flowed to the north of the city.
The Ji River disappeared in 1852 when the Yellow River changed its course to the north.
Figure 2.1: Jinan within China
| 14Figure 2.2: Shandong Province
Figure 2.3: Jinan GDP Growth Rate
20
18
16
Annual Growth Rate (%)
14
12
Jinan
10
Shandong
8
China
6
4
2
0
2001 2002 2003 2004 2005 2006 2007 2008
(Jinan Statistics Bureau, 2009)
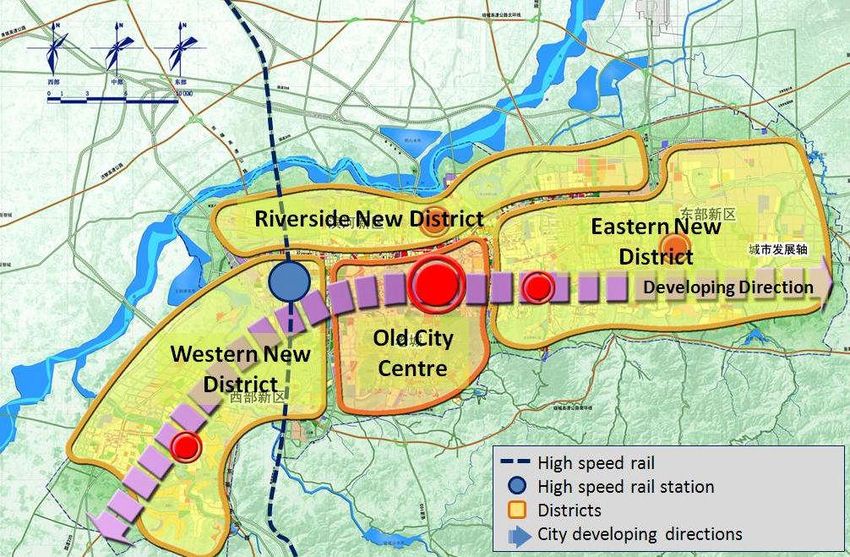
Like many Chinese cities, Jinan is currently undergoing rapid urbanization. The city’s urban area
2 2
has expanded from 24.6 km in 1949 to 295 km in 2008 (Jinan Statistics Bureau, 2009). Jinan has
a monocentric and irregular sprawl pattern, with direct jurisdiction over six urban districts (Lixia,
Licheng, Huaiyin, Tianqiao, Changqing and Shizhong), one county level city (Zhangqiu), three
counties (Pingyin, Shanghe and Jiyang), and over six million people under its jurisdiction (Figure
2.2). With growth to the south constrained by hilly topography and to the north by the Yellow
River, the Jinan’s 2004–2020 Master Plan proposes to expand eastward, with the urban area
2
expanding to the 3rd ring road; this will increase the urban area to 410 km by 2020.
| 15Jinan’s population has increased over time primarily due to the migration of the agricultural
population and young graduates (Figure 2.4), reaching 6.05 million in 2007. However, in the last
few years, the population in Jinan has slightly decreased, dropping to 6.03 million in 2009. Jinan’s
population growth rate was higher than the national and Shandong averages in the early and
mid-2000s at around 1.2% (Figure 2.4), but is lower than the China average and many other
Chinese cities (around 2.5%) in the late 2000s (Darido et al., 2009). The reason for the fall in
population is that many coastal cities in Shandong developed much faster than Jinan in the late
2000s, including Qingdao, Yantai and Rizhao. People migrated from Jinan to move to these
coastal cities (Jinan Statistics Bureau, 2010). In addition, there is likely to be some undercounting;
Jinan has a very strict Hukou management system, and some people who are working and living
7
in Jinan, but without the Jinan Hukou, are not included in the Jinan population statistics .
Figure 2.4: Jinan Population Growth
6.20
6.040
6.00
Population (Millions)
5.80
5.60
5.40
5.20 5.236
5.00
4.80
1990
1991
1992
1993
1994
1995
1996
1997
1998
1999
2000
2001
2002
2003
2004
2005
2006
2007
2008
2009
1.4%
1.2%
1.0%
Population Growth Rate (%)
0.8%
China
0.6%
Shandong
0.4%
Jinan
0.2%
0.0%
1991
1993
1995
1997
1999
2001
2003
2005
2007
-0.2%
-0.4%
(Shandong Statistics Bureau, 2009)
The area around Jinan is one of the oldest urban centres in China, and it was known during the
Zhou Dynasty (1045 BC to 256 BC) as the city of Lixia (Lixia is now the name of one of the city’s
central districts). Marco Polo, the well-known Venetian explorer who travelled to China in the
13th century, visited the area and described it as Chingli. When the Ming dynasty (1368–1644)
7
From interviews with a Jinan population management official, April 2010, Jinan.
| 16created Shandong province, Jinan became its capital. Jinan was developed around textile and
flour-milling and also a machine-building industry. By the early 1970s Jinan had become one of
the main centres of China’s vehicle manufacturing industry, developing a wide range of heavy
trucks and earth-moving machinery. The focus on technology intensive industries since 1990s has
transformed Jinan from a city supported by heavy industry and textiles to a city with more
diverse industrial structure. Information technology, transportation tools, home appliances, bio-
engineered products, etc. have become important components of the area's industry. Jinan's IT-
related economic output was ranked in fourth place nationally in 2004. Jinan is the cultural
centre of the region of Shandong, with agricultural, medical, and engineering colleges and
several universities, notably Shandong University (founded in 1901). The surrounding area has
many well-known sites, including Mount Tai, a designated UNESCO World Heritage site (from
1987) (Encyclopædia Britannica, 2010). Jinan also has a special geological structure, with
underground streams from Taishan Mountain flowing along the limestone strata to Jinan. The
streams are halted to the north by igneous rocks and emerge in the form of numerous springs.
The majority of the “72 Famous Springs” are concentrated in the downtown district and flow
north to converge in Daming Lake. Jinan hence is known as the “City of Springs”, and the
protection of springs is an important element to be considered in Jinan’s urban development.
Jinan is positioned at the intersection of two major railway routes – the Jinghu Railway runs from
Beijing to Shanghai as the major north-south route, and the Jiaoji Railway connects Jinan to the
seaport of Qingdao on the east coast. Major highways include the national Highways 104, 220
and 309. Jinan Yoaqiang International Airport is 33km northwest of the city centre.
Table 2.3: Jinan – Headline Statistics
Metric Comment
City tree and flower Chinese Willow and the Lotus
2
Metropolitan area (2009) 8,177 km
Population
Jinan urban Area (2009) 3,482,400
Metropolitan Area (2009) 6,032,700
Jinan Metropolitan Area (1990) 5,236,000
Jinan Metropolitan Area (1949) 3,052,000
2
Population density 738 persons/km
GDP per capita (2009) Jinan: US$8,300 (55,424 yuan); China: US$3,465
(22,698 yuan)
Economic growth (2009) Jinan 17.7%; China 9%
Mode share (2009) 21% car, 10% walk, 43% bus, 24% bicycle, 2% taxi
Bus rapid transit network 6 routes - 112 km, with 35 km as dedicated routes,
and 55 BRT buses. A flat fare of 10p
Vehicle ownership (2008) 532,549 total vehicles
422,527 privately owned vehicles
4530 buses
8750 taxis
88 vehicles per 1000 population
CO2 reduction target National target to reduce carbon intensity by 40% to
45% by 2020 compared to 2005 levels
Per capita transport CO2 0.51 tonnes CO2
emissions (2010)*
(Using data from China National Bureau of Statistics, 2009; Encyclopædia Britannica, 2010)
*including car, bus, motorcycle, taxi and non-motorised modes within Jinan metropolitan area, but not
freight or international travel
Baseline and Projection
Data to estimate the current baseline and likely business as usual (BAU) trajectory for transport
movement in Jinan is very limited. Table 2.4 gives the baseline data used in the Jinan analysis,
including person trips per capita, trip distance and occupancy (from Darido et al., 2009). This is
| 17combined with wider sources, including data from the Jinan local authorities and also a travel
8
survey carried out in Jinan .
Table 2.4: Jinan – Baseline Statistics
Metric (2005) Data
Motorisation 72 vehicles per 1000
population
Person-trips per capita per Trips/person/day
day Total 2
NMT 1.4
Motorcycle 0.1
Taxi 0.05
Bus 0.3
Car 0.1
Other 0.05
Average trip distance Km/trip
Total 37.6
NMT 4.5
Motorcycle 5
Taxi 6
Bus 13.6
Car 8.5
Occupancy Persons/vehicle
Motorcycle 1
Taxi 1.2
Bus 15
Car 1.2
(Using data from Darido et al., 2009; Jinan Statistics Bureau, 2010)
Targets for CO2 Reduction
A target for transport emissions reduction in Jinan can be derived to help explore the likely
required scales of change. Target definition for China is usually made on an intensity basis (CO2
emissions per GDP), hence it is different to the absolute and budgetary targets developed in
9
western countries such as the UK . In 2009, as a participant in the Copenhagen Accord, China
pledged to reduce its economy‘s carbon intensity by 40 to 45 percent by 2020 compared to 2005
levels. This allows economic growth, but reduces CO2 intensity – a relative decoupling. Jinan’s
potential transport CO2 intensity target is shown in Table 2.5, based on an equivalent aspiration
to the national target. The Chinese government has not developed an absolute national
reduction target, but there have been some estimates of the ‘peak time’ for CO2 emissions in
China, either between 2025-2030 (Energy Research Institute, 2009) or 2030-2040 (UNDP, 2010)
Our modelling, developed in consultation with Jinan officials, assumes a peak year for transport
CO2 emissions for Jinan in 2025 and a reduction of 5% in 2030 compared to 2025. The intensity
target is very difficult to reach due to the huge expected increase in transport emissions, far
outreaching even an assumed 7% increase in GDP per annum. The BAU intensity in 2020 is a
230% increase relative to 2005. A 45% CO2 intensity reduction target would require a much
increased GDP growth rate and/or reduction in transport CO2 emission growth rate.
Table 2.5: Transport CO2 Emission Reduction Targets
Metric Data
CO2 2005 1,423,300 tCO2 (0.22 tCO2 per capita)
CO2 2020 Business as Usual (BAU) 12,948,565 tCO2 (1.74 tCO2 per capita)
8
A model of transport movements was developed for Jinan with a baseline 1990-2010 and projections to 2030 by mode
distance, vehicle fleet and CO2 emissions. Different policy scenarios can be tested to 2030 and transport CO2 emissions
estimated.
9
China, similar to India, is classified as a ‘non-Annex I’ country under the Kyoto Protocol. This means there is no
obligation to reduce emissions under the Protocol. There is only a ‘monitoring’ responsibility, alongside a more general
agreed ‘common responsibility’ recognising that all countries have a role to play in reducing emissions.
| 18CO2 2030 Business as Usual (BAU) 16,272,995 tCO2 (1.98 tCO2 per capita)
GDP 2005 Chinese Yuan (CNY) 184.63 billion (US$ 22.76
billion) 1CNY=0.1233 US$, 2005)
Growth rate @7%, GDP 2020 CNY 509.40 billion (US$ 68.51 billion)
CO2 Intensity (CO2/GDP), 2005 7,708.93 tCO2/billion CNY
CO2 Intensity (CO2/GDP), 2020 (BAU) 25,419.25 tCO2/billion CNY (229.7% increase
on 2005)
TARGET 45% reduction in CO2 intensity 4,239.91 tCO2/billion CNY (0.29 tCO2 per
to 2020 relative to 2005 levels capita)
1 CNY = 0.1233 US$ (2005)
1 CNY = 0.1527 US$ (2010)
2.3. DEVELOPING SCENARIOS
Future scenarios can be generated in view of likely trends and uncertainties, and can be used to
help assess likely progress against aspirations. Trends and uncertainties for Jinan are given in
10
Table 2.6 , covering issues likely to affect transport and urban development within the city, and
ranked according to uncertainty and impact. The most important potential ‘Black Swans’ (high
uncertainty and high impact) are given scores of one and two. These are migration rates and
level of environmental stewardship.
Table 2.6: Trends and Uncertainties
Trends and Uncertainties Ranking
Economy and governmental
Economic growth rate (GDP)
Political stability (national and local)
Globalisation, international trade and movement
Income levels, income inequality
Employment and manufacturing sector growth, including motor
vehicle manufacturing
Tourism and leisure industry growth
Socio-demographics
Rural to urban migration and population growth **1
Age profile (influenced by ‘one child’ policy and ageing population)
Household size
Aspirations and culture – ‘western consumption’ or ‘other’ model
Social equality, social welfare, urban-rural balance
Social stability
Technologies
Technological innovation
Clean vehicle technologies
Energy and power supply – renewable sources
Environmental
Climate change
Major environmental shocks – earthquake, drought, flooding, water
supply
Improvement in environmental quality
Urban issues and transport planning
Environmental issues – stewardship, extent of ‘seriousness’ given to **2
them in policy making and implementation
Urban design quality
Extent of urban sprawl
Aspirations towards sustainable travel, level of investment in public
transport, walking and cycling
Extent of car dependency
Inter-city movements
10
A workshop was held in Oxford and used to develop the trend and uncertainty issues and scenario matrix. This
included transport planners, urban planners and other government officials from Jinan and Shandong, and also
academics from the University of Oxford and other transport planning experts from the UK.
| 19Trends and Uncertainties
Economy and Government: China’s economy has grown rapidly with between 8-11% annual
growth rate during the last two decades. It is likely to continue to grow but the rate may slow.
The Chinese government has set a target of 8.7% for 2011, down from 10.3% in 2010; while
11
some international banking forecasts estimate that China’s economy will grow by 8.4% in 2012.
th
China’s 12 Five Year Plan assumes an economic growth target for this period (2011-2015) of 7%
annually. China seeks to address rising inequality and to create an environment for more
sustainable growth by prioritising more equitable wealth distribution, increased domestic
consumption, and improved social infrastructure and social safety nets. China requires local
governments to set a lower target for economic growth and Jinan’s GDP growth rate is assumed
at 11% annually for the next five years, which is higher than national average growth rate (Jinan
Municipal Government, 2011). In addition, in Jinan and in China, economic development has
entered into a transition period, perhaps increasingly dependent on domestic demand,
innovation-driven industries and modern services.
Socio-demographics: Population projections are an important component of CO2 emission
scenarios. China is likely to continue its family planning policy and has set a national population
target of 1.39 billion by 2015. There are other important demographic issues, for example, the
Chinese population is rapidly ageing due to a lower mortality rate and the one child policy. The
country had 169 million people over age 60 in 2010, comprising 12.5% of the country's total
12
population. This is projected to reach 31% by 2050. , leading to a pension problem for the
Chinese government and this may reduce China's ability to compete economically in the future.
This will also represent challenges to the future transport system in terms of different aspirations
and abilities in accessing activities. Ageing will affect household structure and there are
uncertainties in terms of household formation and urbanisation rates and likely impacts on
transport infrastructure requirements and CO2 emissions (He, 2010). China’s urbanisation will
continue due to the increase of the existing urban population and rural-to-urban migration.
th
China’s 12 Five-Year Plan suggests an urbanisation rate of 51.5% by 2015. Jinan’s population
growth rate has been relatively slow, averaging 0.28% for the past five years and is planned to be
less than 0.5% for the next five years. Jinan’s population within the metropolitan area is expected
to reach 6.2 million and an urbanisation rate of 75% by 2015 (Jinan Municipal Government,
2011). Urbanisation in Jinan is rapidly growing, but relies to a certain extent on infrastructure
upgrading to improve people’s living standards, happiness and social harmony (Jinan Municipal
Government, 2011).
th
Environment and Energy: China’s 12 Five Year Plan devotes considerable attention to energy
and climate change and establishes a new set of targets and policies for 2011-2015. While some
of the targets are largely in line with previous publications, other aspects represent more
dramatic moves to reduce energy consumption, promote low-carbon energy sources and
restructure China’s economy. Key targets include:
16% reduction in energy intensity (energy consumption per unit of GDP);
Increasing non-fossil energy to 11.4% of total energy use from the current 8.3%;
17% reduction in carbon intensity (carbon emissions per unit of GDP).
There is increasing international pressure for addressing GHG reductions in China, particularly on
an absolute reduction basis, but perhaps this is a Western agenda rather than something that
will be taken up in China. The intensity targets allow economic growth, and unless GDP growth
greatly outweighs the growth in transport CO2 emissions, there is still also a need to decarbonise
the transport sector to a large degree. Shandong has established its energy intensity target for
2015 as 17%, higher than the national target; Jinan will follow the province’s 17% target.
11
From www.bloomberg.com/news/2011-01-13/china-economy-may-grow-8-7-this-year-slowing-from-10-world-bank-
says.html.
12
Ageing population challenges in China, available at http://www.bjreview.com.cn/special/2011-
02/23/content_333219.htm
| 20Scenarios
Two key uncertainties are used to generate the two axes within the classic dilemma scenario
matrix as given in Figure 2.5. There are potentially important issues around path dependency
(Mahoney, 2000; Arthur, 1994), wherein social phenomena are explained in terms of historical
13
events influencing the future . These path dependency issues are conventionally viewed as
negative, but can potentially also be positive, and are evident in all the scenarios. Scenario 1
(BAU), for example, suffers from adverse lock in to car and oil dependency as investment is made
in a motorised society. A high motorisation level and high transport CO2 emission level is
contingent on earlier road building, an investment in car manufacturing, the development of a
dispersed urban form, and poor investment in public transport, walking and cycling. Any later
development of public transport is effectively foreclosed, or at least greatly inhibited, as a
supportive urban form is not developed. Thus the resultant travel behaviour is ‘inefficient’ in CO2
emission terms. Scenario 4 aims to use path dependency in a more positive fashion, gradually
building up the investment in public transport, walking and cycling to provide detailed networks
across the city and supporting this with a compact urban form, hoping to achieve high use of
public transport and non-motorised modes in future years.
Figure 2.5: Scenario Matrix
Migration: High
S.1: ‘High Motorisation’ S.4: ‘Good Intentions’
Largely a projection of current trends (BAU scenario) High GDP growth rate; high migration and population
High GDP growth rate, high migration and population growth; high education and skilled labour
growth; less skilled labour High innovation in sustainability
Low innovation in sustainability Aspirations towards sustainable lifestyles, and also
Aspirations towards high materialist, consumptive materialism
lifestyles Limited motorisation, very high vehicle efficiencies
Less skilled labour Strong motor industry, mainly low emission vehicles;
Strong motor industry, mainly petrol and diesel strong public transport manufacturing industry
vehicles Some reduced in BAU growth in car distance
High motorisation, with limited vehicle efficiencies increase in public transport and walk, cycle distance
Growth in car distance mode shares
Reduction in public transport and walk, cycle distance Urban structure supports public transport, walking and
mode shares cycling
Environmental Environmental
Stewardship: Stewardship:
Low High
S.2: ‘City Failure’ S.3: ‘Plan B’
Lower GDP growth rate; lower migration and Lower GDP growth rate; lower migration, and population
population growth; less skilled labour growth; high education and skilled labour
Low innovation in sustainability High innovation in sustainability
Aspirations towards high materialist lifestyles, but Aspirations towards sustainable lifestyles, and lower
lower income levels consumption levels
Less skilled labour Weak motor industry, mainly low emission vehicles;
Weaker motor industry, mainly petrol and diesel strong public transport manufacturing industry
vehicles Very limited motorisation, high vehicle efficiencies
Reduced motorisation, still with limited vehicle Much reduced growth in car distance
efficiencies Increase in public transport and walk, cycle distance
Reduced growth in car distance mode shares, short travel distances and local lifestyles
Reduction in public transport and walk, cycle distance Urban structure supports public transport, walking and
mode shares (but less than Scenario 1) cycling
Migration: Low
13
There are many examples of persistent path dependency in inefficient technologies, including the QWERTY typewriter
keyboard, video recorders, electricity supplies, railway gauges and computer programming languages, all contradicting
the expectations of neoclassical theory (Mahoney, J. 2000. Path Dependence in Historical Sociology. Theory and Society,
29, 507-548.)
| 212.4. EXPLORING THE SCENARIOS
Two of the four scenarios are outlined in more detail below, illustrating the different possible
polarities under the ‘high migration’ constant which is deemed as very likely. We thus explore
the ‘probable’ futures, moving beyond the ‘possible’. A ‘High Motorisation’ future (Figure 2.5:
S1) is compared with one that involves more intensive environmental stewardship or ‘Good
Intentions’ (Figure 2.5: S4). The other two futures (Figure 2.5: S2 and S3) seem to be less suitable
for development in Jinan, as one might involve a breakdown of society in the city (‘City Failure’)
and the other is based on severe limitations on migration and growth in the city (‘Plan B’). When
developing future scenarios with representatives from the city authorities, it is advisable to focus
on positive futures rather than the less attractive alternatives, but it should always be
remembered that uncertainties and weak decision making may lead towards undesirable futures.
Scenario 1: ‘High Motorisation’
The ‘High Motorisation’ scenario (S1) assumes substantial levels of increased motorisation, along
the lines of the ‘North American’ model. Scenario 1 is based on a high level of migration,
development and transport (mainly highway) investment, but also lower levels of environmental
stewardship. The conventional petrol car dominates, with little or no attempt to constrain traffic
growth, and few gains are made in vehicle efficiencies. There are no road pricing mechanisms
and public transit investment is low. To a certain extent the current policy approach in Jinan has
already superseded this approach, with a relatively high level of current and planned public
transport investment. However it is useful within the scenario analysis to consider likely impacts
of a high motorisation future and low fuel efficiency policies, which are often part of the route to
high motorisation.
The targets and budgetary CO2 analyses are shown in Table 2.7 and Figure 2.6. Within this
scenario, transport CO2 emissions rise from 1.42 million tonnes CO2 (MtCO2) in 2005 to 16.27
MtCO2 in 2030 – this represents over a tenfold increase. These assumptions are representative
of a high level of motorisation, moving from a 72 vehicles/1000 population (2005) to 590/1000
population (2030), around an 8% growth per annum in motorisation (2000-2030). This would
result in a very high level of motorisation, nearly reaching current US levels (675/1000
population) in 20 years. The result would be large increase in per person transport emissions,
from 0.22 tonnes/person in 2005 to 1.98 tonnes/person in 2030. Mode share distance travelled
by car hence rises from 11% to 85%, bus declines from 16% to 3%, and NMT declines from 48%
to 3% over the period 2005-2030. Car emissions are assumed to reach 139 gCO2/km by 2030,
relative to 178 gCO2/km in 2005. This means that vehicle travel is only marginally cleaner in the
future projections. This scenario is of course very sensitive to assumptions, hence a lower
motorisation rate, growth in distance travelled or improved vehicle efficiency would reduce the
growth in emissions significantly.
Table 2.7: Scenario 1 BAU CO2 Outputs
Baseline and Projection Car Bus Motorcycle Taxi NMT All
1990 (tonnes) 89,913 206,037 180,246 155,621 - 631,818
1990 per capita (tonne/person) 0.02 0.04 0.03 0.03 - 0.12
2005 (tonnes) 524,900 345,100 306,400 246,900 - 1,423,300
2005 per capita (tonne/person) 0.08 0.05 0.05 0.04 - 0.22
2010 (tonnes) 2,441,233 484,400 246,914 285,284 - 3,457,830
2010 per capita (tonne/person) 0.36 0.07 0.04 0.04 - 0.51
BAU 2030 (tonnes) 15,212,371 259,621 416,388 384,615 - 16,272,995
BAU 2030 per capita 1.85 0.03 0.05 0.05 - 1.98
(tonne/person)
BAU 1990-2030 aggregate 230,906,958 13,593,463 11,757,124 11,214,220 - 267,471,764
(tonnes)
Proportion of 2030 budget used 10% 26,604,791
by 2010
| 22You can also read