2 SUITS - MODULE - SUITS Project
←
→
Page content transcription
If your browser does not render page correctly, please read the page content below

SUITS

BUILDING SMALL-MEDIUM LOCAL AUTHORITIES’
    CAPACITY TO INTRODUCE INNOVATIVE
           TRANSPORT SCHEMES
          Workbook of participant

                          2
                        MO D ULE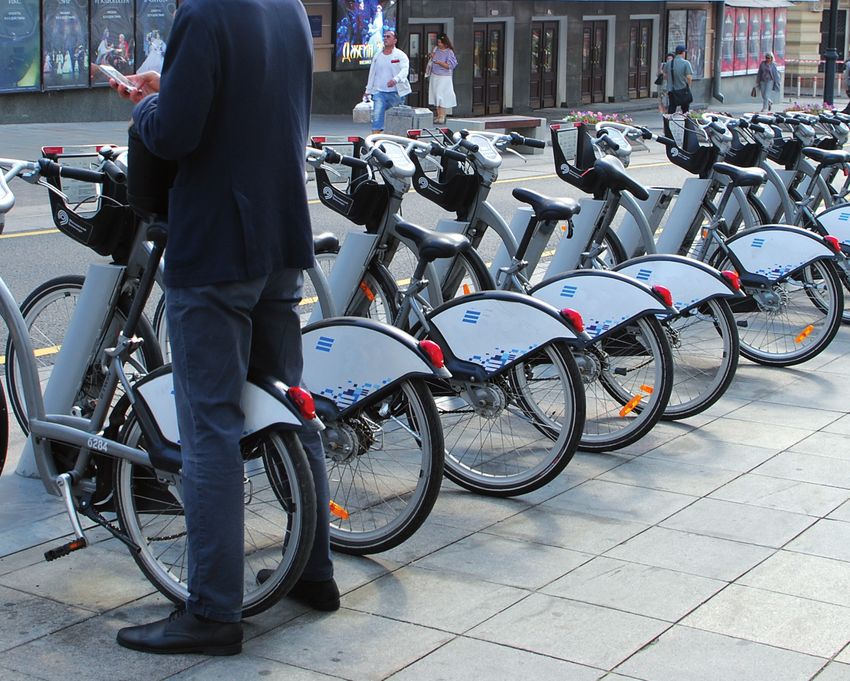
SUITS
    Capacity Building Programme
    Outline of the course

    Welcome session

1   Introduction

2   Innovative Transport Schemes (InnoTS)

3   Value for S-M cities (Challenges, Benefits and Beneficiaries)

4   Successful Case studies or Best practices of SUITS cities

5   Innovative financing, procurement, partnership

6   Business model canvases

7   Process and implementation aspects

8   Available tools and guidelines

     This material is result of WP5 of SUITS
     project.

                                                                    1
1   Introduction
    Terminology
    The following terms will be extensively used throughout the course:
    SUITS: Supporting Urban Integrated Transport Systems: Transferrable
    tools for Authorities
    CBP: SUITS Capacity Building Program
    SUMP: Sustainable Urban Mobility Plan
    LAs: Local Authorities
    S-M cities: Small-medium size cities, i.e. cities with population ranging
    between 50,000 and 250,000 residents in their urban centre
    BMC: Business Model Canvas
    MaaS: Mobility as a Service
    InnoTS: Innovative Transport Schemes, i.e. car-sharing, car-pooling,
    bike-sharing, MaaS
1   I n tr o d u cti o n

                               SUITS Supporting Urban
                               Integrated Transport Systems:
                               Transferable tools for authorities
                               Funded under: H2020-EU.3.4. - SOCIETAL CHALLENGES - Smart, Green And
                               Integrated Transport
                               Topic: MG-5.4-2015 - Strengthening the knowledge and capacities of local
                               authorities
                               Funding scheme: RIA - Research and Innovation action
                               Coordinator: Coventry University
                               Total cost: appox. EUR 4M
                               Duration: 4 years (From Dec 1st 2016 to Nov 30th 2020)
                               22 Partners (see map)
                               Project Website: http://www.suits-project.eu/

                               Coordinator
                               UK: Coventry University

                               PARTICIPANTS
                               UK: Arcadis, Transport for West Midlands
                               Italy: Politecnico di Torino, RSM, Eurokleis, Citta di Torino
                               Ireland: Interactions
                               Greece: Lever, Sboing, Makios, Municipality of Kalamaria
                               Spain: ITENE, INNDea
                               Romania: Integral Consulting, Municipality of Alba Julia
                               Portugal: VTM
                               Hungary: Logdrill
                               Germany: Wuppertal Institute, Technische Universistat Ilmenau
                               Lithuania: Smart Continent
                               Belgium: SIGNOSIS

4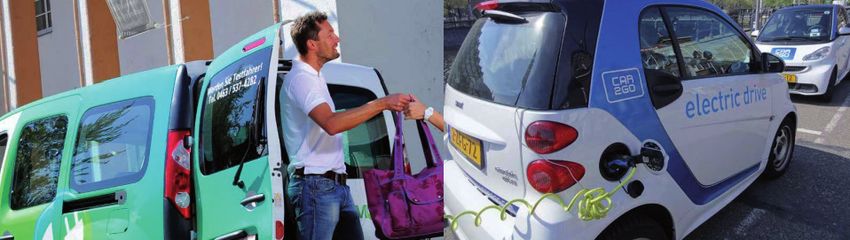
1   I n tr o d u cti o n

                           Course Framework: SUITS Project
                           Main objectives of SUITS Capacity Building
                           Overall aim: To increase the capacity of S-M local authorities to develop and
                           implement sustainable, inclusive, integrated and accessible transport strategies,
                           policies, technologies, practices, procedures, tools, measures and intelligent
                           transport systems that recognize the end-to-end travel experiences of all users
                           and freight

                           Support Small Medium Local Authorites in developing SUMPs by:
                           • Transforming them into learning organizations.
                           • Make transport departments resilient and responsive to new challenges and
                             changes.

                           Without capacity building and the transformation of transport departments into
                           learning organisations, training materials will not provide the step change needed
                           to provide innovative transport measures.

                           Expected outcomes of SUITS project
                           Transformation of transport planning departments in Small Medium cities into
                           change agents. Through development of:
                           • A validated capacity building programme for transport departments.
                           • Resource-light learning assets (modules, e-learning material, webinars and
                             workshops), based on stated needs.
                           • Decision support tools to assist in:
                             - procurement,
                             - innovative financing,
                             - engagement of new business partners,
                             - handling of open, real time and legacy data.
                           • Better Integration/use of freight and passenger data.

                                                                                                                5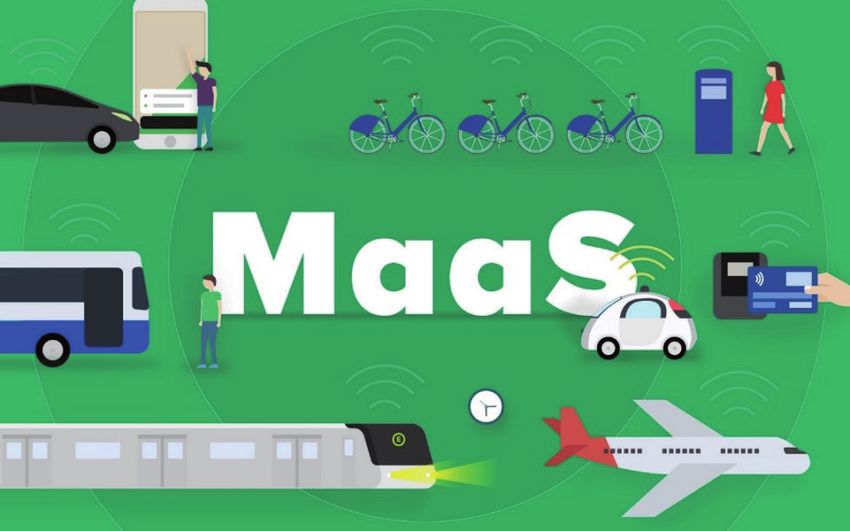
1   I n tr o d u cti o n

                               Course Framework: SUITS Project
                               Modules

                               “Building S-M LAs’ capacity to implement emerging transport
            Module 1
                               technologies” (ITS, Electric mobility, CAVs etc.)

                               “Building S-M LAs’ capacity to introduce innovative transport
            Module 2
                               schemes” (MaaS, Uber, Business Models etc.)

                               “Building S-M LAs’ capacity to implement urban transport
            Module 3           safety & security measures for all/vulnerable users”(passenger
                               and freight vehicles etc.)

                               “Building S-M LAs’ capacity to implement urban freight
            Module 4           transport measures”(SULPs, Crowdshipping, cargo bikes etc.)

            Module 5           “Data collection and analysis tools for integrated measures”

            Module 6           “Innovative Financing, procurement and business models”

                                                       Delivered
                                Modules 1/3/4
                                                       as classroom courses
                                                       Delivered as classroom course
                                Module 2
                                                       and webinar/e-learning
                                                       Delivered as e-learning
                                Modules 5/6            courses/webinars

6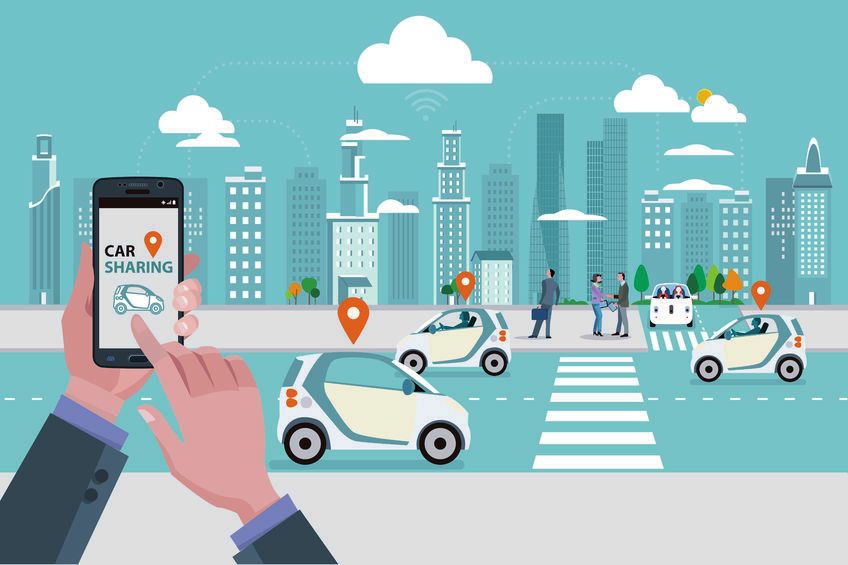
1   I n tr o d u cti o n

                           Module’s purpose
                           Overall module’s aim: To increase the capacity of S-M cities, to implement
                           and monitor the Innovative Transport Schemes (InnoTS) measures throughout
                           policymaking, budgeting, designing and facing the current challenges when
                           implementing these measures.

                           In particular aims at:
                           • Increase the understanding about the value of InnoTS in our cities, the effects/
                             cost of lack of urban mobility regulations, the operators and the economy of the
                             city and about the concept and methodology for developing InnoTS measures
                             while being able to recognise or find out the needs of urban freight transport
                             users.
                           • Build specific skills regarding how success of the measures can be ensured
                             - By convincing stakeholders and by overcoming financial, legal,
                               administrative and technical barriers

                           Specifically, the course is designed to:
                           • Strengthen cooperation between LA’s staff.
                           • Advance local priorities on InnoTS.
                           • Offer concrete practical tools and guidance to better implement these
                             Schemes.

                                                                                                                7
1   I n tr o d u cti o n

                               Key aspects of the problem

                                 Billion Euro per year
        Habitat Damage
                                 400

        Air Pollution            350

                                 300
        Climate
                                 250

        Noise                    200

                                 150
        Well-to-Tank
                                 100

        Accidents                 50

                                   0
                                         Car   Bus/Coach    MC       LDV       HGV       Rail    Aviation     IWT   Maritime

                                               Total external costs per transport mode for EU28 in 2016 [4]

                               External cost of transport
                               • ≈59% (€ 425 billion estimated) of total external cost of transport due to the
                                 use of Car, Bus/ Coach and Motor Cycle (EU28 in 2016) [1]

                               • ≈27% of overall external cost in EU28 (2016) stands for road congestion (total
                                 delay costs € 270 billion estimated) [1]

                               …while the extent of the overall external costs of transport, is estimated at
                               around € 1 000 billion (€ 981 billion) annually (almost 7% of the gross domestic
                               product of the 28 EU Member States) through air pollution, climate, habitat
                               damage, well-to-tank, noise, congestion, accidents. [2]

8
1 I n tr o d u cti o n
Key aspects of the problem
How to determine costs
• For retrieving cost estimates for specific countries and traffic situations there
are plenty of methodologies and approaches.
• The components (e.g. value of time, cost of fatality) needed for each country-
case study, vary in time and also depends on the individual economy of each
country.
• The aim is for every interested S-M city, to use some tools and methodologies
in order to calculate these costs.
Approach Description
Gives guidance on how to determine costs
Handbook on External Costs of Transport [3] about air quality, accidents etc.
(accompanied by excel calculators)
Guidelines to estimate the external Report of experts advisors that propose strategy
marginal accident cost [4] on calculating the accidents cost in transport sector
Key considerations
• Shared mobility and mobility as a service aim to reduce external cost of
transport, while promoting active mobility, multimodality and new technologies.
• Multiple benefits arise for people individually, society, economy and environment
of an urban area.
91 I n tr o d u cti o n
Further Reading
1. Handbook on external costs of transport https://ec.europa.eu/transport/
sites/transport/files/themes/sustainable/studies/doc/2014-handbook-
external-costs-transport.pdf
2. Guidelines to estimate the external marginal accident cost http://ec.europa.
eu/transport/infrastructure/doc/crash-cost.pdf
References
1. Van Essen, H. (2018). Sustainable Transport Infrastructure Charging and
Internalisation of Transport Externalities. [online] Available at: https://
ec.europa.eu/transport/sites/transport/files/2018-year-multimodality-
external-costs-ce-delft-preliminary-results.pdf [Accessed 15 Apr. 2019].
2. Mobility and Transport - European Commission. (2019). From infrastructure
costs to health and environmental impacts - European Commission shares
first findings on the true costs of EU transport - Mobility and Transport -
European Commission. [online] Available at: https://ec.europa.eu/transport/
themes/logistics/news/2018-12-17-costs-of-eu-transport_en [Accessed 15
Apr. 2019].
3. Update of the Handbook on External Costs of Transport. (2014). [ebook]
European Commission. Available at: https://ec.europa.eu/transport/sites/
transport/files/themes/sustainable/studies/doc/2014-handbook-external-
costs-transport.pdf [Accessed 15 Apr. 2019].
4. Final report of the expert advisors to the high level group on infrastructure
changing (Working Group 3). (1999). [ebook] Sweden. Available at: http://
ec.europa.eu/transport/infrastructure/doc/crash-cost.pdf [Accessed 15 Apr.
2019].
102 Innovative Transport
Schemes
This chapter provides a brief description and the key elements of
indicative Innovative Transport Schemes (InnoTS) measures .
InnoTS measures aim to reduce negative impacts of urban mobility
operations and help overcoming barriers to apply efficient and
sustainable urban logistics
Therefore InnoTS focus on:
• Increasing energy efficiency, to therefore improve the sustainability
and livability of cities.
• Improving reliability of systems, increasing customer satisfaction.
• Increasing safety and security, reducing the risk of road injuries
and fatalities. 112 I n n o vati v e T r a n s p o rt S che m e s
Short description of
Innovative Transport Schemes
Car-sharing
Car-sharing is a form of transport by which several persons in turn make use of
one or more collective cars.
This can be arranged both by the parties mutually and by a car-sharing provider [1].
Ride-sharing (carpooling – vanpooling)
Ride-sharing is the concept of “offer a ride” on vehicle where seats are available.
It covers various options, the most common is when the owner of a vehicle has a
predetermined journey and offers a seat to passengers going in the same direction
in exchange for sharing the costs of the journey [2].
In this way, the additional mileage is minimised. Carpooling generally uses
participants’ own automobiles [3].
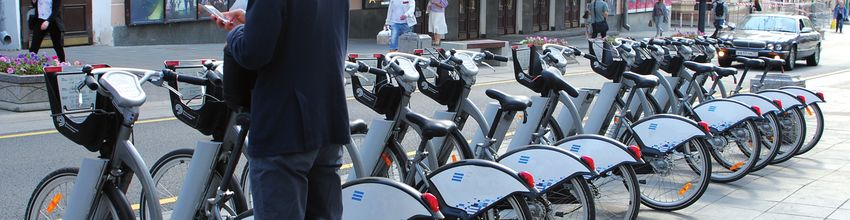
Bike-sharing
Bike-sharing schemes can be defined as ‘short-term urban bicycle rental
schemes that enable bicycles to be picked up at and returned to any self-service
bicycle station, which makes bicycle-sharing ideal for point-to-point trips.
The basic premise of the bike-sharing concept is sustainable transportation and
they differ from traditional, mostly leisure-oriented bicycle rental services in many
ways. Bike-sharing schemes could be with station-based bike sharing (SBBS)or
without docking stations (Free-floating bike sharing (FFBS) [4].
Mobility as a Service (MaaS)
MaaS is defined as the integration of various forms of transport services into a
single mobility service accessible on demand.
The key concept behind MaaS is to put the users, both travellers, and goods, at
the core of transport services, offering them tailor-made mobility solutions based
on their individual needs.
This means that, for the first time, easy access to the most appropriate transport
mode or service will be included in a bundle of flexible travel service options for
12 end users [5].2 I n n o vati v e T r a n s p o rt S che m e s
Further Reading
1. Civitas.eu. (2019). CIVITAS Insight 18 - Mobility-as-a-Service: A new transport
model | CIVITAS. [online] Available at: https://civitas.eu/tool-inventory/
civitas-insight-18-mobility-service-new-transport-model [Accessed 8 Apr.
2019].
2. Civitas.eu. (2019). CIVITAS Policy Note: Intelligent Transport Systems and
traffic management in urban areas | CIVITAS. [online] Available at: https://
civitas.eu/tool-inventory/civitas-policy-note-intelligent-transport-systems-
and-traffic-management-urban-areas [Accessed 8 Apr. 2019].
3. Civitas.eu. (2019). Mobility as a Service (MaaS) Readiness Level Indicators
for local authorities | CIVITAS. [online] Available at: https://civitas.eu/tool-
inventory/mobility-service-maas-readiness-level-indicators-local-authorities
[Accessed 8 Apr. 2019].
References
1. More Options for Energy Efficient Mobility through Car-Sharing (MOMO
CAR-SHARING). (2011). [ebook] European Commission. Available at: https://
ec.europa.eu/energy/intelligent/projects/en/projects/momo-car-sharing
[Accessed 28 Mar. 2019].
2. Study on passenger transport by taxi, hire car with driver and ridesharing in
the EU. (2016). [online] Brussels: European Commission. Available at: https://
ec.europa.eu/transport/sites/transport/files/2016-09-26-pax-transport-taxi-
hirecar-w-driver-ridesharing-final-report.pdf [Accessed 28 Mar. 2019].
3. Ridesharing Carpooling and Vanpooling. (2018). In: TDM Encyclopedia.
Victoria Transport Policy Institute.
4. Bike-sharing as a link to desired destinations. (2016). [ebook] Available at:
https://civitas.eu/sites/default/files/civitas_insight_10_bike-sharing_as_a_
link_to_desired_destinations.pdf [Accessed 28 Mar. 2019].
5. MAAS-Alliance. (2019). Mobility as a Service Alliance - MAAS-Alliance.
[online] Available at: https://maas-alliance.eu/ [Accessed 28 Mar. 2019].
133 Value for S-M cities
(Challenges, Benefits and Beneficiaries)
This chapter presents:
• Some of the benefits InnoTS measures bring to the city, how these
benefits are linked with strategic city goals and how they could
be identified in a systematic way with Social Impact Assessment
tool.
• The wider added value of InnoTS measures in a city taking also
into account their relevance to local, national and EU strategies.
• The main beneficiaries and stakeholders of the InnoTS and how
LAs could convince them to support measures implementation.
153 Va lu e fo r S - M ci ti e s (Challenges, Benefits and Beneficiaries)
Benefits of InnoTS
Direct positive effects
• Less congestion (by embracing sharing services, such as car-sharing or
carpooling) [1].
• Reduced fuel consumption & less environmental pollution by the reduction of
the total number of circulating vehicles [2].
• Reduced costs for the user deriving from the lack of private car ownership
costs (insurance, service costs, etc.) [3].
These benefits can be all translated into economic
growth since:
• LAs can benefit from the set up and exploitation of sharing services (e.g.
municipal shared bikes fleet).
• Reduced need for infrastructure repair, since the total number of vehicles can
be reduced, as a result of the increased take-up of car-pooling services or other
InnoTS [1].
• In order to achieve these benefits, while avoiding negative results and reactions,
global approach, public discussion and stakeholders collaboration are required.
• Global approach refers also to
- combination of these schemes with other mobility/transport measures or
other technologies in order to achieve optimised performance and provide
tailored service.
Example: when implementing car-/bike- sharing systems, it is recommended to be
combined with other “smart” mobility measures (for example electric vehicles can
be used for car-sharing [4]) or Car Independent Lifestyle measures (for example
bike-sharing concept promotes also biking, see reference 5).
163 Va lu e fo r S - M ci ti e s (Challenges, Benefits and Beneficiaries)
Benefits of InnoTS
Correlation of Inno TS with city strategic objectives
[6]
CHALLENGES global
Conge- safety & participa- strategic
health climate
SOLUTIONS stion security tion planning
change
LESS
CAR-DEPENDENT
MOBILITY OPTIONS
Car-sharing
Carpooling
Walking
and cycling
Sustainable
urban mobility
plans
Very strong Strong Moderate Weak/indirect
connection connection connection connection
Correlation of Inno TS with city strategic objectives
CiViTAS-CATALYST explains the impact of different mobility solutions to challenges
regarding health, congestion, safety & security, participation, strategic planning
and global climate change [7].
As identified by CiViTAS-CATALIST Project some of the most effective measures
are the following:
• “Collective passenger transport (new forms of public transport services, access
for elderly and disabled passengers, integration of modes)”. [7] MaaS
component.
• “Transport telematics (e-ticketing, traffic management and control, travel and
passenger information)” [7]. MaaS component.
• “Less car dependent mobility options (car-sharing, carpooling, walking and
cycling)” [7]. Car-sharing, ride-sharing and bike-sharing as essential
measures towards a less car dependent mobility.
173 Va lu e fo r S - M ci ti e s (Challenges, Benefits and Beneficiaries)
Benefits of InnoTS
Example: Coventry Strategic Objective [8
Culture and tourism: “This will focus on
growing the visitor economy, particularly
“…the launch of the Midlands Engine, around Coventry’s opportunity to
where the 11 Midlands-based LEPs become UK Capital of Culture in 2021,
will work together to respond to the and further developing the renowned
Government’s economic and political offer that is “Shakespeare’s Stratford”.
challenges, particularly in: Coventry named UK city of culture 2021
• Enhancing transport connectivity (guardian)”
• ….
…”A key priority is to increase levels of
business engagement with the area’s
“Transport infrastructure and urban world class R&D and innovation asset,
centre improvements…will play a and fulfill the area’s potential as a test
crucial role in bringing major sites bed for new low carbon products.”
forward for development and attracting
business investment.”
Social Impact Assessment tool
Transport measures impact all aspects of societies and human lives and more
specifically dense urban centres.
Transport needs to be inclusive, accessible and make a make a positive
contribution to quality of life.
Towards sustainable development, impacts assessment methods are needed
regarding short and long-term social, health and wellbeing factors.
‘’Social Impact Assessment is the process of analysing, monitoring and
managing the social consequences of development.’’ (Vanclay, 2003)
Issues: Factors, Samples, Social Groups, Data Collection Bias, etc.
183 Va lu e fo r S - M ci ti e s (Challenges, Benefits and Beneficiaries)
Impact Assessment Dimensions
• Environmental impact is defined as “any changes to the environment, whether
adverse or beneficial, wholly or partially resulting from an organisation’s
environmental aspects”.
• Economic impacts are defined in terms of the “effects on the level of economic
activity in a given area” (Weisbrod & Weisbrod, 1997).
• Social impacts have been defined as the effects which characterize and
influence the community’s social and economic wellbeing (Canter et
al.1985).
assessment
SUMMARY
IMPACTS OF Key Distributional
impacts QUANTITATIVE QUALITATIVE monetary 7 PT scale/
£ NPV vulnerable grp
Value of journey time changes (£)
Commuting
Net journey time changes (£)
and other users 0 to 2 min | 2 to 5 min | > 5 min
Reliability impact on
Commuting and Other users
Physical activity
Social
Journey quality
Accidents
Security
Access to services
Affordability
Severance
Option and no-use values
Additionally in methodologies such as WebTAG a 4th dimension is integrated
separately and includes Health Impacts.
WebTAG is an online tool of the UK Department for Transport’s web-based
multimodal guidance on appraising transport projects and proposals.
193 Va lu e fo r S - M ci ti e s (Challenges, Benefits and Beneficiaries)
Overview of factors to be
considered by type, source and
level of human needs based on
SUITS WP7 [9]
Source THEME SUB THEME assessment IMPACT
Visual quality
Structurally Historical /cultural resources
Severance/social cohesion
Presence of infrastructure Noise nuisance
Temporarily Barriers and diversions
(during construction) Uncertainty of construction
Provider Forced relocation
based Visual quality
Presence of parked cars
Use of space
Transport facilities Availability and physical access
Presence of transport facilities, Level of service provided
services and activities
Transportation choice /option values
(accessibility)
(inc. cost and temporal Cultural diversity
dimension) Access to spatially distributed services
Land use/delivery/opportunity
and activities
Accidents
Safety Averting behavior
Traffic Safety perceptions
(movement of vehicles) Public safety (dangerous cargo)
User
based Environment Noise levels, nuisance
Soil, air and water quality
Intrinsic value, journey quality
Travel Physical fitness (active travel)
(movement of people)
Security
203 Va lu e fo r S - M ci ti e s (Challenges, Benefits and Beneficiaries)
KPIs across economic, social and environmental issues were broken down by
individual/user level, business organisation level, and societal level as follows.
(MAASiFiE, D4, 2017)
213 Va lu e fo r S - M ci ti e s (Challenges, Benefits and Beneficiaries)
SIA example Kalamaria
- Bike sharing scheme [9]
Assessment
Impacts Summary of
key impacts
Quantitative/Qualitative
Increased economic efficiency, reduction in travel time, income that can be allocated
Economic to install another parking area
More space and better use of it along with increased awareness
Social
of sustainable urban mobility issue
Reduction of CO2 emissions and additional pollutant emissions (NOx,PM, lead)
Environment as well as improved energy consumption
HealtH Reduction in number of accidents and injuries due to motorised transportation
Added value: (a) compliance
with strategies/regulations
(EU, national, local)
Value is added also by the fact that UFT measures is relevant to local, national and
EU strategies.
• In a local level, InnoTS could contribute to strategies for the economic growth
of commercial city centres, the local tourism, and the air pollution strategies,
while they are part of SUMP.
• In national and EU level, these measures contribute to meeting its
environmental, health and climate policy goals (e.g. Green Paper [10], European
Strategy on Low-Emission mobility [11], Strategic plan 2016-2020 Move March
2016 [12] etc.)
• The alignment of InnoTS to these policies as part of SUMP [12] could make
S-M cities eligible to receive financial support from EU funds.
• Further support about alignment of this kind of measures with EU policies is
provided by EPPOM “Managing mobility for a better future” tools and CIVITAS
22 cities network [13].3 Va lu e fo r S - M ci ti e s (Challenges, Benefits and Beneficiaries)
List of EU strategies/regulations
Corresponding Type of Relevance
Topic Rating explanation
Document content to SUITS
• Urban freight transport The content is not relevant
• New and emerging exclusively for small and
1.
transport schemes Green Paper 3 medium sized cities but
Green paper [10]
• Car independent lifestyles can by adopted by any city
• New and emerging technologies regardless of size
2. • Urban freight transport The content is not relevant
SWD (2016)244 • New and emerging exclusively for small and
Staff working
European Strategy transport schemes 3 medium sized cities but
document
on Low-Emission • Car independent lifestyles can by adopted by any city
mobility [11] • New and emerging technologies regardless of size
• Safety and security
The content is not relevant
3. • New and emerging
exclusively for small and
Strategic plan transport schemes
Strategic Plan 3 medium sized cities but
2016-2020 Move • Mobility management
can by adopted by any city
March 2016 [12] • Car independent lifestyles
regardless of size
• New and emerging technologies
Added value: (b) the
collaboration of all actors/
stakeholders
Communication, collaboration and coordination between many different
stakeholders/actors is needed in many aspects of InnoTS development and
implementation process.
These procedures are essential to arrive to an agreement and wide support but
they also give LA the opportunity to:
• create a deeper interaction with them and facilitate the development of
future projects action plan,
• make new synergies and develop new ideas and projects,
• ensure constant collaboration in future projects.
23
Maximising synergies should be one
of the priorities for S-M cities due
to the limited available resources
(scarcity of technical staff working
with LA, limited financial resources
etc.)3 Va lu e fo r S - M ci ti e s (Challenges, Benefits and Beneficiaries)
How to build collaboration/
identify the stakeholders
and actors needs
• Targeted interviews to representatives of stakeholders groups in order to inform
them about:
- municipality plans and objectives,
- the potential benefit for them if supporting the project implementation,
- the value of their contribution to the project.
• Running survey with questionnaires to stakeholders groups, asking for their
perception of problems and solutions, for expressing their needs and restrictions
that may hinder their contribution.
• Public consultation and open meetings to be invited all stakeholders in every
implementation stage.
• Frequent inspections in the most busy spots of the road network where issues
may be arise.
• Tailored approaches to different stakeholders/actors (i.e. customers through
questionnaire, shop owners through short interviews, freight operators through
short interviews - conversations).
Identification of actors
and stakeholders
• The first step towards the formulation of a framework that ensures integration
of all actors and stakeholders of a city in urban mobility decision making is
to identify them by producing an extensive list of them. InnoTS measures
implementation can be improved by involving a wide range of stakeholders.
Additionally this results in the identification of factors that influence both local
authorities and freight-related stakeholders, factors which currently require
further investigation.
• Usual actors and stakeholders for InnoTS measures implementation:
- Local authorities, - Commercial organisations (car /bike/
- Public Transport Operators, scooters etc. rental companies)
- Citizens & Visitors, - Vehicle manufacturers (car, bike etc.)
- Non-Governmental Organisations, - R & D organisations – IT developers
24 - Private investors - Local business owners3 Va lu e fo r S - M ci ti e s (Challenges, Benefits and Beneficiaries)
Identification of actors
and stakeholders for InnoTS
measures based
on administrative level
Administrative Level
Actors and Stakeholders
INTERNATIONAL NATIONAL REGIONAL LOCAL
Commercial organisations X X X X
IT companies / R& D X
Citizens & Visitors X
Public transport operators X X X
Vehicle manufacturers X
Traffic engineers X
Local Authorities X X
Local business owners X
Private Investors X X X X
NGOs/CSOs X X
Identification of actors and
stakeholders per type of InnoTS
[14]
Car- Bike- Ride-
Actors and Stakeholders MaaS
sharing sharing sharing
Commercial organisations
X X
(rental car/bike, travel agencies, etc.)
IT companies / R& D X X X X
Citizens & Visitors
Public transport operators X X
Vehicle manufacturers X
Traffic engineers
Local Authorities X X X X
Local business owners X
Private Investors X
NGOs/CSOs X X
253 Va lu e fo r S - M ci ti e s (Challenges, Benefits and Beneficiaries)
Challenges and Responses for
implementation of Ride-sharing [15]
‘I can’t rideshare because I have small children’.
If those children need dropping and collecting from nursery or school, that’s
fine. Can that person give someone else a lift to work who lives near to the
nursery or school?
‘Ride-sharing doesn’t suit me because I work shifts’.
If they work shifts, there are likely to be lots of other people working the same
shift that they do not know about. The shift patterns may vary, but suggest
they share every other week or whatever they can manage. 20% of journeys
registered on the Liftshare network are between the hours of 6pm and 12
midnight.
‘I work flexi-time so can’t rideshare’.
Most flexi-time based offices have core hours. Suggest this person matches
with a colleague once a week when they could both work an agreed time period
for example 10-6 just once a week or once a month.
‘Nobody lives near me’.
They don’t know this unless they have searched. Tying into a network with
hundreds of thousands of members, the chances are that even if they widen
their search, they will find a match. That match may drive past them to get to
the destination, or they may be able to pick others up en route to help others
out.
‘I don’t have a car’.
Ride-sharing isn’t just for car owners: for those who don’t drive or don’t have
access to a car, this could be a perfect solution. There is the ability to search
for a lift as well as offer a lift to others.
‘I need my car during the day’.
That’s fine. Offer a lift to someone travelling to the same start point as you or
use a pool car for your business trips during the day. You could share the trip
one way, or just share on the days that you know you are in the office all day.
‘I share with my partner/spouse’.
This is great if they do, but they should still be encouraged to register so that
you - as an organisation/region - can monitor what is happening stats-wise. If
they are bringing one car to work rather than two, they are doing their bit and
can still be part of the wider scheme.
263 Va lu e fo r S - M ci ti e s (Challenges, Benefits and Beneficiaries)
Challenges and responses for implementation of Ride-sharing
‘I don’t like the idea of sharing with a stranger’.
If you are a restricted group, you have paid for the privilege of only enabling
staff to share with other members of staff. This makes the number of strangers
they might find as a match much less of an issue. However, suggest they follow
the safety tips and trial car-sharing first.
‘I don’t need to rideshare’.
They may not need to, but they could be helping someone else out if they put
themselves on the system. They could be offering a lift to someone who can’t
otherwise easily get to work.
Challenges for Car-sharing
implementation in smaller cities [16]
• The concentration of people who are ready to arrange their mobility without
private car and share cars with others is lower.
• Therefore the density of potential Car-Sharing users is lower than in bigger
cities.
• Fewer Car-sharing vehicles means a lower probability of bookings since various
booking requests cannot so easily be shifted among the available cars in times
of greatest demand.
• Fewer cars also means it is not economically feasible to employ full-time paid
staff.
In smaller cities that cannot be looked after by professional providers, it
must be set up and looked after by a volunteer-run organisation
• It depends on individual people or a group of like-minded individuals taking on
this task.
• Success of such voluntary undertakings depends on the resourcefulness and
activity of individual “doers”.
• Nonetheless, successful examples show that Car-Sharing participation in
smaller cities and communities can match or even surpass the participation
levels in large cities when population size is taken into consideration (e.g.
Vaterstetten near Munich in Germany, Albertslund in Denmark, Moorcar in
Great Britain, The Swiss example: Mobility Car-sharing).
The administrations of smaller cities and communities can support the
development of local Car-Sharing services through the following measures
• They can become business customers of the Car-Sharing service and use it for
their own work-related travel. 273 Va lu e fo r S - M ci ti e s (Challenges, Benefits and Beneficiaries)
Responses to Challenges for Car-sharing in smaller cities
• They can reduce the economic risk in the start-up phase by guaranteeing
(possibly for a pre-established period of time) a minimum level of use.
• They can use their communication channels within the community to promote
the service.
Challenges & Responses for
Bike-sharing implementation [17]
Travel time is one of the most important barriers for cycling and bike-sharing
Cycling incentives should be personalized and geared to individuals and trips
for which the bike is a good alternative in this respect.
Bad weather (precipitation, cold temperatures and windy conditions) is
known to have a negative influence on cycling
Bike-sharing users should be given extra weight in incentives that encourage
cycling. Although scientific evidence is scarce, there are indications that
health is the single most important reason for travellers to use active modes,
i.e. cycling or walking. Several popular apps are now also using health as an
incentive to promote cycling.
Inconvenience in using bike-sharing system
Strategic location of docking stations & integration with public transport
or free floating bike-sharing system [18]; [19].
• There is extensive literature suggesting commuting/work to be a primary trip
purpose among users of bike-sharing [18; 19; 20; 21]
• Docking stations should be placed to areas with high jobs density and/or
residential density.
• Docking stations should be better integrated with public transport, as well as
service suburban locations, beyond the inner areas bordering the CBD.
Inconvenience in using bike-sharing system
Ease of signing up [18]; [19]
• A complicated and lengthy sing-up process might turn away a lot of potential
users.
• A simpler and quicker process (e.g. sing-up with the use of credit car) can
support “spontaneity” which bike-sharing users has identified as a crucial
element of bike-sharing experience.
283 Va lu e fo r S - M ci ti e s (Challenges, Benefits and Beneficiaries)
Challenges & Responses for Bike-sharing implementation
Safety: Lack of bicycle infrastructure [18]; [19]
Adequate and extensive bicycle infrastructure
• Lack of bicycle infrastructure is cited as one of the most important barriers in
using bike-sharing systems.
• The success of a bike-sharing scheme may depend not just on the availability
of public bicycles, but also on the network in which these bikes are intended to
operate.
• Recent work examining cycling trends in Sydney and Melbourne have pointed
towards the importance of bicycle infrastructure.
• ‘‘Probably the most visible commitment of a city to cycling is a comprehensive
system of separated bicycle paths and lanes, providing a reserved right of way
to cyclists and sending a clear signal that bicycles belong” [22].
Challenges & Responses
for MaaS implementation
Providing the physical infrastructure: The role of Public Authorities &
Regional/Local Actors
One important challenge for creating a well-functioning IMS is institutional
coordination & physical planning [23]:
Institutional coordination To integrate information, ticketing, scheduling
Physical planning To create a seamless travel experience for passengers
Regional and local actors are responsible for implementing these types of
measures, often in close collaboration with public transport agencies and
operators, and this is an area where public actors at local and regional level
could do a lot to enable MaaS [23].
Physical planning:
The necessary infrastructure for bike-, ride- and car-sharing is one important role
of public authorities and a crucial step towards development of MaaS [24].
“Seamless intermobility” describes this ideal, distinguishing between the four
dimensions [25]:
1. Seamless information
2. Seamless time (reduced waiting times)
3. Seamless space (short distances between modes)
4. Seamless service
Integration of physical infrastructure is an important enabling factor [26]. 293 Va lu e fo r S - M ci ti e s (Challenges, Benefits and Beneficiaries)
Analyzing benefits and views
EXERCISE A of stakeholders on Innovative
Transport Schemes
Description of exercise
A) Use sticky notes to fill in the two open Boxes. The first field refers to the benefits of a selected InnoTS.
The second field refers to the actors/stakeholders/social groups that will be affected (positively or nega-
tively) by the measure.
B) On the left column of T-Chart transfer the actors/stakeholders which would present the most negative
reactions to the proposed measure. On the right column, transfer the sticky notes so they can be used
as convincing arguments to the stakeholders written on the left corner.
(To perform the exercise focusing on specific city, a city map, mobility data and relevant information are
distributed to support brainstorming).
Please fill in the following box with the benefits that you TEAM NAME
believe the Innovative Transport Schemes that you selected
can bring to your city.
MEASURE TITLE
BENEFITS FOR YOUR CITY:
Please fill in the following box with the actors/stakeholders/social groups that you believe will be
negatively or positively affected by the Innovative Transport Schemes that you selected.
STAKEHOLDERS:
Please fill in the T-chart below, according to the arguments that may be expressed by actors in
favour/against the implementation of the InnoTS provided to your group.
ACTORS ARGUMENT
303 Va lu e fo r S - M ci ti e s (Challenges, Benefits and Beneficiaries)
References
1. Transportenvironment.org. (2019). Does sharing cars really reduce
car use? | Transport & Environment. [online] Available at: https://www.
transportenvironment.org/publications/does-sharing-cars-really-reduce-
car-use [Accessed 28 Mar. 2019].
2. Umweltbundesamt. (2019). Fahrgemeinschaften. [online] Available at:
https://www.umweltbundesamt.de/umwelttipps-fuer-den-alltag/mobilitaet/
fahrgemeinschaften#textpart-1 [Accessed 28 Mar. 2019].
3. Barriers to car-sharing. (2012). [ebook] Available at: http://chums-carpooling.
eu/wp-content/uploads/2015/12/barriers-to-car-sharing-v1.pdf [Accessed
28 Mar. 2019].
4. Carsharing: Evolution, Challenges and Opportunities. (2014). [ebook]
Available at: https://www.acea.be/uploads/publications/SAG_Report_-_
Car_Sharing.pdf [Accessed 28 Mar. 2019].
5. Civitas.eu. (2019). Car independent lifestyles | CIVITAS. [online] Available at:
https://civitas.eu/measures/car-independent-lifestyles [Accessed 28 Mar.
2019].
6. Eltis.org. (2016). SUMP Guidelines | Eltis. [online] Available at: http://www.
eltis.org/guidelines/sump-guidelines [Accessed 28 Mar. 2019].
7. Civitas.eu. (2019). [online] Available at: https://civitas.eu/guide_ebook/index.
php%20and%20www.civitas-initiative.eu/docs/2086/CIVITAS_Guide_For_
The_Urban_Transport_Professional.pdf [Accessed 28 Mar. 2019].
8. Peace, S. (2017). Response of the Midlands Engine to HM Government’s
Green Paper. [ebook] Chair, Midlands Engine. Available at: https://
www.midlandsengine.org/wp-content/uploads/2017/04/Response-
of-the-Midlands-Engine-to-%E2%80%98Building-our-Industrial-
Strategy%E2%80%99.pdf [Accessed 9 Apr. 2019].
9. Work Package 7, D7.3 Social Impact Assessment Report. (2018). [ebook]
Suits Project. Available at: http://www.suits-project.eu/wp-content/
uploads/2018/12/Social-Impact-Asessment-Report.pdf [Accessed 15 Apr.
2019].
10. Green Paper. A 2030 framework for climate and energy policies. (2013).
[ebook] European Commission. Available at: https://www.ceps.eu/sites/
default/files/Vergote.pdf [Accessed 28 Mar. 2019].
11. Communication from the Commission to the European Parliament,
Council, European Economic and Social Committee and Committee of the
Regions. (2016). A European Strategy for Low-Emission Mobility. [online]
Brussels: EUROPEAN COMMISSION. Available at: https://ec.europa.eu/
transport/sites/transport/files/themes/strategies/news/doc/2016-07-20-
decarbonisation/swd%282016%29244.pdf [Accessed 28 Mar. 2019].
313 Va lu e fo r S - M ci ti e s (Challenges, Benefits and Beneficiaries)
References
12. Strategic plan 2016-2020 – Mobility and Transport. (2016). [ebook] Available at: https://ec.europa.eu/info/
publications/strategic-plan-2016-2020-mobility-and-transport_en [Accessed 28 Mar. 2019].
13. Epomm.eu. (2019). EPOMM :: Home. [online] Available at: http://www.epomm.eu/ [Accessed 28 Mar. 2019].
14. SUITS CBP “Guidelines to developing bankable projects, new business models and partnerships. Eurokleis
s.r.l, Italy (Bellini, F.; Dulskaia, I.). 2018”.eu.
15. Chums-carpooling.eu. (2019). Liftshare Scheme Manager. Barriers to car-sharing.[online] Available at: http://
chums-carpooling.eu/wp-content/uploads/2015/12/barriers-to-car-sharing-v1.pdf [Accessed 28 Mar. 2019].
16. MOMO Project. Car sharing in small cities. Europa.eu. (2019). [online] Available at: https://ec.europa.eu/
energy/intelligent/projects/sites/iee-projects/files/projects/documents/momo_car-sharing_f09_car_sharing_
in_small_cities_en.pdf [Accessed 28 Mar. 2019].
17. Empowertoolkit.eu. (2019). Empowering cycling - Empower Toolkit. [online] Available at: https://
empowertoolkit.eu/objective/empowering-active-transport/empowering-cycling/ [Accessed 28 Mar. 2019].
18. Barriersand facilitators to public bicycle scheme use: a qualitative approach. (2012). [ebook] Transport
Research. Available at: https://www.academia.edu/12346871/Barriers_and_facilitators_to_public_bicycle_
scheme_use_a_qualitative_approach [Accessed 28 Mar. 2019].
19. Fishman, E., et al. Barriers to bikesharing: an analysis from Melbourne and Brisbane. J. Transp. Geogr. (2014)
20. Alta Bike Share (2011). Melbourne bike share survey, Melbourne.
21. Nice Ride Minnesota (2010). Nice Ride Minnesota survey, November 2010. Retrieved 20.06.11
22. Pucher, J., Greaves, S., & Garrard, J. (2010). Cycling down under: A comparative analysis of bicycling trends
and policies in Sydney and Melbourne. Journal of Transport Geography, 19(2), 332–345.
23. Koglin, T. (2017). Drivers and Barriers for Integrated Mobility Services. (2017:3 ed.) Lund: K2-Sveriges
nationella centrum för forskning och utbildning om kollektivtrafik
24. Franckx, Laurent and Inge Mayeres (2015). Future trends in mobility: challenges for transport planning tolls
and related decision-making on mobility product and service development. Deliverable 3.3, MIND-sets
project, www.mind-sets.eu.
25. Feng, Cheng-Min (2014). New prospects of transportation mobility. IATSS Research 38:22-26
26. Goodall, Warwick; Tiffany Dovey Fishman; Justine Bornstein and Brett Bonthron (2017). The rise of mobility
as a service – Reshaping how urbanities get around. Deloitte Review 20:112-129.
324
Successful Case Studies
or Best practices
of SUITS cities
This chapter demonstrates
• two case studies - as best practices - of InnoTS implementation:
Case Study 1 Helsinki’s Mobility as a Service (MaaS)
Case Study 2 Turin’s Bike Sharing System (case study from city participating in
SUITS project)
Case Study 3
• One of the main issues analysed is the barriers and the drivers 33
that every city had to deal with when implementing themInnovative Transport
Schemes
Mobility as a Service (Helsinki)
LOCATION due to the accommodation of the Furthermore the implementation
MaaS Global which started the Whim of such a service will create better
Helsinki, Finland app in late 2016 in order to provide infrastructure and provision of
such transport services. The Whim services at no extra cost. Therefore
application has currently more than funding sources are derived
WHY THIS IS A BEST 60.000 active users, more than 5.000 from investments directly to the
PRACTICE IN THIS FIELD? of which pay for a subscription on a application’s developer.
monthly basis, while its users tend
This application has been a Moreover, regarding the time period
to book more than 1.8 million trips.
breakthrough since it is the first needed for implementation, this
While the number of users and trips is
Mobility as a Service application is approximately 6 months once
increasing it still accounts for a small
which is currently fully operating in certain technical, legislative and other
portion of the total trips and travellers
four cities and under development in prerequisites are met.
in Helsinki’s region since in 2017, 375
several more cities at both European million trips were conducted through The service is provided solely through
and International level. public transport. the mobile application which requires
Due to the preliminary stage of further connection with IT systems of
Finaly, while Whim offers MaaS
development in MaaS overall other transport operators that are to
transport solutions certain problems
comparisons are not able to be be included on it.
arise due to the lack of coordination
conducted currently. with local transport agency which had
not initially integrated Whim’s tickets
into its own public transport ticketing
system. It promised to do so by the INDICATORS TO MEASURE
INITIAL PROBLEM end of 2018 which is expected to SUCCESS AND FINAL
AND TARGET GOAL improve the level of service provided OUTCOME/IMPACT
through the app.
The need to develop and promote The scope of a MaaS service is to
an integrated transport system that reduce car dependency but it is still
allows transferability and flexibility for unclear how would a subscription in
the passenger created WhimApp, the Whim for example, affect people in
SCALABILITY/
first complete MaaS application. terms of vehicles kilometres travelled.
REPLICABILITY Expected benefits for the cities are
MaaS is transferable to cities and the reduction on congestions which
networks that offer diverse mobility means less polluting emissions and
MEASURE DESCRIPTION solutions and provide relative open thus improvement of air quality, public
mobility data. health and economy. At the same
A MaaS service has been developed time less usage of car leads to lower
and applied in a few European cities needs in space for vehicle’s operation
as well as Singapore and while the such as parking which allows cities
city of Helsinki is the first European to investigate further opportunities in
city to incorporate a system of MaaS IMPLEMENTATION city planning.
into its transport system in an effort to REQUIREMENTS
enhance urban mobility for its citizens, Social groups mostly benefited
In its current form, implementation through WhimApp are citizens and
Birmingham and Antwerp are now does not require resource spending
following its example. With a regional more specifically travellers. Since
from the cities and the municipalities Whim increases the usage of PT in
population of 1.4 million, Helsinki since the company provides the
has become a global testing site and Helsinki it consequently reduces
application at no further cost. usage of private vehicles which
34leads to less congestion, lower travel Drivers: Cities with high level of IT to heavily affect the public’s accep-
times, etc. systems already up and running are tance.
capable of immediate implementation
Indicators to measure success/ Drivers: People increasingly desire
and cities with lower levels can mo-
implementation: multimodal transport solutions that
dernize their IT.
meet their needs in a sustainable and
PT usage and car usage rates are two financially efficient manner regarding
considered as indicators that can be MaaS as a major future factor in their
used while further in the future with Staff daily choices.
more time under implementation of
Drivers: No human resources alloca-
the service, wider impacts will be
tion is needed from Local Authorities.
identifiable and measurable. More
specifically public transport usage
in Helsinki rose from 48% to 72% in
three months of full implementation Political
while car usage has almost Barriers: Local authorities decline
halved within the city from 40% to their opportunity to provide MaaS and
approximately 20%. it is unknown whether local transport
agencies will lose ridership while
users choose alternative services. In
addition to that, local transport au-
BARRIERS AND DRIVERS thorities already providing a high level
of service might weaken their brand
Cooperation/ name eventually.
coordination issues
Drivers: LAs responsible for tran-
Barrier: Strong needs for cooperation sportation in areas with lower levels
and coordination with both the local of service can benefit from the overall
authorities, the transport operators improvement expected from such an
and providers as well as the national application while at the same time no
government. further cost is needed. This can lead
Drivers: The immediate positive im- to higher levels of citizen satisfaction
pacts which can act as a driver for towards local politicians.
authorities to push towards such ser-
vices.
Legal
Barriers: The need for transport ope-
Process rators to share their data openly which
in many occasions will lead to strong FURTHER
Barriers: No process is needed from
the part of the LAs since the company reactions from them and the fact that INFORMATION
is responsible for the organization and legislators have to provide for a third https://whimapp.com/
implementation of the service. party MaaS service the framework in
order to operate without disruptions http://www.eltis.org/discover/
Drivers: The minimum amount of ef- from already up and running public news/how-helsinki-became-
fort needed from cities. transit companies. mobility-service-leader
Technical/Data Resources Societal
Barriers: The need for technical pre- Barriers: Promotion of the measure is
requisites and integration of all avai- not identified as a barrier for the LAs
lable data from transport authorities since it is not their responsibility to do
and operators in order for them to be so but there is a need for an under-
incorporated in the application and standing of the public that this service
provide the highest level of service is under the continuous control of the
possible. authorities and can be managed when
and if needed. The latter is expected
35Innovative Transport
Schemes
Bike Sharing System (Turin)
LOCATION free-floating bike sharing systems scheme is characterised by Public-
which covered the whole urban area. Private Partnerships.
Turin, Italy With the provision of an IT system
and more specifically a smartphone
application, people can rent a bike
WHY THIS IS A BEST for a desired time period and cycle INDICATORS TO MEASURE
PRACTICE IN THIS FIELD? around the city’s designated areas.
SUCCESS AND FINAL
Additionally, incentives were given
The introduction and successful im- to nudge proper use of parking OUTCOME/IMPACT
plementation of an integrated bike space and in order to avoid public The bike-sharing system in Turin has
sharing system as a low-priced, space obstruction. By October, led to the creation of a low-carbon
low-carbon measure with numerous 2018, two bike sharing operators fund which aims to finance actions
benefits for the city. are still active in Turin offering that will eventually result into a cultural
approximately 3.000 bikes and an change among citizens. Morever, the
average of 7.000 bike pickups per beneficiary social groups of a bike
day. sharing system are the citizens and
INITIAL PROBLEM tourists.
AND TARGET GOAL
The high congestion levels
SCALABILITY/ Indicators to measure success/
especially during peak hours and
the limited share of active travel REPLICABILITY implementation:
in the city’s daily mobility required Turin’s bike-sharing system is an The aforementioned bike-sharing
the integrated promotion of a bike initiative that is replicable in other system benefits the city mainly
sharing system to enhance the S-M cities and similar models can through environmental benefits such
quality of life. be followed in order to achieve as the reduction of CO2 and other
environmental sustainability through pollutant emissions as they are
innovative mobility solutions. produce from motorised vehicles.
Environmental enhancement is
MEASURE DESCRIPTION expected to improve even further
in the future when the citizens will
The municipality of Turin presented develop a cycling culture and the
a public announcement allowing the IMPLEMENTATION
city will be able to accomodate
diffusion of free floating bike sharing REQUIREMENTS properly their active travel needs.
systems in December, 2017. The The city does not fund such measure
operators, answered to this call by Moreover, indicators that can present
since it permits bike sharing operators and describe the success of such a
proving pilot implementation and to run their scheme and compensate
trials for a time period of 12 months. measure are:
the city for each bike they offer.
Furthermore, public discussions Therefore, the municipality earns 20€ • Cycling rates
and debates among all involved and for each bike they accomodate in their
affected stakeholders took place • Emissions reduction
city network. Morever, revenue derived
in order to evaluate each group’s from this measures will be conveyed
respective feedback with a view on into a fund that aims to ameliorate and
future improvement. build cycling infrastructure as well as
Initially the city accomodated three to organise awareness campaing
in order to promote cycling. This
36BARRIERS AND DRIVERS major driver for the current local go-
vernment of the city.
Cooperation/coordination
issues
Barrier: Due to the involvement of pri- Legal
vate operators, it can be challenging Barriers: The lack of a complete
to interact and coordinate with all in- and clear legislative framework for
volved stakeholders. the implementation and operation of
Drivers: The operators have shown bike-sharing.
willingness to cooperate and coordi-
nate with the local authorities building
a good framework for the future. Societal
Barriers: The innapropriate beha-
viour of groups of users who do not
Financial recourses issues respect the set rules, i.e. parking in
Drivers: The Bike-sharing operators private areas and pavements. Such
finance and operate this measure, behaviour can result into mobility ob-
which further created funding sour- struction of other citizens and more
ces for future infrastruture improve- specifically vulnerable groups such as
ment. disabled people.
Drivers: The citizens that use the
bike-sharing system express service
Process satisfaction since it provide low-cost
Barriers: Lack of national regulation mobility solutions with no additional
for bike-sharing can delay implemen- problems.
tation process.
Technical/Data Resources
Barriers: The existing legal framework
is lacking to specify regulations regar-
ding the management of data produ-
ced by bike-sharing systems.
Drivers: No resource allocation from
local authorities is needed. FURTHER
INFORMATION
http://www.comune.torino.
Staff it/trasporti/archivio-news/si-
Drivers: A related department wor- amplia-lofferta-per-chi-sceglie-
king under the municipality of Turin la-bici-per-muo.html
has been developed and has been https://drive.google.com/
working on bike-sharing mobility sin-
ce 2010.
Political
Barriers: The measure is still under
experimentation therefore it is not
possible to take stock on the political
view of bike-sharing.
Drivers: The environmental benefits
derived from such a measure are a
37Further Reading
1. Civitas.eu. (2019). CARAVEL | CIVITAS. [online] Available at: https://civitas.
eu/content/caravel [Accessed 28 Mar. 2019].
2. MAAS Global https://maas.global/
3. Whim Applications https://whimapp.com5
Innovative financing,
procurement,
partnership
This chapter provides some key points about:
• The available tools developed within SUITS project in order to
support LAs of S-M cities to deal with these issues.
• The available innovative financing mechanisms which could be
used for InnoTS measures implementation. A selection of the most
relative to InnoTS measures is made.
• The recommended steps for innovative procurement procedures
which respond to the current needs for implementing mobility
measures in general and could be applied to InnoTS measures as 39
well.
• The probable partnerships that might facilitate the implementation.You can also read