ECONOMIC OUTLOOK 2019 - Krungsri Research
←
→
Page content transcription
If your browser does not render page correctly, please read the page content below

ECONOMIC
 OUTLOOK
     2019

     Krungsri Research
Global: Growth and policy normalization
China
Growth continues to slow but public infrastructure
investment will cushion downside.
Consumption will ease led by weaker confidence and
credit demand, but tariff cuts will shore up growth.
Government will keep accommodative monetary policy
but further easing should be limited.
Europe
Growth stalls, albeit still at potential,
US as fiscal impulse spares mounting
Moderating after rapid growth as fiscal Japan
downside risk.
Slower growth after investment and
boosts fade and there are few signs Capacity constraints suggest economic
productivity growth is recovering. exports peak.
recovery is underway as demand
Tax hike in 2019 could lead to volatile
Room for labor market to strengthen remains strong.
given ample spare capacity; inflation spending and reduce real income, but
Sustainable consumption could
likely to be limited. impact would be smaller than in 2014.
support overall growth and mitigate
Tight labor market supports wage
Housing sector continues to drag GDP impact of slower global demand.
as higher interest rates bite into growth; larger pool of foreign workers
activity and home builders’ sentiment would ease severe labor shortage in
deteriorate. some sectors.
Krungsri Research 2
Global growth plateau as trade war takes toll and
prospects diverge among countries
                6.9%                                                   6.6%

                                                                                  6.2%

                                                                       4.7%
                4.7%                                                              4.7%     EM
                                                                       3.7%
                 3.7%                                                             3.7%
                                                                       2.9%

                2.4%                                                   2.0%       2.5%
                2.2%
                                                                                  1.9%
                1.7%                                                   1.0%
                                                                                  0.9%

                        2017                                           2018F   2019F

Source: IMF World Economic Outlook (October 2018), Krungsri Research

                                                                                         Krungsri Research   3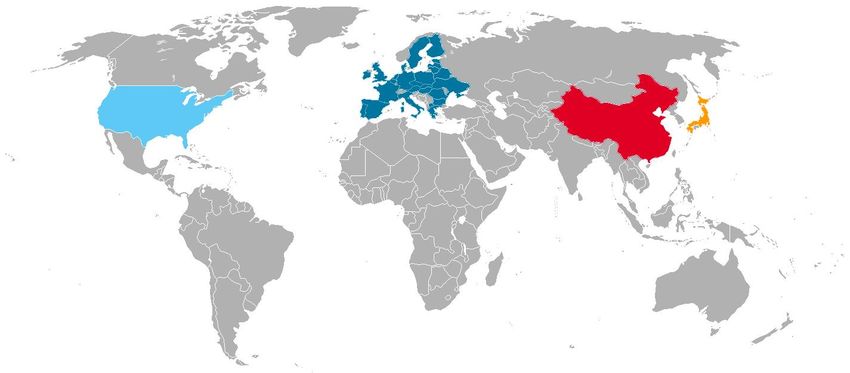
Cyclical tailwinds wane: Slower trade growth, unwinding
of monetary policy, tighter financial conditions
% YoY Export growth (3mma) % Policy interest rates
20 World
Gloomy 6.0
prospects
Fed Funds Rate Forecast
15 US 5.0
EU28 BOC Overnight Rate
10 4.0
Asia BOE Bank Rate
5 3.0
ECB Deposit Facility
0 2.0
-5 1.0
-10 0.0
-15 -1.0
Jul-14
Jul-15
Jul-16
Jul-17
Jul-18
Jan-14
Jan-15
Jan-16
Jan-17
Jan-18
Jan-07
Jan-08
Jan-09
Jan-10
Jan-11
Jan-12
Jan-13
Jan-14
Jan-15
Jan-16
Jan-17
Jan-18
Jan-19
Jan-20
Apr-14
Oct-14
Apr-15
Oct-15
Apr-16
Oct-16
Apr-17
Oct-17
Apr-18
Oct-18
DI New Export Orders Index Global Financial Conditions
64 3.0
US ISM Manufacturing Major economies
62 2.0 Asia ex-Japan Ease
60 China Official Manufacturing PMI
58 1.0
56 0.0
54
52 -1.0
50 -2.0
48
-3.0
46 Tight
44 -4.0
Jul-14
Jul-15
Jul-16
Jul-17
Jul-18
Jan-14
Jan-15
Jan-16
Jan-17
Jan-18
Apr-14
Oct-14
Apr-15
Oct-15
Apr-16
Oct-16
Apr-17
Oct-17
Apr-18
Oct-18
Jan-07
Jul-07
Jan-08
Jul-08
Jan-09
Jul-09
Jan-10
Jul-10
Jan-11
Jul-11
Jan-12
Jul-12
Jan-13
Jul-13
Jan-14
Jul-14
Jan-15
Jul-15
Jan-16
Jul-16
Jan-17
Jul-17
Jan-18
Jul-18
Jan-19
Source: World Trade Organization (WTO), Bloomberg, Krungsri Research
Krungsri Research 4
Fears of a new crisis driven by overleveraging are excessive
% of GDP Credit to all sectors: Advanced Economies % of GDP Credit to all sectors: Emerging Markets
300 Aggregate 200
Aggregate
250
Non-financial 150
corporations
200 Non-financial
corporations
150 Households 100
Private non-financial
sector
100 Households
50
50 Government
Government
0 0
1Q00
1Q01
1Q02
1Q03
1Q04
1Q05
1Q06
1Q07
1Q08
1Q09
1Q10
1Q11
1Q12
1Q13
1Q14
1Q15
1Q16
1Q17
1Q18
1Q02
1Q03
1Q04
1Q05
1Q06
1Q07
1Q08
1Q09
1Q10
1Q11
1Q12
1Q13
1Q14
1Q15
1Q16
1Q17
1Q18
Credit-to-GDP gap (actual): Credit from all sectors to private non-financial sector
% of GDP All 43 Reporting Countries* % of GDP Systemically Important Countries
15 GFC 30 GFC
Excessive 20 Excessive
10 credit credit
10
5 0
0 -10
-20
-5 US Euro area
-30
* Simple average Japan China
-10 -40
1Q00
1Q01
1Q02
1Q03
1Q04
1Q05
1Q06
1Q07
1Q08
1Q09
1Q10
1Q11
1Q12
1Q13
1Q14
1Q15
1Q16
1Q17
1Q18
1Q00
1Q01
1Q02
1Q03
1Q04
1Q05
1Q06
1Q07
1Q08
1Q09
1Q10
1Q11
1Q12
1Q13
1Q14
1Q15
1Q16
1Q17
1Q18
Note: The credit-to-GDP gap is defined as the difference between the credit-to-GDP ratio and its long-run trend, and captures the build-up of excessive credit in a reduced-form fashion. It has been found
to be a reliable early warning indicator of impending financial crises.
Source: Bank for International Settlements (BIS), Krungsri Research
Krungsri Research 5
US: Moderating after rapid growth as fiscal boosts fade
and there are few signs of recovery in productivity growth
% QoQ saar Real GDP growth Krungsri Research’s view
4.0 The US economy is projected to moderate next year and converge
Forecast
towards its long-term potential of 2%. The fiscal impulse, defined as a
3.0 change in structural fiscal balance, would be markedly smaller with
deficit at 0.5% of GDP in 2019 vs 1.1% in 2018. What’s more, with
cyclical tailwinds expected to dissipate next year (e.g. fading fiscal
2.0 boost, monetary tightening, and plateauing global growth), structural
factors should prevail as the countervailing effect. However, there are
1.0 few signs that Trump’s massive tax cut program has boosted the
Actual growth
economy’s supply side. Non-farm business productivity growth has
Potential growth rebounded modestly over the past few years to about 1%, much lower
0.0 than the 3% pre-crisis level. With business investment growth slowing
Mar-10
Mar-11
Mar-12
Mar-13
Mar-14
Mar-15
Mar-16
Mar-17
Mar-18
Mar-19
Mar-20
for three consecutive quarters, the modest cyclical recovery in
productivity growth could lose momentum.
Change in Structural Fiscal Balance % YoY Nonfarm Business Productivity
(% of GDP) 7.0
Forecast Quarterly growth 5-year moving average
6.0
1.9 2.1
1.4 5.0
0.6 4.0
Fiscal tightening 0.3 0.2 3.0
2.0
-0.1
-0.5 1.0
-0.9 Fiscal loosening -0.8
-1.1 0.0
Trump
-2.0 -2.1 -1.9 stimulus -1.0
Mar-95
Mar-96
Mar-97
Mar-98
Mar-99
Mar-00
Mar-01
Mar-02
Mar-03
Mar-04
Mar-05
Mar-06
Mar-07
Mar-08
Mar-09
Mar-10
Mar-11
Mar-12
Mar-13
Mar-14
Mar-15
Mar-16
Mar-17
Mar-18
2007
2008
2009
2010
2011
2012
2013
2014
2015
2016
2017
2018
2019
2020
Source: Bureau of Economic Analysis (BEA), Bureau of Labor Statistics (BLS), IMF World Economic Outlook Database, Bloomberg, Krungsri Research
Krungsri Research 6
A divided Congress sets the stage for legislative gridlock
Republicans Democrats Republicans Democrats
203 (-37) 234 (+37) 52 (+2) 47 (-2)
The black border indicated that
incumbent is dethroned
House Senate
Policies / Topics Krungsri Research’s View
Republicans would not be able to implement another tax cut in 2019 and Democrats cannot reverse the
Second round tax cut previous one. With less than 60 votes in Senate, it would require approval from both chambers, which is unlikely
to happen.
Status Quo
Spending will grow according to the deal made early in the year. Trump is willing to cut discretionary spending,
Spending but there may be objections from Democrats.
Since Republicans have lost control of legislative power, Trump must rely on moves which do not require a
Trade war escalates/ change in the law. Therefore, he will focus more on tariffs and sanctions. Meanwhile, we believe Congress
Sanction would ultimately approve the USMCA as Trump has threatened to scrap the old NAFTA, which forces Congress
into an all or nothing situation.
It is listed as the top issue voters want discussed after the mid-term election. However, it is likely to be stuck in a
Healthcare split Congress.
While both president Trump and Congress support the infrastructure program, the deal is unlikely to happen
Uncertainty
Infrastructure deal given disagreement over source of funding.
The next spending deadline is 7 December, 2018, but that will likely to be called off until the new Congress take
Government shutdown/ charge. So, the mixed congress increases risk of a government shutdown with uncertainty over the duration. To
Debt ceiling seal the deal, Republicans must accept Democrats’ demands, such as refrain from scrapping the child immigrant
program which was important during Trump’s election campaign.
Source: Capital Economics, The Guardian, Krungsri Research
Krungsri Research 7More room for labor market to strengthen given ample
spare capacity; inflation seems limited
Although unemployment rate has hit a 49-year low, there is still room for the labor market to strengthen because there is more spare capacity in the labor
market than implied by the headline unemployment rate. The broader prime-age employment to population ratio suggests labor market conditions have not
tightened as much as in the past decade. Labor participation rate remains low and there is no sign it will return to pre-crisis levels within the next few years.
The number of job seekers, albeit falling, is about one million more than levels prior to the financial crisis. As a result, wage growth has accelerated only
gradually in recent years and is close to 3%. With annual productivity growth now running at close to 1.5%, annual wage growth would need to exceed 3.5%
to push inflation further beyond the 2% target.
%, sa Unemployment Rate %, sa % YoY Wage growth
12 Unemployment rate (LHS) 74 4.0
Average Hourly Earnings
10 76 3.5
Prime-Age (25-54yrs) Employment Cost Index
Employment to Population 3.0
8 78
2.5
6 80
2.0
4 82 1.5
2 84 1.0
Mar-07
Mar-08
Mar-09
Mar-10
Mar-11
Mar-12
Mar-13
Mar-14
Mar-15
Mar-16
Mar-17
Mar-18
Jan-90
Jan-92
Jan-94
Jan-96
Jan-98
Jan-00
Jan-02
Jan-04
Jan-06
Jan-08
Jan-10
Jan-12
Jan-14
Jan-16
Jan-18
%, sa Labor Participation Million, sa % YoY PCE Inflation
68 Labor Participation Persons not in the labor 7.5 4.0
Rate (LHS) force who want a job (RHS) Headline PCE Core PCE
67 7.0
3.0
66 6.5 Fed target
65 6.0 2.0
64 5.5 1.0
63 5.0
0.0
62 4.5
61 4.0 -1.0
Jan-90
Jan-92
Jan-94
Jan-96
Jan-98
Jan-00
Jan-02
Jan-04
Jan-06
Jan-08
Jan-10
Jan-12
Jan-14
Jan-16
Jan-18
Jan-07
Jan-08
Jan-09
Jan-10
Jan-11
Jan-12
Jan-13
Jan-14
Jan-15
Jan-16
Jan-17
Jan-18
Source: BEA, BLS, Bloomberg, Krungsri Research
Krungsri Research 8Housing sector still drag GDP as higher interest rates bite
into activity and home builders' sentiment deteriorate
ppt Residential Investment % QoQ saar % 30-Year Fixed Mortgage Rate
1.5 30 7.0
1.0 20
6.0
0.5 10
0.0 0
5.0
-0.5 -10
CTG (LHS)
-1.0 -20 4.0
Growth
-1.5 -30
-2.0 -40 3.0
Jan-04
Jan-05
Jan-06
Jan-07
Jan-08
Jan-09
Jan-10
Jan-11
Jan-12
Jan-13
Jan-14
Jan-15
Jan-16
Jan-17
Jan-18
1Q00
1Q01
1Q02
1Q03
1Q04
1Q05
1Q06
1Q07
1Q08
1Q09
1Q10
1Q11
1Q12
1Q13
1Q14
1Q15
1Q16
1Q17
1Q18
‘000 Leading indicators for Housing Market Index
Krungsri Research’s View
2,500 Housing Starts 100
Building Permits Residential investment growth knocked 0.12ppt off GDP growth
2,000 80 during 1Q-3Q18 (on average). Mortgage rates have risen to
NAHB Home Builders (RHS)
their highest since 2011, which likely triggered the slowdown.
1,500 60 Recent tax changes, including reducing maximum mortgage
interest deduction, also contributed to the slowdown in house
1,000 40 prices and homebuilding activity.
500 20 Leading indicators also suggest downward trends should
continue into next year. Housing starts and building permits
0 0 have levelled off. Sentiment among home builders has
Jan-00
Jan-01
Jan-02
Jan-03
Jan-04
Jan-05
Jan-06
Jan-07
Jan-08
Jan-09
Jan-10
Jan-11
Jan-12
Jan-13
Jan-14
Jan-15
Jan-16
Jan-17
Jan-18
deteriorated recently.
Source: Mortgage Bankers Association (MBA), National Association of Home Builders (NAHB), Federal Reserve Bank of St. Louis, Bloomberg, Krungsri Research
Krungsri Research 9But there is slim chance of a housing bubble and
subsequent recession that could spark another crisis
There are several reasons why the housing slowdown is unlikely to spark another crisis. First, both existing and home sales had peaked in mid-2017 and are
in a downtrend, but the peaks are far from 2005 levels prior to the Great Financial Crisis, resulting in the more modest drop recently. Second, current level
of home inventory for sale is low by historical standards, offering reassurance that there is unlikely to be massive oversupply this time. Third, house prices
look much less overvalued than in the mid-2000s. Lastly, household debt is more sustainable with debt-to-GDP ratio still trending down.
Million Home Sales Million % YoY House Price Index
8.0 1.6 20
Existing Home Sales
7.0 1.4 15
New Home Sales (RHS)
6.0 1.2 10
5
5.0 1.0
0
4.0 0.8
-5
3.0 0.6 -10
2.0 0.4 S&P/Case-Shiller
-15
1.0 0.2 -20 FHFA
Jan-00
Jan-01
Jan-02
Jan-03
Jan-04
Jan-05
Jan-06
Jan-07
Jan-08
Jan-09
Jan-10
Jan-11
Jan-12
Jan-13
Jan-14
Jan-15
Jan-16
Jan-17
Jan-18
Jan-01
Jan-02
Jan-03
Jan-04
Jan-05
Jan-06
Jan-07
Jan-08
Jan-09
Jan-10
Jan-11
Jan-12
Jan-13
Jan-14
Jan-15
Jan-16
Jan-17
Jan-18
Million Home Inventory for Sale % of GDP Household debt
4.0 Condominium 100
1-Family Home
3.0 90
Aggregate
2.0 80
1.0 70
0.0 60
Mar-00
Mar-01
Mar-02
Mar-03
Mar-04
Mar-05
Mar-06
Mar-07
Mar-08
Mar-09
Mar-10
Mar-11
Mar-12
Mar-13
Mar-14
Mar-15
Mar-16
Mar-17
Mar-18
Jan-00
Jan-01
Jan-02
Jan-03
Jan-04
Jan-05
Jan-06
Jan-07
Jan-08
Jan-09
Jan-10
Jan-11
Jan-12
Jan-13
Jan-14
Jan-15
Jan-16
Jan-17
Jan-18
Source: MBA, BIS, Bloomberg, Krungsri Research
Krungsri Research 10FOMC is on track to raise rate in December, projecting
three rate hikes in 2019
% FOMC dots Krungsri Research’s view
4.00
The FOMC is universally anticipated to raise Fed funds rate target range
3.75 by 25bps to 2.25-2.50% next month. The Fed is projected to deliver
3.50 three rate hikes in 2019 and one in 2020.
Composition of FOMC will be more hawkish in 2019. First, Kansas City
3.25
Fed President Esther George, one of the central bank's most hawkish
3.00 members for a long time, is scheduled to be a voting member in 2019.
2.75 Second, Chicago Fed President Charles Evans, a long-time monetary
dove, has revealed his seldom-used hawk talons by suggesting the FOMC
2.50 might need to raise rates to “somewhat restrictive” levels to combat
2.25 anticipated inflation. Third, nominees to fill two Board seats, Marvin
2.00 Goodfriend, and Michelle Bowman, are awaiting confirmation votes
from Congress. They could add to an already-hawkish FOMC.
2018 2019 2020 2021 Longer run
June September June September
Median dots
2019
n.a.
Neutral
-2 -1 0 1 2
Dovish Neutral Hawkish
n.a. n.a.
2018
Source: Board of Governors of the Federal Reserve System, Bloomberg, Krungsri Research
Krungsri Research 11By 3Q19, Fed funds rate will exceed longer-run neutral
rate and broad financial conditions could tighten
% FOMC policy rates vs Neutral rate Krungsri Research’s view
4.5 The Fed funds rate is now approaching its longer-run neutral rate, and
Forecast
4.0 is projected to exceed that by 3Q19. Impact of the Fed’s balance-sheet
3.5 unwinding is under-appreciated, but will become more evident as the
FOMC dot longer run
3.0 pace of contraction accelerates, especially if the ECB also starts to raise
2.5 Neutral nominal rate (r*) rates later next year. By that stage, rising rates will start to take a more
2.0 severe toll on real activity and broad financial conditions could tighten,
Fed Funds Rate forcing the Fed to pause rate hikes in 4Q19.
1.5
1.0 10-year treasury yield likely hover at 3.0-3.5%. Given divergent growth
0.5 and policies, spreads between 10-year US bond yield and that in other
0.0 G7 economies should remain substantial. This would temp investors to
keep buying US Treasury bills and limit upside to US yields given that
Mar-12
Sep-12
Mar-13
Sep-13
Mar-14
Sep-14
Mar-15
Sep-15
Mar-16
Sep-16
Mar-17
Sep-17
Mar-18
Sep-18
Mar-19
Sep-19
Mar-20
Sep-20
the neutral rate is much lower than before and likely to stay low.
Note: Nominal rate (r*) = The HLW real rate inflated by the Dallas Fed’s trimmed-mean PCE inflation
Index % 10-year government bond yields %
US Financial Conditions
1.5 4.5 4.5
US Germany
Ease
4.0 4.0
1.0 France UK
3.5 3.5
0.5 3.0 3.0
2.5 2.5
0.0
2.0 2.0
-0.5 1.5 1.5
-1.0 1.0 1.0
0.5 0.5
Tight
-1.5 0.0 0.0
Mar-12
Sep-12
Mar-13
Sep-13
Mar-14
Sep-14
Mar-15
Sep-15
Mar-16
Sep-16
Mar-17
Sep-17
Mar-18
Sep-18
Mar-19
Sep-19
Mar-20
Sep-20
Jan-09
Jul-09
Jan-10
Jul-10
Jan-11
Jul-11
Jan-12
Jul-12
Jan-13
Jul-13
Jan-14
Jul-14
Jan-15
Jul-15
Jan-16
Jul-16
Jan-17
Jul-17
Jan-18
Jul-18
Source: The Federal Reserve, Kathryn Holston-Thomas Laubach-John C. Williams (“HLW” 2017), Federal Reserve Bank of Dallas, Bloomberg, Krungsri Research
Krungsri Research 12Europe: Growth stalls, albeit still at potential, as fiscal
impulse spares mounting downside risk
Eurozone GDP growth Change in Structural Fiscal Balance
3.0 (% of GDP)
% QoQ sa Bloomberg
consensus 2011-17 2018 2019 0.85
2.5 % YoY Fiscal tightening
2.0 0.54
0.47
1.5 0.30 0.31
1.5-1.6% 0.14
1.0 “potential growth” 0.02
0.5 -0.03
-0.18 -0.13
0.0 -0.33
-0.39
1Q14
2Q14
3Q14
4Q14
1Q15
2Q15
3Q15
4Q15
1Q16
2Q16
3Q16
4Q16
1Q17
2Q17
3Q17
4Q17
1Q18
2Q18
3Q18
4Q18
1Q19
2Q19
3Q19
4Q19
1Q20
Germany France Italy Spain
Krungsri Research’s View
GDP growth projection (% YoY)
Eurozone economy is projected to run at potential of 1.5-1.6%
2018 2019 2020 2.5 throughout 2019 as risks to growth remain broadly balanced. A
2.3 rotation from external to domestic demand is intact. Credit
2.1
1.9 1.9 conditions remain favorable and conducive to sustainable domestic
1.6 1.6 1.7 1.6 1.7 1.6 demand growth. Given high sensitivity to oil prices, the economy
1.6
should benefit from the recent drop in oil prices.
1.0 1.1
Fiscal consolidation since the sovereign debt crisis in 2011 is likely
to be completed in 2018 and reverse to fiscal easing next year. The
0.4 change in structural fiscal balance would lead core economies to
record a greater deficit. This leaves governments ample room to
manoeuvre not only because of improved fiscal positions, but the
Euro area Germany France Italy Spain
rise in populists and Eurosceptics are increasingly influencing the
policy agenda across Europe.
Source: Eurostat, IMF World Economic Outlook database, Bloomberg, Krungsri Research
Krungsri Research 13Capacity constraints suggest economic expansion is
underway as demand remains strong
Factors limiting activity in European Union
% of firms Labor % sa Demand
25 70
Manufacturing Manufacturing Stronger demand
20 60
Tighter capacity Services Services
15 50
10 40
5 30
0 20
Mar-03
Mar-04
Mar-05
Mar-06
Mar-07
Mar-08
Mar-09
Mar-10
Mar-11
Mar-12
Mar-13
Mar-14
Mar-15
Mar-16
Mar-17
Mar-18
Mar-03
Mar-04
Mar-05
Mar-06
Mar-07
Mar-08
Mar-09
Mar-10
Mar-11
Mar-12
Mar-13
Mar-14
Mar-15
Mar-16
Mar-17
Mar-18
% of firms Equipment
Krungsri Research’s View
20
Manufacturing The European Commission (EC) had conducted a survey asking
15
Tighter capacity Services firms which factors were holding back their activity. The share of
industrial firms citing inadequate equipment and lack of
personnel has surged to the highest since the survey started in
10 2003. The share of services firms citing lack of personnel has
moderated from the record high in 2Q18.
5
By contrast, the proportion citing weak demand has picked up
since 2Q18 but is still hovering at historical lows. Hence, the
0 short-term capacity constraints suggest economic expansion
Mar-03
Mar-04
Mar-05
Mar-06
Mar-07
Mar-08
Mar-09
Mar-10
Mar-11
Mar-12
Mar-13
Mar-14
Mar-15
Mar-16
Mar-17
Mar-18
should continue in the medium-term. Firms will invest to boost
capacity and there will be more jobs down the road.
Source: European Commission (EC), Krungsri Research
Krungsri Research 14With unemployment falling, firms are facing difficulty
filling open positions, keeping a lid on wage growth
% Euro area labor market conditions % % YoY Euro area wage growth % YoY
13 Unemployment rate Job vacancy (RHS) 2.2 4.0 Negotiated Wage Wage & Salary (RHS) 8.0
12 2.0 6.0
3.5
11 1.8 4.0
3.0
2.0
10 1.6
2.5 0.0
9 1.4
-2.0
2.0
8 1.2 -4.0
7 1.0 1.5
-6.0
6 0.8 1.0 -8.0
Mar-04
Mar-05
Mar-06
Mar-07
Mar-08
Mar-09
Mar-10
Mar-11
Mar-12
Mar-13
Mar-14
Mar-15
Mar-16
Mar-17
Mar-18
Mar-04
Mar-05
Mar-06
Mar-07
Mar-08
Mar-09
Mar-10
Mar-11
Mar-12
Mar-13
Mar-14
Mar-15
Mar-16
Mar-17
Mar-18
Krungsri Research’s View % YoY Wage & Salary % YoY
12 12
Unemployment rate is now 2-ppt lower than it was in 2010
and prime-age unemployment rate is at the lowest since 2011. 8 8
Job vacancy rate is at the highest since the survey began in
4 4
2004. Businesses will find it difficult to increase employment
and output substantially. This will keep a lid on wage growth 0 0
and would likely put upward pressure on inflation. Germany
-4 -4
Negotiated wage growth is accelerating, which would make France
wage growth more sustainable, unlike in 2015 when a pick-up -8 Italy -8
in wage was temporary as negotiated wage did not rise. Spain
-12 -12
Hence, faster wage growth will continue to support household
Mar-04
Mar-05
Mar-06
Mar-07
Mar-08
Mar-09
Mar-10
Mar-11
Mar-12
Mar-13
Mar-14
Mar-15
Mar-16
Mar-17
Mar-18
consumption in all core countries.
Source: Eurostat, European Central Bank (ECB), Bloomberg, Krungsri Research
Krungsri Research 15Sustainable consumption could hold up overall growth
and ease impact of slower global demand
1Q06 = 100 Household consumption (sa) EUR, bn Euro area consumption vs Wage growth % YoY
120 20 Consumption cycle 8.0
Germany France 15 Wage growth (RHS) 6.0
110 Italy Spain 10 4.0
5 2.0
100 0 0.0
-5 -2.0
90 -10 -4.0
-15 -6.0
80 -20 -8.0
1Q01
1Q02
1Q03
1Q04
1Q05
1Q06
1Q07
1Q08
1Q09
1Q10
1Q11
1Q12
1Q13
1Q14
1Q15
1Q16
1Q17
1Q18
1Q00
1Q01
1Q02
1Q03
1Q04
1Q05
1Q06
1Q07
1Q08
1Q09
1Q10
1Q11
1Q12
1Q13
1Q14
1Q15
1Q16
1Q17
1Q18
% of GDP Household debt Krungsri Research’s View
90 Since 2013, private consumption in all core countries have
80 been rising, with Spain showing the strongest expansion.
70 Private consumption in Germany and France is about 10%
60 higher 10 years after the start of the Great Recession. By
contrast, consumption in Italy has not recovered completely.
50
In contrast to the period before the crisis, steady consumption
40
growth has been coupled with a gradual decline in household
30 Germany France indebtedness, which has now stabilised at pre-crisis level.
20 Italy Spain Declining household indebtedness support a sustainable
10 expansion in private consumption. In addition, given the high
correlation, recent strong wage growth would continue to
1Q00
1Q01
1Q02
1Q03
1Q04
1Q05
1Q06
1Q07
1Q08
1Q09
1Q10
1Q11
1Q12
1Q13
1Q14
1Q15
1Q16
1Q17
1Q18
support rising consumption in Eurozone.
Source: Eurostat, BIS, Bloomberg, Krungsri Research
Krungsri Research 16Bank credit conditions remain supportive of ongoing
economic recovery
% Eurozone credit growth % of GDP Eurozone credit conditions DI
5.0 6 -30
4.0 Non-financial corporations 4 -20
3.0 Households 2 -10
0 0
2.0
-2 10
1.0 -4 Ease 20
0.0 -6 30
-1.0 -8 Private Credit Impulse (LHS) 40
-2.0 -10 Credit Standards - Business 50
-3.0 -12 Tight 60
Credit Standards - Household
-4.0 -14 70
Mar-04
Mar-05
Mar-06
Mar-07
Mar-08
Mar-09
Mar-10
Mar-11
Mar-12
Mar-13
Mar-14
Mar-15
Mar-16
Mar-17
Mar-18
Jan-10
Jul-10
Jan-11
Jul-11
Jan-12
Jul-12
Jan-13
Jul-13
Jan-14
Jul-14
Jan-15
Jul-15
Jan-16
Jul-16
Jan-17
Jul-17
Jan-18
Jul-18
% Eurozone’s cost of borrowing Krungsri Research’s View
6.0 Loans to the private sector (adjusted for loan sales and securitisation)
continued to rise. Loans to non-financial corporations grew at a new
5.0 cyclical high of 4.3% in September (vs 4.1% in August) while household
loan growth was unchanged from the previous month at 3.1%.
4.0 The composite cost-of-borrowing indicator – which combines interest
rates for all loans – for loans to non-financial corporations and
3.0 household mortgage remained at historical lows of 1.65% and 1.79%,
Non-financial corporations respectively.
2.0
ECB’s Bank Lending Survey suggests credit standards are less stringent
Households for house purchase
and banks are gradually keen to lend more. Credit impulse – the flow of
1.0
new credit issued by the private sector as a % of GDP – has climbed since
Jan-03
Jan-04
Jan-05
Jan-06
Jan-07
Jan-08
Jan-09
Jan-10
Jan-11
Jan-12
Jan-13
Jan-14
Jan-15
Jan-16
Jan-17
Jan-18
1Q18 to positive levels currently. These offer reassurance that the
transmission of the ECB’s monetary policy across the Eurozone is more
Source: ECB, Bloomberg, Krungsri Research effective and even.
Krungsri Research 17Latest stress test results affirm European banking sector is
more resilient
EBA stress test on European bank’s CET1 ratio
Impact on CET1 2020 Adverse scenario Basel II requirement
17.9
15.8 15.3 15.0
13.5 13.4 13.1 13.0 11.9
10.3 10.2 9.7 9.6 9.4 9.0 8.9
-2.9 -0.7 -4.8 -1.2 -2.9 -4.9 -5.4 -2.2 -4.0 -4.2 -5.8 -4.0 -3.7 -2.8 -4.1 -5.5
Belgium
Germany
Finland
Ireland
Sweden
Netherlands
Poland
Norway
Hungary
France
Italy
EU
Spain
Denmark
Austria
UK
Krungsri Research’s View
CET1 under adverse scenario
• All 48 banks which conducted the EU-wide stress test passed the ECB's
10 largest banks by assets (%) hypothetical "adverse scenario," with common tier ratios exceeding the 6%
Basel II requirement. Among Europe’s 10 biggest banks by assets, Barclays
10.7 10.7 10.2 had the lowest common equity Tier 1 ratio. Europe's biggest bank, Deutsche
9.2 9.2 8.6 Bank, fared better than expected, registering a core tier of 8.14%.
8.1 7.6
6.8 6.4 • Under the adverse scenario, the largest shock could lead to: (i) 2.7%
Basel II requirement at 6%
cumulative drop in GDP over 3 years; (ii) unemployment reaching 9.7% by
2020; (iii) 1.7% cumulative inflation over 3 years; and (iv) cumulative drop in
residential and commercial real estate prices over 3 years of 19.1% and 20%,
respectively.
• The scenario is hypothetical and not designed to capture every possible
Agricole
BPCE
Barclays
Santander
Deutsche
Lloyds
BNP
SocGen
HSBC
ING
Credit
confluence of events, e.g. spillover from Italy’s fiscal standoff and UK’s no-
Bank
deal Brexit. However, it does serve as an analytical tool to understand what
happens to banks’ balance sheets in an economic downturn, regardless of
the specific triggering shock.
Source: ECB, European Banking Authority (EBA), Krungsri Research
Krungsri Research 18ECB has several specific measures to prevent contagion
and mitigate financial risks
If Italy’s fiscal standoff has a significant impact on the Eurozone economy, the ECB has many tools to limit contagion risk, such as long-term loans,
unlimited cash (provided by each central bank), currency swap lines, and unlimited bond buying in troubled countries.
Eurozone’s monetary Potential actions Details of policy tools and remarks
policy tools
Long-term loans Possible The ECB may provide cheap long-term loans to troubled banks,
aimed at making banks use the cash to lend to the real
economy.
Unlimited cash Possible National central bank provide funds (with lighter collateral rules
but at higher cost) to banks facing a temporary squeeze, called
Emergency Liquidity Assistance (ELA)
Currency swaps Possible A set of agreement allowing the ECB to get currency from other
central banks to prevent commercial lenders from being unable
to meet foreign-exchange commitments
Outright Monetary Possible, Unlimited purchases of a country’s sovereign debt to depress
Transaction (OMT) with conditions bond yields
OMT comes with conditions (such as a program of structural
reforms)
Increase asset purchases Unlikely but could implement in If needed, there is room to extend asset purchase program.
case of serious effects The ECB recently announced a plan to slow asset purchase
program as scheduled in October and cap holdings at year-end.
Cutting interest rates Unlikely given the current The Governing Council expects to keep policy interest rates at
negative rates record lows “at least through the summer of 2019”.
Source: ECB, Bloomberg, Krungsri Research
Krungsri Research 19Political risks to remain elevated (I)
Germany
Angela Merkel has announced that she would not run for the position of German Chancellor or remain the leader of
CDU after her current term ends. This could trigger a shift in power in German politics, but with the next election in
2021, there is ample time for adjustment.
As reflected by the results of the Bavarian state election, AfD – a far right party – is steadily rising to power, while the
coalition government comprising CDU, CSU and SPD suffered huge losses. The electoral result is regarded as a sign of
Stable Unstable
rising discontent with the coalition government, particularly in how they handled the immigration issue.
France
Despite substantial progress in reforms – in particular taxes and labor market – which have improved France’s fiscal
position, Macron’s approval rating is falling due to rising discontent from workers resisting the reforms and the
aftermath of cabinet reshuffling which resulted in the resignation of popular ministers. His party ideology, “neither left
or right” has proven to create some challenges in pleasing both left- and right-wing voters and often perceived as
failing to fulfill his electoral promises. Nonetheless, with his party having majority in the National Assembly, Macron is
in a good position and would continue to implement his reform plan, with a focus on welfare reform and overhauling
the pension system in 2019. Nothing drastic, such as a snap election, will happen.
His pro-EU views and close relationship with Germany’s Chancellor Angela Merkel have helped to maintain his public
image and increase his presence on the global stage.
UK
With less than 4 months before Brexit, May finally proposes withdrawal agreement. The bulk of this new draft is similar
to the previous proposal (Chequers deal). To ensure the backstop plan would not be triggered, they have proposed
that the 21-month transition period be extended. The backstop would require the UK to remain within a custom union
with the EU and Northern Ireland would stay aligned with the EU rules to avoid a hard border scenario.
It will be a struggle to pass the deal in Parliament. Currently, May is facing mounting pressure from all sides. Without
majority votes, May has to rely on DUP – an Irish party opposing to any Irish sea border – for a slim majority. The
diversion within the Conservative party itself is also prominent. So far, 7 of May’s ministers have resigned. The hard
Brexiteers – lead by Boris Johnson, are dissatisfied with May’s proposal which favor a Canadian-style deal, and have
threatened to vote against the deal. This contribute to the rising possibility of May getting ousted by her own party.
Despite over 700,000 people taking to the street in London to ask for a second referendum, it is unlikely to happen
since the Conservative and Labor parties both favor a general election over another referendum.
Source: Politico, FT, Economists, Foreign Affairs, BBC, Centre for Sociological Research, Krungsri Research
Krungsri Research 20Political risks to remain elevated (II)
Italy
The coalition government comprising the anti-establishment M5Star and right wing Lega is volatile. With different
priorities and ideologies, there are many scenarios which could create a rift between the two parties, such as the 2019
European election in which the two parties are likely to run separately. The rising popularity of Lega as support for
M5Star wane could also worsen tension between them. This has created an incentive for Lega to capitalize on it
popularity, so it is possible that the Italian government would not last a full term.
The government is likely to fulfill its electoral promises such as universal income and flat tax rate, but at smaller
magnitudes.
Given the coalition government’s strong Eurosceptic stance, Italy and EU commissioners could continue to clash in
several topics especially immigration and Italy’s fiscal budget.
As Italy insists on sticking with its budget, the European Commission might launch the Excessive Deficit Procedure (EDP)
which could lead to financial penalties for breaching EU spending rules (exceeding 60% debt-to-GDP ratio) and minimal
efforts to reduce it (Italy has 131% debt-to-GDP ratio). There is speculation the EU would initiate the EDP process by
mid-December.
There is high risk that Italy’s bond yield would surge again if the bonds are downgraded or the EC initiates the EDP.
Spain
After ousting Mariano Rajoy, Pedro Sánchez from PSOE party has been named to replace him as Spain’s next prime
minister. Given that PSOE has only 84 of 350 seats in the parliament, they are facing an uphill battle and need votes
from other parties to pass legislations. However, the recent poll shows PSOE’s popularity is ahead of other parties,
which is a significant improvement compared to the “no confidence” vote where PSOE was ranked third. The local
elections in Spain will kick-off in December with Andalusia; that would be a good gauge of public sentiment.
Sánchez has said he preferred to stay for the whole term, which implies the next national election would be in mid-
2020. The issue that could trigger a snap election is the national budget which needs to be ratified by both the Congress
and Senate, neither in which Sánchez has majority. In the budget is blocked, Sánchez might call for an election since his
party’s popularity is ahead of others’.
Catalan separatists situation has cooled down after Sánchez proposed a new statute to allow greater autonomy for
Catalan. However, if this referendum is approved, it might put Sánchez out of favor with PP and Ciudadanos, both of
which oppose to greater powers for Catalan and its president Quim Torra. Moreover, it could trigger revolts in other
parts of Spain.
The emergence and rapidly-rising popularity of a new far-right party, VOX, signals a rise of populists. However, at this
point, the party is projected to gain 1.3% of votes which would translate into 1 or more seat in parliament. The party
appeals mostly to the right wing middle-class and could struggle to get support from other groups.
Source: Politico, FT, Economists, Foreign Affairs, BBC, Krungsri Research
Krungsri Research 21Brexit: Internal conflict in UK parliament
Recently, the biggest hurdle in the Brexit process seems to be internal conflict, especially within the Conservative party, which has
escalated rapidly. Teresa May’s position as party leader is often questioned.
Party Conservative Party Democratic Unionist Party Labor Other parties
Number of seats 316 10 258 66
Stance on Brexit • May’s stance has softened Their main reservation is • Labour is set to vote against any Brexit deal that • Most of the
since announcing the on the Irish border resembles the Chequers deal, claiming that it these parties
Chequers plan. corundum. They insist on failed to pass their party’s “Six tests”, and favor remaining
• It is estimated 20-100 same treatment for would support a second Brexit referendum. in the EU, so they
hardline Brexiteer MPs Northern Ireland and UK • News reports claim some Labour rebels (about are likely to vote
may vote against i.e. they are against the 12) would vote for the deal because some deal against May's
Chequers plan. backstop plan. is better than no deal. proposals.
Coalition Government with
the total of 326 seats
Number of vote needed Current situation
UK House of Commons Pass Brexit deal
10 Majority of Ideally, if the Government Coalition
320 votes in parliament (Total sticks together, the deal proposed by
66 of 639 eligible voters) May is likely to be passed since they have
48 MPs is needed
to trigger 326 votes
159 leadership
contest Oust May from her position
316
258 To trigger leadership contest, According to Reuters, 46 MPs have
157
48 votes (15% of submitted letters to signal the “no
Conservative MPs) confidence vote”. The leader contest
process usually takes about 3 months,
New Conservative party which implies it would significantly delay
Labour Others leader needs support from the Brexit timeline. David Davis, the
Democratic Unionist Party Conservative Party majority of Conservative MPs; former Brexit secretary, is the most likely
159 votes candidate for interim leader.
Source: Goldman Sachs Investment Research, Krungsri Research
Krungsri Research 22China: Growth continues to slow but public infrastructure
investment should cushion downside
We expect consumption and investment to slow down gradually next year. Net exports could still drag GDP. Exports could weaken because of trade
tensions and moderate global demand, but imports will rise, boosted by tariff cuts and public investment. Government has shifted its stance towards
cushioning the slowdown. The key measures are to step up “proactive fiscal policy” to revive infrastructure spending and release tax cut packages. Fixed
asset investment, which has been dragged by slow infrastructure investment in most of 2018, should kick-in soon and continue throughout next year. We
have seen infrastructure investment pick up recently and a jump in local government bond issuances in preparation to fund projects. There may be a move
to cut corporate income tax (CIT) as the politburo aims to reduce corporate burden and China’s CIT is much than the world average and in most developed
countries. The tax cut will enhance competitiveness and boost profits, which would in turn improve the ability to repay debt or to invest.
Component of GDP growth % YoY Fixed asset investment
% YoY 18
Consumption Investment Net Export 16
Total
6 Manufacturing
14 Real Estate
4 5.0 12 Construction
10 Infrastructure
2 8
2.1
6
0
4
-2 -0.6 2
May-18
Jan-18
Mar-18
Jun-18
Jul-18
Aug-18
Feb-18
Sep-18
Oct-18
Apr-18
Mar-15
Jun-15
Sep-15
Dec-15
Mar-16
Jun-16
Sep-16
Dec-16
Mar-17
Jun-17
Mar-18
Jun-18
Jun-19
Sep-17
Dec-17
Sep-18
Dec-18
Mar-19
Sep-19
Dec-19
% Corporate tax (% of commercial profit) CNY ,bn Local government outstanding
70
China Euro area 50
OECD members United States
60 World East Asia & Pacific 40
30
50
20
40 10
30 0
Mar-17
May-17
May-18
Jan-17
Jul-17
Sep-17
Nov-17
Mar-18
Jan-18
Jul-18
Sep-18
2005
2006
2007
2008
2009
2010
2011
2012
2013
2014
2015
2016
2017
Source: People's Bank of China (PBOC), National Bureau of Statistics (NBS), World bank, CEIC, Bloomberg, Krungsri Research
Krungsri Research 23Consumption will ease led by falling confidence and
slowing credit demand but tariff cut will shore up growth
Consumption is expected to soften along with falling consumer confidence index and consumption loans. Despite that, disposable income has
continued to grow steadily, especially wage. The government is likely to step up measures to restore consumer confidence by (1) securing
employment and wages through the promotion of SME businesses by encouraging banks to give loans to them and offering tax benefits; (2) expand
the announced import and income tax cut policies; and (3) perhaps encourage consumer borrowing as household debt-to-GDP is low compared to
other countries.
Household indicators List of imported goods eligible for tariff cuts
%YoY, 3mma Index
Consumer Loan Product type Before tariff cut After tariff cut
40 Short-term loan 125
Effective: 1 July 2018
Medium & Long-term loan
Consumer confidence (RHS) 120 Cars 25% 15.0%
Car parts 6-25% 6.0%
30 Apparel 15.9% 7.1%
115 15.9%
Sport gears 7.1%
Home appliances 20.5% 8.0%
110 Seafood and mineral water 15.2% 6.9%
20
Cosmetic and health product 8.4% 2.9%
105 Effective: 1 Nov 2018
Machinery and electrical 12.2% 8.8%
10 100 Textile & Construction material 11.5% 8.4%
Jan-14 Sep-14 May-15 Jan-16 Sep-16 May-17 Jan-18 Sep-18 Paper product 6.6% 5.4%
% YoY Disposable income Household debt as of 1Q18 Consumer’s NPL ratio
%
12 (% GDP)
95 2.5 Auto-mobile
86
10 8.8 77 2.0
8 68 67
Transfer 58 57 Average 1.5
6 Property Credit card
49
Business
4 1.0 Total loan
2 Wage 17 0.5
11
Mortgage
0 0.0
1Q14 3Q14 1Q15 3Q15 1Q16 3Q16 1Q17 3Q17 1Q18 3Q18
2010
2011
2012
2013
2014
2015
2016
2017
KR UK US TH MY EU JP CN ID IN
Source: PBOC, NBS, BIS, CEIC, Bloomberg, Krungsri Research
Krungsri Research 24Government will keep accommodative monetary policy
but further easing would be limited
Monetary policy has been loosened to enable governments to issue more bonds while preventing interest rates from rising. Higher interest rates
will hurt SMEs, making it harder to tap funds and increase indebted as cost of refinancing would be higher. With inflation expected to be well
under the government’s target of 3% for next year due to softer domestic and external demand, there is room for the PBOC to ease monetary
policy further. However, the concern would be avoiding a sharp depreciation of the yuan which could trigger capital flight, like in 2015-2016. For
this reason, China is expected to ease monetary policy gradually, possibly by cutting reserve requirement ratio as it will smoothen the banking
mechanism and prepare to open up the financial sector, to reduce barriers to doing business in this sector.
% 1-month interest rates CNY, trn Capital flow 12-month rolling sum
6.0 0.5
Repo (30 days ma) SHIBOR
5.0 0.0
4.0 -0.5
3.0 -1.0
period of outflow
2.0 -1.5
Jan-15
Jul-15
Jan-16
Jul-16
Jan-17
Jul-17
Jan-18
Jul-18
Apr-15
Oct-15
Apr-16
Oct-16
Apr-17
Oct-17
Apr-18
Oct-18
Jan-14
Jul-14
Jan-15
Jul-15
Jan-16
Jul-16
Jan-17
Jul-17
Jan-18
Jul-18
Apr-14
Oct-14
Apr-15
Oct-15
Apr-16
Oct-16
Apr-17
Oct-17
Apr-18
Oct-18
CNY, bn Local government & Corporate bond issuance CNY, bn
3mma 3mma
USDCNY Onshore CNY
1,000 Local government bond 250 7.0
Weaker
Corporate bond
200 6.8
750
150 6.6
500
100 6.4
250 50 6.2
0 0 6.0
Jan-15
Jul-15
Oct-15
Jan-16
Jul-16
Oct-16
Jan-17
Jul-17
Oct-17
Jan-18
Jul-18
Oct-18
Apr-15
Apr-16
Apr-17
Apr-18
Jan-14
Jul-14
Jan-15
Jul-15
Jan-16
Jul-16
Jan-17
Jul-17
Jan-18
Jul-18
Apr-14
Oct-14
Apr-15
Oct-15
Apr-16
Oct-16
Apr-17
Oct-17
Apr-18
Oct-18
Source: PBOC, CEIC, Nikkei Asian Review, Bloomberg, Krungsri Research
Krungsri Research 25Structural deleveraging continues as China aims to
address high debt level
While introducing supportive policies, China must be careful not to trigger financial instability. Although total social financing has slowed
considerably and shadow banking component is shrinking, the debt-to-GDP ratio remains high, especially corporate loans to SOE in coal, steel and
mining. Bond defaults have been accelerating every month. Therefore, officials must tackle this problem before it sends investor sentiment
downhill. We expect the government to push more debt-to-equity swap programs because it had been successful in the 1990s. The riskiest SOE
industry, the one with excess capacity, could be the first target. The looser monetary policy has reduced funding cost and improved business
profits, and so we expect this program to reduce debt ratio efficiently.
% YoY Financing activity % Debt-to-asset ratio
Loans to Non-Financial Corporations 64
30 SOEs
Loans to Households
62
Shadow Banking Private firms
20
60
10 58
0 56
54
-10
52
Mar-15
Jun-15
Sep-15
Dec-15
Mar-16
Jun-16
Mar-18
Jun-18
Sep-16
Dec-16
Mar-17
Jun-17
Sep-17
Dec-17
Sep-18
1999 2001 2003 2005 2007 2009 2011 2013 2015 2017
CNY, bn Bond default (flow) Leverage ratios and profitability Computer,
14 As of 80 Coal Mining Ferrous Metal Non Ferrous Automobile Communication
26 sept Smelting & Metal Smelting Manufacturing & Other
Debt-to-asset ratios (%)
12 70 Pressing & Pressing Electronics
10 60
Median
8 50 Ferrous Metal Electricity, Heat
6 Mining Non Ferrous Production &
40 Metal Mining
Supply
4
Petroleum & Medical &
2 30 Natural Gas Pharmaceutical
Acquisition Product
0 20 Median
Jan-18 Feb-18 Mar-18 Apr-18 May-18 Jun-18 Jul-18 Aug-18 Sep-18 -75 -50 -25 0 25 50 75 100 125 150 175
5-year average growth of profit(%)
Source: NBS, PBOC, Reuters, CEIC, Bloomberg, Krungsri Research
Krungsri Research 26Property market is expected to slow down further due to
tighter property policies and financial challenges
Property market is set to slow for the following reasons. First, policies to rein in demand for property, such as home purchase restrictions and credit
control, continue to weight on property sales and prices in top-tier cities. Second, reduced support from shantytown redevelopment could curb housing
price increases in tier 2 and 3 cities. Third, real estate developers will face greater financial challenge, including large bond maturities and potential
restrictions in home pre-sales, which are major funding channel for them. Fourth, accelerating trade tensions and economic uncertainty would create
investor and consumer concerns and affect property activities. The slower property sector could also reduce household wealth and government revenues.
% YoY Housing prices and property sales % YoY, 3mma Amount of bonds due for property developers
40 Tier 1 Tier 2 Tier 3 Property sale (RHS) 60 (RMB, bn)
20
30
40 15
20
20 10
10
0 5
0
0
-10 -20
1Q18 2Q18 3Q18 4Q18 1Q19 2Q19 3Q19 4Q19
Jan-13 Oct-13 Jul-14 Apr-15 Jan-16 Oct-16 Jul-17 Apr-18
Total compensation in Shantytown
redevelopment (% GDP) Asset allocation of Local government
household in 2013 revenue in 2016
2.2
2
1.7 1.7 Others, 3%
1.4 Land sales , 18%
Stock, 5% Transfer , 24%
Cash, 6% Property,
66% Property/land
tax, 12%
Deposit,
19% General fiscal Bonds funds
2015 2016 2017 2018 2019
revenue, 35% revenue, 11%
Housing subsidy program by direct providing with newly-built house and providing cash to
buy existing house despite 80% of which was used to pay down debt or buy goods and asset
Pledged Supplementary Lending program mainly led by PBOC to provide cash compensation
to residents especially whose homes are demolished
Source: China Household Finance Survey ,BBVA (Mar 2018), Reuters, Bloomberg, Krungsri Research
Krungsri Research 27Hard landing in property market that would trigger
economic crisis is unlikely to happen
The property market will see a soft landing for 3 reasons. First, housing inventory has dropped since 2014. Second, policy-makers have experiences in
curbing price spikes in tier 1 cities while balancing the effect on the economy. Third, consumer purchasing power is falling at a moderate rate because
property income is a small share of consumer income. The government also has capacity to limit land supply to avoid a large drop in land prices and
revenue. However, the sector is unlikely to trigger an economic crisis (worst case) because speculation in the sector is mostly limited to high-income
households (10% of total households); data show 39.7% of households in this group own vacant houses compared to under 20% for the lower income
group. Moreover, previous experiences show property prices would have to drop by over 30% to trigger a crisis, and that is unlikely to happen next year.
Inventory index* Proportion of ownership of vacant houses
320 among households in different income group
Lower inventory As of 2013, latest survey 39.7
240
27.3
21.6
160 18.2 17.0
80
Jan-13 Nov-13 Sep-14 Jul-15 May-16 Mar-17 Jan-18 25% 25%-50% 50-75% 75-90% 90-100%
Lowest income Highest income
Land supply and price of 106 cities % YoY, 3mma Reduction in GDP growth rate due to effect of
100ha, 3mma %
1,200 supply 9 property price falling
15
price (RHS)
1,000 7 10
Recession
5
800 5
0
600 3 price 15% 20% 25% 30% 35% 40% 45% 50%
1Q13 4Q13 3Q14 2Q15 1Q16 4Q16 3Q17 2Q18 fall
by 10%
Note: *Due to limited data, inventory index calculated from weighted average of inventory data of Beijing, Chongqing, Guangzhou, Shanghai, Shenzhen, Fuzhou, Hangzhou, Nanchang, Nanjing and Suzhou
Source: Bryane Michael and Simon Zhao (May 2016), China Household Finance Survey, Bloomberg, Krungsri Research
Krungsri Research 28Japan: Slower growth after investment and exports peak;
Abe taking lead in liberalizing trade
Investment would moderate in 2019 after strong growth Export growth is expected to slow along with global trade. In the
across countries in previous year. long-term, Abe would play a key role in liberalizing trade.
Capex plan (Tankan survey) EU-Japan EPA: In 2035, Japan will have eliminated 97% of tariff lines on
EU goods and the EU 99% of tariff lines on Japanese goods. Recently, Japan’s
Manufacturing Non-manufacturing cabinet approved a legislation to enforce the pact effective Feb 1.
17 6 Impact of EU-Japan EPA in 2035
14 3 33.9 EU Japan
29.1
11 22.2 0.6 23.5
0 13.5 13.2
8 0.1
-3
5
2 -6 Trade
2015 2016 GDP Trade GDP
-1 -9 2017 2018 (trn euro) (trn euro) (% GDP) (% bilateral
exports)
Mar Jun Sep Dec Mar Jun Sep Dec
Top five export to gain from EU-Japan EPA
EU Japan
From BOJ assessment, investments related to 2020 Olympics 6 250 10 100
have peaked in 2018. EUR, bn 200 8 EUR, bn 80
4 % bilateral export (RHS) % bilateral export (RHS)
150 6 60
Olympic-related projects and estimated impact 100 4 40
2
JPY trn 50 2 20
Redevelopment 5 est. investment 0.8 0 0 0 0
• Rebuild department % to 2015 nGDP (RHS)
Machinery,
Vehicles
Product
Chemicals
Minerals,
Processed
Dairy
Vehicles
Chemicals
Apparel
Equipment
Textile,
store and train station 4
Motor
Metal
Motor
4.8 0.6
glass
Food
• Waterfront casino
3
0.4
Transportation 2
2.0 • Build Three Loop Roads 0.2 TPP: Japan took the lead in pushing for the deal to be effective Dec 30
1
0.8 Private hotels under a new name, Comprehensive and Progressive Agreement for Trans-
0.4 Stadium and facilities 0 0.0 Pacific Partnership (CPTPP). There are plans to invite new members early
2016 2017 2018 2019 2020 next year.
Source: Bank of Japan (BOJ), European Commission’s Directorate-General for Trade (June 2018), Asian Nikkei Review, Bloomberg, Krungsri Research
Krungsri Research 29Tax hike in 2019 could lead to volatile spending and
reduce real income, but have smaller impact than in 2014
Consumption tax will be raised from 8% to 10% in Oct'19, which could affect consumption through 2 channels: (1) front-loading and payback of
consumption; (2) income effect. In the first channel, demand for goods, especially durables and semi-durables, will surge before the tax hike and
fall after that. Current consumption cycle reflects room for consumption to expand; it is now close to 2014 level, so it will be volatile in 2019. In the
second channel, higher prices after the tax hike could reduce real income, and hence, spending. However, the income effect is expected to be
limited in 2019 compared to 2014, due to smaller magnitude of tax hike in 2019 (from 5% to 8% in 2014) and more measures to cushion the
effects such as keeping tax at 8% for food which forms 16% of the consumption basket.
Spending cycle for durable and semi-durable goods Household Consumption (% YoY)
% of trend
10 Durables
3.0
Consumption tax hike 2014 Consumption tax hike 2014
8 Semi-durables 2.0
6 Non-durables 1.42
1.0 0.42
4
2 0.0
0 -1.0
-2
-4 -2.0
-6 -3.0
1Q10
3Q10
1Q11
3Q11
1Q12
3Q12
1Q13
3Q13
1Q14
3Q14
1Q15
3Q15
1Q16
3Q16
1Q17
3Q17
1Q18
1Q10
3Q10
1Q11
3Q11
1Q12
3Q12
1Q13
3Q13
1Q14
3Q14
1Q15
3Q15
1Q16
3Q16
1Q17
3Q17
1Q18
Burden of consumption tax hike calculated by BOJ
(Change from previous fiscal year, trillion yen)
Proposed tax reductions and
FY2014 FY2019 Burden increase refund measures
8.2 8 Burden decease
Permanent policies Net burdens 1) Keeping tax rate at 8% for food &
5.6 beverage, except at eateries and
-1 alcohol.
-0.5 -1.4 2) Scrap 3% tax on vehicle purchases
-0.6 0.2 2.2 when consumption tax rises, and
replace that with 0%-to-3% tax based
on the vehicle's fuel efficiency.
Consumption Total Consumption Reduced Welfare Free edu- pension tax Total 3) Expand tax deduction for home
tax hike burden tax hike tax benefits cation benefits reforms burden loans or extend it beyond Dec 2021.
Source: BOJ, Cabinet office, Bloomberg, Krungsri Research
Krungsri Research 30Tight labor market supports wage growth; more foreign
workers will ease severe labor shortage in some sectors
A tight labor market, reflected by the highest job-to-applicants ratio, continues to support wage increases and consumption. For sectors facing
severe labor shortage, the cabinet has approved a legislation to bring in more skilled and unskilled foreign workers (for the first time) to reduce
the cost burden on manufacturers, especially SMEs. That is expected to be implemented next April. Despite a strong increase in the number of
foreign workers recently, there is room to recruit more as the share of foreign workers to total workers is small at below 5%. Some 40,000
workers are expected in the first year and that would rise to 250,000 after five years.
Employment condition and foreign workers
Unemployment rate and Job to applicants ratio Foreign workers growth (% YoY) in 2017
%, sa ratio 10 15 20 25 30 35
3.0 1.70 -20
Unemployment rate (LHS) Manufacturing, 3.64 Industry, width of bubble
2.8 1.65 -25
Trade, 1.54
Employment Diffusion index*
1.60 -30 Information Higher
2.6 foreign worker
1.55 communication, 2.25
2.4 -35 growth
Jobs to Applicants Ratio 1.50 All industries,
2.2 -40
1.45 1.94 Services , 4.38
2.0 1.40 -45
Nov-17
May-17
Jul-17
Sep-17
May-18
Jul-18
Sep-18
Mar-17
Mar-18
Jan-17
Jan-18
-50
Construction,
-55 Higher 1.09
insufficient Accomodations, 4.08
Wage (%YoY) -60 employment
1.5 30 -65
Width of bubble reflects % share of foreign workers to total workers in each sectors
1.0 Scheduled Cash Earnings (LHS) 20
2 new residence statuses
0.5 10
• Type 1: foreign workers with certain skills or experience in 14 industries,
0.0 0 including agriculture, fishery, restaurant and accommodation. They can stay
Special Cash Earnings in Japan for up to 5 years total and cannot be accompanied by family
-0.5 -10 members
• Type 2: Highly skilled foreign workers in five industries, including
Nov-17
May-17
May-18
Jul-17
Sep-17
Jul-18
Sep-18
Jan-17
Mar-17
Jan-18
Mar-18
construction and automobile maintenance. This allows holders to renew
their visa and bring their spouses and children to Japan.
Note: Diffusion index of "Excessive employment" minus "Insufficient employment," % points from Tankan surveys
Source: Cabinet office, Statistical Bureau, Nikkei Asian Review, The Mainichi Shimbun, The Japan Times, Bloomberg, Krungsri Research
Krungsri Research 31BOJ implicitly tightens policy, but formal normalization is
possible after Mar 2020
Highlights from Financial System Report (FSR) on October 22
GDP growth % Core CPI
% The BOJ introduced GDP-at-risk approach to evaluate potential effects of ultra-
1.8 Apr-18 2.0
low-interest rate policy on the financial system. There are two key points.
1.6 Jul-18 1.8
Oct-18 (1) Over the next year, financial conditions would support the economy and
1.4 1.6 suppress downside risks by supporting private spending.
1.2 1.4 (2) In the following three years, there is increasing downside tail risk resulting
from larger pressure after balance sheet adjustments.
1.0 1.2
Financial institutions (FIs) are generally resilient in both capital and liquidity
0.8 1.0 during tail events such as the Global Financial Crisis. However, in a stress event,
0.6 0.8 BOJ pointed out that downward pressure would be more intense than before,
2018 2019 2020 2018 2019 2020 especially for FIs that engage in risky activities such as lending to middle-risk
firms and real estate sector, and securities investment.
DI Degree of bond market functioning Also, BOJ emphasized on heterogeneity in profitability among FIs in anticipation
0 of stronger competition given an ageing population and low interest rates.
Higher degree of
-20 market functioning Krungsri Research’s view
We still expect the BOJ to maintain short and 10-year bond yields at -0.1 and
-40 0%, respectively, until March 2020, premised on low inflation. This is partly
reflected by downward revision to its inflation forecasts at the last few
-60 meetings, and uncertainty over a consumption tax hike in 2019.
Feb-15 Aug-15 Feb-16 Aug-16 Feb-17 Aug-17 Feb-18 Aug-18 However, the BOJ has become more cautious to side-effects of the financial
JGB bond purchase by BOJ %
system, according to FSR and its communication. The BOJ views that JGB
% YoY
market liquidity and function remain low, even after the central bank allows 10-
90 Share Growth (LHS) 50
year bond yields to move a wider range.
80 40
Therefore, we expect the BOJ to continue to tighten its policy by reducing total
70 30 bond purchases despite its Y80trn guidance, and allowing slightly wider 10-year
60 20 bond yield as it is able to bring yield to target level with smaller purchases and
50 10 support market function.
40 0 After March 2020 , the BOJ might formally tighten monetary policy to avoid
1Q15 3Q15 1Q16 3Q16 1Q17 3Q17 1Q18 cumulative effect from QE and build policy space to support growth in the next
Source: BOJ, Nikkei Asian Review, Bloomberg, Krungsri Research
recession.
Krungsri Research 32You can also read