Electric Vehicle Boom: ICE-ing The Combustion Engine
←
→
Page content transcription
If your browser does not render page correctly, please read the page content below
EQUITY RESEARCH | September 6, 2017

Electric Vehicle Boom: ICE-ing The
Combustion Engine
What if EV adoption shifts to hyper mode?
Although the internal combustion engine (ICE) is entering its twilight years, we think the decline could be stead-
ier and shallower in the near term relative to consensus, with electric vehicles (EVs) accounting for just 8% of
global auto sales by 2030. That’s below industry expectations of 10%-20%. Further out, we’re more bullish. We
see 2025-2030 as the inflection point and expect EVs will make up 32% of global auto sales by 2040. Swing fac-
tors that could shift the baseline into “hyper-adoption” mode include increased government incentives (still a
wildcard) and lower battery costs (where a number of hurdles remain).

Kota Yuzawa                     Stefan Burgstaller            Yipeng Yang                   David Tamberrino, CFA
+81(3)6437-9863                 +44(20)7552-5784              +86(10)6627-3189              (212) 357-7617
kota.yuzawa@gs.com              stefan.burgstaller@gs.com     yipeng.yang@ghsl.cn           david.tamberrino@gs.com
Goldman Sachs Japan Co., Ltd.   Goldman Sachs International   Beijing Gao Hua               Goldman Sachs & Co. LLC
                                                              Securities Company Limited

Goldman Sachs does and seeks to do business with companies covered in its research reports. As a
result, investors should be aware that the firm may have a conflict of interest that could affect the
objectivity of this report. Investors should consider this report as only a single factor in making their
investment decision. For Reg AC certification and other important disclosures, see the Disclosure
Appendix, or go to www.gs.com/research/hedge.html. Analysts employed by non-US affiliates are not
registered/qualified as research analysts with FINRA in the U.S.

                                                                                 The Goldman Sachs Group, Inc.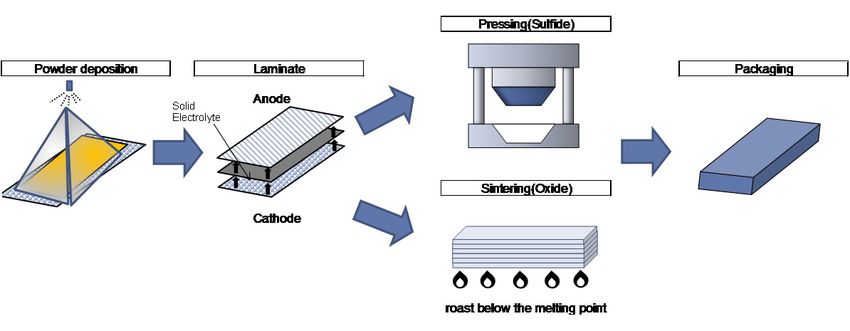
September 6, 2017                                                                                                                          Electric Vehicle Boom

Table of contents
Executive summary: What if we see hyper-adoption from 2025?                                                                                                4
Driving EV adoption: The road ahead from regulators to consumers                                                                                           9
Shift to hyper-adoption mode: Potential tailwinds                                                                                                         14
OEMs/Parts: First-mover benefits for EVs? Timing is everything                                                                                            25
Batteries: Value-add revving up                                                                                                                           28
Battery materials: Lithium supply/demand to tighten                                                                                                       34
Energy: Crude oil demand to slow as EVs become mainstream                                                                                                 36
Appendix 1: Target price methodologies and risks                                                                                                          38
Appendix 2: Glossary of terms                                                                                                                             39
Disclosure Appendix                                                                                                                                       41

                                                                                               China’s Battery Challenge, Feb 9, 2017
                                                                                               Charging the future: Asia leads drive to next-
    The drive for the rise of Electric Vehicles sits at                                        generation EV battery market, Sep 27, 2016
    the nexus of multiple trends. See our theme                                                The Great Battery Race, Oct 18, 2015
    pages for related work on The Great Battery
    Race, Cars: The Road Ahead, The Low Carbon
    Economy and Advanced Materials.                                                            Rethinking Mobility, May 23, 2017
                                                                                               Lighter, Faster, Cheaper, Apr 7, 2016
                                                                                               Disruption in China’s new car market, Feb 29, 2016

                                                                                               Focus on shifts in solar/EVs; losers continue to
                                                                                               outnumber winners, May 31, 2016
                                                                                               Electric Vehicles – customer acceptance &
                                                                                               continued scaling; check, Apr 7, 2016

                                                                                               Profiles in Innovation: Advanced Materials, Sep
                                                                                               27, 2016
                                                                                               What if I Told You...Lithium is the New Gasoline?

Analyst team contributors
Region             Analyst             Telephone          Email                       Region          Analyst            Telephone         Email
Autos & Auto Parts                                                                    Energy & Chemicals
Japan             Kota Yuzawa          +81(3)6437-9863    kota.yuzawa@gs.com          Singapore        Nikhil Bhandari   +65-6889-2867     nikhil.bhandari@gs.com
                  Yusuke Akiyama       +81(3)6437-9872    yusuke.akiyama@gs.com                        Kim Theo          +65-6889-2468     theo.kim@gs.com
China             Yipeng Yang          +86(10)6627-3189   yipeng.yang@ghsl.cn         USA              Robert Koort      +1(713)654-8480   robert.koort@gs.com
                  Yuqian Ding          +86(10)6627-3327   yuqian.ding@ghsl.cn                          Dylan Campbell    +1(713)654-8481   dylan.campbell@gs.com
India             Pramod Kumar         +91(22)6616-9043   pramod.kumar@gs.com                          Brian Lee         +1(917)343-3110   brian.K.lee@gs.com
USA               David Tamberrino     +1(212) 357-7617   david.tamberrino@gs.com     Japan            Shuhei Nakamura   81(3)6437-9932    shuhei.nakamura@gs.com
Europe            Stefan Burgstaller   +44(20)7552-5784   stefan.burgstaller@gs.com   Technology
                  Lucile Leroux        +44(20)7051-3084   lucile.leroux@gs.com        Japan            Daiki Takayama    +81(3)6437-9870   daiki.takayama@gs.com
Korea             Seung Shin           +82(2)3788-1779    seung.shin@gs.com                            Masaru Sugiyama   +81(3)6437-4691   masaru.sugiyama@gs.com
                                                                                      Korea            Giuni Lee         +82(2)3788-1177   giuni.lee@gs.com

Goldman Sachs Global Investment Research                                                                                                                            2
September 6, 2017                                                                                                                      Electric Vehicle Boom

    EV Outlook in numbers
    THE TURNING POINT                                                               POTENTIAL EV PENETRATION

                      We expect EV sales to gain real momentum
     2025             from 2025. (p. 9)                                                        1%                 8%            32%
    CHALLENGING EV PAYBACK PERIOD
                                                                                    We see EV sales growing from 560,000 units in 2016 (1% of
                      The most important inflection period is                       global auto sales), to 9.72mn units in 2030 (8%) and
                      when declining battery costs will shorten                     44.19mn units in 2040 (32%). (p. 9)
     3yrs             the payback time for EVs to three years.
                      (p. 12)

    PARTS MAKERS LIKELY TO FACE HEADWINDS
                      EVs have no engine-related components,
                                                                                     Hyper-adoption scenario
                      whereas these parts make up 23% of
     23%              conventional gasoline-powered vehicles.                         1) Carrot and stick
                      (p.25)
                                                                                      US$8,452                         US$653
    BATTERIES MARKET PICKING UP                                                       Governments would have needed to provide
                      While auto battery capacity was a mere                          US$8,452 in subsidies in 2015 to achieve a
     136x             17GWh in 2015, we estimate it will increase                     payback period of 3 years, but we forecast that
                      136x to 2,319GWh by 2040. (p. 28)                               this will shrink to US$3,481 in 2020, and to
                                                                                      US$653 in 2025. (p. 16)

    LITHIUM SUPPLY/DEMAND LIKELY TO TIGHTEN                                           2) Battery cost breakthrough
                      Lithium price doubled from US$5/kg in 2015
        2x            to US$12/kg in 2017. Lithium prices is around
                      5-10% of battery production cost. (p. 34)
                                                                                      Below US$100/kWh?
                                                                                      Battery cost (per kWh, pack cost) is the
    CRUDE OIL DEMAND SENSITIVITY                                                      biggest hurdle. In order for general
                                                                                      consumers to accept EVs, a breakthrough is
                      We calculate that 5% increase in EV                             necessary to bring the cost down to below
     1.5%             penetration to cause 1.5% decrease in crude
                      oil demand. (p. 36)
                                                                                      US$100. (p. 21)

    RIDING THE ELECTRIC VEHICLE BOOM
    EV sales as % of global auto sales (2015 vs. 2030E vs. 2040E base case vs. 2040E hyper adoption)
     80.0                            25.0
                               51%
     70.0                                                 57%                                  2015        2030   2040 Base     2040 Hyper adoption
                                     20.0
     60.0

     50.0                32%                        40%
                                     15.0
     40.0
                                                                              67%
     30.0                            10.0                                                            57%                  60%
                                                                        50%
                                                                                               45%
     20.0                                                                                                          38%
                                      5.0        15%
                    8%
     10.0                                                         11%                                                                          55%
                                                                                                                  8%                     35%
               0%                           1%                  0%                     0% 7%                 0%                  0% 9%
       0.0                            0.0
       (mn)         Global                        China           W.Europe                  US                    India              Japan

Source: IHS, METI, JAMA, Avicenne, Goldman Sachs Global Investment Research

Goldman Sachs Global Investment Research                                                                                                                  3
September 6, 2017 Electric Vehicle Boom
Executive summary: What if we see hyper-adoption from 2025?
What’s new? We forecast EVs will account for just 8% of global auto sales in 2030, industry expectations
New forecasts to 2040 (10%-20% e.g. Faurecia and Continental), and think the current view of an EV boom is a
Inflection after 2025 little too sanguine. Our base case is unchanged but we now project an inflection point in
Hyper-adoption case
2025-30 and introduce forecasts out to 2040. We also introduce a more aggressive “hyper
adoption” scenario to reflect the growing possibility that government incentives and lower
battery costs will drive even faster EV adoption – almost twice as fast as our base case.
Driving the transition: Recent progress favours electric vehicles
This year saw a number of developments favoring the transition to EVs, including new
models, increased government mandates, and advances in the development of the next
generation of batteries. On product development, General Motors has launched Bolt,
featuring a new lithium-ion battery from LG Chem, and Tesla has launched its first car for
the mass market, Model 3, fitted with Panasonic’s 2170 battery. On government regulation,
France and the UK have announced deadlines for phasing out new gasoline and diesel
engine vehicle sales, and India announced a “Transform Mobility” plan in May 2017,
setting an extremely ambitious EV sales ratio target of 40% in 2032 (vs. our 2032 base case
of 13%). We also see steady progress in next-generation battery technology with the
biggest focus on Toyota Motor’s intention to launch all-solid-state battery EVs in 2022.
Inflection point
The turning point where Gearing up for a new era: Electric vehicles approaching an inflection
payback time for EVs
falls below three years We project an inflection point after 2025 and introduce forecasts out to 2040 for the
adoption of EVs (vehicles with only an electric engine). We see EV sales growing from
560,000 units in 2016 (1% of global auto sales), to 10 mn units in 2030 (8%), and 44 mn
units in 2040 (32%). After more than 100 years, it seems that an auto industry dominated by
internal combustion engines is nearing an end. We believe the most important event to
watch for is when declining battery costs shorten the payback time for EVs to three years.
Payback time
The number of years Pedal to the metal: What could accelerate electric vehicle uptake?
required for gasoline
expense savings to cover We also introduce a more aggressive “hyper adoption” scenario to reflect the increasing
the hybrid cost possibility that government incentives and falling costs will drive EV adoption even faster
than our base case. Under our scenario of accelerated EV uptake from 2025, we see EV
sales growing to 20 mn units in 2030 (17% of global auto sales, twice our base case). By
2040, EVs could account for 51% of all vehicles sold globally, with sales of 71 mn units. We
see the greatest risks to our base case and accelerated adoption scenarios in the
complexities of the auto supply chain, government support, and the challenge to bringing
battery costs down at a faster pace than we have seen thus far.
Condition (1): Carrot and stick (government subsidies and penalties)
Government policies remain a wildcard, with the risks of a faster government push to EVs
in places like China, India, and Western Europe, and a rollback in efficiency standards in the
US under the Trump administration.
Condition (2): Battery cost breakthrough
Because improvements and cost reductions in batteries are such critical variables, we
provide an update on the progress on all-solid-state lithium batteries which we see as the
most likely successors to unlock the advances in energy density needed for EVs to fulfill
their potential. We see Toyota’s progress toward a viable all-solid-state battery by 2022 as
supporting our thesis, but caution that a number of hurdles remain.
Goldman Sachs Global Investment Research 4September 6, 2017 Electric Vehicle Boom
Exhibit 1: There are several tailwinds that may spur EV hyper-adoption
Factors promoting EV penetration
EU Accelerate French and UK authorities declared no more sales of internal combustion engines (ICE) from 2040
China Accelerate NEV regulation credit can be used for corporate average fuel consumption (CAFC) regulation
Regulations India Accelerate EV penetration target of 40% in 2032
USA On track US$7,500 federal EV subsidy + ZEV regulation
Japan On track US$100 subsidy per kWh battery
VW Accelerate Launching 30 EV models by 2025. Accelerating its EV plan to meet 25% of total sales in 2025.
Honda Accelerate China-dedicated EV will be launched in 2018
Toyota Accelerate Set up EV division but no concrete launch schedule announced yet
Products
GM On track Bolt EV launched in December 2016 as planned
Tesla On track Model 3 launched in July 2017, the company is targeting 20k/month production in December
Nissan On track Leaf full model change expected in Sep 2017 as planned
All-solid-state Accelerate Toyota sees a 2022 launch.
Battery LiB NCA On track Tesla starts using 2170 type nickel-cobalt-aluminium-based (NCA) battery for Model3 as planned
LiB NMC On track Nickel rich cathode + wet separator to become the industry standard as planned
Source: Company data, various government websites, Goldman Sachs Global Investment Research.
Exhibit 2: We expect see a turning point in EV sales after 2025
Mid-term global EV sales forecast scenarios – base case vs. hyper-adoption
Base case 2017E 2020E 2030E 2040E CAGR Hyper-adoption case 2017E 2020E 2030E 2040E CAGR
EV sales (mn) 1 1 10 44 22.0% EV sales (mn) 1 2 20 71 24.6%
EV sales ratio 1% 1% 8% 32% 19.9% EV sales ratio 1% 2% 17% 51% 22.4%
Battery cost (USD/kWh) 222 164 95 71 -5.0% Battery cost (USD/kWh) 189 110 73 55 -5.5%
CO2 regulation (g/km) 134 114 76 41 -5.2% CO2 regulation (g/km) 134 114 73 29 -6.7%
Battery cost: Expect costs below USD100/kWh in 2029. Battery cost: Expect costs below USD100/kWh in 2022. All-solid-state
Battery materials: Raw material prices to remain at current levels. batteries to become mainstream from 2030.
ICE improvement: Further 35% improvement through turbo/direct fuel Battery materials: Raw material prices to remain at current levels.
injection/multi-transmission. ICE improvement: Further 20% improvement through turbo/direct fuel
Gas price/electricity price: Expect to stay at current price levels. No injection/multi-transmission.
incremental tax on electricity expected. Gas price/electricity price: Expect to stay at current price levels. No
Govt support: Factoring in announced subsidies till 2020-2025. No further incremental tax on electricity expected.
government support from 2025 onward. Govt support: Factoring in announced subsidies till 2020-2025. Assuming
government support to continue in order to achieve mid-term EV target.
Source: Goldman Sachs Global Investment Research.
Goldman Sachs Global Investment Research 5September 6, 2017 Electric Vehicle Boom
Seven things that may surprise you…
1. We see a payback period of three years as the benchmark for consumers to take to EVs. With the boom in
hybrid sales, three years was the magic number, and if the payback period narrows to three years by 2025-30, we will
move from regulatory to consumer-led EV adoption. (p.12)
2. Subsidies supporting EV adoption should no longer be necessary by 2028. Over the medium term though, we
see a need for new tariffs to offset the decline in tax revenue from gasoline tax, etc. In Japan, gasoline tax contributes
3% of annual tax revenue or above ¥2 tn. (p.16)
3. EVs are not necessarily eco-friendly. On a tank-to-wheel basis, EVs undeniably are easy on the environment, but on
a well-to-wheel basis, CO2 emission volume varies greatly according to the energy mix. A shift to nuclear power and
renewable energy is likely critical to radically lowering CO2 emissions. (p.17)
4. Misconception to say EVs are simple to manufacture. EVs may have only two-thirds of the parts used in gasoline
vehicles, but the supply chain must still deliver some 18,000 components. Tesla is spending massive amounts in order
to achieve annual capacity of 300,000 vehicles, but the reality is that many new players exit the market before reaching
mass production. (p.25)
5. Payback period for ICEs is typically 10-15 years. We expect further technological breakthroughs in conventional
engines through 2040, but think competition will be limited to a select few makers, as achieving a payback period of 10-
15 years looks difficult amid the prevailing shift toward EVs. (p.11)
6. Raw material costs standing in the way of battery cost reductions. EV makers’ fervent wish is for battery costs to
fall. While some see mass production greatly lowering battery costs, prices of lithium, cobalt, and other key inputs
remain a significant hurdle. (p.34)
7. All-solid-state batteries nearing viability. Toyota is working with Japanese suppliers to debut EVs powered by all-
solid-state batteries in 2022, greatly aided by the discovery of solid electrolytes with better ion conductivity than liquid
electrolyte solution. (p.31)
Goldman Sachs Global Investment Research 6September 6, 2017 Electric Vehicle Boom
Who benefits from EV adoption? Not necessarily the first movers
First movers don’t always win: Timing is everything
Auto makers aggressively moving to introduce EVs (VW, Renault-Nissan) may have a slight
advantage until the pivot point in 2025-2030, before new entrants enter the market. We
note the rise of emerging EV makers not burdened by legacy costs of existing engines and
transmissions or concerns about the stability of their supplier base (Tesla, BYD, Geely).
German premium auto makers (Daimler, BMW) can absorb EV-related costs via relatively
higher ASP and lead the EV transition. In contrast, major Japanese and US auto makers
will likely only introduce EVs on a trial basis until the turning point. Manufacturers that
believe in tech innovation may only allocate enough resources for EVs to meet regulations,
until the right technology comes along. We see the precise timing of large investment as
the most important factor and a fast-follower strategy more appropriate in the shift to EVs.
Beyond autos: Parts makers to face headwinds
We see particular risks for auto parts suppliers heavily dependent on ICE components and
opportunities for companies exposed to battery demand. Wider impact include primary
power mix shift, need for more charging stations, and higher material prices e.g., lithium.
Auto parts: EVs have no engine-related components which make up 23% of conventional
gasoline-powered vehicles. Moreover, drive/transmission system parts account for 7% of
components in EVs, but 19% in the latter. Engine and transmission-related parts makers,
which generate high value-add as core suppliers for automobiles, are searching for
opportunities to advance in electric motor- and battery-related components, but we expect
their growth potential to be called into question as EVs become mainstream.
Companies that could face these headwinds include Tenneco, Ibiden, NGK, NGK Spark,
Hyundai Wia, Aisin Seiki, and Schaeffler.
Batteries: The batteries market, which is critical for EVs and therefore a potential source of
value-add, will likely expand rapidly through 2040. We forecast it to grow from a mere
US$450 mn in 2015 to US$35 bn by 2025, and US$180 bn by 2040. Fierce competition is
also currently under way to develop next-gen automotive batteries. While there are many
options, we see much potential in Toyota’s all-solid-state battery in 2022. This battery is
expected to significantly increase driving range (a shortcoming of existing EVs) and
recharge within minutes, while also offering a safety advantage. If Toyota succeeds in
mass-producing all-solid-state batteries, this is a potential game-changer for the industry.
Companies that could benefit include LG Chemical and Samsung SDI.
Battery Materials: Rapid expansion in lithium-ion battery demand will most likely exert a
significant influence on battery input prices. Based on consumption per kWh (GSe) and
current spot prices, we calculate a total cost of US$33 for the four key inputs (12% of the
US$272 cost of a 1-kWh battery pack). If we use the highest prices over the past 10 years,
the total cost rises to US$80. If the industry can get battery cost to below US$100 per kWh,
input costs will need to be more stable, especially lithium, the key material used in LIBs –
our global commodities team estimates a somewhat tight market at least till 2025.
Companies that could benefit include Albemarle and FMC
Energy: Our 2030 crude oil forecasts are based on our base case for EV sales volume,
which sees EV ownership volume at 5% in 2030. However, EV ownership volume reaches
10% in our hyper-adoption scenario. We calculate each 1% increase in volume weighting of
EV ownership lowers crude oil demand by 246,000 bpd and by 0.3% overall. Our hyper-
adoption scenario sees crude oil demand falling a further 1.5% – a major impact on crude
oil from EV penetration. To illustrate, a 1% deceleration in global GDP has a roughly 0.8%
negative impact on crude oil.
Goldman Sachs Global Investment Research 7September 6, 2017 Electric Vehicle Boom
Exhibit 3: Companies in the value chain
Stocks in focus (companies in the EV value chain in blue, companies in the existing ICE chain in red)
Position in value Mkt cap Price TP EV Business
Company Ticker Rating
chain (mn $) (local) (local) exposure description
Tesla TSLA 59,312 $355.40 $200.00 Sell EV/Battery
BYD 1211.HK 5,519 HK$47.20 HK$45.05 Neutral EV/Battery
Geely 0175.HK 21,916 HK$19.16 HK$21.13 Buy* EV
Toyota 7203.T 183,788 ¥6,169 ¥6,200 Neutral EV/Battery
Daimler DAIGn.DE 78,968 €61.97 €80.00 Neutral EV/Battery
OEMs VW VOWG_p.DE 46,242 €131.56 €200.00 Buy* EV/Battery
GM GM 54,441 $37.36 $32.00 Neutral EV
Ford F 44,275 $11.35 $10.00 Neutral EV
Nissan 7201.T 42,082 ¥1,092 ¥1,100 Neutral EV
Honda 7267.T 50,444 ¥3,050 ¥3,800 Buy EV
BMW BMWG.DE 56,991 €79.48 €84.00 Neutral EV
LG Chem 051910.KS 23,054 ₩370,000 ₩435,000 Buy* Battery
Battery Cell Samsung SDI 006400.KS 11,714 ₩193,000 ₩188,000 Neutral Battery
Panasonic 6752.T 32,196 ¥1,438 ¥1,400 Neutral Battery
Sumitomo Metal Mining 5713.T 9,946 ¥1,873 n.a. NC Cathode
Mitsui Mining&Smelting 5706.T 2,982 ¥570 n.a. NC Cathode/Solid electrolyte
Umicore UMI.BR 8,406 €63.01 n.a. NC Cathode
Hitachi Chemical 4217.T 5,610 ¥2,949 n.a. NC Anode
Mitsubishi Chemical 4188.T 14,042 ¥1,021 n.a. NC Anode/Electrolyte
Nippon Carbon 5302.T 436 ¥4,040 ¥2,400 Sell Anode
Battery Components
Ube Industries 4208.T 3,016 ¥311 n.a. NC Electrolyte/Separator
Central Glass 4044.T 922 ¥470 n.a. NC Electrolyte
Mitsui Chemical 4183.T 6,020 ¥645 n.a. NC Electrolyte
Asahi Kasei 3407.T 16,597 ¥1,296 n.a. NC Wet separator
Toray 3402.T 15,328 ¥1,029 ¥950 Neutral Wet separator
W-scope 6619.T 641 ¥2,253 n.a. NC Wet separator
Albemarle ALB 13,105 $118.63 $135.00 Buy* Lithium
Battery materials SQM SQM_pb.SN 5,951 CLP26,000 n.a. NC Lithium
FMC FMC 11,724 $87.41 n.a. NR Lithium
Position in value Mkt cap Price TP ICE Business
Company Ticker Rating
chain (mn $) (local) (local) exposure description
Aisin 7259.T 14,851 ¥5,520 ¥5,800 Neutral Transmission
Ibiden 4062.T 2,291 ¥1,781 ¥1,390 Sell DPF
NGK Insulators 5333.T 6,146 ¥2,055 ¥2,440 Neutral DPF
NGK Spark Plug 5334.T 4,133 ¥2,130 ¥2,550 Neutral Spark plug
Hyundai Wia 011210.KS 1,683 ₩70,100 ₩58,000 Neutral Engine
Tenneco TEN 3,002 $56.42 $68.00 Buy DPF
Schaeffler SHA_p.DE 2,343 €11.85 €15.50 Buy Transmission
5% or less 5% to 20% 20% to 50% 50% or more
Note: * on regional Conviction List. NC = Not Covered, NR = Not Rated.
All target prices are based on a 12-month timeframe except for Tesla and Tenneco, which has 6-month target prices. Prices are based on September 4, 2017 close;
Sept 1 for US stocks.
Source: Datastream, Bloomberg, Goldman Sachs Global Investment Research, Gao Hua Securities Research.
Goldman Sachs Global Investment Research 8September 6, 2017 Electric Vehicle Boom
Driving EV adoption: The road ahead from regulators to consumers
Powertrain mix to undergo significant change by 2040
We have previously forecast EV sales will reach 4 mn units (4% of global auto sales) in
2025. Our base case is unchanged but in light of recent developments, we introduce
forecasts out to 2040. Specifically, we forecast EV sales to rise to 10 mn units in 2030 (8% of
global auto sales), 24 mn units in 2035 (19%), and 44mn units in 2040 (32%). Based on our
EV cost analysis and various government policies, we think EV sales will reach critical
momentum after 2025. The powertrain mix looks set to transform radically from the
gasoline and diesel engine era that has lasted more than a century.
Tighter environmental regulations appear inevitable
We expect auto-related environmental regulations to have a significant bearing on the
powertrain mix in the near term. We believe they will be the main determinant of EV
market penetration speed at least until around 2025. Japan, US, Europe, and China require
automakers to cut CO2 emissions by 30%-40% compared with 2015 levels by 2025.
Automakers will be unable to meet these standards purely by improving the efficiency of
gasoline and diesel engines. Clear targets through to 2040 have not yet been announced,
although it is hard to imagine that governments will relax regulations (with the possible
exception of the US, where the media such as Bloomberg, 26 July, 2017 has reported that
the Trump administration is considering relaxing targets). Our long-term forecasts assume
strict standards, with CO2 emissions to be lowered by more than 50% between 2025 and
2040.
Exhibit 4: EV penetration approaching a turning point Exhibit 5: Environmental regulations will only become
Global powertrain mix (as a % of global sales) stricter
CO2 emission / km drive (g)
100%
8%
90% 160
32%
80% 140
70%
120
60%
100
50%
80
40% USA
30% 60
Japan
20% 40
China
10% 20
EU
0%
0
2017E
2018E
2019E
2020E
2021E
2022E
2023E
2024E
2025E
2026E
2027E
2028E
2029E
2030E
2031E
2032E
2033E
2034E
2035E
2036E
2037E
2038E
2039E
2040E
2015
2016
2015
2016
2017E
2018E
2019E
2020E
2021E
2022E
2023E
2024E
2025E
2026E
2027E
2028E
2029E
2030E
2031E
2032E
2033E
2034E
2035E
2036E
2037E
2038E
2039E
2040E
ICE and others HEV PHEV EV
Source: IHS, Goldman Sachs Global Investment Research. Source: JAMA, Goldman Sachs Global Investment Research.
Goldman Sachs Global Investment Research 9September 6, 2017 Electric Vehicle Boom
China and Europe to lead EV market growth until 2025
We forecast China and Western Europe will be the main drivers of EV market growth until
2025 and account for 47% of global EV sales in 2025. We estimate EV sales in China will
reach 1.9 mn units by 2025 (6% of China auto sales). As a result of new energy vehicle
(NEV) regulations, number plate issuance restrictions, and other government-led
stimulation measures, we expect the EV market in China to reach a turning point before
EVs become a true mass-market product. In Western Europe, some automakers have
announced plans to accelerate EV development programs as pressures to combat diesel
emission problems intensify. France and the UK have announced deadlines for phasing out
new gasoline and diesel engine vehicle sales. We estimate EV sales in Western Europe will
reach 870,000 units by 2025 (6% of Western Europe auto sales).
EVs to be valued on their own merit from 2025
We expect EV sales in other regions besides China and Western Europe to gain real
momentum from 2025. By 2040, we estimate the EV sales weighting will hit 45% in the US,
35% in Japan, 40% in China, 50% in Western Europe, and 38% in India, resulting in a global
EV sales weighting of 32%. In other words, we expect EV sales will account for around half
of sales in the world’s major auto markets.
Exhibit 6: China/Western Europe to lead EV market Exhibit 7: EV sales could account for around half of sales
growth until 2025 in major auto markets by 2040
EV sales of main countries (‘000 units) EV adoption of main countries
60%
50,000 US
45,000 Others 50% Japan
40,000 India China
40%
35,000
W.Europe W.Europe
30,000 30%
China India
25,000
20,000 Japan 20% Others
15,000 US Total
10%
10,000
5,000 0%
2015
2016
2017E
2018E
2019E
2020E
2021E
2022E
2023E
2024E
2025E
2026E
2027E
2028E
2029E
2030E
2031E
2032E
2033E
2034E
2035E
2036E
2037E
2038E
2039E
2040E
0
2017E
2018E
2019E
2020E
2021E
2022E
2023E
2024E
2025E
2026E
2027E
2028E
2029E
2030E
2031E
2032E
2033E
2034E
2035E
2036E
2037E
2038E
2039E
2040E
2015
2016
Source: IHS, Goldman Sachs Global Investment Research. Source: IHS, Goldman Sachs Global Investment Research.
Internal combustion engines to play a major role through to 2030
Government regulations in major auto markets require automakers to cut CO2 emissions to
78 g/km (average value; includes some GS estimates) by 2030, from 144 g/km in 2015. We
forecast improvements in engine thermal efficiency will lower CO2 emissions by 29 g/km
and be the largest contributing factor: we expect multi-speed transmissions to reduce
emissions by 9 g/km, vehicle lightweighting to reduce emissions by 5 g/km, and vehicle
electrification to reduce emissions by 23 g/km. That is, we believe the internal combustion
engine (ICE) will remain a prominent feature of the auto landscape until 2030. How much
can auto engine efficiency be improved? We see fierce competition to lift thermal efficiency
to 50%, versus the current level of 40%, is widening (each 1 pp increase in thermal
efficiency improves fuel economy by 2%-3%).
Goldman Sachs Global Investment Research 10September 6, 2017 Electric Vehicle Boom
Conventional engine limits to accelerate EV shift
There is still scope to improve the performance of powertrains, centering on conventional
internal combustion engines. However, depending on battery costs and government
subsidies, improvements may not be enough to secure superior cost competitiveness vis-
à-vis EVs. We believe EV penetration is likely to accelerate rapidly if achieving a 10pp
improvement in engine thermal efficiency proves illusive or costs more than expected. The
payback period for a conventional engine/transmission is typically 10-15 years. From this
perspective, we believe the deadline for a major investment in conventional powertrains is
drawing near.
Exhibit 8: CO2 reduction solutions
How to achieve CO2 regulations by 2030 (g per km)
160 144 29
140 9
120 5 101 23
100
78
80
60
40
20
0
Source: JAMA, ACEA, Goldman Sachs Global Investment Research.
EV costs are an issue
Renault-Nissan President Carlos Ghosn said in 2009 that he expected EVs to account for
10% of global auto sales by 2020 and Renault-Nissan’s EV sales to reach 500,000 units. By
2015, the global EV sales weighting was still less than 1% and Renault-Nissan’s EV sales
were just 70,000 units. Why didn’t the EV strategies of that time resonate with consumers?
We believe high prices were the major stumbling block. Driving ranges, battery charging
infrastructure, and charging times were also factors. While it is unlikely all these issues will
be satisfactorily resolved by 2025, advances in battery technology and government
subsidies could eliminate low driving ranges and high prices as hurdles to market
penetration.
Goldman Sachs Global Investment Research 11September 6, 2017 Electric Vehicle Boom
Exhibit 9: Main reasons consumers think twice about Exhibit 10: Consumers will need pay more for an EV with
buying an EV high-capacity battery for a comfortable driving range
Impediments to buying an EV (2016 survey) Range / battery capacity
(Range, mile)
Not attractive 400
350
Worse automobile performance
ModelS
300 Model3
250
Spending long time for charging Bolt EV
200
Zoe Leaf
Few EV charging station 150 Fit EV i3
e-up! B-class E
100 i-MiEV
Soul
No EV charging facility at home y = 2.6965x + 64.308
50 Spark EV R² = 0.848
0
Short running distance
0 10 20 30 40 50 60 70 80 90
(Battery capacity, kWh)
Expensive
0% 10% 20% 30% 40% 50% 60%
Source: METI. Source: Company data.
Challenging EV payback period of three years
Lowering the battery cost, the largest component of the EV cost structure, is essential to
shortening the payback period to three years (see our Prius case study on page 12). As of
2015, the average battery unit cost (pack basis) was US$272/kWh. We believe the prospect
of a US$95/kWh unit cost by 2030 is realistic. Assuming no major change in electricity
prices due to tax system changes in various countries, we expect EV demand to take off
over 2025-2030 (gasoline tax in Japan contributes 3% of annual tax revenue or above ¥2tn).
However, we note most bullish battery makers aim to achieve a unit cost of US$85/kWh
before 2025. If they succeed, the EV market could reach a turning point even before 2025.
Exhibit 11: Cost gap with internal combustion engines Exhibit 12: Turning point likely in 2025-2030
likely to close rapidly Scenario analysis of payback period (year)
Internal combustion engine/EV unit cost comparison (USD)
18,000 14.0
Most aggressive battery costs Most aggressive battery costs
16,000
12.0
Current GS view Current GS view
14,000
10.0
ICE cost
12,000 Prius breakthourgh
8.0
10,000
8,000 6.0
6,000 4.0
4,000
2.0
2,000
0.0
0
Source: IHS, Goldman Sachs Global Investment Research. Source: Avicenne, Goldman Sachs Global Investment Research.
Goldman Sachs Global Investment Research 12September 6, 2017 Electric Vehicle Boom
Payback period of three years a breakthrough for Toyota hybrids
We see a payback period of around three years as a benchmark for a new powertrain to be widely accepted by
consumers. The Toyota Prius became profitable 10 years after its launch in 1997, and after 20 years on the market it had
an operating margin that was higher than Toyota’s consolidated operating margin of 8%. We estimate the payback
period (the number of years required for gasoline expense savings to cover the hybrid cost) was much longer than 10
years for the first Prius and also the second-generation model, which was released in 2003. By the third-generation
Prius, which was rolled out in 2009, Toyota had succeeded in shortening the payback period to three years thanks to
steady COGS reductions and volume effects (an increase in gasoline prices also contributed). The boom in hybrid sales
is still fresh in our minds (the drop in sales in 2011 was attributable to the major earthquake in Japan and only
temporary).
We estimate a gasoline engine powertrain for a mid-size vehicle currently costs around US$5,000-6,000. Hybrid
powertrains also require a battery (lithium-ion battery with capacity around 1 kWh), a motor, and an inverter, and we
estimate this increases the powertrain cost by US$2,000. Assuming an annual gasoline expense saving of around
US$1,000 (20%-30%), it should not be difficult for a consumer to recover the cost for hybrid vehicles. However, as of
2015, we estimate the cost of an EV powertrain unit was US$16,000. The battery is the most expensive component, with
the motor and inverter each costing around US$1,000-1,500.
Exhibit 13: Payback period of three years a turning point Exhibit 14: We expect a mass-market cost to be realized
for hybrids in 2025-2030
Payback period (Toyota HEV) Powertrain unit cost comparison (USD)
16,000
1,400 12
Global HEV sales(units, LHS) Battery
14,000
Payback period(yers, RHS) Motor/Invertor
1,200
10 12,000 Hybrid ICE
Gasoine price/G ($, RHS)
ICE
1,000 10,000
8
13,000
8,000
800
6,000
6
600 4,000
5,000
4 2,000
400
0
2 Gasoline Hybrid EV EV
200
(2015, 272 US/kWh) (2030, 95 US/kWh)
0 0
2003 2004 2005 2006 2007 2008 2009 2010 2011 2012 2013 2014 2015
Source: Company data. Source: Avicenne, Goldman Sachs Global Investment Research.
Goldman Sachs Global Investment Research 13September 6, 2017 Electric Vehicle Boom
Shift to hyper-adoption mode: Potential tailwinds
“Hot summer” in 2017: Three new EV models provide litmus test
The first EV boom was in the late 2000s before fizzling out. Nissan’s Leaf was the first of
several EVs launched by major automakers, but sales volumes were low. 2017 is seeing a
second boom for EVs, with the launch of many major models. In the US, General Motors
has launched Bolt, which features a new lithium-ion battery from LG Chem, and Tesla has
launched its first car for the mass market, the Model 3, fitted with Panasonic’s 2170 battery.
Nissan is due to bring its second-generation Leaf to market in September, setting the scene
for a robust line-up of EVs. We think sales of these three models will be a litmus test to
determine whether the current boom will fizzle out as the last one did (our base case), or
whether it marks the start of a full-fledged surge in demand for EVs.
Exhibit 15: 2017 EV launches could mark the start of a boom
Comparison of business environment for EVs in 2009 and 2017
2009 2017
Energy density: 100-150 Energy density: 200-250
Battery kWh cost: 700-800 USD kWh cost: 200 USD
Type: LFO, LMO, NCA(18650) Type: NCM (high-nickel), NCA(2170)
JP: 100 USD subsidy per kWh battery
JP: around 10,000 USD / vehicle subsidy US: 7500 USD / vehicle federal subsidy
Gov. support US: 7500 USD / vehicle federal subsidy and ZEV regulation
China: No vehicle subsidy China: Gov. subsidy, free license plate
and NEV regulation
2008 Tesla Roadstar 2017 GM Bolt
New models 2009 MMC iMiEV 2017 Tesla Model3
2010 Nissan Leaf 2017 Nissan Leaf FMC
Source: Company data, Goldman Sachs Global Investment Research.
Exhibit 16: The three 2017 EV models need to be successful for this boom not to fizzle out
Monthly sales outlook for key EV models (Nissan Leaf, GM Bolt, and Tesla Model3 respectively)
(units) IHS (units) IHS (units)
GSE
estimate estimate
14,000 14,000 14,000
12,000 12,000 12,000
10,000 10,000 10,000
8,000 8,000 8,000
6,000 6,000 6,000
4,000 4,000 4,000
2,000 2,000 2,000
0 0 0
2010-01
2010-06
2010-11
2011-04
2011-09
2012-02
2012-07
2012-12
2013-05
2013-10
2014-03
2014-08
2015-01
2015-06
2015-11
2016-04
2016-09
2017-02
2017-07
2017-12
2018-05
2018-10
2010-01
2010-06
2010-11
2011-04
2011-09
2012-02
2012-07
2012-12
2013-05
2013-10
2014-03
2014-08
2015-01
2015-06
2015-11
2016-04
2016-09
2017-02
2017-07
2017-12
2018-05
2018-10
2010-01
2010-06
2010-11
2011-04
2011-09
2012-02
2012-07
2012-12
2013-05
2013-10
2014-03
2014-08
2015-01
2015-06
2015-11
2016-04
2016-09
2017-02
2017-07
2017-12
2018-05
2018-10
Source: IHS, Company data, Goldman Sachs Global Investment Research.
Goldman Sachs Global Investment Research 14September 6, 2017 Electric Vehicle Boom
Turning point for EVs could be as early as 2020
In our scenario of accelerated EV uptake, we expect marked expansion from 2020-2025,
with EVs accounting for 17% of global auto sales (20 mn vehicles) in 2030, and 51% (71 mn
vehicles) in 2040. This is a 19pp difference from our base case for the EV sales weighting in
2040, and would inevitably mean a sharp decline for conventional gasoline and diesel
vehicles. We think a detailed response from OEMs such as prudent R&D and capex
expense on ICE will be required in response to a decrease in demand for internal
combustion engines.
Exhibit 17: In our accelerated EV uptake scenario, EVs Exhibit 18: Gasoline and diesel vehicles could see a sharp
account for 51% of global auto sales in 2040 decline
Scenario analysis of EV ratio Scenario analysis of ICE ratio
100%
60%
90%
Base
50% 51% 80%
Hyper-adoption
70%
40%
60%
45%
30%
32% 50%
17% 40%
20% 30%
Base
6% 20%
Hyper‐adoption 29%
10%
4% 8% 10%
0%
0%
2017E
2018E
2019E
2020E
2021E
2022E
2023E
2024E
2025E
2026E
2027E
2028E
2029E
2030E
2031E
2032E
2033E
2034E
2035E
2036E
2037E
2038E
2039E
2040E
2015
2016
2017E
2018E
2019E
2020E
2021E
2022E
2023E
2024E
2025E
2026E
2027E
2028E
2029E
2030E
2031E
2032E
2033E
2034E
2035E
2036E
2037E
2038E
2039E
2040E
2015
2016
Source: IHS, Goldman Sachs Global Investment Research. Source: IHS, Goldman Sachs Global Investment Research.
Exhibit 19: In our accelerated EV uptake scenario, EV Exhibit 20: Our accelerated EV uptake scenario sees
sales would top 71 mn units in 2040 hypergrowth for EVs in 2020-2025
Scenario analysis of EV sales (‘000 units) Scenario analysis of EV growth rate
80,000 70%
70,000
Base
60%
60,000 Base Hyper-adoption
Hyper-adoption
50%
50,000
40,000 40%
30,000 30%
20,000
20%
10,000
0
10%
2015
2016
2017E
2018E
2019E
2020E
2021E
2022E
2023E
2024E
2025E
2026E
2027E
2028E
2029E
2030E
2031E
2032E
2033E
2034E
2035E
2036E
2037E
2038E
2039E
2040E
0%
2017E
2018E
2019E
2020E
2021E
2022E
2023E
2024E
2025E
2026E
2027E
2028E
2029E
2030E
2031E
2032E
2033E
2034E
2035E
2036E
2037E
2038E
2039E
2040E
2016
Source: IHS, Goldman Sachs Global Investment Research. Source: IHS, Goldman Sachs Global Investment Research.
Goldman Sachs Global Investment Research 15September 6, 2017 Electric Vehicle Boom
Hyper-adoption condition (1): Carrot and stick
Government policy particularly important in emerging markets
Under our accelerated EV uptake scenario, there will be a wide gap between EV penetration
in China and India in 2030. In China, we forecast EV sales volume of 4.7 mn units under our
base case and 7.4 mn units under our rapid penetration scenario. For India, our forecasts
are 830,000 units and 3.1mn units, respectively. Government measures to promote EVs are
a key factor in our rapid penetration scenario. NEV regulations and number plate issuance
restrictions in regional cities are the typical “stick” measures the government uses. We
believe India is also likely to introduce “carrot” and “stick” measures to achieve its
ambitious EV sales ratio target for 2032.
Exhibit 21: China will be the main driver of the shift to Exhibit 22: China and India are market wild cards for 2030
EVs forecasts
Regional EV ratio vs total sales forecasts (Hyper-adoption) EV sales forecasts (Hyper-adoption, ‘000 units)
25,000
80%
US
70%
Japan 20,000
60%
China
Others
50% 15,000 3,090
W.Europe
India
40% India W.Europe
10,000
30% Others China
824
Total 7,419 Japan
20%
5,000 US
10% 4,726
0% 0
2017E
2018E
2019E
2020E
2021E
2022E
2023E
2024E
2025E
2026E
2027E
2028E
2029E
2030E
2031E
2032E
2033E
2034E
2035E
2036E
2037E
2038E
2039E
2040E
2015
2016
Base Hyper‐adoption
2030
Source: IHS, Goldman Sachs Global Investment Research. Source: IHS, Goldman Sachs Global Investment Research.
Three-year payback may be a reality soon with government support
We think measures to promote EVs are likely to become even more popular among
governments seeking to protect the environment through a shift to EVs, to reverse energy
policy, or to establish as a major goal the nurturing of the country’s auto industry. For
instance, China has established limits on the issuance of number plates in major cities, and
buyers effectively receive a credit on the purchase of NEVs of around US$10,000 (even
factoring in current battery costs, the payback period is already less than three years). We
estimate that governments would have needed to provide US$8,452 in subsidies in 2015 to
achieve a payback period of three years, but forecast that this will shrink to US$3,481 in
2020, and to US$653 in 2025. Consequently, we believe automakers will no longer need to
calculate earnings outlook based solely on government subsidies when formulating their
medium-term business plans. Of course, government support remains fluid in many
respects due to the possibility of a change in administration, or in the terms and conditions
of trade. For this reason, our base case does not factor in government EV support policies
from 2025 onward.
Goldman Sachs Global Investment Research 16September 6, 2017 Electric Vehicle Boom
Exhibit 23: Payback period likely to shrink significantly, depending on government policy
Estimation of government subsidies needed to enable a three-year payback period (USD)
10,000
8,452
8,000
Payback period three years
6,000
4,000 3,481
2,000 653
0
‐2,000
Source: Goldman Sachs Global Investment Research.
EV promotion measures likely to depend on the energy mix
It is important to keep in mind that EVs are not necessarily CO2 free. EV promotion
measures adopted by governments will be affected by their energy mix policies. Based on
the well-to-wheel scale—a life-cycle assessment method used to measure total CO2
emission volume from fuel production to vehicle operation— gasoline engines emit 140
g/km versus 80 g/km for PHEVs and 70 g/km for EVs (GSe based on Japanese energy mix
assumptions). In France, where plans to ban gasoline and diesel engine vehicle sales by
2040 have been announced, the well-to-wheel CO2 emission volume for EVs is less than 50
g. This reflects France’s use of nuclear power and renewable energy, which have low CO2
emissions. In China and India, however, coal-fired power generation is still mainstream and
not conducive to EV promotion from the perspective of CO2 emissions. EV promotion
measures must be considered together with energy mix changes as part of a larger policy
framework.
Exhibit 24: Well-to-wheel analysis cannot be overlooked Exhibit 25: Energy mix differs by country
CO2 emissions by powertrain (g/km, 2016) Energy mix by country, 2016
100%
90%
Nuclear: 5‐10g/km
EV 67.4 0 Natural gas: 80‐90g/km 80%
Coal: 130‐140g/km 70%
Biofuels & waste
60%
Hydro
50%
Coal
PHEV 40.1 36.7
Well to Tank 40%
Gas
Tank to Wheel 30% Oil
20% Nuclear
10%
Gasoline Vehicle 21.1 122.1
0%
0 20 40 60 80 100 120 140 160
Source: NEDO. Source: IEA, Goldman Sachs Global Investment Research.
Goldman Sachs Global Investment Research 17September 6, 2017 Electric Vehicle Boom
Wild card (1): China’s NEV regulations
The Chinese government has announced that it will gradually introduce NEV credit targets
for automakers from 2018. Production suspension orders and other severe penalties will be
imposed if automakers do not meet these targets. As regulations currently stand,
automakers will need to increase their NEV sales volume ratio to around 4% by 2020 and
around 10% by 2025. Using a simple calculation, we estimate the Chinese NEV market will
expand to 1.7 mn units in 2020 and 3.0 mn units in 2025. Factors like energy policy
(reducing dependence on foreign oil) and worsening air pollution could result in the
government introducing even more or stricter NEV regulations. While the government has
not announced NEV targets for 2030, our accelerated EV uptake scenario assumes an EV
sales weighting of 23% and a total NEV sales weighting of 29%. These are higher than our
current 2030 forecasts of 15% and 21%, respectively.
Hybrids are not counted as NEVs; China prioritizing EVs
China’s definition of NEVs covers PHEVs, EVs, and FCVs but does not include hybrids.
Automakers receive 2 credit points for all PHEVs, 2-5 credit points for EVs depending on
their driving range, and 4-5 credit points for FCVs depending on their driving range. By
2018, automakers must obtain NEV credits for 8% of their vehicle sales. If achieved purely
through PHEVs (2 credit points), NEVs would have to account for around 4% of sales
volume. The details and timing of NEV regulations have changed over time because of
issues relating to consistency with Corporate Average Fuel Economy (CAFE) and other
emission regulations. Fluid government policy has formed the backdrop to extremely large
fluctuations in NEV monthly sales volume.
Global companies responding to NEV regulations
Global automakers are accelerating development programs to obtain NEV credits from
2018. VW, Ford, and Renault-Nissan have already established an EV-focused joint venture
in China and indicated it intends to strengthen local EV production. Among Japanese
automakers, Honda plans to introduce an EV designed for the Chinese market in 2018 and
Nissan has indicated it will accelerate the introduction of EVs under the Nissan and Venucia
badges. Toyota will continue to center its development on PHEVs in the near term,
although it established an EV planning office in 2016 and is also accelerating EV
development. Among the US players, GM has introduced an EV under its Buick nameplate,
and one with JV partner SAIC this year.
Exhibit 26: NEV regulations a high hurdle Exhibit 27: Monthly sales fluctuations extremely large
Estimated eco-car volumes for meeting NEV rules (mn) NEV monthly sales
100,000 12
35% 3.5
90,000 NEV sales(units)
NEV sales volume(mn units, RHS) 30%
YOY(times) 10
30% 3 80,000
NEV credit(LHS)
70,000
25% Estimated sales volume(LHS) 2.5 8
60,000
20% 2 50,000 6
40,000
15% 1.5
4
30,000
12%
10% 10% 10%1 20,000
8% 2
5% 0.5 10,000
4% 4%
3% 3%
2% - 0
1% 2010-01 2011-01 2012-01 2013-01 2014-01 2015-01 2016-01 2017-01
0% 0% 0% 0% 0
2015 2016 2017E 2018E 2019E 2020E 2025E
Source: China government, CAAM, Goldman Sachs Global Investment Source: Company data, China Auto Market.
Research.
Goldman Sachs Global Investment Research 18September 6, 2017 Electric Vehicle Boom
Exhibit 28: We forecast EV will be the main driver of Exhibit 29: EV penetration could accelerate in 2020
electrification; hybrid development will not advance EV adoption scenario in China, % of sales
Powertrain mix in China, % of sales
100% 70%
90% 57%
60% EV (Base case)
80%
EV (Hyper adoption)
70% 50%
HEV
60% PHEV 40%
50% 40%
EV 30%
40%
ICE and others
30% 20%
20% 10%
10%
0%
2015
2016
2017E
2018E
2019E
2020E
2021E
2022E
2023E
2024E
2025E
2026E
2027E
2028E
2029E
2030E
2031E
2032E
2033E
2034E
2035E
2036E
2037E
2038E
2039E
2040E
0%
2017E
2018E
2019E
2020E
2021E
2022E
2023E
2024E
2025E
2026E
2027E
2028E
2029E
2030E
2031E
2032E
2033E
2034E
2035E
2036E
2037E
2038E
2039E
2040E
2015
2016
Source: IHS, Goldman Sachs Global Investment Research. Source: IHS, Goldman Sachs Global Investment Research.
Wild card (2): EV promotion measures in India
In May 2017, the Indian government announced a “Transform Mobility” plan (and released
a report called Transformative Mobility Solutions For All). While plan details could change
depending on factors like electricity market conditions and air pollution levels, the
government has set an extremely ambitious EV sales ratio target of 40% in 2032. We
believe this target will be difficult to achieve; our base case forecasts an EV sales ratio of
13% in 2032. However, if the government is able to learn from the examples of other
countries and use incentives (EV purchase subsidies, support for charging station
installation, etc.) and prohibitions (deadlines for phasing out conventional internal
combustion engine sales, etc.) effectively, we believe it might be necessary to factor in
nearly achieving this target as a rapid EV uptake scenario. India could possibly be
recognized as the leading EV market after China.
Exhibit 30: EVs a likely driver of electrification in India Exhibit 31: EV market to take off around 2030
Powertrain mix in India, % of sales EV adoption scenario in India, % of sales
100% HEV 70%
60%
90%
PHEV EV (Base case)
60%
80%
EV EV (Hyper adoption)
70% 50%
ICE and others
60%
40%
50%
30%
38%
40%
30% 20%
20%
10%
10%
0% 0%
2017E
2018E
2019E
2020E
2021E
2022E
2023E
2024E
2025E
2026E
2027E
2028E
2029E
2030E
2031E
2032E
2033E
2034E
2035E
2036E
2037E
2038E
2039E
2040E
2015
2016
2017E
2018E
2019E
2020E
2021E
2022E
2023E
2024E
2025E
2026E
2027E
2028E
2029E
2030E
2031E
2032E
2033E
2034E
2035E
2036E
2037E
2038E
2039E
2040E
2015
2016
Source: IHS, Goldman Sachs Global Investment Research. Source: IHS, Goldman Sachs Global Investment Research.
Goldman Sachs Global Investment Research 19September 6, 2017 Electric Vehicle Boom
Aims of Transform Mobility in India
The Indian auto industry currently has a zero EV sales ratio, and the Indian government has
said that if it does not introduce new stimulus measure the EV sales ratio (cars) will
probably only reach 1% in 2032. Motorization has only just started in India, and there are
few incentives for consumers to purchase expensive EVs. However, the government
believes that transformative environmental change (industrial structure transformation)
could propel the EV sales ratio to 40% by 2032 (this includes a major change in motorcycle
and bus powertrains). We see the potential for government policy to shift as EV-related
technologies mature, with the timing depending on factors like battery cost reductions and
post-lithium-ion battery development competition. Also, as motorization is only in a
fledgling stage in India, consumer expectations of what a car should offer may differ to
what current gasoline engine vehicles actually offer. It may be possible to cultivate an EV
market out of a customer segment that does not expect driving range, charging time, and
other specs to match levels that consumers in developed economies would take for
granted.
Exhibit 32: Plan points to industrial structure transformation
Transform Mobility in India framework (current state, business as usual, transformative)
Source: India government
Exhibit 33: Ambitious EV sales ratio target of 40% by Exhibit 34: Driving range expectations may be low
2032 Battery capacity per vehicle (kWh)
Powertrain mix
100% 70
90% 13% DM
80% 40% 60 EM
70%
50
60%
EV
50% 40
40% Strong HEV/PHEV
30% HEV 30
20% ICE 20
10%
0% 10
2015 2020E 2025E 2030E 2032E 2032
Gov. 0
2017E
2018E
2019E
2020E
2021E
2022E
2023E
2024E
2025E
2026E
2027E
2028E
2029E
2030E
2031E
2032E
2033E
2034E
2035E
2036E
2037E
2038E
2039E
2040E
2015
2016
plan
Source: IHS, India government, Goldman Sachs Global Investment Research. Source: IHS, Goldman Sachs Global Investment Research.
Goldman Sachs Global Investment Research 20September 6, 2017 Electric Vehicle Boom
Hyper-adoption condition (2): Battery cost
breakthrough
Can cost be brought below US$100/kWh?
Battery cost (per kWh, pack cost) is the biggest hurdle and we expect this cost to drop from
US$272 in 2015 to US$110 in 2025 and US$95 in 2030. In order for general consumers to
take to EVs, a breakthrough is necessary to bring the cost down to below the US$100 level
as soon as possible (equivalent to US$6,000 for a 60 kWh battery). We think this unlikely,
unless battery makers forgo profits to drop prices. However, early feasibility for all-solid-
state and lithium-sulfur batteries as successors to lithium-ion batteries could support a
battery cost breakthrough.
Costs are also a focal point
We estimate the following costs to reduce CO2 emissions by 1g/km: US$42 for vehicle
lightweighting, US$42 for turbos, and US$59 for transmissions. As of 2015, EVs were a
relatively expensive solution, costing US$124 to reduce CO2 emissions by 1g/km. By 2030,
however, we forecast cheaper batteries will lower this cost to US$31 and EVs will be a
more cost-effective option than hybrids. Under hyper-adoption scenario, we expect much
faster pace of battery cost decline due to economy of scale and next generation battery, all-
solid state batteries. We expect next generation batteries will further push down battery
cost from 2030.
Exhibit 35: Searching for effective CO2 reduction Exhibit 36: All-solid state battery could lower battery cost
measures further
Additional cost to reduce CO2 by 1g/km kWh cost analysis (USD)
250
Base case
200
Hyper‐adoption
150
100
50
0
2017E 2020E 2030E 2040E
Source: Goldman Sachs Global Investment Research. Source: Goldman Sachs Global Investment Research.
Goldman Sachs Global Investment Research 21September 6, 2017 Electric Vehicle Boom
Lessons from PC batteries; energy density is key
The cost of the 18650 cylindrical battery that is used in many PCs decreased by 70% between 1996 and 2011. We think
this was largely due to benefits stemming from mass production as PC shipments rapidly expanded from around 20 mn
units to 180 mn. With shipments of automotive lithium-ion batteries projected to leap to 631 GWh in 2030, from 17 GWh
in 2015, we fully expect to see scale benefits ensue. However, the cost of 18650 batteries has been decreasing at a
slower pace in recent years, and is currently increasing due to higher input prices. We think this demonstrates that
innovative cost reduction becomes difficult when energy density is peaking.
Exhibit 37: Cost decline of 18650 batteries for consumer Exhibit 38: Cost limits for lithium-ion batteries
electronics had a limit Pack cost forecasts (USD/kWh)
kWh unit price outlook (Index)
100 300
Pack cost
90 LiB 16GWH to 565GWh
80 in 15 years 250 Cathode
70 Anode
PC 20mn to 180mn in
60 15 years 200 Electrolyte
50 Separator
40 150 Others
30 Depreciation
20 100 Direct labor
10 18650 Auto LiB Energy
0 50 R&D
Sales&Adm
0 Overheads
2015 2020E 2025E 2030E
Source: Avicenne, Goldman Sachs Global Investment Research. Source: Avicenne, Goldman Sachs Global Investment Research.
Lithium-ion batteries are evolving, but…
By trialing various materials since lithium-ion batteries were developed in 1991, their
energy density has reached 200-250 Wh/kg. The key components of lithium-ion batteries
are (1) cathodes, (2) anodes, (3) separators, and (4) electrolytes. From now until 2020, we
expect to see advances in cathodes, separators, and anodes. Ternary (NCM) cathodes are
already commonplace, but we expect nickel composition to increase from the current 30%
to 80-90%. In separators, we expect to see a shift from dry-process to wet-process
separators that are commonly used in consumer electronics. With anodes, we note
progress on experimental studies by LG Chem that show energy density increasing by
around 10% if anodes are 3-5% comprised of silicon (the challenge is controlling silicon
expansion).
Goldman Sachs Global Investment Research 22September 6, 2017 Electric Vehicle Boom
Exhibit 39: Forecast of post-lithium battery developments from 2020
Developments in key components of automotive batteries
2010s 2015-2020 2025 -
Cathode
LFP, LMO, NCA NCM(Nickel rich) LiCO
$2.5bn
Anode
Graphite
0.8bn Graphite Graphite/Si
/LTO
Separator
All solid : None
1.15bn Dry Wet
LiS: Wet
Electrolyte
EC(Ethylene Carbonate)
EC/PC (Propylene
0.68bn LGPS - Solid
carbonate)
Source: Goldman Sachs Global Investment Research.
…approaching energy density limits
Even if these advances are made, it is becoming difficult to realize energy density of 300
WH/kg with the structure of existing lithium-ion batteries. Also, battery deterioration with
age and long recharge times are difficult problems to solve. Because we are starting to see
the theoretical limits of lithium-ion batteries, we think that advances beyond lithium-ion
batteries will likely start from 2020. While there are several candidates, including lithium-
sulfur batteries and magnesium batteries, we think that all-solid-state batteries are the best
choice for automotive batteries.
All-solid-state battery pros and cons; shooting for 500 Wh/kg
All-solid-state batteries aim to increase energy density while lowering costs by changing
from liquid electrolytes to solid electrolytes. All-solid-state batteries offer prospects for
increasing energy density while reducing costs by rendering separators unnecessary, and
could therefore theoretically yield greater cost benefits than current lithium-ion batteries.
These batteries may also have shorter charge times and greatly reduce the risk of igniting,
and thus hold the potential to solve the challenges facing EVs all at once. Finally, all-solid-
state batteries can utilize either an oxide or a sulfide for the solid electrolytes. We think that
the sulfide type could become common considering the high energy density desired for
automotive batteries.
Goldman Sachs Global Investment Research 23You can also read