Mastercard Index of Women Entrepreneurs 2019
←
→
Page content transcription
If your browser does not render page correctly, please read the page content below
Mastercard Index of Women Entrepreneurs 2019

1|P a g e              M a s t e r c a r d   I n d e x   o f   W o m e n   E n t r e p r e n e u r s   2 0 1 9
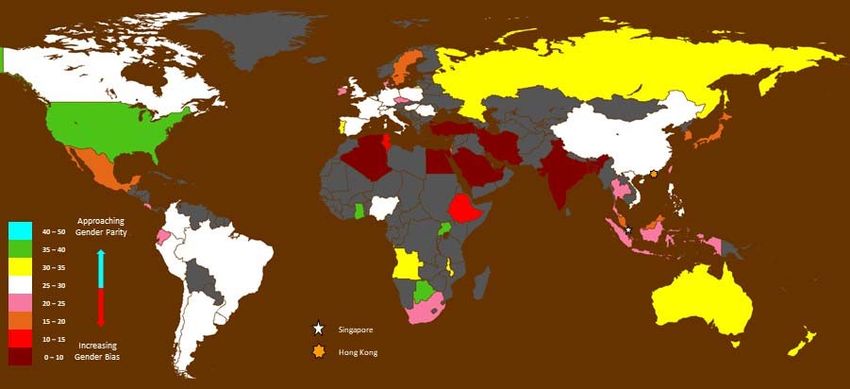
TABLE OF CONTENTS

1.0 INTRODUCTION
        1.1 Mastercard Index of Women Entrepreneurs 2019 Summary
        1.2 Description of Indicator and Sources
        1.3 Key Changes to Sub‐Indicators

2.0 OVERVIEW OF KEY FINDINGS
       2.1 Benchmark: Women Business Owners
       2.2 Results of The Mastercard Index of Women Entrepreneurs (2019)
       2.3 Component A: Women’s Advancement Outcomes
       2.4 Component B: Knowledge Assets & Financial Access
       2.5 Component C: Supporting Entrepreneurial Conditions

3.0 EXPECTATIONS OF WOMEN’S PROGRESS AS BUSINESS OWNERS

4.0 CONCLUSION

5.0 CASE STUDIES OF SELECTED MARKETS
       5.1 The United States
       5.2 Canada
       5.3 Ireland
       5.4 New Zealand
       5.5 Switzerland
       5.6 Singapore
       5.7 The United Kingdom
       5.8 Sweden
       5.9 France
       5.10 United Arab Emirates

2|P a g e                          M a s t e r c a r d   I n d e x   o f   W o m e n   E n t r e p r e n e u r s   2 0 1 9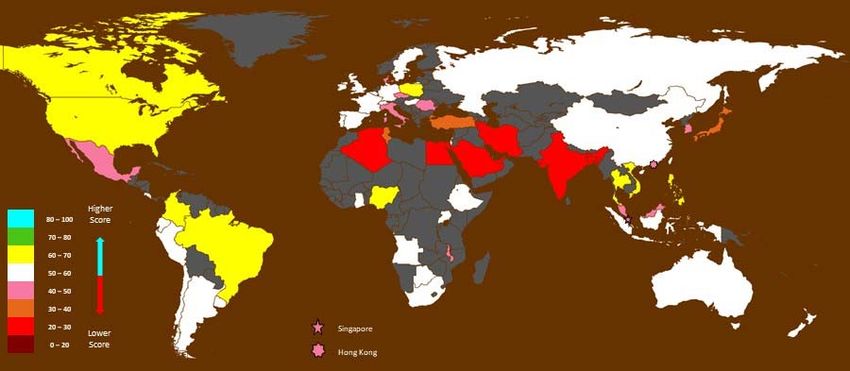
1.   INTRODUCTION

     1.1. Mastercard Index of Women Entrepreneurs 2019 Summary

     Now in its third year, the annual Mastercard Index of Women in Entrepreneurs (MIWE) continues to provide invaluable
     insights into the progress and achievements of women in business. Despite many challenges, female entrepreneurs are
     opening successful businesses faster than ever before, and MIWE brings to the forefront the broad set of variables
     propelling this dynamism, globally.

     This year’s report is a tale of two halves. At one end, it reaffirms the idea of opportunity‐driven entrepreneurial activity;
     where high‐income, advanced economies, with open and vibrant markets that support SMEs and ease of doing business,
     such as the US, New Zealand, Canada, Australia, Ireland, Switzerland and Singapore provide highly conducive and enabling
     conditions that helps fuel women as business owners. And at the other end of the spectrum, MIWE challenges some
     perceptions, and lays bare the necessity‐driven entrepreneurial activities which has led to a surge in female entrepreneurs
     in markets such as Uganda, Ghana and Botswana. Today, these markets have more women in business as a percentage of all
     business owners than any developed market.

     Except for 7 markets, the report confirms that gender inequality is ubiquitous but manifests across markets in differing
     ways. It also reveals that even markets with high overall index scores, still have other gender disparities to contend with,
     such as the income gap between women and men business owners.

     Spanning 58 markets and representing nearly 80 percent of the world’s female labor force, MIWE deploys three
     components to examine these economies ‐ (i) Women’s Advancement Outcomes, (ii) Knowledge Assets & Financial Access,
     (iii) and Supporting Entrepreneurial Conditions ‐ made up of several indicators.

     As well as key economic factors, MIWE explores social and cultural barriers to entry. It interrogates factors such as fear of
     failure, how society perceives entrepreneurial failure and risk taking, gender discrimination, lack of confidence, poor
     mentorship and networking support, affecting women in otherwise highly favourable and supportive entrepreneurial
     markets.

     In a deep‐dive of 10 markets, MIWE showcases how each of these economies are performing, the strengthen and enablers,
     constraints and the way ahead. And while each market requires a nuanced approach, these findings provides fresh thinking
     for how all governments, policymakers, stakeholders, businesses, individuals and anyone with vested interest in designing a
     better world for women can create limitless possibilities for all.

3|P a g e                                 M a s t e r c a r d   I n d e x   o f   W o m e n   E n t r e p r e n e u r s   2 0 1 9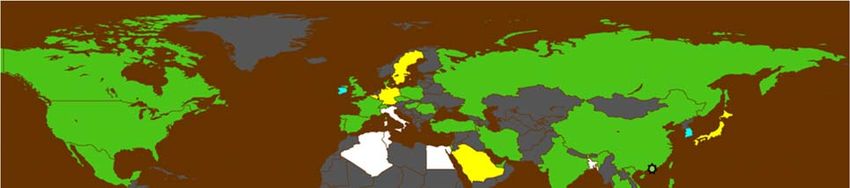
1.2. Description of Indicator and Sources

        The Mastercard Index of Women Entrepreneurs (MIWE) 2019 is the 3rd report profiling the progress and achievement of
        women entrepreneurs/business owners across 58 societies around the world. With Angola as the newest market added to
        the Middle East & Africa region, the Index expands its attempt to track the factors that underpin the gender gap among
        business owners. Representing nearly 80% of the world’s female labor force, we highlight how the 58 markets differ at 3
        levels: (i) Women’s Advancement Outcomes, (ii) Knowledge Assets & Financial Access, and (iii) Supporting Entrepreneurial
        Factors. The results also shed light on which factors and conditions are the most conducive in helping to narrow the gender
        gap among female entrepreneurs/business owners, or the most inhibitive and disabling, thereby weighing on women’s ability
        to thrive in business.

        1.3. Key Changes to Sub‐Indicators

        Women Business Owners (as % of Total Business Owners)1 is the benchmark indicator of the MIWE, which is derived from
        the 3 components, 12 indicators and 25 sub‐indicators. It should be noted that due to major changes in estimations by data
        sources as well as the replacements of 11 sub‐indicators that have been discontinued or no longer regularly updated, the
        MIWE scores in this 2019 publication should not be compared to those of previous publications.

                         Mastercard Index of Women                         Benchmarked                   Women Business Owners
                               Entrepreneurs                                  against                           (F%T)

                                                                                                                     Supporting
                                                                    Knowledge Assets &
                      Women’s Advancement                                                                          Entrepreneurial
                                                                      Financial Access                               Conditions
                          Outcomes
                                                                           (30%, 4 Indicators,
                            (40%, 4 Indicators)                                                                      (30%, 4 Indicators,
                                                                           10 sub‐indicators)
                                                                                                                     15 sub‐indicators)

                                                                   B1. Women Borrowing or
                         A1. Women Business                                                                          C1. Ease of Doing
                                                                   Saving for Business (F/M)
                            Leaders (F%T)                                                                                 Business
                                                                       (2 sub‐indicators)

                                                                         B2. Women Financial                     C2. Cultural Perceptions
                      A2. Women Professionals
                                                                            Inclusion (F/M)                     of Women Entrepreneurs
                      & Technical Workers (F%T)
                                                                          (3 sub‐indicators)                        (5 sub‐indicators)

                             A3. Women                                                                                C3. Quality of
                                                                         B3. Support for SMEs
                        Entrepreneurial Activity                                                                       Governance
                                                                          (5 sub‐indicators)
                              Rate (F/M)                                                                            (5 sub‐indicators)

                                                                      B4. Women Tertiary                           C4. Entrepreneurial
                        A4. Women Labor Force
                                                                        Education Gross                            Supporting Factors
                          Participation (F/M)
                                                                     Enrollment Rate (F/M)                          (5 sub‐indicators)

1
    Sourced from International Labor Organization, 2018
4|P a g e                                          M a s t e r c a r d    I n d e x   o f   W o m e n   E n t r e p r e n e u r s   2 0 1 9
The table below lists the 58 markets spanning five geographic (Asia Pacific, Europe, North America, Latin America, Middle East &
Africa) regions covered by the index.
1 2
Market Code Income Level Stage of Development
Asia Pacific (15)
Australia AUS High income Innovation Driven
Hong Kong SAR HKG High income Innovation Driven
Japan JPN High income Innovation Driven
Korea KOR High income Innovation Driven
New Zealand NZL High income Innovation Driven
Singapore SGP High income Innovation Driven
Taiwan (China) TWN High income Innovation Driven
Mainland China CHN Upper middle income Efficiency Driven
Malaysia MYS Upper middle income Efficiency Driven
Thailand THA Upper middle income Efficiency Driven
Bangladesh BGD Lower middle income Factor Driven
India IND Lower middle income Factor Driven
Indonesia IDN Lower middle income Factor/Efficiency Driven
Philippines PHL Lower middle income Factor Driven
Vietnam VNM Lower middle income Factor Driven
Europe (18)
Belgium BEL High income Innovation Driven
Czech Republic CZE High income Innovation Driven
Denmark DNK High income Innovation Driven
France FRA High income Innovation Driven
Germany DEU High income Innovation Driven
Hungary HUN High income Efficiency/Innovation Driven
Ireland IRL High income Innovation Driven
Italy ITA High income Innovation Driven
Poland POL High income Efficiency/Innovation Driven
Portugal PRT High income Innovation Driven
Spain ESP High income Innovation Driven
Sweden SWE High income Innovation Driven
Switzerland CHE High income Innovation Driven
United Kingdom GBR High income Innovation Driven
Israel ISR High income Innovation Driven
Romania ROU Upper middle income Efficiency/Innovation Driven
Russia RUS Upper middle income Efficiency/Innovation Driven
Turkey TUR Upper middle income Efficiency/Innovation Driven
North America (2)
Canada CAN High income Innovation Driven
United States USA High income Innovation Driven
Latin America (9)
Chile CHL High income Efficiency/Innovation Driven
Uruguay URY High income Efficiency/Innovation Driven
Argentina ARG Upper middle income Efficiency Driven
Brazil BRA Upper middle income Efficiency Driven
Colombia COL Upper middle income Efficiency Driven
Costa Rica CRI Upper middle income Efficiency Driven
Ecuador ECU Upper middle income Efficiency Driven
Mexico MEX Upper middle income Efficiency/Innovation Driven
Peru PER Upper middle income Efficiency Driven
Middle East & Africa (13)
Saudi Arabia SAU High income Factor/Efficiency Driven
United Arab Emirates ARE High income Innovation Driven
Algeria DZA Upper middle income Factor/Efficiency Driven
*Angola AGO Upper middle income Efficiency Driven
Botswana BWA Upper middle income Factor/Efficiency Driven
Islamic Republic of Iran IRN Upper middle income Efficiency Driven
South Africa ZAF Upper middle income Efficiency Driven
Egypt EGY Lower middle income Factor/Efficiency Driven
Ghana GHA Lower middle income Factor Driven
Nigeria NGA Lower middle income Factor Driven
Tunisia TUN Lower middle income Efficiency Driven
Ethiopia ETH Low income Factor Driven
Malawi MWI Low income Factor Driven
Uganda UGA Low income Factor Driven
Notes: * Angola is the newest market added to the MEA region in the 2019 MIWE publication. 1 World Bank GNI Per Capita Income Classifiers. 2 World Economic
Forum Stage of Development Classifiers
5|P a g e M a s t e r c a r d I n d e x o f W o m e n E n t r e p r e n e u r s 2 0 1 9
BENCHMARK
                                                                                             Description
             Indicator
                                                                                           (Source, Period)
                                      ‐Women Business Owners as a % of Total Business Owners
                                      ‐Measures the bias against women compared to men as business owners defined as owners who employ at least one
  Women Business Owners (F%T)
                                      employee other than themselves
                                      (International Labor Organization, 2018)
 Component A: Women’s Advancement Outcomes
                                                                                             Description
             Indicator
                                                                                           (Source, Period)
                                      ‐ Women Business Leaders as a % of Total Business Leaders
                                      ‐ Measures the bias against women compared to men as business leaders defined as general and corporate managers
A1. Women Business Leaders (F%T)
                                      who manage enterprises or their internal departments on the behalf of the proprietor.
                                      (International Labor Organization, 2018)
                                      ‐ Women Professionals & Technical Workers as a % of Total Professionals & Technical Workers
    A2. Women Professionals
                                      ‐ Measures the bias against women compared to men as Professionals, Associate Professionals and Technicians.
    & Technical Workers (F%T)
                                      (International Labor Organization, 2018)
                                      ‐ Total early‐stage Entrepreneurial Activity (TEA) of Females in the Female Working Age Population as % of TEA of Males
                                      in the Male Working Age Population
    A3. Women Entrepreneurial         ‐ Measures the bias against women compared to men in early stage entrepreneurial activity which assesses the percent
        Activity Rate (F/M)           of working age population both about to start an entrepreneurial activity, and that have started one for a maximum of
                                      3 and a half years.
                                      (Global Entrepreneurship Monitor, 2009‐2018)
                                      ‐ Female Workforce Participation Rate/Male Workforce Participation Rate
      A4. Women Labor Force           ‐ Measures the bias against women compared to men in the workforce defined as the proportion of a market’s
        Participation (F/M)           female/male working‐age population that engages actively in the labor market, either by working or looking for work
                                      (International Labor Organization, 2018)

 Component B: Knowledge Assets and Financial Access

                                                                                             Description
             Indicator
                                                                                           (Source, Period)

 B1. Women Borrowing or Saving        Composite of 2 sub‐indicators of %F/%M who Borrowed or Saved for Business
       for Business (F/M)             (World Bank, Global Findex Database, 2017)
                                      Denotes the percentage of 15+ years old female divided by % of 15+ years old male respondents who report borrowing
     % of Females/% of Males
                                      any money in the past 12 months (by themselves or together with someone else) to start, operate, or expand a farm or
    who borrowed for business
                                      business
     % of Females/% of Males          Denotes the percentage of 15+ years old female divided by % of 15+ years old male respondents who report saving or
      who saved for business          setting aside any money in the past 12 months to start, operate, or expand a farm or business

  B2. Women Financial Inclusion       Composite of 3 sub‐indicators of %F/%M with Financial Account, a Debit Card or a Credit Card
            (F/M)                     (World Bank, Global Findex Database, 2017)

     % of Females/% of Males
                                      Denotes the percentage of 15+ years old female divided by % of 15+ years old male respondents who report having an
 who have an account at a financial
                                      account (by themselves or together with someone else) at a bank or another type of financial institution.
            institution

     % of Females/% of Males          Denotes the percentage of 15+ years old female divided by % of 15+ years old male respondents who report having a
      who have a debit card           debit card.

     % of Females/% of Males          Denotes the percentage of 15+ years old female divided by % of 15+ years old male respondents who report having a
      who have a credit card          credit card.

       B3. Support for SMEs           Composite of 5 sub‐indicators of Financial Support for SMEs

 Gender bias in access to financial   Measures whether women and men have equal access to financial services by law or custom
             services                 (OECD, Gender, Institutions and Development Database, 2019)
                                      Reflects the perception of whether the physical infrastructure (roads, utilities, communications, waste disposal)
      *Physical Infrastructure
                                      provides good support for new and growing firms
          (New for 2019)
                                      (Global Entrepreneurship Monitor, 2015)
                                      Reflects perception of whether almost anyone who needs help from a government program for a new or growing
  *Government Program Support
                                      business can find what they need
         (New for 2019)
                                      (Global Entrepreneurship Monitor, 2015)
  *Single Government Agency for       Reflects perception of whether there are a wide range of government assistance for new and growing firms can be
          New Businesses              obtained through contact with a single agency
          (New for 2019)              (Global Entrepreneurship Monitor, 2015)

6|P a g e                                       M a s t e r c a r d   I n d e x   o f   W o m e n   E n t r e p r e n e u r s   2 0 1 9
*Effective Government Programs        Reflect Perception of whether Government programs aimed at supporting new and growing firms are effective
          (New for 2019)               (Global Entrepreneurship Monitor, 2015)

  Note: * The 4 sub‐indicators listed above under “B3. Support for SMEs”, namely, Physical Infrastructure, Government Program Support, Single Government
  Agency for New Businesses, and Effective Government Programs are NEW. They replaced the previous sub‐indicators from the 2018 iteration of the MIWE
  Report (Availability of Finance Programs for Women, SME training & development programs, Ease of Access to Loans, and Affordability of Financial Services).

                                       Gross female enrollment at the tertiary level as a percentage of tertiary age group female population (female tertiary
  B4. Women Tertiary Education
                                       GER) divided by Gross male enrollment at the tertiary level as a percentage of tertiary age group male population (male
   Gross Enrollment Rate (F/M)
                                       tertiary GER) (UNESCO, 2012‐2016 projected to 2017)

 Component C: Entrepreneurial Supporting Conditions

                                                                                                Description
               Indicator
                                                                                                 (Source)

                                       Measures the gap between an economy’s business regulation environment and the best practice
    C1. Ease of Doing Business
                                       (World Bank, Doing Business Database, 2018)
    C2. Cultural Perceptions of
                                       Composite of 5 sub‐indicators of cultural perceptions of entrepreneurial & leadership abilities
          Entrepreneurs
     * Values Success through
                                       Reflects perception that national culture is highly supportive of individual success achieved through own personal
          Personal Effort
                                       efforts (Global Entrepreneurship Monitor, 2015)
          (New for 2019)
    * Values Personal Initiative       Reflects perception that national culture emphasizes self‐sufficiency, autonomy, and personal initiative (Global
          (New for 2019)               Entrepreneurship Monitor, 2015)
      * Culture of Risk Taking         Reflects perception of whether the national culture encourages entrepreneurial risk‐taking (Global Entrepreneurship
          (New for 2019)               Monitor, 2015)
       * Values Creativity &
                                       Reflects Perception of whether national culture encourages creativity and innovativeness (Global Entrepreneurship
          Innovativeness
                                       Monitor, 2015)
          (New for 2019)
      * Values Individuality &         Reflects Perception of whether national culture emphasizes the responsibility that the individual (rather than the
           Independence                collective) has in managing his or her own life
          (New for 2019)               (Global Entrepreneurship Monitor, 2015)

  Note: * The 5 sub‐indicators listed above under “C2. Cultural Perceptions of Entrepreneurs”, namely, Values Success through Personal Effort, Values
  Personal Initiative, Culture of Risk Taking, Values Creativity & Innovativeness, and Values Individuality & Independence are NEW. They replaced the previous
  5 sub‐indicators from the 2018 iteration of the MIWE Report (Ability of women to rise to positions of leadership, Social acceptability of female
  entrepreneurship, Social Encouragement of female entrepreneurship, Gender bias in exposure to good business opportunities, and Gender bias in
  entrepreneurial knowledge and skills)
                                       Composite of 5 governance sub‐indicators
     C3. Quality of Governance
                                       (World Bank, World Governance Indicators, 2017)
                                       Reflects perceptions of the quality of public services, the quality of the civil service and the degree of its independence
     Government Effectiveness          from political pressures, the quality of policy formulation and implementation, and the credibility of the government's
                                       commitment to such policies.
                                       Reflects perceptions of the quality of public services, the quality of the civil service and the degree of its independence
         Regulatory Quality            from political pressures, the quality of policy formulation and implementation, and the credibility of the government's
                                       commitment to such policies.
  Political Stability and Absence of
                                       Measures perceptions of the likelihood of political instability and/or politically‐motivated violence, including terrorism.
         Violence/Terrorism
                                       Reflects perceptions of the extent to which public power is exercised for private gain, including both petty and grand
       Control of Corruption
                                       forms of corruption, as well as "capture" of the state by elites and private interests.

  C4. Entrepreneurial Supporting
                                       Composite of 5 sub‐indicators on Entrepreneurial Supporting Factors
              Factors

   *New Business Market Entry          Reflects perception of whether new and growing firms can easily enter new markets
        (New for 2019)                 (Global Entrepreneurship Monitor, 2015)

        * Skilled Employees            Perception of how easy it is to find skilled employees
           (New for 2019)              (WEF, Global Competitiveness Report, 2018)

  Intellectual Property Protection     Perceived extent of intellectual property protection (WEF, Global Competitiveness Report, 2018)
            Property Rights            Perceived extent of protection of property rights, including financial assets (WEF, Global Competitiveness Report, 2018)
          * Attitudes toward
        Entrepreneurial Failure        Perceived attitude toward entrepreneurial failure (WEF, Global Competitiveness Report, 2018)
            (New for 2019)

    Note: * The 3 sub‐indicators listed above under “C4. Entrepreneurial Supporting Factors”, namely, New Business Market Entry, Skilled Employees, and
    Attitudes toward Entrepreneurial Failure are NEW. They replaced the previous 3 sub‐indicators from the 2018 iteration of the MIWE Report (New
    Business Government Programs, Quality of the Education System, and Intensity of Local Competition).

7|P a g e                                        M a s t e r c a r d   I n d e x   o f   W o m e n    E n t r e p r e n e u r s   2 0 1 9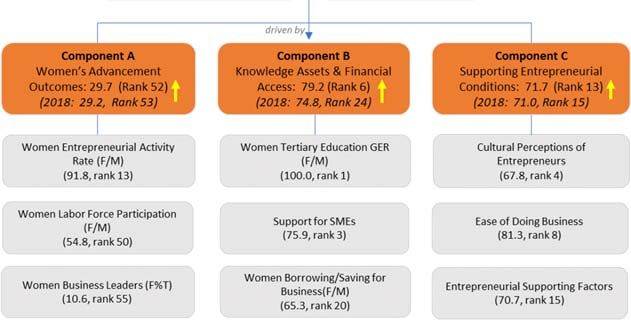
Supporting Data

                                                                                            Description
             Indicator
                                                                                             (Source)

                                      Total early‐stage Entrepreneurial Activity (TEA) of Females in the Female Working Age Population and TEA of Males in
                                      the Male Working Age Population.
   Entrepreneurial Activity Rate
        (Male and Female)             TEA is the percent of the working age population that is about to start an entrepreneurial activity, or that has started
                                      one for a maximum of 3 and a half years.
                                      (Global Entrepreneurship Monitor, 2009‐2018)
                                      Percentage females or males involved in female or male Total early‐stage Entrepreneurial Activity (TEA) respectively
 Necessity Driven Entrepreneurship
                                      who are involved in entrepreneurship because they had no other option for work
        (Male and Female)
                                      (Global Entrepreneurship Monitor, 2009‐2018)

                                      Percentage females or males involved in female or male Total early‐stage Entrepreneurial Activity (TEA) respectively
        Opportunity Driven            who (i) claim to be driven by opportunity as opposed to finding no other option for work; and (ii) who indicate the main
         Entrepreneurship             driver for being involved in this opportunity is being independent or increasing their income, rather than just
        (Male and Female)             maintaining their income
                                      (Global Entrepreneurship Monitor, 2009‐2018)

    Parliament Representation         Women or Men in Parliament as % of Total Parliament Members
        (Male and Female)             (Inter‐parliamentary Union, 2018)

                                      Female Workforce Participation Rate or Male Workforce Participation Rate
     Labor Force Participation        Where workforce participation rate is defined as the proportion of a market’s female/male working‐age population that
        (Male and Female)             engages actively in the labor market, either by working or looking for work
                                      (International Labor Organization, 2018)

  Employees as % of Labor Force
                                      Female or Male employees as a % of Female or Male Labor Force respectively‐ (International Labor Organization, 2017)
       (Male and Female)

Tertiary Education Gross Enrollment   Gross female or male enrollment at the tertiary level as a percentage of tertiary age group female or male population
                Rate                  respectively
         (Male and Female)            (UNESCO, 2012‐2018 projected to 2018)

    Secondary Education Gross         Gross female or male enrollment at the secondary level as a percentage of secondary age group female or male
         Enrollment Rate              population respectively
        (Male and Female)             (UNESCO, 2012‐2018 projected to 2018)

8|P a g e                                       M a s t e r c a r d   I n d e x   o f   W o m e n   E n t r e p r e n e u r s   2 0 1 9
2. OVERVIEW OF KEY FINDINGS
The results from the Mastercard Index of Women Entrepreneurs (MIWE) 2019 echoed a positive correlation with the Benchmark
Women Business Owners. Women in the United States, New Zealand, and Canada took the reins as the top 3 MIWE performers,
displaying admirable and distinct traits of high women business ownership fueled by highly supportive and conducive
entrepreneurial factors. Of the 58 markets, American women outperformed all global peers, topping the MIWE chart in 1st spot
(score of 70.3) driven by an increase in ‘Women Entrepreneurial Activity Rate (F/M)’ from 64.1% in 2018 to 76.8% in the latest
2019 data. Women in New Zealand continued to make astounding strides in the business world, securing 2nd spot in the MIWE
(score of 70.2, only marginally lower than US’s score of 70.3) against a backdrop of very supportive entrepreneurial conditions.
This likely played an instrumental role in promoting women’s role in society as business owners (around 3 out of every 10 business
owners are female). In 3rd place, Canadian women are among the most highly represented globally as professionals and technical
workers (57.6, rank 4), and are best placed in terms of access to financial services and products (100.0, rank 1) and quality of
governance (95.0, rank 3). The latest results also point to an increase in female entrepreneurial activity rate (up from 15.0% in
2017 to 17.0% in 2018) in Canada, contrasting the decline in men’s engagement in entrepreneurial activity from 22.6% in 2017 to
20.4% in 2018.
Based on the latest updates from the International Labor Organization, women’s share of the business world for 2018 (Women
Business Owners F%T) remained broadly unchanged with only slight variations noted in a few markets: UAE (up 6.5% from 7.2 in
2017 to 7.7 in 2018), Costa Rica (up 3.2% from 20.9 in 2017 to 21.6 in 2018), Tunisia (up 3.0% from 10.6 to 10.9), and Bangladesh
(up 3.0% from 4.2 to 4.4).
It is encouraging to note women achieving gender equality in entrepreneurial activity rate in 7 markets (1 more than the previous
year), including Ecuador, Indonesia, Philippines, Vietnam, Ghana, Nigeria, and Uganda. This suggests that in these economies,
women are just as inclined as men to engage in entrepreneurship.
In terms of ‘Component A: Women’s Advancement Outcomes’ as a measure of women’s ability to thrive as business leaders,
professional & technical workers, entrepreneurs, and labor force participants, women in Asia Pacific continue to make strong
strides with 4 markets assuming the top 10 positions: Philippines (score of 65.7, rank 1), Thailand (rank 4), Vietnam (60.5, rank 7),
and New Zealand (59.7, rank 10).
In terms of ‘Component B: Knowledge Assets & Financial Access’ as a proxy of women’s inclination to borrow or save to start a
business, women’s access to financial services and products as well as tertiary education, the latest findings showed women in
Asia Pacific taking a prominent lead, with Malaysia, Singapore, Korea and Vietnam assuming 1st, 2nd, 3rd, and 5th spots, respectively.
Women in these markets are driven by high access to financial products and services, strong support for SMEs, and high
opportunities to tertiary education. The results also showed women in European markets such as Ireland, Switzerland, the UK,
France and Denmark positioned strongly in Component B: Knowledge Assets & Financial Access, fueled by very supportive and
enabling underlying conditions for SMEs, and high access to financial services and products. While women in most markets are
equally or nearly as likely as men to be enrolled in tertiary education, those in the Middle East & North African (MENA) lower‐
income markets such as Ethiopia, Malawi, Uganda, Angola, Ghana, and Nigeria continue to be marginalized with very low
opportunities for higher‐level education.
In terms of Component C: Supporting Entrepreneurial Conditions, women entrepreneurs in Asia Pacific, Europe and North
America are driven by favorable and enabling conditions such as high ease of doing business, positive cultural and social regard
for entrepreneurship, high quality of governance, availability of skilled employees, proper business regulations and procedures
such as intellectual property protection, and ease of market entry for new businesses.
Replacement of Sub‐Indicators
It should be noted that 12 sub‐indicators from the indicators ‘Support for SMEs’, ‘Cultural Perceptions of Entrepreneurs’ and
‘Entrepreneurial Supporting Factors’ have been replaced since the previous iteration of the MIWE 2018 as they have been
discontinued by the sources or are no longer being regularly updated. Therefore, the data and rankings for this 2019
publication should not be compared with the previous 2 years’ publication.
9|P a g e M a s t e r c a r d I n d e x o f W o m e n E n t r e p r e n e u r s 2 0 1 9
Table 1: Sub‐Indicators that have been replaced
Previous Sub‐Indicator that has been Replaced due to New Sub‐Indicator
Discontinuity by Sources
Availability of Finance Programs for Women Physical Infrastructure
SME Training & Development Programs Government Program Support Sub‐indicators for
Ease of Access to Loans Single Government Agency for New Businesses ‘Support for SMEs’ –
Component B
Affordability of Financial Services Effective Government Programs
Ability of women to rise to positions of leadership Values Success through Personal Effort
Social acceptability of female entrepreneurship Values Personal Initiative
Sub‐indicators for
Social encouragement of female entrepreneurship Culture of Risk taking ‘Cultural Perceptions
of Entrepreneurs’ –
Gender bias in exposure to good business opportunities Values Creativity and Innovativeness Component C
Gender bias in entrepreneurial knowledge and skills Values individuality and Independence
New Business Government Programs New Business Market Entry Sub‐indicators for
‘Entrepreneurial
Quality of the Education System Ease to find Skilled Employees Supporting Factors’ –
Intensity of Local Competition Attitudes toward Entrepreneurial Failure Component C
Components that Changed the Most
Of the 3 MIWE Components, Component A: Women’s Advancement Outcomes recorded the most changes from the
previous year due to fluctuations in the sub‐indicator ‘Women Entrepreneurial Activity Rate (F/M)’. As a proxy of bias
against women in early‐stage entrepreneurial activities, the results pointed to sharp declines in some markets across all
regions, suggesting a widening in gender gap. These markets included:
Table 2: Markets with sharp widening in gender gap for entrepreneurial activity rate
Market Decline in Women Entrepreneurial Activity Rate – F/M
Mexico down ‐35.6% from gender parity 100.0 to 64.4
Sweden down ‐35.0% from 64.8 to 42.1
Saudi Arabia down ‐30.4% from 83.1 to 57.8
Iran down ‐22.7% from 65.2 to 50.4
Singapore down ‐22.0% from 61.9 to 48.3
India down ‐21.9% from 79.6 to 62.1
In contrast, a narrowing in gender divide was observed in:
Table 3: Markets with sharp narrowing in gender gap for entrepreneurial activity rate
Market Increase in Women Entrepreneurial Activity Rate – F/M
France up 73.5% from 43.6 to 75.7
Taiwan (China) up 53.1% from 56.4 to 86.3
Indonesia up 44.3% from 69.3 to 100.0
Japan up 38.6% from 43.1 to 59.7
Costa Rica up 36.8% from 69.0 to 94.5
Italy up 31.5% from 38.7 to 50.9
Canada up 25.6% from 66.4 to 83.3
United States up 19.9% from 64.1 to 76.8
In Ecuador, Indonesia and Uganda, an increase in women’s participation in entrepreneurial activities brought them at par
with men (‘Women Entrepreneurial Activity Rate F/M’ = 100.0). Meanwhile, improvements in Angola, Malawi, Costa Rico,
Thailand, UAE, and Taiwan (China) also helped narrow gender disparity.
10 | P a g e M a s t e r c a r d I n d e x o f W o m e n E n t r e p r e n e u r s 2 0 1 9 Gender Bias
The latest results also showed gender bias to be most pronounced in Component A: Women’s Advancement Outcomes,
especially with regards to women’s ability to rise in society as business leaders, professional and technical roles,
entrepreneurs, and labor force participants.
Specifically, women’s role as business leaders remained particularly low in the following regions and markets:
Table 4: Markets with Low Women Business Leaders Representation
Region Low Women Business Leaders (Female as % of Total)
Asia Pacific
Bangladesh 10.6%
India 14.3%
Japan 12.0%
Korea 12.4%
Middle East & Africa
Saudi Arabia 6.7%
United Arab Emirates 10.6%
Egypt 6.5%
Tunisia 14.5%
Malawi 14.6%
Europe
Turkey 15.7%
Women’s labor force participation rate remained particularly low in MEA markets such as Saudi Arabia (29.5%), UAE (54.8%),
Iran (23.6%), and Algeria (22.1%), and Turkey (46.2%) in Europe.
Correlation between Progress as Entrepreneurs & Wealth/Advancement of Economies
The latest results from MIWE 2019 reaffirmed the trend that female business owners/entrepreneurs appear to flourish in
high‐income and advanced economies such as the US, New Zealand, Canada, Australia, Ireland, Switzerland and Singapore
where the component scores for women’s advancement, women’s knowledge assets and financial access, and underlying
entrepreneurial conditions are higher. In these open and vibrant markets where the support for SMEs and ease of doing
business are high, women tend to make further inroads in the business world and are able to establish a more prominent and
empowered standing in society as business leaders and owners and active contributors to the economy (high labor force
participation rates). For instance, out of the top 20 MIWE ranking markets, 80% are high income economies (e.g. US and New
Zealand), 10% are upper middle income (e.g. Thailand and Columbia), and the remaining 10% lower middle income (e.g.
Philippines and Vietnam).
In contrast, markets that scored and ranked lower in the MIWE 2019 results tend to be less wealthy and developed and are
concentrated in the Middle East and North African region. In these markets such as Uganda, Malawi, Egypt, Saudi Arabia,
Ethiopia, Iran, Algeria and the UAE, the conditions for women to advance as entrepreneurs and business leaders and
professionals are considerably less enabling, such as: (i) restraining social barriers that make women entrepreneurs less
accepted/regarded in society; (ii) restrictive financial barriers that prevent women from obtaining funding for business
startups due to lack of collateral; and (iii) biased economic systems whereby women are sidelined in the workplace.
Anomalies/Outliers
The results show women’s advancement as business owners/entrepreneurs in certain markets to be way ahead of their global
and regional peers. These are predominantly low, lower‐middle or upper‐middle income and less developed economies in
the MEA region such as Uganda, Malawi, Angola, Ghana, Botswana, and Nigeria, where women appear to thrive in the
business world in spite of weaker supportive entrepreneurial conditions, and less knowledge assets and financial access. For
instance, Angola, the newest market added to the MIWE, demonstrate unique traits whereby women’s business ownership
rates (F%T) and women’s entrepreneurial activity rates (F/M) are ranked very highly at 9th and 8th, respectively, despite lagging
markedly in Component B: Knowledge Assets & Financial Access and Component C: Entrepreneurial Supportive Factors. In
11 | P a g e M a s t e r c a r d I n d e x o f W o m e n E n t r e p r e n e u r s 2 0 1 9addition, women’s labor force participation rate is nearly at par with men (F/M: 94.2%, rank 1). There are various reasons
why this may be the case.
From an economic perspective, employment prospects are very poor in Angola with the jobless rates averaging around 20%
in 2018. Growth dynamics have also been sluggish with annual GDP growth rates disappointing in the contractionary zone (‐
0.1% in 2017 and ‐1.7% in 2018), dragged by declines in the market’s all‐important oil sector and muted growth in other core
sectors such as agriculture, trade, construction and production of minerals and diamonds. Given these tough conditions,
women may be pressed to seek work in the labor force to help supplement family/household income or support oneself, thus
the high female labor force participation rate of 75.4% compared to 80.1% for men. Data also showed women are not only
nearly at par with men to be engaged in entrepreneurial activities (F/M: 99.3%, rank 8), of those who are entrepreneurs,
nearly half are driven out of necessity (49.5% compared to 27.5% for men). This could be due to several reasons: (i) lack of
employment opportunities given the high national jobless rate of 20%, and (ii) very low female tertiary education gross
enrollment rate of 8.5% suggests that most are not qualified to work and are forced to start small businesses for a living.
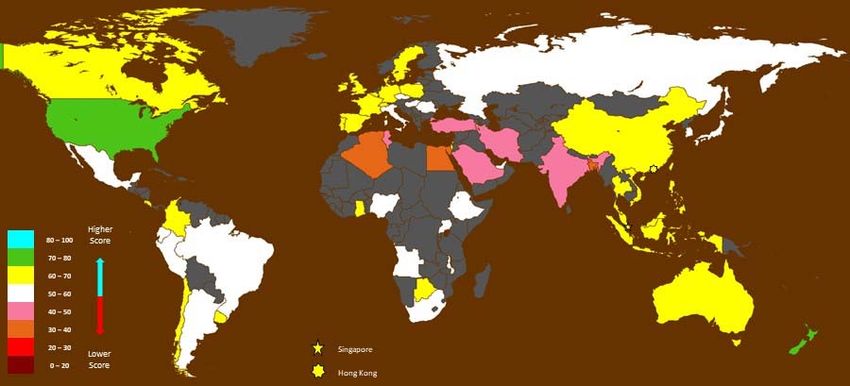
2.1. BENCHMARK: WOMEN BUSINESS OWNERS
Women Business Owners (Female Owners as a percentage of Total Business Owners, F%T)2 is the benchmark indicator of the
Mastercard Index of Women Entrepreneurs 2019 (MIWE). The map below depicts the latest women’s business ownership across
the 58 markets measured.
Despite being less wealthy, less developed and lagging in terms of knowledge assets, financial access and supporting
entrepreneurial conditions, the MEA markets of Uganda (38.2%, rank 1), Ghana (37.9%, rank 2), Botswana (36.0%, rank 3), Malawi
(31.1%, rank 7) and Angola (30.3%, rank 9) are positioned among the top 10 globally in terms of Women’s Business Ownership
Rates (F%T). For instance, in the leading markets of Uganda and Ghana, nearly 4 in every 10 business owners are female. These
markets are ranked very low in the Mastercard Index of Women Entrepreneurs 2019, largely due to inhibitive factors such as poor
quality of governance, low women financial inclusion (F/M), poor support for SMEs, less opportunities for women to rise in the
workplace as business leaders and professionals/technicians due to generally lower prospects for tertiary education, and higher
barriers to business.
According to research findings from the World Bank, women in MEA are generally marginalized in the following ways:i
Disparity in access to the Internet & Technology
Institutional barriers to accessing funding such as high interest rates, lack of collateral guarantees, complicated process
and lack of business track record to secure financing
Restrictive cultural and social norms among Arab societies whereby women business owners are often restricted by
family or cultural expectations that impede them from accessing the financial and business services they need to help
drive their business ventures
Lack of confidence needed to deal with the region’s bureaucracies and financial institutions because of hostility and
criticism they receive from communities.
Yet, despite being undermined by the prevalence of such persistent and widespread disparities and inequalities, women’s
determination to start their own business in these lower income and factor‐driven MEA markets cannot be overlooked. In fact,
the results show women in 3 markets being equally driven as men to pursue entrepreneurial activities (F/M of 100.0), and nearly
at par in 2 markets (Angola and Malawi with F/M ratios of 99.3 and 94.5, respectively). More importantly, it brings to light how
much more women can contribute economically and socially if such barriers are removed, or systems improved.
2
International Labor Organization (ILO), 2018
12 | P a g e M a s t e r c a r d I n d e x o f W o m e n E n t r e p r e n e u r s 2 0 1 9High rates of women business ownership ranging between 30% to 35% are also found in other regions highlighted in yellow color on the map such as North America (United States, 35.1%) and Asia Pacific (New Zealand, 31.8%). WBO rates are also quite high across most European markets (indicated in white color on the map) such as: Portugal (30.2%), Spain (29.9%) and Hungary (28.4%). In general, the high representation of female business owners in these European markets appear to be positively correlated to high women business leadership (F%T), high women tertiary education gross enrolment rate (F/M), fairly strong women labor force participation rate (F%T), as well as good quality of governance, ease of doing business and entrepreneurial supporting factors. These markets are also ranked highly in the Mastercard Index of Women Entrepreneurs 2019. 13 | P a g e M a s t e r c a r d I n d e x o f W o m e n E n t r e p r e n e u r s 2 0 1 9
Meanwhile, women business ownership of between 20‐25% (pink) are scattered across the globe in Latin America (Colombia and
Costa Rica), MEA (South Africa), Asia Pacific (Indonesia and Thailand), and Europe (Denmark, Ireland, and Czech Republic). Finally,
economies where WBO rates are very low of between 10 to 20% (shaded in red and orange) are scattered across all regions with
the lowest situated in MEA and Asia: Saudi Arabia (WBO 1.6%), Egypt (4.1%), Bangladesh (4.4%). These economies also scored
very poorly in the MIWE 2019 index, mostly weighed down by poor progress in women’s advancement as business leaders and
professionals, lack of access to financial service and products, and lower quality of governance.
The reverse is also observed in other markets such as Australia, Italy, Poland, Hungary, Uruguay, Belgium, Brazil, Malawi, Russia,
Peru, and Great Britain where high WBO rates are achieved irrespective of very poor or negative cultural perception of
entrepreneurship. For instance, societies in Europe such as Italy and Hungary convey notably less recognition for individual success
attained through personal effort and initiative than peers in Ireland, Portugal and Great Britain. In Italy, this could be due to the
higher fear of failure (52% compared to global and regional averages of 36% and 39%), in turn hindering further growth in Women
Business Ownership rate of 25.2% despite the availability of schemes such as the zero‐interest loans for startups and the
Guarantee Fund for SMEs (Fondo di Garanzia) which helps startups by guaranteeing 80% of a bank loan.ii
India: Low Progress in Women Business Ownership/Entrepreneurship but Some Public Initiatives being Rolled Out
In India, out of 100 business owners, only 7 is a female. In fact, data from GEM showed a ‐21.9% decline in Women
Entrepreneurial Activity Rate (F/M) from 79.6% in 2017 to 62.1% in 2018 due to an increase in men’s entrepreneurial activity
rate from 10.3% to 14.0%, leading to a widening in gender gap. Of those who started a business, half (49.9%) do so out of
necessity, rather than to pursue an opportunity – this is similar for males (44.2%). The motivation or ability to grow a business
among the adult population is very low, with only 8% expecting to create 6 or more jobs over the next 5 years – one of the
lowest rates among the 60 markets measured by GEM. This compares poorly against the global and regional averages of 21%
and 23%, respectively. This may be due to the fact that more than half of adult are risk‐averse: ‘Fear of Failure Rate’ of 50%
compared to 36% globally and 38% regionally. This is reflected in the low entrepreneurial intention rate of 21% (2018)
compared to 24% globally and 26% regionally. Despite this, India stands out for its high proportion of innovative
entrepreneurs, with nearly half report they have innovative services or products.iii
Although interest rates have been on a downward trend over the late 2018 and 2019, and the Indian government has recently
launched a 59‐minute loan platform to make access to credit for micro, small and medium enterprises (MSME) easieriv ,
women’s inclination to borrow for business purposes remained unchanged, averaging at 5.7% over 2016 to 2018. However,
there has been a slight increase in women’s tendency to save to start a business, rising from 4.5% in 2016 to 7.3% in 2018.
This suggests that for every 100 women who saved, 7 did so with the intention to use the savings to fund a business startup.
For most nascent entrepreneurs, despite the availability of a number of private equity and debt funding options, getting
funding at the onset of a business idea or early phase of an entrepreneurial pursuit is not easy. Reports showed that less than
5% of MSMEs have access to formal credit, while others rely on informal sources to fund their businesses. This may explain
the lower business ownership and low entrepreneurial activity rates.
In order to overcome the challenges of setting up business, the government has recently launched a 59‐minute loan platform
that allows for easy access to credit for micro, small and medium enterprises (MSME). Data from the World Bank “Doing
Business Database, 2018” pointed to an improvement in ‘Ease of Doing Business’ in India from 60.6 (rank 44) to 67.2 (rank
39) as well as an increase in ‘Women Financial Inclusion (F/M)’ from 58.2 (rank 51) to 69.0 (rank 43).
Opportunity versus Necessity‐Driven Entrepreneurship
In general, business ownership rates tend to be driven by perceived good opportunities whereby individuals seek to improve
their income or financial independence. However, the index findings showed that there are cases where businesses are not
always initiated on opportunistic grounds. These are found in the leading women business ownership (WBO) markets in MEA
(Uganda, Ghana, Botswana, Malawi and Angola) and in Europe (Russia and Belgium). Here, women tend to start businesses
out of necessity, especially in Ghana, Botswana, Russia, Malawi, Angola and Brazil where around 4 in 10 entrepreneurs are
driven into business out of necessity. In developed markets such as Australia, Hungary, UK, Switzerland, Canada, Belgium and
the US, high fear of failing rates (above 35%) do not appear to deter women from wanting to improve their income or financial
situations. In these markets, more than 7 out of every 10 entrepreneurs are driven by opportunities.
14 | P a g e M a s t e r c a r d I n d e x o f W o m e n E n t r e p r e n e u r s 2 0 1 9The findings also showcased women’s ability to thrive as business owners and pursue opportunities even where cultural and
social conditions are not optimal. These are demonstrated in Spain, Brazil, Uruguay, and Hungary where WBO rates and
Improvement‐Driven Opportunity entrepreneurial tendencies are both high in spite of the lack of cultural acceptance/social
encouragement. In the United States, New Zealand, Canada, UK, Vietnam and Switzerland, high WBO rates are consistent
with high tendencies to pursue opportunities and positive regard for entrepreneurship. In the leading markets of Uganda,
Ghana, and New Zealand, women are able to thrive in the business world due to amicable social conditions and very low fear
of failure.
Table 5: Correlation between Markets with High WBO Rates & Other Entrepreneurial Conditions
Markets with High WBO Improvement‐Driven Necessity‐Driven Fear of Failing Cultural Perception
WBO Rates Rates (%) Opportunity Entrepreneurial Rate of Entrepreneurs
Entrepreneurial (Relative Prevalence) (%) (Index Score)
(Relative Prevalence)
Uganda 38.2 54.2 18.9 12.6 67.2
Ghana 37.9 44.1 33.3 24.6 63.1
Botswana 36.0 50.1 35.6 18.9 51.9
United States 35.1 78.3 8.1 35.2 75.6
New Zealand 31.8 78.9 7.2 22.0 61.6
Russia 31.2 54.2 39.8 46.4 55.1
Malawi 31.1 29.4 43.7 15.1 48.3
Australia 30.9 82.2 16.8 41.4 52.9
Angola 30.3 57.0 38.8 16.6 57.6
Portugal 30.2 77.7 20.8 38.1 58.0
Spain 29.9 70.7 22.6 36.2 48.9
Brazil 28.9 61.8 37.5 32.6 43.2
Uruguay 28.8 66.3 29.4 27.4 39.9
Hungary 28.4 77.4 20.1 43.2 35.8
Poland 28.0 90.9 8.4 31.1 48.6
United Kingdom 27.9 84.2 12.9 37.7 59.4
Belgium 27.8 44.3 27.5 48.9 45.7
Peru 27.7 73.2 23.1 30.2 55.2
Canada 27.3 79.3 13.7 42.3 66.2
Vietnam 27.0 84.2 15.9 46.6 60.4
Switzerland 26.6 87.1 7.4 39.9 65.3
Source: GEM 2018 Adult Population Survey
Inter‐Regional Differences in WBO
The results showed that there are inter‐regional differences in women’s ability to succeed in the business world. This is
most apparent in Middle East and Africa (MEA) and Asia Pacific. While women outperform as business owners in MEA markets
such as Uganda, Ghana, Botswana, Malawi and Angola, their regional peers in Saudi Arabia, Egypt, Iran, Algeria, UAE, Tunisia
and Ethiopia trail substantially with very low WBO rates of 15% and below. These markets tend to have very poor scores for
all 3 components, especially in terms of women’s role as business leaders, professionals/technical workers, active labor force
participants, and their ability to have fair access to financial services and products. Similarly, in Asia Pacific, women in New
Zealand, Australia and Vietnam surpass their regional peers such as Bangladesh, India, Malaysia, South Korea and Japan in
terms of their share of the female business world.
Changes in WBO Score & Ranking: 2018 to 2019
Table 6 below shows that over the past 12 months, the Women Business Ownership Rate (F%T) scores and rankings of the
58 markets remained broadly unchanged. An increase of 2% or more was observed in 4 markets: Tunisia (up 3.0% from 10.6
in 2018 to 10.9 in 2019), Costa Rica (up 3.1% from 20.9 to 21.6), UAE (up 6.5% from 7.2 to 7.7), and Bangladesh (up 3.0% from
4.2 to 4.4). Some markets registered marginal declines, with Saudi Arabia pulling back slightly by ‐2.8% from 1.65 to 1.60. The
overall rankings remained largely similar, with minor shifts in rankings of 1 spot in some markets. Only 3 markets posted
changes in rankings of 2 spots: Belgium (down 2 places from 15th to 17th), Algeria (down 2 from 52nd to 54th), and UAE (up 2
from 54th to 52nd).
15 | P a g e M a s t e r c a r d I n d e x o f W o m e n E n t r e p r e n e u r s 2 0 1 9Table 6: Change in Score & Ranking for Women Business Ownership (F%T) – 2018 to 2019
Women Business Owners (F%T) SCORE Women Business Owners (F%T) RANKING
Market Change in Change in
2019 2018* 2019 2018
SCORE (%) RANKING (+/‐)
Uganda 38.2 38.1 0.3 1 1 0
Ghana 37.9 37.8 0.2 2 2 0
Botswana 36.0 36.0 0.0 3 3 0
United States 35.1 35.1 ‐0.1 4 4 0
New Zealand 31.8 31.4 1.4 5 5 0
Russia 31.2 31.0 0.5 6 6 0
Malawi 31.1 31.0 0.2 7 7 0
Australia 30.9 30.8 0.2 8 8 0
**Angola 30.3 30.2 0.2 9 10 +1
Portugal 30.2 30.3 ‐0.3 10 9 ‐1
Spain 29.9 29.8 0.2 11 11 0
Brazil 28.9 28.8 0.4 12 13 +1
Uruguay 28.8 29.2 ‐1.5 13 12 ‐1
Hungary 28.4 28.4 0.0 14 14 0
Poland 28.0 27.9 0.4 15 16 +1
United Kingdom 27.9 27.8 0.4 16 17 ‐1
Belgium 27.8 28.1 ‐1.0 17 15 ‐2
Peru 27.7 27.6 0.2 18 18 0
Canada 27.3 27.3 0.0 19 19 0
Vietnam 27.0 26.6 1.1 20 20 0
Switzerland 26.6 26.6 0.0 21 21 0
Argentina 26.4 26.5 ‐0.5 22 22 0
Romania 26.4 26.4 0.0 23 24 +1
Singapore 26.3 26.5 ‐0.6 24 23 ‐1
Philippines 25.8 25.6 0.9 25 26 +1
Germany 25.7 25.6 0.3 26 25 ‐1
Mainland China 25.6 25.4 0.8 27 27 0
France 25.5 25.4 0.3 28 28 0
Nigeria 25.3 25.1 0.8 29 30 +1
Colombia 25.3 25.2 0.4 30 29 ‐1
Italy 25.2 25.0 0.5 31 31 0
Chile 25.0 24.8 0.8 32 32 0
Thailand 23.4 23.2 0.7 33 33 0
Ireland 22.9 22.9 0.0 34 35 +1
Denmark 22.7 23.0 ‐1.1 35 34 ‐1
Czech Republic 22.4 22.3 0.6 36 36 0
Ecuador 22.3 22.0 1.3 37 37 0
Costa Rica 21.6 20.9 3.1 38 39 +1
South Africa 21.5 21.4 0.5 39 38 ‐1
Indonesia 20.3 20.0 1.4 40 41 +1
Taiwan (China) 20.2 20.1 0.4 41 40 ‐1
Hong Kong SAR 19.8 19.6 0.9 42 43 +1
Sweden 19.8 19.8 0.0 43 42 ‐1
Mexico 19.0 18.9 0.7 44 45 +1
Israel 18.8 19.0 ‐0.7 45 44 ‐1
Japan 17.3 16.9 1.9 46 46 0
South Korea 16.8 16.6 1.3 47 47 0
Malaysia 16.2 16.0 1.3 48 48 0
Ethiopia 15.0 14.9 0.5 49 49 0
Tunisia 10.9 10.6 2.9 50 50 0
Turkey 9.2 9.1 1.5 51 51 0
United Arab Emirates 7.7 7.2 6.1 52 54 +2
India 7.4 7.3 1.0 53 53 0
Algeria 7.3 7.4 ‐1.1 54 52 ‐2
Islamic Republic of Iran 6.2 6.2 ‐0.4 55 55 0
Bangladesh 4.4 4.2 2.9 56 56 0
Egypt 4.1 4.0 1.6 57 57 0
Saudi Arabia 1.60 1.65 ‐2.9 58 58 0
Note: *Scores for 2018 are different from that shown in the previous year’s report due to data updates. **Angola is the newest market added to MIWE 2019
Source: International Labor Organization, 2018
16 | P a g e M a s t e r c a r d I n d e x o f W o m e n E n t r e p r e n e u r s 2 0 1 92.2. RESULTS OF THE MASTERCARD INDEX OF WOMEN ENTREPRENEURS (MIWE) The results from the Mastercard Index of Women Entrepreneurs (MIWE) 2019 reaffirmed a positive correlation with the Benchmark Women Business Owners (WBO). Women in the United States, New Zealand, and Canada topped the charts, displaying strong and distinct traits of high WBO driven by highly conducive entrepreneurial conditions. In the map below, markets colored in green and yellow are ranked highly, with WBO rates ranging from 60% to 80%. In these markets, the sub‐indicators of ‘Women Entrepreneurial Activity Rate – F/M’, ‘Support for SMEs’, ‘Ease of Doing Business’, and ‘Quality of Governance’ are quite high. 17 | P a g e M a s t e r c a r d I n d e x o f W o m e n E n t r e p r e n e u r s 2 0 1 9
For the first time since the MIWE’s 2017 publication, the United States moved to first place, fueled by a surge in women’s
entrepreneurial activity rate from 64.1% to 76.8%, and strong standing in Component C: Supporting Entrepreneurial Conditions
(especially in terms of Ease of Doing Business, Cultural perception of Entrepreneurs, and Entrepreneurial Supporting Factors).
Women in New Zealand continue to make strong strides in the business world, securing 2nd spot in the MIWE (score of 70.2, only
marginally lower than US’s score of 70.3,). Although retreating from last year’s top ranking, women in New Zealand continue to
be supported by highly enabling entrepreneurial conditions such as ‘Ease of Doing Business’ (86.6, rank 1) and ‘Quality of
Governance’ (98.4, rank 1), and high ‘Women Financial Inclusion – F/M’ (100.0, rank 1).
In 3rd place, women in Canada continue to be empowered in the business world by high financial inclusion, superior quality of
governance, and positive cultural perception of entrepreneurs. More pointedly, the simultaneous increase in women’s
entrepreneurial activity rate from 15.0% in 2017 to 17.0% in 2018 and decline in men’s activity rate from 22.6% to 20.4% helped
narrow the gender gap.
Laggards in MIWE: Middle East & Africa and Asia Pacific
The MIWE 2019 results showed markets in MEA and Asia Pacific to be the laggards on a global scale. Specifically, women in
these societies continue to be held back by lack of opportunities to assume higher‐level economic roles such as business
leaders, and professionals/technical workers. They are also severely marginalized by poor support for SMEs, low financial
inclusion, poor opportunities for tertiary education, and often restrictive and underdeveloped business and financial systems
that make doing business difficult. More importantly, women here often have to contend with social and cultural norms that
discourage them from working, being ambitious or having high status (such as owing a business), or assuming leadership
roles. For example, in Bangladesh, women are placed the weakest compared to their global peers in terms of: (i) Women
Entrepreneurial Activity Rate – F/M, 20.6, rank 58 with only 4.3% of entrepreneurs being a female; (ii) Women Financial
Inclusion – F/M (36.1, rank 58, with very few women qualified to own a credit and debit card), and (iii) Ease of Doing Business
(42.0, rank 58 due to barriers such as bureaucratic inefficiencies and corruption).
Correlation between Progress as Entrepreneurs & Wealth/Advancement of Economies
The results revealed that some of the highest women business ownership (WBO) rates are found in less wealthy and less
advanced economies. For instance, out of the top 10 markets in terms of WBO, 3 are from low income, factor‐driven
economies (Uganda, Ghana and Malawi), 3 from upper middle income, Factor or Factor/Efficiency driven markets (Russia,
Botswana, Angola), and 4 from High Income, innovation‐driven economies (United States, New Zealand, Australia and
Portugal). In the lower‐income and less developed economies where social, economic, financial and educational conditions
are less favorable and accessible to women, the need/pressure to survive or increase income sources by pursuing business
opportunities tend to be higher compared to wealthier and more advanced societies where job opportunities, access to
education and business/financial infrastructure is more widespread and prevalent. Women in these wealthier markets tend
to have access to more support in the form of government programs for SMEs, high financial inclusion, and more social
acceptance, support and recognition of women pursuing entrepreneurial activities. These markets include United States, New
Zealand, Canada, Ireland, Switzerland, Australia and Portugal tend to be ranked high in the Mastercard Index of Women
Entrepreneurs (MIWE).
Correlation between Entrepreneurial Activity (TEA) and Established Business Rates
The results also showed that although Women’s Entrepreneurial Activity Rate (F/M) is high in some economies such as Angola
(99.3%), Canada (88.3%), US (76.8%), Chile (73.1%) and Peru (87.4%), the established business rates here tend to be notably
lower, suggesting that not all startup efforts grow into mature businesses. This is observed across all income levels. Such
challenges in sustaining and growing a business could stem from competitive pressures, lack of market dynamics or demand,
or other factors such as bureaucracy, economic or political stability or corruption.v For instance, in general, total early‐stage
entrepreneurial activity rates (TEA) in Angola is around 40%, but established business rates is less than half at around 15%.
Big differences are also noted elsewhere in Chile (TEA of 25% vs around 8% established business rate), Canada (20% vs 7%),
US (16% vs 7%), mainland China (11% vs 3%), Saudi Arabia (12% vs 3%), and Israel (12% vs 4%).
Outliers – Lower & Upper Middle‐Income Markets in Asia Pacific & MEA Outperform
18 | P a g e M a s t e r c a r d I n d e x o f W o m e n E n t r e p r e n e u r s 2 0 1 9The lower‐ and upper‐middle income Asia Pacific markets of Philippines (65.1), Thailand (64.6), Vietnam (63.4), Malaysia
(62.7) Indonesia (62.1) and mainland China (60.7) impressed with relatively high MIWE scores despite being less wealthy and
developed. In these markets, women’s role as professional and technical workers (F%T), labor force participants, and
entrepreneurs is quite high. Notably, women in Indonesia, Philippines and Vietnam are at par with men in entrepreneurship
(‘Women Entrepreneurial Activity Rate – F/M’ at 100.0). They are also more likely to borrow or save for business purposes
(F/M) than their regional peers, especially in the Philippines (88.4, rank 4) and Vietnam (89.9, rank 3). In Malaysia, women
are strongly placed, driven by conducive business conditions such as high ‘Support for SMEs’ (71.5, rank 6), ‘Ease of Doing
Business’ (80.6, rank 11), positive ‘Cultural Perception of Entrepreneurs’ (63.9, rank 13), and strong ‘Entrepreneurial
Supporting Factors’ (72.2, rank 11). In mainland China, women are relatively active as entrepreneurs, and are more likely to
be driven by opportunities than their male counterparts. Although there is no gender bias in terms of tertiary education
enrolment in mainland China, their role as business leaders, professionals and technicians, and business owners is lower than
expected.
In MEA, Ghana and Botswana are the only 2 lower‐ and upper‐middle income markets ranked among the top 30 in the MIWE
2019 results. In Botswana (MIWE score 61.6, rank 28), women outshine nearly all their global peers in terms of their share of
the female business world (F%T of 36.0, rank 3). Not only this, they are nearly as ambitious as their male counterparts to
pursue business opportunities (as opposed to being necessity‐driven) in order to increase their income or financial
independence (61.9% for female against 67.9% for male). They also have a strong representation as business leaders in their
society, accounting for nearly 4 out of every 10 leaders. This is not surprising, given that women’s tertiary education gross
enrolment rate (27.3%) is higher than men’s (18.9%).
In Ghana, women continue to flourish in Component A: Women’s Advancement Outcomes, including high labor force
participation (89.0, Rank 4), women business leadership (37.2% of total, rank 11), and surpassing their male counterparts in
engaging in entrepreneurial activities (27.9% vs 23.5% for male). Their ability to thrive in these aspects explain their
particularly high standing in society as business owners (37.9%, rank 2, trailing Uganda at 38.2%), despite poor underlying
entrepreneurial supporting factors. Compared to their regional peers in Malawi, Uganda and Angola, women in Ghana tend
to be more inclined to have a bank account, likely due to their higher level of engagement in business activities. For instance,
nearly 40% of women in Ghana have an account at a bank or financial institution compared to only around 20% in Angola,
Malawi and Nigeria.
Wealthy Markets that Underperformed
Despite being wealthy nations, Saudi Arabia and the United Arab Emirates in MEA, Italy and Czech Republic in Europe, and
Japan in Asia Pacific underperformed with lower than expected MIWE scores of 56.0 points and below, trailing in the bottom
16 positions. In most of these markets, although women are at par or nearly at par with men in terms of tertiary qualifications,
they lag in terms of their ability or inclination to start businesses or rise into positions of leadership, professionals and labor
force participants. Even in highly developed markets such as Italy and Japan, the availability of support for SMEs is
considerably lower. In addition, the fear of business failure rate among adults in these 2 markets are higher than the global
average: 51.7% for Italy and 46.4% for Japan compared to the global average of 36.2% in 2018).vi In Japan, Czech Republic
and Italy, society’s perception of entrepreneurship and the quality of governance are notably less favorable compared to
other high‐income and advanced markets such as Hong Kong SAR, New Zealand and Switzerland.
High Opportunity & Capability Perceptions but Low Women Business Ownership
GEM’s 2018/19 results pointed out situations where people identified business opportunities around them, yet few are
taking the initiative to open shop. This is observed across the regions in India, Sweden, Poland, Saudi Arabia and the UAE. In
Saudi Arabia and India, high fear of business failure may explain why business startups tend to be lower.
The situation in Saudi Arabia warrants mentioning. Here, although women’s business ownership rate is the absolute lowest
compared to the other 57 markets with only an average of only 1.6% business owners being a female, in general, the
perception of opportunity and capability to start a business is very strong among the adult population aged 18 to 64:
o Perceived Opportunity Rate of 76% compared to global and regional averages of 46% and 45%, respectively, and
o Perceived Capabilities Rate of 83%, nearly double the global and regional averages of 49%.vii
19 | P a g e M a s t e r c a r d I n d e x o f W o m e n E n t r e p r e n e u r s 2 0 1 9You can also read