WP/21/4 Financial Globalization and Inequality: Capital Flows as a Two-Edged Sword
←
→
Page content transcription
If your browser does not render page correctly, please read the page content below
WP/21/4

                          Financial Globalization and Inequality:
                          Capital Flows as a Two-Edged Sword

 by Barry Eichengreen, Balazs Csonto, Asmaa El-Ganainy, and Zsoka Koczan

IMF Working Papers describe research in progress by the author(s) and are published
to elicit comments and to encourage debate. The views expressed in IMF Working Papers
are those of the author(s) and do not necessarily represent the views of the IMF, its
Executive Board, or IMF management.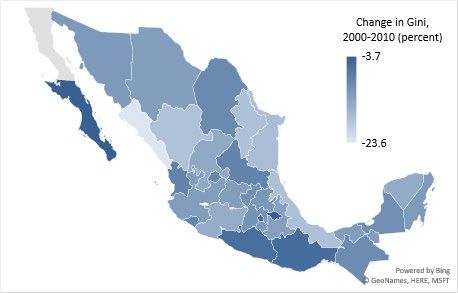
2

© 2021 International Monetary Fund                                                              WP/21/4

                                        IMF Working Paper

                                 Institute for Capacity Development

        Financial Globalization and Inequality: Capital Flows as a Two-Edged Sword

       Prepared by Barry Eichengreen, Balazs Csonto, Asmaa El-Ganainy, and Zsoka
                                        Koczan 1

                   Authorized for distribution by Valerie Cerra and Amine Mati

                                             January 2021

    IMF Working Papers describe research in progress by the author(s) and are published to elicit
    comments and to encourage debate. The views expressed in IMF Working Papers are those of the
    author(s) and do not necessarily represent the views of the IMF, its Executive Board, or IMF management.

                                               Abstract
We review the debate on the association of financial globalization with inequality. We show that
the within-country distributional impact of capital account liberalization is context specific and
that different types of flows have different distributional effects. Their overall impact depends on
the composition of capital flows, their interaction, and on broader economic and institutional
conditions. A comprehensive set of policies – macroeconomic, financial and labor- and product-
market specific – is important for facilitating wider sharing of the benefits of financial
globalization.

JEL Classification Numbers: F21, F22, F24, F41, F62, F63, F65, F68
Keywords: capital flows, capital account, remittances, and inequality.

Authors’ E-Mail Addresses: eichengr@berkeley.edu; BCsonto@imf.org;
AElGanainy@imf.org; KoczanZ@ebrd.com

1
  We thank Jaime Sarmiento Monroy for the excellent research assistance. We also thank Valerie Cerra, Rupa
Duttagupta, Rishi Goyal, Swarnali Ahmed Hannan, Olivier Jeanne, Amine Mati, Monique Newiak, Marco Pani,
Charalambos Tsangarides, Jiaxiong Yao, Jiae Yoo, as well as our colleagues at Banco de México, and
participants in the Inclusive Growth book seminar series organized by the IMF Institute for Capacity
Development, and at the 3rd Joint IMF-OECD-World Bank Conference on Structural Reforms (Improving the
Income Distribution Effect of Market Reforms in a Post-COVID-19 World) for their comments. This is a draft
of a chapter that has been accepted for joint publication by the IMF and Oxford University Press in the
forthcoming book titled: “How to Achieve Inclusive Growth”, edited by V. Cerra, B. Eichengreen, A. El-
Ganainy, and M. Schindler due for publication in 2021.
3
Contents
Abstract .................................................................................................................................2
I. Introduction .......................................................................................................................4
II. Facts about Capital Flows ..................................................................................................6
III. Facts about Inequality ......................................................................................................9
IV. Probing Deeper..............................................................................................................10
4.1. Foreign Direct Investment.....................................................................................10
4.2. Non-FDI Private Capital Flows .............................................................................14
4.3. Official Capital Flows ...........................................................................................18
4.4. Remittances ..........................................................................................................18
V. The Case of Mexico ........................................................................................................20
VI. Policy Implications ........................................................................................................23
References ...........................................................................................................................26
Figures
Figure 1. Capital Account Openness and Financial Integration ..............................................7
Figure 2. External Debt Securities .........................................................................................8
Figure 3. Trends in Remittances ............................................................................................9
Figure 4. Financial Globalization and Inequality.................................................................10
Figure 5. Openness to FDI, Inequality .................................................................................11
Figure 6. Outward FDI and Labor Income Share, Advanced Economies .............................13
Figure 7. Inward FDI, Education and Inequality, Emerging and Low-Income Developing
Countries .............................................................................................................................13
Figure 8. Capital Account Liberalization, Crises, and Inequality.........................................15
Figure 9. Mexico: Income Inequality and External Liabilities, 1970-2015 ..........................20
Figure 10. Mexico: Income Inequality, by States ................................................................21
Figure 11. Mexico: Income Inequality and FDI, by States ...................................................21
Figure 12. Mexico: Remittances and Income Inequality.......................................................22
Figure 13. Capital Account Liberalization, and Gross and Net Income Inequality ................254
I. Introduction
In this paper, we focus on the relationship of financial globalization to income inequality
and the implications for policy.2 Our point of departure is the contrast between trade
liberalization and financial liberalization. Standard logic suggests that trade liberalization will
have opposing effects on distribution in high- and low-income countries. The Stolper-Samuelson
theorem predicts that trade opening will increase demands for the services and therefore the
relative incomes of a country’s abundant factors of production, those used intensively in the
exportables sector. In high-income countries, these abundant factors are well-compensated
capital and skilled labor; in low income countries they are less-skilled labor. It follows that the
impact of trade liberalization on inequality will vary with economic development: income
inequality will increase in high-income countries, as the well compensated become even better
compensated, but fall in low-income economies, where opening disproportionately benefits low-
wage workers. 3
A theorem in international economics, due to Mundell (1957), suggests that trade flows
and capital flows have the same distributional effects. Yet this does not appear to be the case in
practice. 4 Recent studies suggest that inequality, as measured by the Gini Coefficient, has risen
with financial globalization in both advanced and developing countries. 5 They show that
different kinds of capital flows can have different effects and that those effects are context
specific – multiple types of capital and multiple contexts of course not being part of the classic
Mundellian framework.
Evidently, even when financial globalization supports economic growth, it can be
unequalizing, depending on situation and circumstances. This creates a dilemma for
policymakers. Living standards can be raised by making the pie as large as possible, something
that financial globalization promotes in countries with strong institutions and effective policy and
regulatory frameworks. At the same time, it is desirable that the increase be widely shared,
something that is by no means guaranteed. It is important therefore to couple international
2
Unless otherwise indicated, inequality throughout this paper is measured by the Gini coefficient (see Cerra et
al. 2021 for more details on various measurements of inequality). Although there exist alternatives, recent
research pointed to uncertainty about the accuracy of wealth inequality estimates, as well about alternative
income inequality indicators such as the top 1 percent income share. For example, while Piketty et al. (2018)
find that the top 1 percent income share increased by two-thirds since 1960 and doubled since 1980 in the U.S.,
Auten and Splinter (2018) show that there has been only a little change since 1960 and a modest increase since
1980 using a different allocation of underreported tax income.
3
A substantial number of early studies (reviewed in Krueger 1983) confirmed or were not inconsistent with
these predictions. The subsequent literature then qualified these findings, especially as they pertained to
developing countries. Wood (1997) showed that trade liberalization could be unequalizing rather than
equalizing for some emerging markets, notably middle-income countries whose labor-intensive export sectors
were squeezed by low-wage competition from China. (We would observe that this conclusion is by no means
inconsistent with the Stolper-Samuelson logic of the previous paragraph.) Pavcik (2017) showed that the impact
on developing countries varied by region or locale. The safest conclusion would appear to be that the impact of
trade opening in developing countries is not uniform. In contrast, recent work has reinforced the view that trade
openness has been a factor behind rising inequality in advanced countries. Autor et al. (2016) is probably the
most influential such study.
4
For a comprehensive discussion on the distributional impact of trade, see Cerra et al. (2021).
5
For developing countries in particular, this evidence differs, to a large extent, from that of trade (see Cerra et
al. 2021 for a full treatment of this literature).5
financial liberalization with other social and economic policies that help to level the
distributional playing field.
Distributional impacts also depend on initial conditions. Relevant conditions include the
level of human capital, the depth of financial markets, and the strength of institutional and policy
frameworks. Higher levels of educational attainment, stronger creditor rights, and more effective
rule of law in countries on the receiving end of capital flows can help to reap the benefits in
terms of growth while minimizing the costs in terms of distribution.
Moreover, different financial flows have different distributional implications:
FDI: The distributional effects of inward FDI will depend on its sectoral composition and
on the variation in labor intensity and skills across sectors. In general, the adverse distributional
effects will be greatest when FDI flows into sectors characterized by strong complementarities
between capital and skill. In this case, a better educated labor force will facilitate wider sharing
of the benefits. 6
Outward FDI, which is sourced mainly from high-income countries and now increasingly
from middle-income countries such as China, tends to be associated with a decline in the demand
for less-skilled labor in the source country. Such effects diminish insofar as competitiveness
gains from the extension of global supply chains support growth and job creation in the sending
country. But there is growing evidence that adverse distributional consequences in the source
country persist. In addition, the threat of relocating production abroad may reduce the bargaining
power of labor and thus its income share, further accentuating inequality.
Portfolio financial capital flows: These may affect inequality through several channels,
including by accentuating macroeconomic volatility, which disproportionately hurts the poor.
Financial flows can also be vehicles for tax avoidance and other illicit flows that
disproportionately benefit high earners. But portfolio capital inflows can reduce inequality
insofar as they help to deepen and develop the financial sector and in so doing boost financial
inclusion and entrepreneurial opportunity for the poor. Strong institutions, policies to manage
capital flow surges and reversals, and well-developed financial markets that are capable of
efficiently intermediating funds are similarly important for mitigating the inequality-raising
effects of portfolio capital flows.
Remittances: Remittances affect inequality through their direct effects on income.
Empirical studies show that remittances have accrued increasingly to lower-income households
over time. Their inequality-reducing effects are more pronounced in countries with longer
migration histories, where the fixed costs of migration are lower, and where migration and
remittances are more accessible to poorer households. In addition, remittances will have
macroeconomic effects insofar as they facilitate setting up businesses, resulting in employment
creation which tends to be pro-poor.
Official development assistance: Official flows have the potential to reduce inequality
where institutions are sufficiently strong. However, aid may induce officials and well-connected
individuals in the private sectors, who already enjoy relatively high incomes, to engage in rent-
seeking activities aimed at appropriating resource windfalls where institutional checks are
lacking (Svensson, 2000, Hodler, 2007, Economides et al., 2008). Moreover, donors may
allocate aid in a way that deviates from pro-poor growth rhetoric and rather serves their
6
Over the long term, the inequality increasing effect of FDI tends to diminish with rising educational levels; see
for example Mihaylova (2015).6
politically-motivated self-interest. In addition, official flows tend to be procyclical, which can
amplify volatility that disproportionately hurts the poor. All this suggests that ODA will tend to
reduce inequality only when it is timed and targeted appropriately by the donor and when the
recipient has in place institutions adequate for limiting diversion and appropriation.
Other official flows include those associated with reserve accumulation – when a
government uses some of its resources to acquire foreign assets. Higher reserves could reduce
macroeconomic and financial volatility, thereby mitigating the disproportionate impact of
downturns on low-income households. However, reserve accumulation can be expensive, since
the opportunity cost of funds (the typical government’s funding costs) are a multiple of the
interest income earned from holding U.S. treasury bonds or other similar “safe assets” (Rodrik
2006).
The rest of the paper is organized as follows. Sections II and III discuss some stylized
facts about the evolution of capital flows and inequality, respectively, over the last few decades.
Section IV probes deeper with a discussion of the main channels through which different types
of capital flows could affect income distribution. Section V discusses the role of capital flows in
shaping developments in inequality in Mexico since 1970s. Finally, Section VI draws policy
implications for maximizing the benefits from financial globalization for all.
II. Facts about Capital Flows
In the early 1990s, the flow of capital across borders accelerated, rising faster than global
trade and output (Figure 1). On the policy side, the growth of financial flows was facilitated by
capital account liberalization, in emerging and developing countries (EMDC) in particular
(again, see Figure 1). 7 There was a tenfold increase between 1970 and 2015 in cross-border
investment, which rose from 20 to 200 percent of global GDP, with the bulk of the increase
following the liberalization waves of the 1990s and the early-2000s run-up to the Global
Financial Crisis (GFC).
Cross-border financial flows also responded to changes in technology and market
structure (Häusler 2002). New technologies, such as electronic trading, relaxed geographic
constraints and facilitated interaction among financial market participants (Allen et al. 2001).
Building out the global network of submarine fiber-optic cables allowed market participants to
communicate with global financial centers in real time (Eichengreen et al. 2016). Advances in
computer technology enhanced access to information while facilitating risk assessment and asset
valuation. Liberalization and development of domestic financial markets in EMDCs opened new
opportunities for market participants (Lane and Milesi-Ferretti, 2007; Levy-Yeyati and Williams,
2011).8 New technologies providing alternatives to bank wire transfers and traditional platforms
such as Western Union similarly encouraged remittance flows.
Meanwhile, regulatory changes allowed a broader range of financial entities, including
mutual funds, hedge funds and insurance companies, to engage in cross-border intermediation.
As Häusler (2002) argues, these investors sought to diversify their portfolios internationally, with
the aim of maximizing risk-adjusted returns. The emergence of additional investors and the
deepening of financial markets could thus have contributed to a decline in home bias (i.e., the
7
Of 135 episodes of capital account liberalization over the last five decades, 95 took place in EMDCs. Most of
the EMDC episodes took place in emerging markets. Specifically, 69 and 26 episodes were identified in
emerging markets (EMs) and low-income developing countries (LIDCs), respectively.
8
For example, since the late 1990s, a growing number of EMDCs participated as issuers on sovereign bond markets
(Presbitero et al. 2015).7
tendency for investors to hold a disproportionately high share of funds in domestic assets and
neglect foreign investment opportunities).9
Figure 1. Capital Account Openness and Financial Integration
Capital Account Openness and Composition of Global External Assets
Financial Integration
100%
14 250
AE 90%
12 EMDC 80%
Capital Account Liberalization
World (rhs) 200
(Percent of World GDP)
70%
10 AE (rhs)
(Number of Episodes)
Gross Foreign Assets
EMDC (rhs) 60%
8 150
50%
6 40%
100
30%
4
20%
50
2 10%
0%
0 0
1970 1975 1980 1985 1990 1995 2000 2005 2010 2015
1970
1975
1980
1985
1990
1995
2000
2005
2010
2015
Debt FDI Portfolio equity Derivatives Reserves
Sources: Chinn and Ito (2006), Lane and Milesi-Ferretti (2018), and authors’ calculations.
Note: Similar to other studies (e.g., Furceri et al. 2018), we assume that capital account liberalization occurs when the change in
the Chinn-Ito index exceeds its average by at least two standards deviations. Our approach further assumes that there is no reversal
of liberalization over the following 10 years.
Relatedly, production was increasingly fragmented across countries with the emergence
of global value chains, a process related to cross-border investments both directly and indirectly.
Cross-border FDI by multinational companies motivated by these outsourcing opportunities
could take the form of offshoring of portions of the production process or acquisition of host-
country firms. By positively affecting the domestic business environment (e.g., through higher
demand for local inputs and the transfer of knowledge to local suppliers), a country’s
participation in global value chains could also enable it to attract additional foreign investors
(Amendolagine et al. 2017).
Different types of flows dominated in different periods. In the 1970s, capital flows were
predominantly debt flows to the public sector, which accounted for the bulk of the increase in
cross-border positions (Figures 1 and 2). This was followed in the 1980s with an increasing
importance of FDI and portfolio equity. The share of portfolio equity in total flows then rose
further in the 1990s. The period between the GFC and the COVID-19 pandemic then saw a
decline in debt flows, offset by an increase in FDI (Lane and Milesi-Ferretti 2018).
9
Indeed, there is some evidence that home bias is smaller, the larger the assets managed by institutional
investors (Darvas and Schoenmaker 2017).8
Overall, from 6-10 percent of world GDP in the 1970-80s, the stock of FDI reached
nearly 60 percent of global GDP in 2015, at
which point FDI assets amounted to 37 and 4 Figure 2. External Debt Securities
percent of GDP in AEs and EMCDs, Percent of GDP
respectively. Although some 80 percent of 50
the stock of global FDI is held by investors in Public sector
AEs, there has been some increase in the FDI Financial private sector
assets of EMDCs since the 1990s, driven by 40
Nonfinancial private sector
increased outward FDI by China. 10
30
In AEs, the dominance of debt
inflows in the 1970 and 1980s was followed
by an increase in portfolio equity inflows and 20
derivatives in the 1990s and the 2000s,
respectively. In EMDCs, in contrast, there 10
was an increase in private debt inflows in the
1970s, when the combination of abundant
petrodollars, favorable global interest rates 0
and deregulation of banks’ international 1970 1975 1980 1985 1990 1995 2000 2005 2010 2015
activities led to an increase in cross-border
Sources: IMF, and authors’ calculations.
bank loans—which constituted more than
half of all capital flows to emerging markets in 1973-82 (Eichengreen 2004). The Latin
American debt crisis, which erupted in 1982, interrupted debt inflows and prompted debt
rescheduling and restructuring. Private capital inflows then picked up again in the 1990 and
2000s following initiating the Brady Plan. In lower-income EMDCs, by comparison, the increase
in portfolio flows was more gradual, with an acceleration in non-FDI capital inflows and the
emergence of sovereign bond issuances in the 2000s (Araujo et al., 2015a; Presbitero et al.,
2015).
Official flows include official development assistance (ODA), comprised of aid,
concessional loans and debt relief, as well as transactions related to the management of
international reserves. 11 Notwithstanding a moderate decline in the 1990s, net ODA, typically
directed at low-income EMDCs, has risen more than threefold expressed at constant prices, and
has been broadly stable expressed relative to the Gross National Income of the OECD
Development Assistance Committee (DAC) between the early 1970s and the late 2010s. 12
Reserve accumulation has been a major “uphill” capital flow from EMDCs to AEs.
Foreign official holdings of U.S. Treasuries increased from some US$200 billion in the early
1990s to US$4 trillion (around 30 percent of total marketable U.S. Treasury debt securities) in
the mid-2010s. 13 The increase was driven by EMDCs, which accumulated reserves in two waves:
during the pre-GFC period with either precautionary motives or on the back of high commodity
prices, and during the post-GFC period as a result of foreign exchange interventions taken in
response to surging capital inflows (Csonto and Tovar, 2017).
10
Chinese cross-border FDI now accounts for fully 25 percent of total outward FDI by EMDCs.
11
Although aid is in the current account (i.e., it is not capital flow), we discuss it as in many cases its behavior
is similar to that of concessional loans.
12
ODA is measured here at constant prices. Based on OECD data. DAC is the international forum of major
providers of aid, with 30 members.
13
Based on data by Bertaut and Tryon (2007) and Bertaut and Judson (2014).9
In 2017, remittances accounted for less than 1 per cent of global GDP, although they had
more than doubled relative to global GDP since 1995 (Figure 3). But this low average disguises
their disproportionate importance for certain economies. Remittances exceed 10 percent of GDP
in 31 countries, and in some countries account for over one third of GDP. They often constitute a
significant share of migrant household income, not least where the incomes of those working
abroad are multiples of those earned by individuals working at home. With flows of such
magnitude, remittances are likely to have a visible effect on within-country inequality.
Remittances are also the least volatile balance-of-payments flow. They co-move less with
recipient-country GDP than do portfolio flows and FDI. They therefore help to smooth
disposable income and cushion economic shocks. Insofar as such shocks disproportionately
impact the least advantaged, who are disproportionately on the receiving end of remittance
transfers, this aspect of financial globalization tends to be pro-poor.
Figure 3. Trends in Remittances
Global Remittance Flows Remittances, 2019
(percent of World GDP) (percent of GDP)
1.0 40
35
0.8 30
25
0.6
20
0.4 15
10
0.2
5
0
0.0
GTM
LBN
TJK
WSM
NPL
YEM
SSD
MNE
HTI
ARM
LSO
SLV
JAM
KOS
GMB
ZWE
BIH
PSE
NIC
CPV
KIR
KGZ
MDA
UKR
MHL
GEO
TON
JOR
SEN
HND
COM
1977 1982 1987 1992 1997 2002 2007 2012 2017
Sources: World Bank, and authors’ calculations.
III. Facts about Inequality
Other more favorable effects of capital account liberalization notwithstanding, the policy
has been accompanied by rising within-country income inequality across a variety of country
groups. 1415 Simply put, the increase in the Gini coefficient in newly liberalized countries was
higher than in countries that remained financially closed, as shown in Figure 4.
14
To be clear, financial globalization and financial liberalization are not one and the same. Our fundamental
concern in this paper is the effects of financial globalization, as indicated by our title. But financial
liberalization episodes may be particularly informative, as they allow for a before and after comparison. Hence
our focus here and elsewhere in the paper on the evidence they provide.
15
Of the 135 episodes mentioned earlier, inequality data were available for 111 episodes. Although the limited
number of episodes in LIDCs (only 13 episodes) does not allow for the breakdown of EMDCs into EMs and
LIDCs, it is worth noting that more than half of LIDC episodes were characterized by decreasing inequality.10
This increase was pronounced among AEs that liberalized their capital accounts, whereas
in EMDCs the picture was more mixed. About 40 percent of newly liberalized EMDCs,
including Latin American countries in the early 2000s, experienced a decline in inequality
following capital account liberalization. In some EMs where inequality increased, particularly in
Central and Eastern Europe (CEE), liberalization took place during the transition from central
planning to the market economy, so it is hard to know whether the observed increase is the
product of financial liberalization and opening or of other changes that accompanied enterprise
privatization and restructuring.
Income inequality appears to Figure 4. Financial Globalization and Inequality
have risen following liberalization Change in the Gini index after capital account liberalization
episodes in both creditor and debtor (percent), 1970-2015 1/
countries. 16 There is no clear relationship
between the sign of net international
investment positions and inequality, in
other words. 17
IV. Probing Deeper
We now probe deeper, looking
more closely at the distributional effects
of different types of flows.
4.1. Foreign Direct Investment
We identified 14 episodes since
1995 when EMDCs reduced restrictions
on inward FDI and calculated the
Sources: Chinn-Ito (2006), SWIID 8.1, Lane and Milesi-Ferretti (2018),
change in the Gini index following
and authors’ calculations.
each. 18 The results suggest that increased
1/ The figure shows the median change in the average market Gini
openness to FDI was followed by rising index during the 10-year periods before and after capital account
income inequality, absolutely and liberalization. Newly liberalized countries correspond to those
relative to countries that maintained liberalizing their capital account according to the methodology
their restrictions (Figure 5). Many described in Figure 1. Closed countries are those with Chinn-Ito Index
that is below the lowest value of the index at the time of capital
studies using more sophisticated account liberalization across episodes and those that do not liberalize
methodologies similarly find a positive their capital account over the following 10 years. Creditor (debtor)
countries are those with positive (negative) average net foreign assets
over the next 10 years. The sample includes 173 countries where a
total of 135 episodes were identified (of which data were available for
111 episodes).
16
In the case of creditor countries, however, inequality also increased in closed countries over the same period.
17
There is no major difference, for example, in income inequality between a major advanced creditor country,
such as Germany (with a positive NIIP of 48 percent of GDP, and Gini coefficient of 51), and the largest
advanced debtor country, the U.S. (with a negative NIIP of 41 percent of GDP, and Gini coefficient of 52).
Similarly, two major EMDCs, China and Mexico, face similar outcomes in terms of income inequality (both
have a Gini coefficient of 0.47) against the backdrop of NIIP of +15 and -53 percent of GDP, respectively.
18
Of the 14 episodes, data for inequality and investment were available for 12 and 13 episodes, respectively.
The small sample does not allow for a breakdown into EMs (7 and 7 episodes with data on inequality and
investment, respectively) and LIDCs (5 and 6 episodes with data on inequality and investment, respectively).11
relationship between inward FDI and inequality. 19
A first possibility is Figure 5. Openness to FDI, Inequality
that by raising the capital- and Investment, Emerging and Developing Countries
labor ratio, inward FDI will Change in inequality and investments after FDI
increase the return to labor liberalization (percent), 1995-2015 1/
relative to capital. 20 As foreign 0.6 7.0
and domestic capital compete 6.0
0.5
for workers, there will be
5.0
upward pressure on wages. 0.4
4.0
This reduces income 0.3
inequality, insofar as 3.0
0.2
ownership of capital is 2.0
concentrated in the hands of 0.1 1.0
high-income groups (Wolff 0.0 0.0
2010). 21 Countries Closed Countries Closed
reducing FDI countries reducing FDI countries
But if capital restrictions restrictions
substitutes for unskilled labor Gini Gross capital formation
and/or complements skilled (relative to GDP)
labor, then FDI inflows will
increase the relative demand Sources: Fernandez et al (2016), SWIID 8.1, IMF, and authors’
calculations.
for skilled labor and thus the 1/ The figure shows the median change in the average market Gini
skill premium (Krusell et al. index and gross capital formation (as share in GDP) during the
2000, Larrain, 2017, Jaumotte 10-year periods before and after inward FDI liberalization in 68 EMDCs between
1995 and 2015. Inward FDI liberalization is defined on the basis of a decline in
et al. 2008).22 Here it is
the direct investment inflow restrictions sub-index of the Fernandez-Klein-
important to differentiate Rebucci-Schindler-Uribe index. Change in Gini and gross capital formation/GDP
between horizontal and vertical is shown on the left- and right-hand-side axis, respectively.
FDI. Horizontal FDI means that firms undertake the same activities at their foreign affiliates as
19
See, for example, Tsai (1995); Gopinath and Chen (2003); Te Velde (2003); Te Velde and Morrissey (2003);
Lee (2006); Basu and Guariglia (2007); Jaumotte et al. (2008); Asteriou et al. (2014); Herzer et al. (2014);
Suanes (2016). Some, however, find mixed or even no such evidence. See, for example, Te Velde and
Morrissey (2004), Milanovic (2005); Sylwester (2005). Differences in methodologies, in measures of
inequality, in country sample and in period plausibly explain these differences.
20
There is some evidence that FDI inflows into manufacturing lead to more total investment in developing
countries, especially in the case of investments by residents of advanced economies (Amighiani et al. 2017).
This means that any crowding out effect on domestic investment would be more than offset by the positive
impact of FDI. Amighiani et al. (2017) also suggest that the direct impact on investment, and thus capital stock
depends on whether FDI takes the form of greenfield investments, i.e. the establishment of foreign operations
by a company (e.g., by creating a new factory) that has direct positive impact on capital stock, or whether it is in
the form of mergers and acquisitions, which involve the transfer of the ownership of existing assets. FDI may
also exercise indirect effects on domestic investment, both positive and negative. It may create additional
demand for inputs provided by local suppliers, thereby encouraging investment, but also push domestic firms
out of the market, in an obvious sense discouraging investment.
21
Consistent with this premise, IMF (2017) finds a strong negative association between labor shares and
income inequality.
22
The mechanism is similar to that of skill-biased technological change, i.e. when advances in technology favor
high-skilled labor (Berman et al. 1998). Goldberg and Pavcnik (2007) provides a comprehensive overview of
the different channels through which globalization affects inequality, including the impact of outsourcing on the
skill premium.12
in their home country, typically motivated by the promise of obtaining improved market access.
Since the FDI decision is not prompted by the promise of lower labor costs, it is not clear that
horizontal FDI will affect the skill premium.
Vertical FDI, in contrast, will almost certainly affect the skill premium, although in what
direction will depend on the context. Vertical FDI involves outsourcing segments of the
production process, typically to locations where costs, notably those of labor, are lower. The
impact on the relative demand for low-skilled labor and thus the skill premium in the recipient
country varies across countries, depending on, among other factors, the skill composition of
outsourced activities and that of the labor force in recipient countries. For example, the
outsourcing of skill-intensive activities by German and Austrian firms to cheaper skilled-labor-
abundant Central and Eastern European economies (CEE) in the 1990s raised the skill premium
in the recipient countries, aggravating inequality (Marin 2004). Similarly, Feenstra and Hanson
(1997) found that FDI, accompanied by rapid technological change that places a premium on
skills, increased the demand for skills and thus the skill premium in Mexico in the 1980s. 23 In
contrast, vertical FDI flows following the advent of NAFTA in the mid-1990s contributed to the
decline in inequality observed in Mexico starting from the mid-1990s by raising the demand for
low-skilled relative to high-skilled labor. 24 Robertson (2007) provides some evidence that the
changing nature of foreign investments in the 1990s that favored less skill-intensive activities
(e.g., an expansion of assembly activities made possible by NAFTA) led to higher demand for
low-skilled workers in Mexico, thereby reducing the skill premium.
The extent to which capital account liberalization leads to additional investment and
thereby affects the skill premium will also depend on external financial dependence. External
financial dependence varies widely across sectors, with manufacturing (especially chemicals)
and certain services (post and telecommunications, real estate, hotels and restaurants) having
large needs for external finance, in contrast to other services (such as education and health care).
(See Larrain 2017.) In economies where access to external finance is otherwise limited, inward
FDI can relax that constraint and allow the sectors in question and their derived demand for
factor services to expand. To the extent that FDI flows into sectors where both external financial
dependence and capital-skill complementarity are high (e.g., telecommunications), opening the
capital account do more to raise the demand for skilled labor, the skill premium, and thus wage
inequality.
FDI may also affect inequality through its impact on product markets and prices. For
example, FDI has been one of the main drivers of the “de-fragmentation” of the retail sector in
EMDCs, i.e. of the shift to larger, centralized wholesale and retail markets (Reardon et al. 2003).
Although the presence of foreign retailers could put a downward pressure on prices via their
higher productivity and more intense competition, the crowding-out of local stores could also
allow foreign retailers to use their market power to raise prices over time (Durand 2007). To the
extent that the first factor dominates, and these goods constitute a larger share of the
consumption basket of low-income households, this would have favorable distributional effects.
In addition, however, against the backdrop of low levels of unionization in low-skilled services
sectors such as retail, entry by foreign firms could intensify competition in the product market,
thereby lowering the bargaining power of labor and encouraging race-to-the-bottom wage
23
They noted, however, that these outsourced activities are less skill-intensive in the US. As they point out,
even if relocated activities are low-skill intensive in the home country, they can still lead to an increase in the
relative demand for skilled labor in the recipient country, provided their skill intensity is higher than that of
domestic production.
24
See Section V for a more comprehensive discussion about the case of Mexico.13
dynamics. This was the case in Mexico, where real wages in retail fell by 18 percent between
1994 and 2003 following the entry of Walmart (Durand 2007). 25
Turning to outward FDI, some
studies find that this is positively Figure 6. Outward FDI and Labor Income Share,
associated with inequality because it Advanced Economies
lowers the capital/labor ratio, reduces
the demand for less skilled labor
disproportionately, or weakens labor’s
bargaining power (see e.g., Choi 2006;
Jaumotte et al. 2008). The evidence
suggests a negative relationship between
outward FDI and the labor income share
in AEs (Figure 6). Analyzing U.S.
experience with outsourcing less-skill
intensive activities to Mexico in the
1980s, for example, Feenstra and
Hanson (1997) find that the skill
premium increased in the U.S. as Sources: Lane and Milesi-Ferretti (2018), PWT 9.1, and authors’
outsourcing such activities reduced the calculations.
demand for less skilled workers. In
contrast, Marin (2004) shows that Austrian and German multinationals in the 1990s outsourced
skill-intensive stages of production to CEE region, thereby exerting downward pressure on the
skill premium in Austria and Germany (while raising the skill premium in CEE region, as
mentioned above).
In addition capital account
liberalization could lower the bargaining Figure 7. Inward FDI, Education and Inequality,
power of labor and thus its income Emerging and Low-Income Developing
share, by creating a credible threat to Countries
relocate production and jobs abroad
(Rodrik 1998; Furceri et al. 2018; Ostry
et al. 2019).26 As Rodrik (1998) argues,
“employers can pack up and leave, but
workers cannot,” implying that workers
“have to receive lower wages and
benefits whenever bargaining is an
element in setting the terms of
employment.” Consistent with this
observation, Blinder (2009) finds that
“the 5.7 million most offshorable jobs
seem to pay a wage penalty – estimated
Sources: Barro and Lee (2013), Lane and Milesi-Ferretti (2018), SWIID
to be about 14 percent” in the United 8.1, and authors’ calculations.
States.
FDI can also facilitate tax avoidance by multinational companies. “Phantom FDI,”
25
During the same period, however, overall inequality fell in Mexico, partly driven by FDI (see Section V).
26
Using a panel of 23 AEs and 25 industries over the period 1975-2010, for example, Furceri et al. (2018) find
that capital account liberalization tends to reduce the labor income share to a larger extent in sectors with higher
natural layoff rate with the mechanism possibly operating through the lower bargaining power of labor.14
defined as investments with no real links to the local economy, accounts for an estimated 40
percent of global FDI (Damgaard et al. 2019). These investments pass through corporate shells
with a view to minimizing multinationals’ global tax bills.27 Such tax avoidance will likely raise
returns for capital owners, accentuating income inequality in source countries. 28
Finally, the inequality-increasing effects of inward FDI appear to less in countries with
higher levels of educational attainment. Mihaylova (2015) argues that this is related to the fact
that the technologies transferred by FDI often require the use of relatively skilled labor in the
recipient country. A higher level of human capital in the FDI recipient country will thus tend to
limit the impact on the skill premium. As we show in Figure 7, between 1995 and 2015, more
than 6 (slightly more than 2) percent of the population completed tertiary education in EMDCs
that observed a decline (an increase) in inequality, with no major difference in terms of inward
FDI across these groups.29, 30
4.2. Non-FDI Private Capital Flows 31
Insofar as portfolio capital flows and FDI have similar impacts on investment in the
recipient country, they will have similar distributional effects. In addition, however, the impact
of portfolio flows is likely to reflect their implications for aggregate volatility. Several studies
find pronounced negative distributional consequences when capital account liberalization
increases macroeconomic volatility (Chauvet et al. 2017) and especially when it is followed by a
crisis (Ernst and Escudero 2008; Furceri et al. 2018) (Figure 8). 32, 33, 34
27
A few well-known tax havens host the vast majority of the world’s FDI through special purpose entities.
Globally, phantom investments amount to $15 trillion, or the combined annual GDP of China and Germany.
Despite international attempts to curb tax avoidance, the growth of phantom FDI continues to outpace that of
genuine FDI. Investments in foreign empty shells could indicate that domestically controlled multinationals
engage in tax avoidance that benefits the rich, with potential adverse implications for inequality in the source
countries (i.e., where the owners of these companies reside) (see also Cerra et al. 2021 on taxation).
28
At the same time, tax payments generate fiscal revenue in recipient countries. If such revenues finance
redistributive policies, they might help to reduce inequality. However, if the revenues are captured by the elites,
they will aggravate inequality
29
It is worth noting that the first group also attracted higher FDI relative to the size of their economies.
30
Out of 53 EMDCs, there were only 14 LIDCs, with around 2.5 (1.7) percent of the population having
completed tertiary education in countries with a decline (increase) in inequality.
31
Portfolio non-FDI private capital flows include portfolio debt and equity flows and other investments such as
bank funding, and trade credit/deposits. Portfolio debt flows include flows where the debtor is government and
the creditor is private sector entity as these flows are considered market-driven.
32
Specifically, Chauvet et al. (2017) finds that income volatility has an adverse impact on inequality for a panel
of 142 countries between 1973 and 2012. Ernst and Escudero (2008) finds the inequality-raising impact of crisis
in a sample of 102 countries between 1960-2006, while Furceri et al. (2018) examining a sample of 23 countries
over the period 1975-2010 show that the distributional impact of capital account liberalization is magnified
when liberalization is followed by crisis.
33
We identified 22 episodes, of which data are available for 16 episodes. There is only one crisis episode in
AEs in the sample. The EMDC group is dominated by EMs (11 episodes), whereas there are only 4 LIDC
episodes.
34
The Committee on International Economic Policy and Reform (2012) similarly concluded that “the
procyclical nature of cross-border bank-intermediated credit flows have given rise to serious economic and
financial instabilities”.15
The procyclicality of portfolio inflows in EMDCs is well established: net flows rise in
good times and fall in bad times, amplifying business-cycle fluctuations. 35 Relatedly, there is a
literature linking financial liberalization and capital inflow surges on the one hand to crises on
the other.36 But the pro-cyclicality of capital flows differs across countries and borrowers.
Capital inflows into developing countries are less pro-cyclical than those into more developed
countries (Araujo et al. 2015b). This could be the result of the less pronounced financial
accelerator in developing countries, given smaller banking systems and a less pronounced
leverage cycle (Geanakoplos 2009). The cyclical properties of inflows also reflect the type of
borrower: sovereign borrowing is countercyclical in EMs and acyclical in AEs, while borrowing
by banks and corporates is uniformly pro-cyclical (Kalemli-Ozcan et al 2017).
Gross flows are more
procyclical than net flows, making Figure 8. Capital Account Liberalization, Crises,
them a better indicator of financial and Inequality
vulnerabilities. 37, 38 Both gross inflows (Gini coefficient, percent change, before and after capital
account liberalization), 1970-2015
by non-residents and gross outflows by
4.5
residents decline during crises (Broner
4.0 Newly liberalized
et al. 2013), so their respective impacts
3.5
on net flows offset one another. This Newly liberalized, followed by crisis
3.0
implies that the degree of global
financial market integration (as proxied 2.5
by gross flows) is more important for 2.0
inequality than whether a country is a 1.5
net creditor or debtor.39 1.0
0.5
Aggregate volatility is
0.0
associated with higher inequality, Total Creditor Debtor EMDC
because poorer households suffer more
in economic downturns (see also Cerra Sources: Chinn-Ito (2006), SWIID 8.1, Lane and Milesi-Ferretti (2018),
et al. 2021).40, 41 The mechanisms here Laeven and Valencia (2012), and authors’ calculations.
Note: Newly liberalized, followed by crisis indicates those capital
are several: account liberalization episodes that are followed by either currency,
banking or sovereign debt crisis within 10 years. See Figure 4 for the
• Recessions disproportionately affect country sample.
wages and employment for poor
households, since firms are more reluctant to lay off their skilled workers due to higher hiring
and training costs (Agenor 2001).
35
See, for example, the literature on sudden stops (e.g., Calvo and Reinhart 1999) or Kaminsky et al. (2004).
36
See, for example, Eichengreen (2004); Reinhart and Reinhart (2008); Reinhart and Rogoff (2009).
37
See, for example, Lane and Milesi-Ferretti (2007); Forbes and Warnock (2011); Broner et al. (2013).
38
A higher degree of complementarity between gross inflows and outflows reduces the volatility of net inflows
in AEs, i.e., given relatively stable current account balance and reserve positions in these countries, changes in
gross capital inflows are typically mirrored by changes in gross capital outflows (Bluedorn et al. 2013).
39
This last implication is consistent with the earlier discussion pointing to the absence of a clear relationship
between income inequality on the one hand and countries’ net external positions as debtors or creditors on the
other.
40
See, for example, Heathcote et al. (2010); Atkinson and Morelli (2011); Guillamont Jeanneney and Kpodar
(2011); Agnello and Sousa (2012); and Chauvet et al. (2017).
41
Financial crises however could reduce wealth inequality as bankruptcies and falling asset prices may have
greater impact on those who are better off (Atkinson and Morelli 2011).16
• Credit rationing by banks, which is more prevalent during downturns, disproportionately
affects poorer households, since their loans are considered riskier. For example, Choudhary
and Jain (2017) show that when facing an increase in their funding costs due to an exogenous
shock caused by flooding, banks in Pakistan disproportionately reduce credit to less-
educated, poorer borrowers.
• Poor households may be forced to interrupt the education of their children (Hausmann and
Gavin, 1996).42 Consequently, recessions may have long-lasting impacts on human capital
formation, resulting in an “asymmetric hysteresis effect on poverty” (Agenor 2001).
Negative distributional effects can thus be limited by policy frameworks that help
countries to effectively manage capital flows, and reduce the associated volatility. The IMF has
suggested a variety of capital flow measures (CFMs) that might be deployed in this connection,
though such measures should not be substitute for warranted macroeconomic adjustment.
Strengthening financial regulation and supervision are important here as well (IMF, 2012). 43 So
too are macroprudential policies, which can mitigate the impact of global financial shocks
(Bergant et al. 2020). Improved access to financial services can also allow households to borrow
as a way of mitigating the consequences of downturns.
Here the composition of flows again matters. While a surge in capital inflows increases
the probability of a banking or a currency crisis in immediately succeeding years, this effect may
be less when flows take the form of portfolio equity or FDI than when it takes the form of debt
(Furceri et al. 2011a). Again, capital flow and regulatory measure can be used to shape tilt the
composition of flows in more stable directions.
Capital flows may also affect inequality through their impact on financial
inclusion. 44, 45 The development of mobile money services, facilitated by foreign portfolio
investment, could enhance access to credit. For example, equity investment by the foreign-
owned Safaricom contributed to the introduction of M-PESA in Kenya in 2007, leading to a
significant increase in access to finance.46 Wider access to financial services (e.g., payments
services, savings accounts) helped make financial transactions more efficient, and facilitated
investment in small enterprise by households that did not previously have access to such
services. Improved access to loans also helped with the management of income shocks due to
42
For example, the 1998 crisis in Indonesia was followed by a decline in the school enrollment of young
children in the poorest households (Thomas et al. 2004). In contrast, children were found not more likely to
drop out from school during recessions in Brazil (Neri and Thomas 2000). Similarly, the Great Recession was
found to have a long-term negative impact on employment in the United States, with larger effects among older
and lower-income individuals (Yagan 2019).
43
Bumann and Lensink (2016) focus on financial depth as the main channel through which capital account
liberalization (a particular form of financial liberalization) affects income inequality. They find that capital
account liberalization only tends to lower income inequality if the level of financial depth, as measured by
private credit over GDP, is high, in excess of 25 percent.
44
For example, the use of external funds by banks to lend to the private sector could enhance financial
inclusion. On the other hand, capital flows to countries where targeted lending by banks to specific groups of
interest is prevalent could result in higher inequality. In general, the literature on capital flows and financial
inclusion is scarce.
45
For an overview of the link between financial inclusion and inequality, see Cerra et al. (2021).
46
Ultimately, this technology spread to other countries in the region, reaching 30 million users, significantly
boosting financial inclusion (Sy 2019).17
loss of employment and thus protect households from falling into poverty (Demirguc-Kunt et
al. 2017). 47
Portfolio capital flows may further influence inequality through their fiscal impact,
making it easier for the sovereign to finance its spending but also leading to rising debt. The
distributional impact will then depend on how the additional resources are used and additional
liabilities are managed: for example, on whether the resources are used to support pro-poor
programs and whether the debt is prudently managed (see Cerra et al. 2021).
Opening the capital account can also create a foreign demand for domestic assets (Azis
and Shin 2015, Kim and Yang 2009; Ananchotikul and Zhang 2014). For example, portfolio
equity, portfolio debt and net bank inflows may also be associated with a boom in housing prices
(Jara and Olaberría, 2013); the impact on distribution will depend on who owns the housing
stock. By comparison, an increase in equity prices driven by capital flows will almost certainly
increase wealth inequality insofar as stocks typically constitute a larger share of asset holdings of
high-income households. 48
Portfolio flows may further alter net wealth through their impact on the exchange rate.
For example, currency depreciation due to outflows will tend to reduce the net wealth of
households with foreign-currency-denominated liabilities and raise the cost of repaying foreign-
currency-denominated debt. This effect was evident in Central/Eastern European countries where
the majority of mortgage debt was financed by foreign-domiciled banks and denominated in
euros and Swiss francs.
Finally, openness to capital flows can facilitate tax evasion and illicit financial flows,
much as in the case of the phantom FDI discussed above. 49 An additional motive for turning to
offshore centers is to avoid prosecution for fraud and corruption. 50 Comparing information from
offshore financial institutions with administrative wealth records in Denmark, Norway and
Sweden, Alstadsæter et al. (2019) find that offshore tax evasion is mainly engaged in by the rich.
They estimate that the 0.01 percent richest households thereby evaded around 25 percent of their
taxes. 51
In sum, portfolio capital flows may raise inequality through their impact on volatility, tax
avoidance, illicit flows, and asset prices—all of which tend to benefit the rich. Such flows may
be inequality reducing, however, when they boost financial inclusion. Strong institutions and
pro-active policies help to mitigate the potential inequality-raising effects, however, and to share
the benefits more widely.
47
In their study of towns in Mexico where bank branches were rapidly opened, Bruhn and Love (2014) argue
that increased access to financial services leads to an increase in income for low-income individuals by allowing
informal business owners to keep their businesses open and creating an overall increase in employment.
48
For example, in the context of the distributional impact of quantitative easing in the euro area, Lenza and Slacalek
(2018) discuss the potential role of the portfolio composition channel, highlighting that self-employed business and
stock market wealth constitute a substantially larger share of total assets in the top net wealth quintile of households.
49
Compared with tax avoidance in the case of FDI, tax evasion refers to illegal activities.
50
Relatedly, capital account openness could also encourage organized crime by providing opportunities for
money laundering.
51
Ndikumana and Boyce (2018) estimate that capital flight, inferred from capital flows not recorded in the
balance of payments, amounted to a cumulative US$1.4 trillion in 30 African countries between 1970 and
2015.51 According to estimates by the United Nations Office on Drugs and Crime, money laundering was close
to 3 percent of world GDP in 2009 (UNODC, 2011).18
4.3. Official Capital Flows
Studies that analyze the distributional impact of ODA reach conflicting conclusions.
Chong et al. (2009), using cross-section and system GMM panel techniques, find no robust effect
of aid on inequality. Shafiullah (2011), in contrast, estimates fixed and random effects models
and finds that aid reduces income inequality. Calderón et al. (2006) find that foreign aid reduces
inequality so long as institutional quality exceeds a critical threshold. Conversely, weak
institutions in recipient countries enhance the ability of local authorities to engage in corruption
and rent-seeking activities aimed at appropriating resource windfalls and diverting aid funds,
resulting in greater inequality (Chong and Gradstein 2007). Herzer and Nunnenkamp (2012),
using panel cointegration estimators to examine long term effects of aid, also find that aid
increases inequality on balance.
When foreign donors are not purely altruistic, they may use aid to buy political support
by the local elite, in which case aid benefits the rich rather than the poor in the recipient country.
Similarly, there may be a heightened risk that aid is diverted into inter alia foreign bank accounts
in countries where political institutions are weak. Two conditions thus must be met in order for
ODA to be effective in reducing inequality: first, donors must allocate aid in line with their
rhetoric on pro-poor growth; and both they and the local authorities must ensure that aid reaches
the poor—in this regard, strong institutions are a pre-condition for aid to reach those in need and
for it to reduce inequality.
Finally, there is the problem that official aid is procyclical (Pallage and Robe 2002). This
may reflect the fact that recipient countries may have less ability during downturns to meet the
matching requirements set by donors. This implies that instead of playing a stabilizing role, aid
flows can exacerbate aggregate volatility, with potential adverse effects for inequality, as
discussed above.
The second form of official capital flows we consider is reserve accumulation, when
capital flows out of countries, including EMDEs, seeking to augment their reserves and into the
safe reserve assets issued by, inter alia, the U.S. government. The rapid build-up of international
reserves by emerging market countries in the pre-GFC period, for example, had the potential to
affect inequality through two channels. First, larger reserves augmented the capacity of central
banks and governments to insulate the domestic economy from the effects of capital flow
reversals; this helped to help mitigate growth volatility associated with changing global financial
conditions, thereby also lowering possible adverse distributional consequences as discussed in
the previous section. Second, as “reserves were accumulated in the context of foreign exchange
interventions intended to promote export-led growth by preventing exchange-rate appreciation”
(Bernanke 2005), the impact on inequality also depends on how evenly the gains from the
export-led growth are distributed across skilled- and unskilled labor, as well as labor and capital
owners. 52
4.4. Remittances
The literature reaches mixed findings on the impact of remittances on inequality. Most
early studies examine the distributional effects by simply subtracting remittance from income for
remittance-receiving households, computing Gini coefficients separately for non-remittance
income and remittance income. 53 In contrast, recent studies have created counterfactual income
distributions. Such counterfactuals are designed to capture what a migrant’s income would be in
52
For a comprehensive discussion on trade and inequality, see Cerra et al. (2021).
53
See, for example, Adams and Alderman 1992, Stark et al. 1988, and Taylor et al. 2009.You can also read