ECONOMIC POLICY
A STRONG AND RESILIENT ECONOMY
←
→
Page content transcription
If your browser does not render page correctly, please read the page content below
ECONOMIC POLICY A STRONG AND RESILIENT ECONOMY
Page |2
3|Page
Page |4
Contents
Foreword of the Minister of Finance, Economic Affairs and Culture............................................. 6
Introduction ....................................................................................................................................... 8
1.    Economic Vision ...................................................................................................................... 11
2.    Current Conditions .................................................................................................................. 13
      2.1 Global economy in a snapshot .......................................................................................... 13
      2.2 Impact of Global Economy on Local Economy............................................................... 14
      2.3 Leading Economic Indicators Aruba 2014-2017 ............................................................... 15
      2.4 Gross Domestic Product ....................................................................................................... 16
      2.5 State of the Tourism Industry ............................................................................................... 19
      2.6 Overview of current fiscal situation and tax reform ......................................................... 21
3.    Sustainable Economic Growth ............................................................................................... 25
      3.1 Social and Environment factors for Sustainable Development ..................................... 25
      3.2 Implementation of the SDGs in Aruba ............................................................................... 30
4.    Moving Forward ....................................................................................................................... 35
      4.1 Entrepreneurs Development ............................................................................................... 36
      4.2 Investment for Diversification .............................................................................................. 38
      4.3 International Opportunities for Trade and Export ............................................................. 38
      4.4 Empowered Consumers ....................................................................................................... 40
5.    Promising sectors ..................................................................................................................... 43
      5.1 Tourism .................................................................................................................................... 43
      5.2 Knowledge Economy ........................................................................................................... 44
      5.3 Agriculture .............................................................................................................................. 45
      5.4 Logistics................................................................................................................................... 45
      5.5 Circular Economy ................................................................................................................. 45
      5.6 Creative Industries................................................................................................................. 46
      5.7 Enabling ecosystem to support economic development .............................................. 47
      5.8 Investment in infrastructure.................................................................................................. 48
Proposed actions in 2018-2019 ...................................................................................................... 49
Monitoring and Evaluation ............................................................................................................. 49
Annex A: Vision & Economic Goals .............................................................................................. 49
Annex B: Monitoring Indicators ..................................................................................................... 49
Annex C: Tables and Graphs......................................................................................................... 49
Annex D: Composition of the SME Policy Index of the 12 OCTs (scale 0 to 4)........................... 49
Annex E: Cost of doing business ................................................................................................... 49

                                                                                                                                        5|Page
Foreword of the Minister
          of Finance, Economic
          Affairs and Culture

          Since the Wever-Croes cabinet took office, the
          Government's central purpose has been to turn the
          disrupted government finances into a sustainable,
          responsible financial policy, which is a prerequisite for
          creating a solid and resilient economy. At the same time,
          the government worked together with important
          stakeholders to formulate an economic vision and
          economic policy. It’s our determination to build a more
          successful country, with opportunities for all Arubans to
          flourish, through increasing sustainable economic growth.

          A robust and diverse economy is vital to our national
          prosperity and in creating the wealth to support high quality
          public services. Ensuring that growth is shared and
          sustainable is the key to unlocking all of Aruba’s potential
          and strengthening our greatest asset - the people of Aruba.

          Our people are creative and resilient, and we are home to
          a very diverse and multicultural workforce. We will continue
          to build on the strengths of our society, to create a more
          competitive and sustainable economy.

          As we look forward, we want to achieve more than simply
          return to a slight positive economic performance, after a
          couple of years of recession. We need to tackle the
          underlying challenges in our economy and labor market,
          increase the labor productivity, competitiveness and
          sustainability of the Aruban economy. We need to ensure
          that there are sufficiently skilled and well-paid job
          opportunities available, take advantage of the
          opportunities presented by globalization, innovation and
          technological change and ensure that the benefits of
          economic success are shared by everyone.

Page |6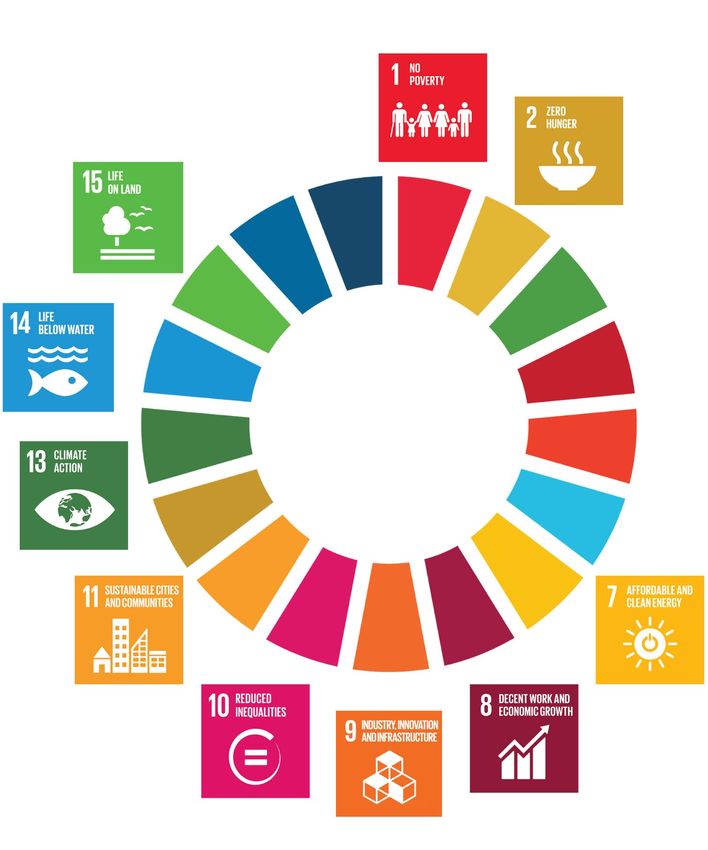
The Aruban economy was challenged after the closure of
the oil refinery, and we depend only on one economic
sector. The dependency on tourism has increased heavily
since the nineties, which urges the need to diversify our
economy. Previous diversification efforts had failed, partly
because they were perceived as being owned only by the
Government. This policy is therefore, broad-based scope,
non-partisan and inclusive, the recipient of input from the
public and private sectors, Trade Unions, NGOs and
external agencies. Through a participatory process specific
economic sectors were identified. This Economic policy sets
out an overarching framework for how we aim to achieve
a more productive, cohesive and fairer Aruba. It prioritizes
boosting investment and innovation, supporting inclusive
growth and maintaining our focus on increasing
internationalization.

Creating more prosperity and justice is a shared national
effort. Only by working together with the broader public
and private sector in Aruba, the third sector, trade unions,
companies and communities we will be able to create a
society in which the benefits of economic growth are more
evenly distributed, and future economic growth is stronger
and more sustainable.

                                                               7|Page
Introduction
                                                      high priority on the agenda for the coming years
The government has the responsibility to create       and has committed to implement the necessary
an enabling environment in which businesses           actions.
can develop, can stimulate competitiveness
and can innovate. The Aruban economy has              The reality is that notwithstanding many efforts of
been dependent for decades on one or two              diversification in the last 13 years, Aruba has not
economic sectors at a time, starting with gold,       succeeded in diversifying its economy. The
phosphate, aloe, oil and tourism. Although            Aruban situation even worsened since 2012,
diversification of the economy has been the aim       after the closure of the oil refinery, Aruba’s
of many governments since the Status Aparte it        economy is depending only on one economic
has been difficult to achieve.                        sector. Our dependency on tourism has
                                                      increased heavily since the nineties therefore the
In 2005, on request of the government of Aruba,       need to diversify the economy is now more
the Foreign Investment Advisory Services (FIAS) in    relevant than ever. In May 2018 the government
cooperation with the World Bank prepared a            requested OCO Global as consultancy service,
report called the “Diversification for Sustainable    to    help      define   Promising     Sectors   for
Growth and Reduction of Risk – steps towards          diversification of the economy of Aruba. Through
the design and implementation of a strategy”.         a participatory process consulting government
This report emphasized that, for a small island       and private sector experts, specific areas were
economy, a concomitant small population, a            identified. The areas identified are Tourism
resulting small domestic market (in spite of high     (specific niche products), Knowledge Economy,
per capita income), and essentially no natural        Agriculture, Logistics, Circular Economy and
resources, possibilities for diversifying the         Creative Industries. Whereas the “Physical”
economy into other activities are limited. This is    opportunities for economic diversification
still the case in 2018. Three areas for               remain somewhat limited due to the relatively
diversification were identified in the FIAS report;   small size of local markets, there are many
Education, Health Care and diversification within     “digital”       opportunities     for     economic
Tourism. The FIAS report, besides giving specific     diversification that remain underexploited and
criteria’s to keep in mind when diversifying the      unexplored.
economy, also made an important statement
concerning the tax system in Aruba. With the          Following the criteria’s for diversification and the
different and more difficult goal of fostering        tax recommendation of the Department of
diversification through investments in other          Taxes and the IMF, the support to entrepreneurs
activities, which do not have a proven track          and a well-defined investment promotion
record that makes their advantages in Aruba           strategy, it should be possible to start the road
obvious, FIAS analysis shows that Aruba’s tax         towards diversification.
system needs quite a few reforms to make it work      We must keep in mind that diversification
effectively.                                          requires a collaborative effort between the
                                                      private and public sector and that it takes years
Recently, the IMF together with local experts         before real results can be seen. In order to
assisted the Government of Aruba with                 develop these sectors a promotion strategy will
recommendations on the reform of taxation in          be developed and specific incentive programs.
Aruba. Cabinet Wever-Croes has the tax reform
and sound public finance management as a              Recently the Aruba Tourism Authority (ATA)

Page |8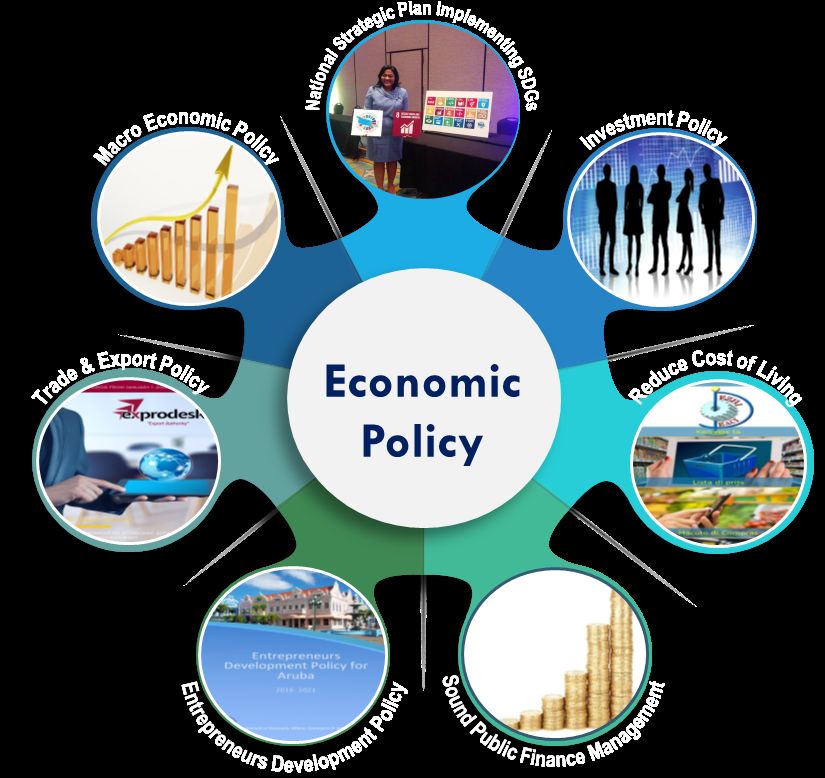
embarked in a trajectory to study the Tourism              entrepreneurship, to stimulate and facilitate the
Carrying Capacity for Aruba and also to identify           export of goods and services and to empower
niches in the tourism sector to develop the                consumers. Innovation and education are the
Aruban product in a sustainable way. These                 primary drivers of the economic policy moving
actions to fortify the Tourism Sector in                   Aruba, its businesses and workforce into a new
combination with a Sustainable Economic Policy             era of international competitiveness. Concepts
should mark the road for the coming years.                 such as e-commerce, e-business, start-ups, tech
Another perfect alignment with the Economic                enabled companies, social entrepreneurship
Policy of the Minister of Finance, Economic                and     incubators    will  sculpt   the     new
Affairs and Culture is the Destination                     entrepreneur’s ecosystem.
Development Plan (ATA, 2017). This plan
identified the following priorities; “Foster               To facilitate the development of the economy of
innovation and entrepreneurship; become a                  Aruba the Government will have a strong
data intelligence-driven island; and Enhance               facilitator’s role to stimulate entrepreneurship,
digital communication and facilitate knowledge             investments, trade and export and protection of
sharing”. Regarding above mentioned priorities             the consumer, while the private sector will be the
the Central Bank of Aruba’s “Isla Innovativo” also         driving force of the economic development.
presented a policy note on Innovation and                  Preconditions for the development of the
offered a “strategic framework for developing              economy are innovation and creative thinking,
human-centered policies and best-practices to              education, entrepreneurial mindset, a fair tax
strengthen Aruba’s innovation capacity and                 system and investment promotion.
increase    its  economic        resilience”. “Isla
Innovativo” focuses on: i. fortification of Aruba’s        The Minister in this endeavor will focus on an
current and future innovation capacity, ii.                economic growth that takes into account the
acceleration of the digital transformation and iii.        environmental and social policies in order to
building the work force of tomorrow. This aligns           have a sustainable growth. In this regard, Policy
with the National Innovation Plan and the E-               Coherence for sustainable development and
government approach as well with the goals of              the implementation of the SDGs play an
this Economic Policy                                       important role. It is pivotal to approach the
                                                           economic policy in an integrated way with the
This Economic Policy will focus on the                     social, environmental governance dimensions at
development of a sustainable economic growth               all stages of this policy making. Alignment with
with the following objectives; (1) to contribute to        labor policy, social policy, education policy,
a higher quality of life for all citizens, (2) to create   safety and security policy, environmental policy
inclusive and decent jobs, (3) to facilitate new           are fundamental for a sustainable economic
innovative business opportunities and (4) to               development.         Taking    therefore     into
stimulate local and foreign investment. In this            consideration that policy coherence is needed
respect several activities will be implemented             across all sectors and that strong partnership in
such as to improve the investment climate                  national, regional and international context are
through the reduction of the cost of doing                 necessary. At the same time strengthening
business (elimination of red tape) in order to             institutions and fostering partnership within
create a level playing field for local and foreign         government institutions and with the private
entrepreneurs, to promote investments in the               sector are important to implement the Economic
promising sectors, to stimulate and educate                Policy successfully.

                                                                                                Page |9
1       Economic Vision

P a g e | 10
1. Economic Vision

The Aruba government in its government program “Hunto pa Aruba, 2017” 1has explicitly indicated
their vision for the Economic Policy for the period 2017-2021.

            “To improve the investment climate in Aruba and to stimulate an innovative, competitive
            and diversified economy, which contributes to a higher quality of life for all citizens”

The goal of the economic policy of the Minister of Finance, Economic Affairs and Culture is to stimulate
sustainable economic development in which the citizens and the natural environment will play a
prominent role. The government pursues this goal trough:

     1.     Stimulating economic growth
     2.     Reducing cost of living
     3.     Diversifying our economy
     4.     Creating a sustainable primary sector
     5.     Policy on the labor market and the enhancement of production
     6.     Developing the region of San Nicolas and neighborhood and Oranjestad.

As mentioned above, the government will implement a policy to safeguard a high level of quality of
                                                                                           Developing the
governance for a healthy and sustainable development and for the creation of investment   Policy      and
                                                                                           regiononof theSan
employment opportunities. At the same time, the focus is to reduce the cost of living, thelabor
                                                                                            cost of market
                                                                                                    doing
                                                                                           Nicolas       and
business on Aruba and reduce the red tape. This is necessary for a healthy investment climate
                                                                                          and     that will
                                                                                                       the
                                                                                           neighborhood
lead to economic growth, which encompasses more job creation and business opportunities,  enhancementwhile
reducing living expenses, all of which improves well-being in each home.                  of production

As far as the social sector is concerned, the government (2017-2021) acknowledges that this sector is
large, complex and coherent with other policy sectors that influence and reinforce each other. The
government puts emphasis on the central role of the human being in their policy. Attention will be paid
to social problems in the community caused by various factors. These are serious financial problems,
the problem of drug addiction and family problems. The government will address during the period
2017-2021 the social problems by working with more experts, identifying problems at an early stage,
paying attention to family problems, protection of vulnerable groups and give young people more
perspective in their lives. The vision of the government is to focus and strengthen the family nucleus,
protect vulnerable groups and to create cohesion and social responsibility in the Aruban community.

Finally, regarding tourism the government’s main objective for the period 2017-2021 is to increase the
quality of the tourism product to attract high-income tourists and create more activities to increase the
participation of tourism in our economy (Hunto pa Aruba, 2017)

1 Annex A

                                                                                            P a g e | 11
2 Current Conditions P a g e | 12
2. Current Conditions

2.1 GLOBAL ECONOMY IN A SNAPSHOT                      Centraal Planbureau (CPB) of the Netherlands,
                                                      Russia and Brazil as commodity producers are
The global economy is struggling with many            showing economic growth.
challenges. According to the IMF, there are
currently three threats to the world economy:         The Dutch economy continues to grow, which is
the tensions on the trade front, fiscal and           supported by an increase in domestic
financial risks and the ongoing struggle to           consumption, exports, government spending
achieve 'inclusive' or solidary growth. The latest    and investment, which amounts to 3.3 percent in
trade war between the US and China could trim         2017 and 2.5 percent in 2018 (CPB, 2018). In 2017
the global economic growth further through            the consumption grew rapidly due to the
2020.                                                 increase in disposable income, partly as a result
                                                      of the growth of employment. Companies and
After reaching its highest growth in 2017 during      government also contribute to growth: both
the past 6 years the world economy is expected        business investment and government spending
to grow with another 3.9 percent per year in 2018     are increasing. In the year 2019 the economy will
and 2019, according to the IMF. By 2020 it is         grow slightly less hard, under the influence of a
expected that this growth will moderate to 2.9        more moderate growth in investments. The
percent as global slack dissipates, trade and         Netherlands is currently benefiting from the
investment moderate, and financing conditions         favorable economic developments in Europe
tighten, according to the World Bank.                 and the rest of the world as an open economy.
                                                      On the other hand, the Netherlands runs
Among        advanced          economies,    growth   relatively larger risks if the economy turns in
divergences between the United States on one          Europe or beyond (Miljoenennota, 2018).
side, and Europe and Japan on the other, are
widening. According to the IMF, growth is             As mentioned before the global economy is
slowing in the Eurozone, Japan and the United         confronting its challenges and one important
Kingdom. A growth of 2.2 percent in 2018 and 1.9      challenge that the world is dealing with,
percent in 2019 are estimated for the Eurozone.       according to United Nations, is the environment
According to the Centraal Plan Bureau (CPB) in        degradation, inequalities and institutional
the Netherlands, the uncertainty about the            obstacles to development. The Sustainable
monetary policy of the European Central Bank          Development Goals        (SDG) have been
(ECB), the Italian banks that remain in the           presented as a tool to help countries deal with
danger zone due to distressed loans and weak          these obstacles. Considering OECD, close
profitability, will have its impact on the Eurozone   attention has to be made to skills development
economy. Also, growth prospects among the             and innovation capacity, the promotion of
emerging markets and the developing                   business dynamics and diffusion of knowledge,
economies appear to be uneven, due to rising          and preserving social cohesion by helping
oil prices, higher returns in the United States,      workers to make the most of a dynamic labor
                                                      market.
trade strains, and market pressures on the
currencies of some economies.        Growth in
emerging market and developing economies
(EMDEs) is projected to reach 4.9 percent and
5.1 percent in 2019 and 2020, up from 4.7
percent in 2018 (IMF, 2018). According to the

                                                                                          P a g e | 13
While economic growth, as measured by GDP, is may further slowdown the global economic
not an end in itself, it remains a precondition for growth. Chinese products are being levied with
enhancing human welfare. It provides the 10 percent tariffs, and as of 2019 they will be
resources necessary for improving health, increased to 25 percent.
education, and security. It is therefore important
for countries to closely monitor factors that “In the Central American region, agricultural
determine competiveness, while keeping an eye export is expected to pick up and in the
on the wider societal goals and related tradeoffs Caribbean a growth is expected from post-
ensuring that future economic growth will require hurricane reconstruction, tourism, and
solutions that are more creative than any we commodity prices” (World Bank, 2018)
have seen so far (World Economic Forum, 2017).
Regarding education, international
organizations such as the OECD stress the Other regions that influence the economy of
importance of higher education, with its role to Aruba is the region of Latin America and the
bring the technology closer to the population. Caribbean. Forecasts indicate that due to
encouraging private consumption and
investment these regions will accelerate.
“Governments, businesses, and individuals
are experiencing high levels of uncertainty as
The political and economic situation in
technology and geopolitical forces reshape
Venezuela brings new challenges for Aruba in
the economic and political order that has
many ways. Not only it affects directly our
underpinned international relations and
economy, but it also effects the security and
economic policy for the past 25 years. At the
safety in the region in general and in Aruba in
same time, the perception that current
particular. This situation will be closely monitored,
economic approaches do not serve people
and its consequences minimized.
and societies well enough is gaining ground,
prompting calls for new models of human-
Regarding Aruba’s economy, considering
centric economic progress” (World
external volatility and our vulnerabilities, Aruba
Economic Forum, 2017).
has no other choice then to address and
prepare for these international challenges.
Aruba will have to address the international
2.2 IMPACT OF GLOBAL ECONOMY ON LOCAL challenges as stated by the IMF by encouraging
ECONOMY income mobilization and restoring fiscal buffers,
economic diversification, strengthening
As we know, global developments have an employees' skills, adaptation to promote
impact on Aruba’s economy. If we take a closer innovative and technological change and
look at neighboring countries, like the United addressing openness of trade.
States, the economic growth in the United States
at the beginning of 2018 has remained solid, 2.9 Another important aspect nowadays, which the
percent due to temporary fiscal stimulus. The US- economy paradigms cannot leave behind
dollar has increased by about 5 percent in the anymore, is the human aspect. As part of a new
weeks of July 2018. Although there is a solid economic model, the Aruban government has
economic growth in the United States, investors acknowledged the need of the human and
are looking forward to the 'tax cuts' that social aspect as part of the economic growth.
President Trump announced in early 2017, which On behalf of this, the government has
can lead to inflationary pressures that will embraced the human-centered approach to
increase the interest rates. This may have as a innovation. The government of Aruba hopes to
consequence an economic slowdown in the create more opportunities for the workforce,
United States. Another global concern is the youth and generations to come, to build
trade relationship between US and China which resilience in the Aruban economy through
P a g e | 14diversification and to increase government The decreased amount of public investments (64
efficiency, trust and transparency. Aruba will million in 2013, and only 47 million in 2017) proves
make use of all the available resources to that sizable government plans did not
stimulate a sustainable economic growth and materialize in the last couple of years. The
the wellbeing of its citizens. Economic introduction of the crisis levy in July 2018 will likely
diversification, an increase in productivity, affect real GDP through reduced consumption
fostering entrepreneurship and creating an in both the 2018 and 2019. In this respect we must
environment for innovation is high on the also take into consideration the tax reform
government strategic priorities. presented in December 2018 by the
Government. The potential effects of the tax
Finally, Aruba acknowledges that economic reform have, by the date of finalizing this
growth of our island can come at an document, not been accounted for by the CBA,
environmental cost. The government has but will certainly have a positive effect on the
committed itself to focus on the SDG Agenda real GDP for 2019. The CBA will review their
2030, which has an integral character, with the projections in the coming months using the
aim that the public sector, the community as results of the National Accounts (2013-2017).
well as the private sector cooperate to improve
the economic, social and environmental To pursue a prudent financial and economic
dimensions on the island. This in order to achieve policy, a nominal growth of the GDP of 1 percent
a balanced and sustainable development on is assumed for the upcoming years.
our island.
The presented indicators will be used to
2.3 LEADING ECONOMIC INDICATORS ARUBA determine the baseline of the economy in 2017
2014-2017 and to monitor the economy in the following
years. It is important to keep in mind that as said
This chapter gives a brief outline of the most before, to achieve a sustainable development,
relevant economic indicators of the economy. It trade-offs will need to be made. This means that
is not the intension to give an exhaustive within a policy coherence approach it is possible
explanation of the indicators but more an to focus on other non-economic indicators (such
overview of the trends in order to understand as the SDGs) to evaluate progress. And that
where we are standing at this point in time. instead of focusing on the traditional economic
growth the Government will focus primary on the
The Central Bureau of Statistics published in quality of life for all citizens and a development
March 2019 the National Accounts of Aruba, for in which the environment is not negatively
the period 2013-2017. These figures indicate a affected. This means a refocus of the economic
growth of real and nominal GDP between 2013 model of Aruba and the development of new
and 2017 of respectively 635 million and 500 economic sectors.
million florin. According to these calculations,
nominal GDP grew with 2.4% in 2014, 5.6% in A chapter specifically for tourism indicators has
2015, 1.6% in 2016 and 3.1% in 2017. Real GDP been included to illustrate the high dependence
growth was slightly different: 0.3% in 2014, 5.7% in on this sector and the risks involved. We are at
2015, 2.0% in 2016 and 2.0% in 2017. the crossroad of important decisions related to
the carrying capacity of the island, to balance
Growth during past years was realized in the need to protect the environment and to
particular due to increased exports (312 million) create new economic development.
decreased imports (-287 million), private and
public consumption grew only moderately and Even though the economy has slowly been
investments decreased with 10 million florin growing and more jobs have been created in
between 2013 and 2017. the tourism sector, this does not reflect in the
P a g e | 15salaries of the labor force in the tourism sector.
Graph 1: GDP at market prices, Import, Export,
The expected increase in the room inventory will
consumption and capital formation, ‘13-‘17
lead to more demand for low skilled labor and
low salaries. The question remains if the internal
Imports of goods and services
labor market is able to absorb this extra demand Exports of goods and services
for low skilled labor without the import of foreign Gross capital formation (Investments)
Final Consumtion
labor. Probably the import of foreign labor 10,000
cannot be excluded as history showed. This influx
8,000
of foreign labor will put extra pressure not only on 3,700 3,639 3,842 3,785 4,012
the labor market, but also on the housing sector, 6,000
educational system and health care. Aruba is a 4,000
small island and considered one of the best
2,000 4,195 4,167 4,133 4,148 4,239
tourist destinations in the Caribbean. To remain
attractive to the visitors, the livability on the island 0
will play a role on how the visitors experience -3,761
-2,000 -4,206 -4,208 -3,875 -3,919
Aruba as a tourism product. Given the expected
room expansion and its consequences on the -4,000
livability on the island, the experience of the -6,000
visitors could be negatively affected and putting 2013 2014 2015 2016 2017
at risk not only the whole tourist industry but also
the economic development of Aruba. Source: CBS
Therefore, the government will enforce a
moratorium on hotels in the region of north, only
permitting those hotel and condominium Graph 2: Real and nominal GDP & GDP per
projects that have already been committed. In capita. ’13 -‘17
the center of Oranjestad and San Nicolas small
5.6 Real GDP per capita 48,500
boutique hotels of maximum 15 rooms each will GDP at market prices
be permitted. In the Oranjestad port area the Real GDP 48,000
construction of a maximum of 100 rooms will be 5.4 47,500
GDP in Millions
approved. To stimulate new business activities in 47,000
San Nicolas a hotel of 600 rooms will be 5.2
46,500
constructed. All these hotel projects must
comply with regulations to safeguard the 46,000
5.0
environment and use sustainable building 45,500
materials and technologies. 45,000
4.8
44,500
44,000
2.4 GROSS DOMESTIC PRODUCT 4.6
43,500
The recently published National Accounts show 4.4 43,000
that nominal GDP grew with 1.6% in 2016 and 2013 2014 2015 2016 2017
3.1% in 2017. Real GDP grew with 2.0% in 2016 as Source: CBS
well in 2017. The nominal GDP per capita
increased from 45,460 florin annually in 2013 to
2.4.1 EMPLOYMENT
49,351florin in 2017.
During the year 2014 until 2016, the labor
Recently published economic projections for the participation has been fluctuating (graph 3). In
years 2018 and 2019 will be revised by the CBA, 2015 a decline in the labor participation rate can
based on the National Accounts data published be seen, 62.4 percent compared to 65,6 percent
by the CBS. in 2014. The unemployment rate also shows a
P a g e | 16fluctuation (graph 4), with a decrease in 2015 Capital formation decreased from Afl. 1,084
reaching 7.3 percent, and increase again in million in 2013 to Afl. 1091 million in 2017. The
2016 to 7.7 percent. Public Gross Capital Formation in the public
sector also shows a decrease from Afl. 64 million
Graph 3: Employment, - and participation rates, in 2013 to Afl. 47 million in 2017, equaling a
by sex, 1960-2016 decrease of 27 percent. The CBA conducts an
90 Employment rate, females annual Direct Investment Survey (DIS) for
Employment rate, males collecting the direct investment related data on
80 Participation rate, Males
Participation rate, Females inward direct investment positions by immediate
70 counterpart country, consisting of equity and
debt instruments. The Direct Investment in Aruba
60
(graph 5), has declined in 2015 compared to
50 2014, but this has been picking up since 2016 with
an amount of Afl. 156.9 million in 2017.
40
30
Graph 5: Private, public and total gross capital
20
formation and direct investments in Aruba, 2013-
10 2017
0 Private Investments Public Investments
1960 1981 2000 2011 2013 2015 Direct Investments
1,300
Source CBS 1,100
900
Graph 4: Employed and unemployed persons by 700
sex, 1960-2016 500
300
60,000 Employed females 6,000
100
Employed males
50,000 5,000 -100
Unemployed females
2013 2014 2015 2016 2017
Unemployed males
40,000 4,000 Source, CBS & CBA
2.4.3 CONSUMPTION
30,000 3,000
The Final Consumption (graph 6) shows a slight
20,000 2,000 increase since 2013. In total, Final consumption
increased with 4 million florin, equaling 1
10,000 1,000 percent. Consumption seems to pick up in 2017
with an increase in consumption of 2.2%.
0 0
The drop of consumption is clearly seen in the
government from Afl. 960 million in 2013 to Afl.
Source CBS
913 million in 2017. In contrary of a decline in
government consumption, an increase in
2.4.2 INVESTMENTS household consumption can be observed
during the past years. Household consumption
increased with 91 million florin between 2013 and
The Total Gross Capital Formation (graph 5) 2017.
shows a decrease since 2013 (1 percent). This
decrease is clearly seen in both the public and
the private sector since 2013. The Private Gross
P a g e | 17Graph 6: Private, public and total consumption, 2.4.5 BUSINESSES
2013-2017
The total amount of active businesses as
registered at the SVB has been growing since
Household and public consumption, 2013 to
2014 (graph 8). In 2014, there was a total of 3001
2017
4.5 active businesses and it has been increasing
in Millions
since then, reaching an amount of 3524 active
4.0
businesses in 2017.
3.5
3.0 Graph 8: Total number of active businesses,
2.5 2014-2017
2.0 3600 3524
1.5 3349
3400
1.0 3200 3136
0.5 3001
3000
0.0
2013 2014 2015 2016 2017 2800
2600
Source, CBA
2014 2015 2016 2017
Source, CBS 2018, SVB data file: Note these are businesses
2.4.4 CONSUMER PRICE INDEX excl. sole proprietorship
The consumer price index (graph 7) period The amount of new registered (opening)
average percent change, indicates the businesses (graph 9) from 2014 until 2017 has
development of the average inflation. The been fluctuating. The data shows that in 2016
development of the CPI shows a considerable there has been a decline in the total businesses
decline of -0.9 percent in 2016 and -0.5 percent registered compared to the years before, but it
in 2017 compared to 2014 and 2015 mainly has been picking up in 2017 by an amount of
caused by reductions in energy costs. 1343 business. This fluctuation is also seen in the
amount of closing businesses. The data shows
that there has been a decrease for businesses
Graph 7: Development of the period average closing, although in 2017 the amount of closed
inflation, Aruba, Curacao, USA, 2008-2017 /unregistered businesses is increasing.
10
CPI Aruba, Period Average Graph 9: Open/registered versus closed /
8
CPI USA, Period Average unregistered businesses
CPI Curacao, Period Average
6 Open/ registered during the year
Closed/unregistered during the year
1600
4 1398 1343
1400 1305
1188
1200
2
1000
0 800 795 713
678 647
600
-2 400
200
-4
2008 2009 2010 2011 2012 2013 2014 2015 2016 2017 0
Source, CBS
2014 2015 2016 2017
Source: Chamber of Commerce, 2018, Note these are
businesses excl. sole proprietorship
P a g e | 182.5 STATE OF THE TOURISM INDUSTRY 2 (graph 12). In 2017 Tourism Receipts grew with 6.5
percent in comparison to 2016 (graph 10). In
Any strategy to diversify the economy of Aruba 2018 Tourism Receipts is projected to grow by 4
must consider the important role that tourism percent.
plays in the economy and search for alignment
and synergies with the economic and Graph 11: Stay-ever visitors and cruise
environmental policies. The following graphs passengers, 2011 to 2017
gives us a glimpse of the state of the tourism
industry in Aruba for the period 2014-2017 and Total visitors
2,000,000
the direction the tourism policy will follow to Cruise passengers
1,800,000
contribute to a sustainable development.
1,600,000
Graph 10: Key performance indicators – tourism 1,400,000
industry, 2014-2017 1,200,000
1,000,000
Average annual growth, 2014-2017 800,000
8% 600,000
7%
7% 400,000
6%
200,000
5% 4% 4%
4% 0
3%
3% 2011 2012 2013 2014 2015 2016 2017
2% Source: ATA
1%
0% Graph 12: Total tourism receipts, and receipts per
Stay-over Tourism Revenue per Cruise
visitor receipts available passengers
visitor and per visitor per night, 2011 to 2017
arrivals room
Tourism receipts (in Afl. Million)
Source: ATA Tourism receipts by visitor
3.5 390
Tourism receipts per visitor per night
Receipts in Millions
3.0 380
Over the last 4 years stay-over visitor arrivals grew
on average with 3 percent (graph 10). During this 2.5
370
period steep fluctuations (graph 11) were
2.0
observed, that are linked to the challenged
360
domestic economic and political situation in
1.5
Venezuela, however also to a strong demand
350
out of the US in 2017 (+11 percent). When we 1.0
exclude arrivals from our second largest market
0.5 340
Venezuela, we see a growth of 9 percent in 2017
over a year basis. The strong growth out of the US
0.0 330
market is projected to continue in 2018, however 2011 2012 2013 2014 2015 2016 2017
accompanied with a strong decline out of Source: CBA and ATA
Venezuela. Consequently, the ATA projects 2018
to end with a decline of 1 percent in stay-over The average annual growth of revenue per
available room is 7 percent over the 2014-2017
visitor arrivals.
period (graph 13). RevPar has shown a
The average annual growth rate of Tourism consistent increase, closing 2017 with an
Receipts is 4 percent over the period 2014-2017 increase of 11 percent, which was exceptional
(graph 13). Compared to the other Caribbean
2 Aruba Tourism Authority, September 2018
P a g e | 19destinations, Aruba improved its ranking position 2.5.1 CARRYING CAPACITY
from # 7 highest RevPar in 2013 to 3rd position in
2017. AHATA projects that RevPar will grow by 13 Considering the rapid changing landscape of
percent in 2018. The average annual growth rate the tourism industry and the new travelers’
of cruise passenger arrivals is 4 percent over the demands, ATA completed its Destination
2011-2017 period (graph 14). The cruise industry Development Plan (DDP) in 2017, where its
will maintain its growth in the period ahead with strategic priorities as a destination were
arrivals estimated to consolidate in 2018. presented for a sustainable destination
development. As part of the Destination
Development Plan (DDP) implementation
Graph 13: Revenue per available room
strategy, the ATA made a commitment to all
Refpar in USD stakeholders to undertake a carrying capacity
205
study. This study is completed in the last quarter
200
of 2018. The purpose of this study was to “….
195
define a sustainable tourism growth model for
190 Aruba that is economically viable,
185 201 environmentally bearable and social equitable.”
180
The ATA has identified that Aruba’s 90s tourism
187
184 model does not apply today nor will it apply in
175 181
the future. The most important reasons are the
170 following;
2014 2015 2016 2017
Source: ATA
• Mature product – requires diversification
The above-mentioned statistics show a • Diminishing returns / digressive growth
continued growth in tourism arrivals and tourism • Maintain competitive advantage
receipts indicating a strong tourism industry, still • Rapid changing tourism industry
the question remains on how much this growth • New traveler demands
contributes to the wellbeing of the local • Density
population, especially the labor force working in
this industry and which has been the impact of
tourism on the environment. With this analysis ATA reached an important
conclusion; “Aruba has reached its carrying
Graph 14: Cruise Passenger Arrivals and ship capacity, overstretching its resources beyond
calls sustainable levels”.
Number of cruise passengers and ship calls, Graph 15: Aruba Product Lifecycle
2011 to 2017
Cruise passengers
Ship calls
900,000 400
800,000 350
700,000 300
600,000
250
500,000
200
400,000
150
300,000
100
200,000
100,000 50
0 0
Imperative in the immediate future is the
2011 2012 2013 2014 2015 2016 2017
implementation of a new tourism growth model
Source: ATA based on a High Value-Low Impact framework
P a g e | 20with benefits for the community, the visitors and Graph 16: Government Revenue and
the environment is necessary. Finally, key actions Expenditures (US$ in millions, deficit as % of GDP)
have been identified that will be undertaken to
1,000 20%
manage Aruba’s capacity, which are the 914
871
900 18%
following: 809 790
778 779
800 722 729 16%
702
• Visitor Flow Management: monitor, 700 663 665 14%
600
control and decrease (in case needed) 600 12%
capacity at key tourist locations.
500 10%
• Indicator Framework: continue to assess 380
379
400 8% 8% 8%
visitor use at each priority site and 7%
manage tourism flows so as to enhance 300 6%
overall visitor experience. 200 4%
3%
• Balanced Growth: advocate and 100
2%
2% 2%
facilitate continuous dialogue between
0 0%
stakeholders so as to seek alignment and 2012 2013 2014 2015 2016 2017 2018
foster a sustainable tourism
Revenue Expenses Surplus/Deficit
development, including a balanced
Source: Department of Finance.
accommodation mix.
• Execute Roadmap. Aruba continues to implement measures to keep
the general government deficits on a declining
path. The following principal macroeconomic
2.6 OVERVIEW OF CURRENT FISCAL SITUATION assumptions form the basis for the central
AND TAX REFORM 3 government's 2018 budget:
The government has made considerable
Principal Budgetary Assumptions for 2018 & 2019
progress to reduce its fiscal deficit in recent
years. The central government deficit was an Projected nominal GDP growth: 1.0 percent
average of 2.0 percent of GDP in 2015 to 2016, Projected inflation: 0.3 percent
down from 9.4 percent in 2014 (graph 16). The
Source: Ministry of Finance, Economic Affairs and Culture.
fiscal improvement reflects measures to reform
the pension and health system in 2014, the
The Government uses a conservative nominal
establishment of CAft (College Aruba financieel
GDP growth rate of 1.0 percent in the 2018
toezicht, an independent council in charge of
budget to diminish any possible downside risks.
fiscal oversight), ongoing expenditure cuts, and
Projected for 2018 are revenues of AFL 1,363.59
more efficient tax collection within the fiscal
million (US$ 757.55 million) and expenditures of
framework that was established in 2015.
AFL 1,513.49 million (US$ 840.83 million).
The revised fiscal consolidation plan, under the
supervision and recommendations of CAft
involves reducing spending and boosting tax
revenues. In 2019 the deficit is projected at 0.5
percent, in 2020 a surplus of 0.5 percent is
projected and in 2021 a surplus of 1.0 percent.
The Government has demonstrated the ability
and commitment to implement fiscal responsible
policies. In order to curb the national debt and
guarantee sustainable and sound public
3 Department of Finance Aruba
P a g e | 21finances, a number of measurers took effect on ▪ The reduction of the top tax rate of 58
July 1, 2018. percent to 52 percent;
▪ Elimination of inheritance tax.
2.6.1 TAX REFORM
Furthermore, for the upcoming period the
The government is currently carrying out an
current administration, plans to optimize tax
extended tax reform through a four-phased
collection through:
plan. The first phase primarily concerns legislative
changes to the wage tax, personal income tax,
▪ Increasing the levels of compliance (i.e.
property tax and turnover tax. The
for all direct and indirect taxes and social
aforementioned changes were approved by
premium contributions);
the Parliament of Aruba in January 2019. In
▪ Implementation of a new tax collection
addition, the so-called “sin taxes” were
software system and increasing the
introduced. A sin tax is an excise or import duty
effectiveness of the current tax processes;
specifically levied on cigarettes, alcohol and
▪ Digitalization of various tax forms;
other unhealthy products.
▪ Improved administrative structures and
procedures;
As of January 1, 2019, the rates for wage tax and
▪ Reducing and/or eliminating the existing
income tax have been reduced in such a way
backlogs.
that a total of 30,000 people will not be subject
to Aruba wage tax/income tax. In addition,
2.5.2 BUDGET POLICY
25,000 taxpayers will be subject to a lower wage
tax/income tax rate. Several measures are also Since 2003, the Government of Aruba has
being taken to ensure that senior citizens or implemented a budget policy that is aimed at
retired persons will benefit from this tax reform. reducing fiscal deficit with the goal of achieving
The property tax rates have been adjusted in balanced budget in the near future. The current
such a way that tax is now levied based on the administration wants to achieve sustainable
property value, and ranges from 0 to 0.6 public finances during the course of 2018-2021
percent. Finally, the income tax on dividends has (graph 17).
been reduced from 25 percent to 10 percent.
During the second phase, the focus will be on Graph 17: Fiscal balance as % of GDP
the indirect taxes (among others the BBO and
the import duties). During the third phase, taxes 6%
paid by businesses will be modernized (profit tax,
4%
dividend tax) and the income tax system will be
simplified and modernized. Finally, in the fourth 2%
phase the taxes which are paid by tourists will be 0%
reviewed.
-2%
Main highlights of recent changes to the Aruba -4%
tax legislation include: -6%
-8%
▪ The introduction of a self-assessment
(“VAS”) for the corporate income tax in -10%
2013 2014 2015 2016 2017 2018 2019 2020 2021
order to increase compliance;
Fiscal balance Primary balanced Laft norms
▪ The reduction of the corporate income tax
Source: Department of Finance.
rate from 28 percent to 25 percent;
▪ The introduction of a temporary crisis tax of
Note: LAft norms refer to the fiscal balance. The results for
1.5 percent (effective per July 1, 2018);
2013-20 17 are of the Central Government (GOA) only
▪ The increase of excise on gasoline;
P a g e | 22As with policies to support economic growth, the
government has set out a long-term program to:
▪ ensure the improvement and
sustainability of public finances in the
medium and long term;
▪ re-focus on the process-based
improvement of public finances through
new budget rules;
▪ continuing with financial supervision as to
further increase transparency;
▪ avoid overloading the future generations
by working on debt reduction;
▪ and position Aruba as a leading global
model for small island future economy
resilience.
P a g e | 233 Sustainable Economic Growth P a g e | 24
3. Sustainable Economic Growth

The aim of the Minister of Finance, Economic Affairs and Culture is to foster a sustainable economic
growth by stimulating new innovative businesses, creating inclusive and decent jobs, stimulate local
and foreign investment that will contribute to a higher quality of life of all citizens in Aruba. The Minister
in this endeavor will focus on an economic growth that takes into account the environmental and
social policies in order to have a sustainable economic growth. In this regard Policy Coherence for
sustainable development plays an important role. It is pivotal to approach the economic policy in an
integrated way with the social, environmental governance dimensions at all stages of this policy
making. Taking also into consideration that policy coherence is across all sectors .

In the following pages the social and environmental governance factors are being described. We
know that Economic Policy on its own cannot achieve Sustainable Development and that trade-offs
have to be made. For example, many challenges we face every day when envisioning economic
growth have to do with choices to limit environmental degradation and choices to increase the
wellbeing and quality of life of all citizens. So do we choose to continue with the economic growth in
tourism as we know even if it means environmental degradation? Is the economic growth really
increasing the wellbeing and quality of life of all citizens?

3.1     SOCIAL AND ENVIRONMENT FACTORS FOR SUSTAINABLE DEVELOPMENT

3.1.1   SOCIAL FACTORS FOR A SUSTAINABLE DEVELOPMENT

Sustainability (meeting today’s needs without            we assert that in the context of the Economic
compromising the resources of the future                 Policy, next to economic growth, the reduction
generations) and the fostering of the standard of        of inequality is paramount in attaining the
living and the economic health of the nation             Government’s policy aspirations.
state, is contended to be a primary concern of
economic development. Social development is              Fueled by the expansion of the tourism and
directly or indirectly related to economic               related industries, Aruba experienced a
development and pertains to improvements in              remarkable economic growth since the 1990’s,
living conditions and the standard of living in          and did withstand several global economic and
general.                                                 financial crises as well as domestic economic
                                                         shocks and financial challenges since the turn of
The government accord ‘Hunto Pa Aruba’                   the century to maintain a general growth trend.
promotes an inclusive and people centered                On the other hand, this economic growth did not
development. In fact, studies from, e.g., the            necessarily translate into real improvement of
World Bank based on insights from different              economic and living conditions of the general
countries indicate that the main determinant of          population. This economic growth was greatly
poverty alleviation is the combination of                spurred by more people working more hours
economic growth and reduction in inequality,             facilitated through the importation of relatively
leading to a (more) socially inclusive and               large number of migrant workers filling mostly low
sustainable economic development. In this light          skilled and low wages jobs, and not necessarily

                                                                                                P a g e | 25
through increased productivity. The proportion equivalized monthly income (Afl. 2,300), and 27
of the foreign-born population grew to 44,3 percent when applying the threshold of 70
percent in 2010 compared to 18,5 percent at the percent, which equated to a monthly income of
time of the 1981 Population and Housing Census, Afl. 1,610.
and 44.3 percent of the economically active
population was not born in Aruba. Graph 18: Poor households and households
Notwithstanding the relatively high vulnerable to poverty by region
unemployment rates throughout the 21st
century, just one year of negative net migration
50%
was registered since the year 1990. As the real Poor Vulnerable to poverty
45%
GDP increased at about the same rate as the
40%
population, the GDP per capita remained rather 28%
35%
flat since the early 1990’s implying that there was 30%
22%
17%
likely no discernible ensuing rise in the 25% 14%
16% 16%
12% 13%
population’s material well-being during this 20%
period. 15%
10% 21% 21% 22%
18% 18% 19% 17% 19%
In terms of welfare outcomes, the 5%
unemployment rate increased progressively 0%
from 0.6 percent in 1991 to 10.6 percent in 2010
before dropping to 7.7 percent in the year 2017
with the unemployment rate under the youth
(ages 15-24) becoming as high as 28.9 percent
in 2010 while the world average unemployment
rate was 13.1 percent, and that of the Latin Source, CBS
American and Caribbean region (15.1 percent)
in that same year. The latter was estimated at In this light we introduce the phenomenon of
17.9 percent in 2016. vulnerable employment with workers enduring
high level of instability. According to the 2010
Additional evidence of notable inequalities is the Census data, approximately 30 percent (29.3
fact that Aruba’s income distribution has been percent) of the workers in the Hotel and
worsening according to the estimations by CBS Restaurant industry branch had a gross monthly
Gini coefficient that ranged between 0.40 to income of Afl. 1,550 or less, and 58.3 percent
0.41 between 1991 and 2006 and increased to grossed below Afl. 2,000 per month. Similar results
0.44 in 2010. Further, the wage dispersion in 2010, were obtained for the trade and construction
or the gap between those with the highest branches of industry where proportions were
incomes and those with the lowest incomes, tallied at respectively 56.8 percent and 45.6.
compared to that in 1993 remained practically
the same. The above-stated suggests that the While the participation rate of women has
working class did not benefit from the tight labor improved notably since the second part of last
throughout most of the 1990’s, and hence, century, and is amongst the highest in the world
arguably did not get a fair share of the (59,5 percent in 2010), women are
economic boom. What is more, the real wages overrepresented in the lower income categories
have been stagnant across the whole income and underrepresented in the higher ones.
distribution since 2006.
Moreover, based on the 2010 Census data, one
in five households was deemed poor when
applying the normative relative poverty
threshold of 60 percent of the median
P a g e | 26Graph 19: Participation rates for females, 1960- in 2010.
2010
In this context, it is contended that inequality is a
100 main policy issue in Aruba. With the census in
90 2010 2020 we will have new data to be able to re-
2000
1991
evaluate the situation although indications are
80
1981 that the equality has not improved. Hence, the
70 1972
1960 need for a (more) integrated and targeted
60 developmental oriented approach to help
50 those in crisis and those furthest back not to fall
40 through the cracks. The social policy is high on
30 the agenda of the government and
programmatic responses will be directed in
20
breaching those gaps that are deemed unfair,
10
preventable and predictable. The government
0
has prepared and is executing the national
social crisis plan in which the human centered
approach is used to identify the social problems
Source, CBS
and come with specific actions to solve these
The rate for wage equality was 0.7 in the year problems.
2010. In particular single female parents are
lagging as 42 percent of the single mothers and Social protection will play a key part in reducing
25 percent of the single fathers reported a inequality. Identified policy objectives include
monthly income of less than Afl. 2,000, according the strengthening, on tripartite basis, of the
to the 2010 Census data. Actually, a majority (54 labour legislations’ implementation scheme; for
percent) of adults disagreed with the statement example, enacting the bill pertaining to
that social differences in Aruba are just and fair, occupational safety and health and increasing
according to findings of the 2009 Aruba Welfare the enforcement capacity of labour inspection
Survey data. through capacity enhancement and
imposement of fines as mechanisms promoting
Based on selected available indicators, the decent work. It also entails coordinated
output in education is deemed subpar in interventions across sectors and domains to help
different aspects. Despite having practically full students at risk to stay in school and achieve their
school participation at both the primary and potentials, and placement of the youth in the
secondary levels and a very low illiteracy rate, labour market, in addition to strengthening the
merely 12 percent of the population, of which child protection and safety system. A human
just 36 percent was born in Aruba, attained an rights-based approach promoting linking to or
equivalent of Bachelor Degree level or higher in including the target groups in mainstream
2010. Also the average retention rates in, e.g., programs is favoured. As mandated by the
the primary schools are considered relatively present government, the SDGs framework
high. For the academic years 2014-2015 and promoting an integrated sustainable
2015-2016, the average retention rate per development approach will serve as a contour
beginning 2015 was 5.0 percent for boys and 6.2 for the realization of the above stated.
percent for girls. Lastly, noteworthy is the fact
that the proportion of the youth population (15- The government decided to implement an
24) not attending school at the time of the Integral Social Crisis Plan with the following
administration of the respective Population and general goals:
Household Censuses who reported not attaining
any secondary school’s diploma grew from circa 1. Establishing a broad and integrated 'child
37 percent in the year 2000 to circa 42 percent protection system' across the entire social, care,
P a g e | 27You can also read