SCOTLAND'S ECONOMIC STRATEGY - MARCH 2015 - www.gov.scot/economicstrategy

Page created by Melissa Valdez
 
CONTINUE READING
SCOTLAND'S ECONOMIC STRATEGY - MARCH 2015 - www.gov.scot/economicstrategy
SCOTLAND’S
  ECONOMIC
  STRATEGY
  MARCH 2015

www.gov.scot/economicstrategy
SCOTLAND'S ECONOMIC STRATEGY - MARCH 2015 - www.gov.scot/economicstrategy
SCOTLAND’S
ECONOMIC
STRATEGY
MARCH 2015

Scottish Government, Edinburgh 2015
SCOTLAND'S ECONOMIC STRATEGY - MARCH 2015 - www.gov.scot/economicstrategy
2 SCOTLAND’S ECONOMIC STRATEGY

Photo Credits:
Cover
Graduates – Graduates, Calton Hill, Edinburgh
Smokies – Iain R Spink’s Original Smokies, Arbroath Harbour
Aberdeen Harbour

Content pages
The Kelpies – The Helix, Falkirk
Whisky Inverlochlairg, Loch Lomond and The Trossachs National Park
All other images courtesy of © Scotland.org, Scottish Viewpoint and iStockphoto

© Crown copyright 2015

This publication is licensed under the terms of the Open Government Licence v3.0 except where
otherwise stated. To view this licence, visit nationalarchives.gov.uk/doc/open-government-licence/
version/3 or write to the Information Policy Team, The National Archives, Kew, London TW9 4DU,
or email: psi@nationalarchives.gsi.gov.uk.

Where we have identified any third party copyright information you will need to obtain
permission from the copyright holders concerned.

This publication is available at www.gov.scot

Any enquiries regarding this publication should be sent to us at
The Scottish Government
St Andrew’s House
Edinburgh
EH1 3DG

First published by The Scottish Government, March 2015
ISBN: 978-1-78544-172-1 (web only)

E-book in EPUB format first published by The Scottish Government, March 2015
ISBN: 978-1-78544-173-8 (EPUB)

E-book in MOBI format first published by The Scottish Government, March 2015
ISBN: 978-1-78544-174-5 (MOBI)

Published by The Scottish Government, March 2015

Produced for The Scottish Government by APS Group Scotland, 21 Tennant Street, Edinburgh EH6 5NA
PPDAS44780 (03/15)
SCOTLAND'S ECONOMIC STRATEGY - MARCH 2015 - www.gov.scot/economicstrategy
SCOTLAND’S ECONOMIC STRATEGY 3

CONTENTS

FOREWORD
EXECUTIVE SUMMARY
INTRODUCTION
4-15

SECTION 1 ECONOMIC CONTEXT
16-33

SECTION 2 OUR FRAMEWORK AND PRIORITIES
34-75

SECTION 3 IMPLEMENTING THE STRATEGY
76-82
SCOTLAND'S ECONOMIC STRATEGY - MARCH 2015 - www.gov.scot/economicstrategy
4 SCOTLAND’S ECONOMIC STRATEGY

FOREWORD

Since 2007, this Government’s central purpose
has been to create a more successful country, with
opportunities for all of Scotland to flourish, through
increasing sustainable economic growth. This remains
the Government’s ambition to which all our efforts
and actions are directed and is at the core of our
Economic Strategy.

A strong, vibrant and diverse economy is       As a result of the actions we have taken,
essential to our national prosperity and       we have seen a period of sustained growth
in creating the wealth to support high         in Scotland’s economy over the last couple
quality public services. Ensuring that         of years. Output has returned to above
growth is shared and sustainable is the        pre-recession levels, and there are record
key to unlocking all of Scotland’s potential   numbers of people in employment. Historic
and strengthening our greatest asset – the     gaps in the levels of productivity and
people of Scotland.                            earnings between Scotland and the rest
                                               of the UK have also been reduced.
Our people are creative, ambitious and
resilient and we are home to world-            The Economic Strategy in place since
class entrepreneurs and a highly skilled       2007, and our Economic Recovery Plans,
workforce. We will continue to build           introduced from 2009, have played a key
on these strengths to create a more            part in improving our economic performance.
competitive, more sustainable and
fairer economy.

Nicola Sturgeon MSP
First Minister
of Scotland
SCOTLAND'S ECONOMIC STRATEGY - MARCH 2015 - www.gov.scot/economicstrategy
SCOTLAND’S ECONOMIC STRATEGY 5

However, as we look forward, we want to       Creating a fairer society is not just a
achieve more than simply a return to pre-     desirable goal in itself, but is essential
recession levels of economic performance.     to the sustained, long-term prosperity of
We need to tackle the underlying              the Scottish economy. Our approach to
challenges in our economy and labour          economic policy is based on the principle
market, increase the competitiveness and      that delivering sustainable growth and
sustainability of the Scottish economy and    addressing long-standing inequalities
reduce inequality. We need to ensure that     are reinforcing – and not competing –
there are sufficiently skilled and well-      objectives.
paid job opportunities available, support
                                              Creating greater prosperity and fairness
the move to the low carbon age, take
                                              is a shared national endeavour. Only by
advantage of the opportunities presented
                                              working in partnership with the wider
by globalisation and technological change
                                              public sector in Scotland, the third sector,
and ensure that the benefits of economic
                                              trade unions, businesses and communities,
success are shared by everyone.
                                              will we be able to create a society where
Scotland’s Economic Strategy sets out an      the benefits of economic growth are
overarching framework for how we aim          shared more equally and where future
to achieve a more productive, cohesive        economic growth is stronger and more
and fairer Scotland. It forms the strategic   sustainable.
plan for existing and all future Scottish
Government policy. It prioritises boosting
investment and innovation, supporting
inclusive growth and maintaining our focus
on increasing internationalisation.

There is growing international evidence
that promoting competitiveness and
addressing inequality are important           Nicola Sturgeon MSP
interdependent ambitions.                     First Minister of Scotland
SCOTLAND'S ECONOMIC STRATEGY - MARCH 2015 - www.gov.scot/economicstrategy
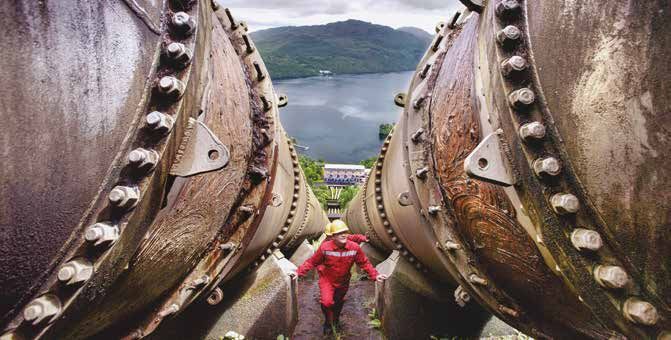
6 SCOTLAND’S ECONOMIC STRATEGY

EXECUTIVE SUMMARY

Aikengall Community
Wind Farm,
East Lothian
SCOTLAND'S ECONOMIC STRATEGY - MARCH 2015 - www.gov.scot/economicstrategy
SCOTLAND’S ECONOMIC STRATEGY 7

• Scotland’s economic prosperity                • Increasing Scotland’s economic
  depends upon the strengths and talent           performance also requires us to develop
  of our people, our natural resources,           the human capital and productivity of
  our infrastructure and how we are               all our workforce, to invest in Scotland’s
  governed. The overarching economic              infrastructure and to increase the ability
  and regulatory environment in which we          of people to participate in the labour
  operate also determines key social and          market in Scotland.
  environmental outcomes.
                                                • We have taken significant steps to boost
• Scotland is a wealthy and competitive           Scotland’s long-term competitiveness.
  economy by international standards.             This includes introducing the most
  However, many similar-sized economies           competitive business rates scheme
  perform better, not just economically,          in the UK, investing £11 billion in
  but also on measures of equality,               Scotland’s infrastructure in the three
  wellbeing and sustainability.                   years to 2015-16, establishing the
                                                  Curriculum for Excellence to raise
• In doing so they have delivered more
                                                  ambition and attainment in our schools
  sustainable, resilient and inclusive levels
                                                  and expanding the level of funded
  of growth.
                                                  childcare to help families with young
• This strategy sets out our ambition             children participate in the labour
  to create a more cohesive and                   market. We will build on these actions
  resilient economy that improves                 by establishing a Scottish Business
  the opportunities, life chances, and            Development Bank to support SMEs in
  wellbeing of every citizen in our               Scotland with high growth potential,
  country.                                        taking forward a package of measures to
                                                  boost business investment in innovative
• Our purpose of creating a more                  activity including establishing a new
  successful country, with opportunities          Ministerial-led Innovation Forum;
  for all of Scotland to flourish, through        and providing 30,000 new Modern
  increasing sustainable economic growth          Apprenticeships every year by 2020.
  remains at the centre of our approach.
                                                • In addition to increasing
• In doing so however, we are                     competitiveness, we must also reduce
  strengthening our approach to ensure            inequality. The international evidence is
  that everyone in Scotland has the               clear – that promoting competitiveness
  opportunity to fulfil their potential.          and addressing inequality are
                                                  interdependent. Reducing inequality is
• Our approach is therefore based on two
                                                  not only important in itself, but is vital
  key pillars: increasing competitiveness
                                                  to creating the conditions to deliver
  and tackling inequality.
                                                  sustainable economic growth over the
• Boosting competiveness is key to                long term.
  supporting long-term economic growth.
                                                • Growing inequality has however,
  This relates to our ability to help
                                                  become an increasing feature across
  new Scottish businesses to develop
                                                  many advanced economies. This has
  by supporting entrepreneurialism
                                                  been driven, in part, by global forces,
  and access to finance, encouraging
                                                  changes in technology and the global
  companies to become more innovative
                                                  regulatory environment and has been
  and to exploit new commercial
                                                  exacerbated by the impact of the global
  opportunities, and to help businesses
                                                  recession.
  to grow and expand both at home and
  overseas.
SCOTLAND'S ECONOMIC STRATEGY - MARCH 2015 - www.gov.scot/economicstrategy
8 SCOTLAND’S ECONOMIC STRATEGY

EXECUTIVE SUMMARY

• We are implementing a range of policies             • The core elements of our economic
  as part of this strategy which will make              framework are summarised below.
  a difference. These include an agenda
  for fair work, the Scottish Business                • The new framework signals a clear
  Pledge, support for the living wage and               direction of travel for all levels of
  gender balance on corporate boards.                   government in Scotland. It involves
                                                        a much broader approach to boosting
• Many of the key levers for addressing                 competitiveness and tackling inequality
  both competitiveness and inequality                   through a full integration of our
  however, remain reserved to the                       economic and social policies.
  UK Government. The strategy sets
  out our approach within areas of                    • We believe that a One Scotland
  current responsibility of the Scottish                approach is needed to deliver on
  Government but also makes the case                    our ambitions, with all public sector
  for key priority powers – particularly                agencies working together – recognising
  over the economy and welfare – to be                  that all can and should make a
  transferred to Scotland.                              contribution towards that growth –
                                                        as well as the private sector, the third
• In developing the Scottish Economic                   sector, and our universities and colleges.
  Strategy, we have built on our distinct
  Scottish approach, our focus on                     • Within Scotland’s Economic Strategy
  outcomes and our commitment to                        there are four broad priority areas
  partnership working.                                  where our actions will be targeted
                                                        to make a difference – investment,
• In order to achieve our ambition we                   innovation, inclusive growth, and
  require a whole economy approach,                     internationalisation.
  where partnership working and
  alignment are ever more significant,
  with a greater focus on key social and
  economic policies and a commitment
  to drive change.

Figure E.1: Scotland’s Economic Framework

                                               PURPOSE

                                                Increasing
                                               growth and
          COMPETITIVENESS                        tackling            TACKLING INEQUALITY
                                              inequality are
                                                 mutually
                                                supportive

         Investment              Innovation               Inclusive growth     Internationalisation
SCOTLAND'S ECONOMIC STRATEGY - MARCH 2015 - www.gov.scot/economicstrategy
SCOTLAND’S ECONOMIC STRATEGY 9

 Actions to deliver the four priorities for sustainable growth
Investing in our people, infrastructure and   To promote inclusive growth we will:
assets we will:                               • Promote Fair Work and build a labour
• Invest in Scotland’s people at all stages     market that provides sustainable and
  of life to ensure that we have a well-        well-paid jobs;
  skilled, healthy and resilient population   • Address long-standing barriers in the
  and an innovative, engaged and                labour market so that everyone has the
  productive workforce;                         opportunity to fulfil their potential;
• Provide the physical and digital            • Tackle cross-generational inequality
  connectivity needed to ensure that all        through, for example, improved child
  of Scotland is open to the national and       care, boosting attainment and early
  global economy and is able to access          years interventions that give every
  high quality public services;                 child a fair start in life; and
• Invest in Scotland’s infrastructure         • Realise opportunities across Scotland’s
  to help Scottish businesses to grow,          cities, towns and rural areas, capitalising
  innovate, and create good quality             upon local knowledge and resources to
  employment opportunities;                     deliver more equal growth across the
• Prioritise our investment to ensure           country.
  that Scotland protects and nurtures
  its natural resources and captures the      To enable Scotland to take advantage of
  opportunities offered by the transition     international opportunities we will:
  to a more resource efficient, lower         • Support Scotland’s exporters to grow
  carbon economy; and                           into new markets and expand their
• Invest in strengthening the success and       presence in key traditional markets such
  resilience of local communities.              as the EU and North America;
                                              • Encourage a more export-orientated
To foster a culture of innovation we will:      focus across all businesses and sectors
• Support the development of highly             in Scotland, and in particular amongst
  innovative businesses across the              our small and medium sized enterprises;
  Scottish economy;                           • Create the underlying conditions which
• Encourage more of Scotland’s diverse          will continue to make Scotland a major
  business base to engage in innovation         destination for investment;
  and research and development as part        • Use Scotland’s influence in Europe
  of their day-to-day activities;               and more widely to support our
• Continue to support the high-impact,          international ambitions and continue
  world-class research of Scotland’s            to make the case for Scotland to
  Universities and improve levels of            remain a member of the EU;
  commercialisation of academic research;     • Promote Scotland’s international
• Develop with key partners, such as            brand and showcase both Scotland
  business organisations and trade unions,      and Scottish goods and services
  innovative approaches to developing           internationally and secure major
  progressive workplace practices; and          international cultural and sporting
• Develop and deliver new approaches to         events; and
  public service reforms and make better      • Publish an International Framework,
  use of our public procurement to drive        which will set the context for how the
  innovation.                                   Government, its Agencies and Public
                                                Bodies, engage externally to promote
                                                Scotland – its economy and broader
                                                interests – and influence the world
                                                around us.
10 SCOTLAND’S ECONOMIC STRATEGY

EXECUTIVE SUMMARY

Figure E.2: Four priorities

   Education, skills and health                                           Business innovation and
                                                                                entrepreneurship
   Infrastructure and digital
                                                                            Workplace innovation
   Business investment                                                                and digital
   Natural capital, resource                                                 Commercialisation of
   efficiency and low carbon                                            research and development
   Communities, local assets       INVESTMENT     INNOVATION                       Public services
   and housing

   Trade                          INTERNATION-    INCLUSIVE                             Fair Work
   Investment                        ALISATION    GROWTH                          Business pledge
   International connectivity                                              Promoting equality and
                                                                               tackling inequality
   Global outlook, influence
   and networks                                                        Place and regional cohesion

• As set out in the framework above,              • To reach our ambition we will target our
  our approach to delivering sustainable            economic policies to our competitive
  economic growth is characterised by               strengths whilst also supporting growth
  four key priorities:                              across the wider economy and all
      An economy
    —	                where growth is              communities. This will involve a greater
           underpinned by long-term sustainable     focus on strengthening and developing
           investment in people, infrastructure     the skills of all our people, and local
           and assets;                              economies. We will promote innovation,
                                                    skills and training and international
      An economy
    —	                where growth is based
                                                    ambition across the Scottish economy.
           on innovation, change and openness
           to new ways of doing things;           • At the same time, our strategy will align
      A society
    —	               that promotes inclusive       our approach to social justice with our
           growth and creates opportunity           economic policies. For example, we
           through a fair and inclusive jobs        will take greater account of the links
           market and regional cohesion to          between the formal and unpaid care
           provide economic opportunities           services provided by individuals and
           across all of Scotland; and              the economy.

      A country
    —	              with an international
           outlook and focus, open to trade,
           migration and new ideas.
SCOTLAND’S ECONOMIC STRATEGY 11

• We will also support the important role        • We are already closing the gap in
  organisations across Scotland have –             productivity between Scotland and
  whether voluntary organisations, third           the UK and, if we are successful in
  sectors partners or through informal             each of our four priority areas, we
  relationships – which together empower           would expect to see further growth in
  local communities and underpin the               productivity. Our ambition remains to
  structures which many individuals rely           reach the top quartile of OECD countries
  on to participate within society.                in terms of productivity. We also aim
                                                   to be in the top quartile of countries
• We will also protect and enhance our
                                                   in terms of wellbeing, inequality and
  natural capital, our brand and reputation
                                                   sustainability. In addition, we aim
  as a country of outstanding natural
                                                   to reduce disparities in economic
  beauty, our commitment to low carbon
                                                   performance between regions and local
  and the opportunities our resources and
                                                   areas within Scotland.
  assets provide for our economy and
  future generations.                            • We will measure progress through the
                                                   National Performance Framework. As
• In summary, Scotland’s Economic
                                                   part of the development of our strategy
  Strategy sets out an overarching
                                                   we are updating the framework to
  framework for a more competitive and
                                                   reflect our new strategic approach.
  a fairer Scotland. It sets out the strategic
  direction for current and future Scottish      • This will include a programme of work,
  Government policy.                               to be undertaken in conjunction with the
                                                   new Council of Economic Advisers, to
                                                   develop a set of measures of Scotland’s
                                                   performance across a wider range of
                                                   dimensions of economic prosperity
                                                   to enable us to achieve a better
                                                   assessment of progress.
12 SCOTLAND’S ECONOMIC STRATEGY

INTRODUCTION
SCOTLAND’S ECONOMIC STRATEGY 13

The shared purpose of the Scottish Government
and its partners is to make Scotland a more
successful country, with opportunities for all
to flourish, through increasing sustainable
economic growth.

Scotland’s Economic Strategy sets out how
we will deliver on our vision for Scotland.      Four priorities
It brings increased focus to the dual
objectives of boosting competitiveness          Our approach to delivering Scotland’s
and tackling inequality, and sets out the       Economic Strategy is underpinned by four
priorities we will target to achieve these      priorities for sustainable growth:
mutually reinforcing goals.                     • Investing in our people and our
                                                  infrastructure in a sustainable way;
This is an approach supported by a
growing body of international research,         • Fostering a culture of innovation and
with recent analysis by the OECD and IMF          research and development;
demonstrating that countries with more
equal societies typically enjoy stronger        • Promoting inclusive growth and
                                                  creating opportunity through a fair
and more sustainable growth over the long
                                                  and inclusive jobs market and regional
run. A fairer and more equitable society
                                                  cohesion; and
underpins a strong economy.
                                                • Promoting Scotland on the international
It is therefore becoming widely recognised        stage to boost our trade and investment,
that reducing inequality and promoting            influence and networks.
growth are complementary goals. Creating
a fairer society is not just a desirable goal   Each priority is critical to the delivery of
in itself, but is essential to the sustained,   our vision for Scotland. Our policies and
long-term prosperity of the Scottish            resources will be aligned to deliver our
economy. This is a central theme of this        purpose of increased sustainable growth,
Economic Strategy.                              with opportunities for all to flourish.

Aberdeen
Harbour
14 SCOTLAND’S ECONOMIC STRATEGY

A STRATEGY FOR SCOTLAND                      We are committed to a One Scotland
                                             approach, where communities are
The independence referendum in 2014
                                             empowered to drive change and deliver
stimulated an unprecedented level of
                                             growth in the shared interest of the people
political engagement in Scotland and
                                             of Scotland.
resulted in an increasing number of people
taking a proactive interest in shaping       This document sets out our vision in more
the kind of country we live in. There        detail and how it will be delivered.
is a common desire to create a more
competitive and fairer country for current   DOCUMENT STRUCTURE
and future generations. We want to build
                                             This document is structured as follows:
on this sense of a shared endeavour.
                                             • Section 1 provides an overview of the
We cannot achieve our vision for Scotland
                                               economic context and evidence on the
alone.
                                               links between boosting competitiveness
The whole public sector in Scotland, the       and tackling inequality;
third sector, trade unions, businesses and
                                             • Section 2 sets out our four priorities
communities need to be onboard. Our
                                               for this refresh – innovation,
success as a nation depends on working
                                               investment, inclusive growth, and
together to deliver the shared vision of a
                                               internationalisation; and
stronger and more competitive economy
supporting a fairer society.                 • Section 3 sets out how we intend to
                                               implement the strategy.

Graduates,
Calton Hill,
Edinburgh
SCOTLAND’S ECONOMIC STRATEGY 15

A CLOSER LOOK AT SCOTLAND

             DIRECT FLIGHTS
             TO OVER 32                    7 HOURS FROM                           75 MINUTES
             COUNTRIES                     NEW YORK                               FROM LONDON

                                           45.5%
                                           OF THOSE EMPLOYED                HIGHEST
                                                       OUTPUT
                                           IN SCOTLAND HAVE A

 RANKED 1ST FOR INWARD                     H I G H E R PER HEAD
INVESTMENT                                 OR FURTHER
                                           EDUCATION                        IN THE UK
OUTSIDE LONDON                             QUALIFICATION                    OUTSIDE LONDON
                                           (COMPARED TO 40.9% IN THE UK)’   AND THE SOUTH EAST

INTERNATIONAL
SALES FROM            RANKED                SCOTTISH
                                            SALMON
SCOTLAND’S
OIL AND GAS SUPPLY    THIRD
                      IN EUROPE’S
                                            WAS THE 1ST
                                            FOREIGN PRODUCT
                                                                            HOME TO
CHAIN REACHED                               TO GAIN FRANCE’S                FIVE UNESCO
                      TOP 50 GAMES
£10 BILLION
IN 2012-13
                      DEVELOPER
                      LOCATIONS
                                            PRESTIGIOUS
                                            ‘LABEL ROUGE’                   WORLD
                                            QUALITY MARK                    HERITAGE SITES

4TOP200
          UNIVERSITIES
          IN THE TIMES HIGHER EDUCATION WORLD

                                      IN                                      ALREADY
                                   2014-15                                    GENERATING

                                                                               44%
      40
                                                                                             OF OUR

                                                                              ELECTRICITY
                                                                              NEEDS FROM
                                                                              RENEWABLES AND A
T H E    V A L U E       O F
                                                                              WORLD
SCOTTISH                                                                      LEADER
E X P O R T S BOTTLES OF
                                                                              IN THE FAST GROWING

                                                                              GREEN
HAS GROWN 40% SCOTCH WHISKY                                                   TECHNOLOGY SECTOR

BETWEEN 2007 AND 2013,          ARE SHIPPED OVERSEAS
REACHING £27.9BN IN 2013        EACH SECOND
16 SCOTLAND’S ECONOMIC STRATEGY

SECTION 1: ECONOMIC CONTEXT

 1
SCOTLAND’S ECONOMIC STRATEGY 17

Scotland has strong
economic foundations
We have a highly-skilled workforce,                                           The Scottish Economy –
substantial natural resources, a long-                                        Recent Trends
standing reputation for innovation,
internationally recognisable brands                                           Despite challenging economic
and products and companies competing                                          circumstances, since 2007, Scotland’s
successfully in global markets.                                               economic performance has improved,
                                                                              relative to the UK, across a range of
We have thriving energy, life sciences, and                                   economic indicators.
creative industries and social enterprise
sectors, while Scotland’s tourism and food                                    Long-standing gaps between Scotland and
and drink are internationally renowned.                                       the UK in terms of productivity, labour
                                                                              market participation and earnings have
Our universities are also amongst the                                         been reduced as outlined in Table 1.1.
best in the world with four universities                                      Scotland also has the highest employment
in the world’s top 200 – more per head                                        rate, lowest unemployment rate and
of population than any other country                                          lowest economic inactivity rate of all four
except Switzerland.                                                           UK nations.1
Our Economic Strategy will build on this                                      Further information on Scotland’s recent
strong starting point. It will focus on the                                   economic performance is provided
dual and reinforcing objectives of boosting                                   in Scotland’s National Performance
competitiveness and reducing inequality                                       Framework, as discussed in Box 1.2.
through our four priorities for sustainable
growth – investing in our infrastructure
and people, fostering a culture of
innovation, encouraging inclusive
growth and promoting Scotland on the
international stage.

Table 1.1: Key Economic Activity Indicators – Performance since 20072
    Indicator                                   Value in 2007      Rank                     Most recent value         Current rank
                                                                   (12 UK countries/                                  (12 UK countries/
                                                                   regions) in 2007                                   regions)

    1. GDP per head3                            £22,505            4th                      £25,065                   3rd

    2. Productivity   4
                                                £24.60/hr          6th                      £29.10/hr                 4th

    3. Disposable income5                       £13,851            5th                      £16,267                   5th

    4. Average full-time weekly pay6            £442               4th                      £519                      3rd

1
     ONS Labour Force Survey Oct-Dec 2014
2
     Most recent data: GDP per head comparisons are for 2013; productivity comparisons are for 2013; and Oct-Dec 2014; GDHI is for 2012; and full-
     time gross median weekly pay is for April 2014.
3
     Comparisons with the UK are for GDP per head using Quarterly National Accounts Scotland and ONS figures, and refer to the most recent set of
     consistent statistics, published in August. Scottish GDP is onshore only.
4
     Comparisons with the rest of the UK are based on GVA per hour worked in 2013, published by ONS on 24 December 2014 and fully consistent with
     estimates of GDP per head on an ESA10 basis in the latest Quarterly National Accounts Scotland.
5
     Gross Disposable Household Income (GDHI)
6
     Full-time Gross Median Weekly Pay
18 SCOTLAND’S ECONOMIC STRATEGY

These statistics relate to the onshore                                      There is therefore much to be positive
economy. Scotland’s onshore GDP was                                         about in terms of economic performance.
worth £134 billion in 2013. Including                                       Nevertheless, Scotland’s economy still
North Sea oil and gas production total                                      faces a number of challenges. Some of
Scottish GDP stood at £151 billion.7 The                                    these are linked to the recent recession
North Sea oil and gas sector remains a key                                  and are likely to unwind as we progress
part of Scotland’s economy. Whilst the fall                                 further in the recovery process, as
in oil prices at the end of 2014 has had an                                 discussed in Box 1.1. Others are more
impact on the sector, it is clear that with                                 structural in nature and will require a
an appropriate tax regime and supportive                                    dynamic change in Scotland’s long-term
policy environment the sector will make                                     economic performance.
an important contribution to Scotland’s
economy for decades to come.

Scotland has also continued to perform
well on the international stage. The value
of our international exports increased by
around 40% between 2007 and 2013.8
This growth has been achieved despite
challenging conditions in key export
markets, particularly in Europe. We have
also maintained our strong performance
in attracting international investment. In
2013 international investment to Scotland
was at its highest level since 1997 and
Scotland remains the top UK region outside
London for such investment. In fact, of
the 11 UK countries and regions outside
London, Scotland has ranked 1st or 2nd
every year since 2006.9

7
    Quarterly National Accounts Scotland 2014 Q3 (table X1, provisional estimates of GDP on an ESA10 basis)
8
    Scottish Government (2015) Global Connections Survey, http://www.gov.scot/Topics/Statistics/Browse/Economy/Exports/GCSIntroduction
9
    Ernst and Young (2014) EY 2014 UK Attractiveness Survey – Scotland,
    http://www.ey.com/UK/en/Issues/Business-environment/2014-Scotland-attractiveness-survey
SCOTLAND’S ECONOMIC STRATEGY 19

                          Box 1.1 – Global recession and economic recovery
The 2008 financial crisis resulted in the                                                           Scotland’s labour market has strengthened
deepest global recession in over 50 years.                                                          significantly since 2011, with the headline
As with virtually all other advanced                                                                unemployment rate falling consistently
economies Scotland experienced a                                                                    and now approaching its pre-recession
severe recession in 2008-09 with output                                                             average. The number of people in
contracting by 6%.                                                                                  employment is now at a record level with
                                                                                                    around 2.6 million in work.
Research into previous financial crises
has cautioned that, as well as being                                                                Nevertheless, the legacy of the recession
particularly severe, recessions that follow                                                         remains evident. For example, the number
financial crises typically entail a long                                                            of people underemployed, though falling,
recovery time. This was the case in the                                                             currently stands at 248,000, this is 32%
majority of advanced economies after                                                                higher than in 2008.10 Real wages in
2008 and Scotland was no exception. As                                                              Scotland, in common with many other
the chart highlights, by 2011 more than                                                             advanced economies remain substantially
two years after the end of the recession,                                                           below pre-recession levels.
output, employment, and wages in Scotland
were still well below pre-crisis levels.                                                            It is important to note that these economic
                                                                                                    improvements have occurred against a
Four years on, the economic context is                                                              backdrop of significant public spending
now different. We have seen a period of                                                             cuts as a result of the UK Government’s
sustained growth in Scotland’s economy.                                                             austerity and fiscal consolidation agenda.
As a result, many key economic indicators                                                           As a result, the Scottish Fiscal DEL budget
are close to, or above, pre-recession levels,                                                       has been cut by the UK Government by
see Figure 1.1.                                                                                     nearly 10% in real terms between
                                                                                                    2010-11 and 2015-16, with the risk of
                                                                                                    further cuts planned over the course of the
                                                                                                    next Spending Review.

Figure 1.1: Key Economic Indicators – Indexed to Q2 2008

                 104                                                                                                                               KEY

                                                                                                                                                    GDP LEVEL
                  102
                                                                                                                                                    EMPLOYMENT LEVEL (16+)
                 100
                                                                                                                                                    REGULAR REAL WAGES (UK)
Index (Q1 2008=100)

                       98                                                                                                                           FULL-TIME SHARE OF
                                                                                                                                                    TOTAL EMPLOYMENT
                       96

                       94

                       92

                       90

                       88
                            Q1 Q2 Q3 Q4 Q1 Q2 Q3 Q4 Q1 Q2 Q3 Q4 Q1 Q2 Q3 Q4 Q1 Q2 Q3 Q4 Q1 Q2 Q3 Q4 Q1 Q2 Q3 Q4
                                2008           2009           2010           2011            2012           2013                2014

                                                                                                       Source: Scottish Government & LFS, ONS

10
                      ONS Labour Force Survey, Jul-Sep 2014, not seasonally adjusted. The ILO definition of underemployment covers those “aged 16 or over who are
                      in work and would like to work longer hours in their current job, in an additional job or a different job altogether, at their current basic rate of pay,
                      given the opportunity”.
20 SCOTLAND’S ECONOMIC STRATEGY

The UK economy recorded one of the           Our response to the economic and social
weakest recoveries from recession            challenges we currently face must go
compared to other major international        further than simply aspiring to ensure
economies. This reflected a number           a return to pre-recession levels of
of factors – the impact and size of the      economic performance. The challenges of
financial sector, level of household         underemployment, youth unemployment,
indebtedness and the UK Government’s         low pay growth and weak productivity,
policy response relating to austerity.       all relate to, and in some cases are
                                             exacerbated by, patterns of inequality
                                             in Scotland.

                                             It is therefore important that we take a
                                             wider view that encompasses action to
                                             tackle inequality and ensure that economic
                                             growth is inclusive.

      Box 1.2 – National Performance Framework
Scotland’s National Performance              • Cohesion – The gap in labour market
Framework (NPF) underpins delivery of          participation between Scotland’s best
the Scottish Government’s priorities and       and worst performing regions has been
monitors the delivery of the Scottish          reduced between 2012 and 2013 –
Government’s purpose.                          although the gap remains larger than it
The framework contains a number of             was prior to the recession.
indicators which monitor improvements in     • Solidarity – Overall levels of income
a range of socioeconomic indicators across     in Scotland are rising, however, the
Scotland. The latest results show that         proportion of income received by the
Scotland has improved its performance in       bottom three income deciles has remained
many of the key areas identified in this       largely unchanged since 2006-07.
strategy:
                                             • Sustainability – In 2012, total Scottish
• Productivity – Productivity in Scotland      greenhouse gas emissions were 26%
  has risen relative to the UK. The gap in     lower than the 1990 baseline used in
  productivity between Scotland and the        the NPF.
  best-performing countries in the OECD
  has also been reduced since 2006 – the     The NPF will be central to monitoring our
  baseline used in the NPF.                  progress against the objectives set out in
                                             this strategy and is currently being updated
• Participation – Scotland has the highest   to reflect our new strategic approach. As
  employment rate among the four             part of this work, the Scottish Government,
  countries of the UK.                       in conjunction with the Council of Economic
                                             Advisors, will be developing an improved
• Population – The population of Scotland
                                             set of measures of Scotland’s performance
  is now at its highest ever. Since 2007
                                             across a wider range of dimensions of
  Scotland’s population has grown by 0.5%
                                             economic prosperity.
  a year on average, faster than in the
  EU-15 as a whole (0.4% a year).            These measures will reflect our ambition
                                             to rank in the top quartile of the OECD in
                                             terms of productivity, wellbeing, inequality
                                             and sustainability.
SCOTLAND’S ECONOMIC STRATEGY 21

Tackling Inequality
Ensuring that the benefits of economic                           These are not new trends. Income
growth are shared more equally across                            inequality among working age people
society is just as important as boosting                         increased faster in the UK between 1975
 Figure 1: Key Economic Indicators – Indexed to Q1 2008and the late 2000s than in any other
overall   growth.     Poverty     levels   in  Scotland
are too high and many people still face                          country in the OECD.13
poor
   104 economic prospects.          11
                                       The inequalities                                                    KEY
                                                                 In 1997-98, the richest 1% of income
that   exist between households and                                                                        GDP LEVEL
   102
                                                                 taxpayers in Scotland earned nearly 7% of
between different regions across Scotland                                                                  EMPLOYMENT LEVEL (16+)
                                                                 total pre-tax income. This share increased
prevent
   100      individuals and communities from                                                               REGULAR REAL WAGES (UK)
                                                                 to over 8% in 2010-11 meaning                     that the
maximising       their   potential.
                                                                 top 1% of income taxpayersFULL             in   Scotland
     Index (Q1 2008=100)

    98                                                                                                          TIME SHARE OF
                                                                                                           TOTAL EMPLOYMENT
As 96
    part of the UK, Scotland has been tied                       had an income greater than the bottom
to an economic model that has exacerbated 20% of taxpayers put together. This is
inequalities.
    94            Of the 34 OECD countries,                      illustrated in Figure 1.3.
the92UK ranked 29th in terms of income
inequality – in other words, the 6th worst
as 90
    outlined in Figure 1.2. Whist income
inequality
    88
               in Scotland is closer to the OECD
average     than the UK, Scotland is still more
        Q1 Q2 Q3 Q4 Q1 Q2 Q3 Q4 Q1 Q2 Q3 Q4 Q1 Q2 Q3 Q4 Q1 Q2 Q3 Q4 Q1 Q2 Q3 Q4 Q1 Q2 Q3 Q4
                        2009                    2011
unequal 2008than many other2010      countries and 2012                  2013                 2014

                                                                    Source: Scottish Government & LFS, ONS
would rank 20th.

                                                                                                                                                                                               12
  Figure 1.2: Gini-Coefficients in the OECD
                           0.6

                           0.5

                           0.4
Gini-Coefficients

                           0.3

                           0.2

                           0.1

                            0
                                                                                                                                                                                                                                                               Australia
                                                                                                                                                                                                                                                                           Greece
                                                                                                                                                                                                                                                                            Japan
                                                                                                                                                                                                                                                                                    Portugal

                                                                                                                                                                                                                                                                                               United Kingdom
                                                                                                                                                                                                                                                                                                                        Israel
                                                                                                                                                                                                                                                                                                                United States
                                                                                                                                                                                                                                                                                                                                 Turkey

                                                                                                                                                                                                                                                                                                                                          Chile
                                                                                                                                                                                                                  Scotland
                                                                                                                                                                                                                             Canada
                                                                                                                                                                                                                               Italy
                                                                                                                                                                                                                                       Estonia
                                                                                                                                                                                                                                                 New Zealand

                                                                                                                                                                                                                                                                                      Spain

                                                                                                                                                                                                                                                                                                                                 Mexico
                                                                                                                                                                          Germany

                                                                                                                                                                                                         France
                                                                                                                                                               Hungary

                                                                                                                                                                                    Ireland
                                                                                                                                                                                              Portugal
                                                                                                                                                                                                Korea
                                                                                                                                                            Switzerland
                                                                                           Slovak Republic
                                                                                                             Belgium
                                                                                                             Sweden
                                                                                                                       Luxembourg
                                                                                                                                    Netherlands
                                                                                                                                                  Austria
                                                      Denmark
                                                                Czech Republic
                                 Slovenia

                                                                                 Finland
                                            Iceland
                                 Norway

11
                    In 2012/13 16% of people in Scotland were living in relative income poverty. Scottish Government (2014) Poverty and Income Inequality in
                    Scotland: 2012/13 http://www.gov.scot/Publications/2014/07/9247
12
                    Data from OECD international Gini comparisons post taxes and transfers, based on most recent year of data for each country. For most countries
                    this is based on either 2012 or 2011 figures, figure for Belgium from 2010 data and figure for Japan based on 2009 data. Data for Scotland from
                    2012-2013 Family Resources Survey, Households Below Average Income (HBAI) dataset.
13
                    In 2011, the OECD reported that income inequality among working age people increased more quickly in the UK than in any other OECD economy
                    since 1975. OECD (2011) Divided We Stand: Why Inequality Keeps Rising. http://www.oecd.org/unitedkingdom/49170234.pdf
14
                    Scottish Government analysis of the Survey of Personal Incomes (Public Use Tape)
22 SCOTLAND’S ECONOMIC STRATEGY

Figure 1.3: Change in share of total income among income taxpayers, by percentile
of taxpayer income, 1997-98 to 2010-11, Scotland15
                                                       1.2
Percentage point change in share of total income, Scotland

                                                        1.0

                                                             0.8
                  1997-98 to 2010-11

                                                             0.6

                                                             0.4

                                                             0.2

                                                             0.0

                                                    -0.2
                                                                   10   20   30         40        50        60          70   80   90
                                                                                  Percentiles by total taxable income

Rising income inequality plays a key                                                                         suggests wealth inequality is increasing at
role in determining a household’s ability                                                                    a faster rate than income inequality.18
to accumulate wealth. In Scotland, as
in almost all advanced economies, the                                                                        Such patterns of inequality have a
distribution of household wealth is even                                                                     negative impact on long-term economic
more unequal than the distribution of                                                                        growth and prosperity. The IMF found that
income. During the period 2008 to 2010                                                                       lower income inequality is correlated with
the wealthiest 30% of households owned                                                                       faster and more durable growth.19 Work by
76% of all private household wealth                                                                          Professor Joseph Stiglitz also concluded
in Scotland. The least wealthy 30%, in                                                                       that countries which are more unequal,
contrast, owned less than 2% of wealth.16                                                                    grow more slowly and are less stable.20
Forthcoming analysis of data from 2010-                                                                      Professor Stiglitz’s analysis suggests that
12 suggests little change in the extent                                                                      a concentration of income can restrict
of wealth inequality in Scotland and in                                                                      the economy in the long run by limiting
wider Great Britain.17 This trend has been                                                                   the potential of people to contribute in
mirrored internationally and evidence                                                                        a productive way; whilst inequality may

15
                    Scottish Government analysis of the Survey of Personal Incomes (Public Use Tape).
                    The Survey of Personal Incomes (SPI) is based on information held by HMRC on individuals who could be liable to UK tax. The analysis presented
                    in the chart only includes income (including employment and non-employment income) from taxpayers in Scotland for the given years. The SPI
                    contains a small number of composite records which are created for people with very high incomes over a set threshold, these combine high income
                    cases to provide an average income and anonomise the data. This analysis uses the information on composite records to create new records to
                    represent the income of Scottish taxpayers only.
16
                    Scottish Government (2014) Wealth and Assets in Scotland: 2006-10
                    http://www.gov.scot/Topics/Statistics/Browse/Social-Welfare/IncomePoverty/wealthscotland
17
                    Scottish Government (forthcoming) Wealth and Assets in Scotland 2006 to 2012
18
                    Piketty, T. (2013) Capital in the Twenty-First Century
19
                    Ostry, J., Berg, A. and Tsangarides, C. (2014) Redistribution, Inequality and Growth IMF Staff Discussion Note
                    http://www.imf.org/external/pubs/ft/sdn/2014/sdn1402.pdf
20
                    Macroeconomic Fluctuations, Inequality and Human Development, Stiglitz, J, Jan 2012,
                    http://dx.doi.org/10.1080/19452829.2011.643098
SCOTLAND’S ECONOMIC STRATEGY 23

also restrict government investment in the                                        International experience demonstrates
infrastructure, education, and technology                                         that it is possible to perform better on
that is required by a modern economy.21                                           measures of equality and wellbeing
There is also evidence on the impact                                              whilst also having a strong economic
of public sector investment on growth.                                            performance.
Mazzucato (2013) finds that public sector
investment has an important role in                                               For example, many northern European
supporting private innovation.22                                                  countries have achieved lower levels of
                                                                                  income inequality than the UK whilst
A recent working paper by the OECD drew                                           also performing better on key measures
similar conclusions, estimating that rising                                       of economic performance. For example
income inequality in the UK reduced GDP                                           the United Nation’s Human Development
per capita growth by 9 percentage points                                          Index (HDI) is a composite index based on
between 1990 and 2010.23 The OECD                                                 indicators of life expectancy, educational
analysis argues that the key driver behind                                        attainment, and income. The top-ranked
this finding is that income inequality                                            country in the 2013 HDI was Norway, in
undermines the education opportunities                                            addition Switzerland (3rd), the Netherlands
available for disadvantaged individuals,                                          (4th), Denmark (10th), Ireland (11th),
hampering skills development and reducing                                         Sweden (12th) and Iceland (13th) all
social mobility.                                                                  ranked above the UK (14th). As well as
                                                                                  having lower levels of income inequality,
                                                                                  all these countries, with the exception of
                                                                                  Ireland, had higher levels of Gross National
                                                                                  Income per capita than the UK in 2013.

       Figure 1.4: UN Human Development Index (HDI), 201324
             0.950
             0.940
             0.930
             0.920
             0.910
 HDI level

             0.900
             0.890
             0.880
             0.870
             0.860
             0.850
                   ay

                                                                    da
                           ia

                                                                      s

                                                                      s

                                                                     d

                                                                     e

                                                                    ce
                                                                     y

                                                                   nd

                                                                      )

                                                                     n

                                                                     n
                                  nd

                                                                     k

                                                                   en

                                                                    el
                                                                    d

                                                                     )
                                                                   m

                                                                   of
                                                                  nd

                                                                    e

                                                                  or

                                                                 AR
                                                                  an

                                                                 pa

                                                                  ei
                                                                 an

                                                                  ar
                        al

                                                                 an
                 rw

                                                                na
                                                                 at

                                                                an
                                                                 ra
                                                               do
                                                                la
                                la

                                                               ed
                                                              ap

                                                               st
                                                               la
                        r

                                                              lic
                                                               al

                                                             nm

                                                              (S

                                                              Ja
                                                             rm
                                                              St

                                                              el

                                                              Is
                     st

                                                             Ca

                                                            Ire

                                                             Fr
                            er
                No

                                                            en
                                                           ng
                                   er

                                                          Sw
                                                           Ze

                                                           ng

                                                          ub
                                                            c
                     Au

                                                          na
                          itz

                                                           d

                                                         Ge

                                                         De

                                                           I
                                  th

                                                         ht
                                                        Ki
                                                       ite

                                                        Si

                                                       ep
                                                        w

                                                       hi
                        Sw

                                Ne

                                                      ec
                                                    Ne

                                                      d
                                                    Un

                                                    ,C

                                                    (R
                                                  ite

                                                   Li
                                                ng

                                                  a
                                              Un

                                               re
                                             Ko

                                            Ko
                                          ng
                                       Ho

21
       Joseph Stiglitz has written extensively on the subject of inequality, for further information see: Economic Consequences of Income Inequality,
       Furman, J & Stiglitz, J, 1998, http://www.kc.frb.org/publicat/sympos/1998/S98stiglitz.pdf
22
       Mazzucato, M (2013), ‘The entrepreneurial state’
23
       Cingano, F. (2014) Trends in Income Inequality and Its Impact on Economic Growth OECD SEM Working Paper No. 163,
       http://www.oecd.org/els/soc/inequality-and-poverty.htm
24
       United Nations Human Development Index 2013 http://hdr.undp.org/en/content/table-1-human-development-index-and-its-components
24 SCOTLAND’S ECONOMIC STRATEGY

Income and wealth inequality are only                                          Gaps in educational attainment between
a small subset of overall inequalities in                                      disadvantaged children and their peers are
society and the economy. However, they                                         often apparent in the early years, and are
are strongly associated with – and indeed                                      likely to persist and widen through school
determinants of – wider inequalities across                                    and beyond. For example, evidence from
a range of social outcomes, such as health                                     the Growing Up in Scotland27 study finds
and education. These have a significant                                        lower cognitive ability among children
impact on people’s wellbeing, as well as on                                    from disadvantaged backgrounds as
their future opportunities.                                                    early as age 3. Students from the most
                                                                               deprived fifth of our communities only
For example, health inequalities and                                           account for one-seventh of our university
poor health outcomes reduce people’s                                           undergraduates.28
economic opportunities and have a negative
impact on the country’s overall economic                                       Regional Inequalities
performance.25 They can also place
                                                                               Ensuring that all regions and communities
additional pressures on the public sector.
                                                                               can prosper is important for both overall
Across the European Union it is estimated
                                                                               economic performance and ensuring that
that health inequalities resulted in economic
                                                                               all areas have the opportunity to fulfil
losses of between 1.5% and 9.5% of EU-25
                                                                               their potential.
GDP per year.26
                                                                               Significant variations exist in levels of
Scotland’s health is improving with many
                                                                               economic activity across Scotland. For
people living longer, healthier lives.
                                                                               example, output per person in Edinburgh
Nonetheless, significant health inequalities
                                                                               is £38,000 compared to £12,000 in East
persist, particularly in our most
                                                                               and North Ayrshire, see Figure 1.5.29 This
economically disadvantaged communities.
                                                                               reflects, in part, the nature of growth in
Addressing inequalities in educational                                         cities, which benefit from a concentration
outcomes also improves employment                                              of economic activity, also drawing in
opportunities and living standards                                             workers from surrounding areas. In
for individuals, as well as the skills of                                      addition, some areas of Scotland still
Scotland’s workforce.                                                          suffer the legacy of past industrial decline
                                                                               – for example, the management of the
                                                                               decline in industry and manufacturing in
                                                                               the 1980s by the UK Government which
                                                                               has contributed to concentrations of
                                                                               deprivation in some parts of Scotland.

25
     Those with poor health are less likely to be in employment. In 2012 70.6% of those aged 16–64 were in employment, of those with a disability or
     long-term limiting health condition 45.6% were in employment. Local Area Labour Markets in Scotland: Statistics from the Annual Population Survey
     publication. http://www.gov.scot/Topics/Statistics/Browse/Labour-Market/Local-Authority-Tables
26
     Estimates were produced for the EU-25 in 2004. Mackenbach, J, Meerding, W. and Kunst, A. (2007) Economic Implications of Socio-economic
     Inequalities in Health in the European Union Directorate-General for Health and Consumers
     http://ec.europa.eu/health/ph_determinants/socio_economics/documents/socioeco_inequalities_en.pdf
27
     Bradshaw, P (2011) Growing Up In Scotland: Changes in child cognitive ability in the preschool years, Edinburgh, Scottish Government;
     http://www.gov.scot/resource/doc/350161/0117210.pdf
28
     The latest data available is for academic year 2012-13, which shows 13% of Scottish domiciled entrants to full-time undergraduate courses come
     from the most deprived 20% of society. (Source: analysis of Higher Education Statistics Agency data)
29
     ONS Regional Gross Value Added (Income Approach), Workplace Based. 2013 Figures at NUTS3 Level
     http://www.ons.gov.uk/ons/rel/regional-accounts/regional-gross-value-added--income-approach-/index.html
SCOTLAND’S ECONOMIC STRATEGY 25

                    Figure 1.5: Regional GVA per head 201330
                    45,000
                    40,000
                    35,000
GVA per head (£)

                    30,000
                    25,000                                                                                                                                                                                                                                                                                                                                                                                                               Scottish Average
                    20,000
                    15,000
                    10,000
                      5,000
                           0

                                                                                                                                                                                                                                                                                                                                                                                                                                                              East Lothian & Midlothian

                                                                                                                                                                                                                                                                                                                                                                                                                                                                                          Caithness & Suth. & Ross & Cromarty

                                                                                                                                                                                                                                                                                                                                                                                                                                                                                                                                                          East & North Ayrshire
                                                                                                                                                                                                                                                                                                                                                                                                                                                                                                                                Dunbartons, Helensburgh
                                                                                                                                                                                                                                                                                         South Lanarkshire

                                                                                                                                                                                                                                                                                                                                 Inverclyde & Renfrewshire

                                                                                                                                                                                                                                                                                                                                                             Dumfries & Galloway

                                                                                                                                                                                                                                                                                                                                                                                   Scottish Borders

                                                                                                                                                                                                                                                                                                                                                                                                      Eilean Siar (Western Isles)

                                                                                                                                                                                                                                                                                                                                                                                                                                    Clackmannanshire & Fife
                                                                                                                                                                                       South Ayrshire

                                                                                                                                                                                                        Angus & Dundee City

                                                                                                                                                                                                                              Orkney Islands

                                                                                                                                                                                                                                                                               Falkirk

                                                                                                                                                                                                                                                                                                             North Lanarkshire
                                           Aberdeen City & Aberdeenshire

                                                                           Glasgow City

                                                                                                                                                                        West Lothian

                                                                                                                                                                                                                                               Lochaber, Skye Arran & Argyll
                               Edinburgh

                                                                                          Shetland Islands

                                                                                                             Perth & Kinross & Stirling

                                                                                                                                          Inverness, Moray & Badenoch

Whilst output per head varies by region                                                                                                                                                                                                                                                                                                                 The Scottish Index of Multiple Deprivation
in Scotland, these differences are smaller                                                                                                                                                                                                                                                                                                              incorporates a variety of different aspects
than those in the UK and many other EU                                                                                                                                                                                                                                                                                                                  of deprivation including employment,
countries, see Figure 1.6. However, progress                                                                                                                                                                                                                                                                                                            income, health, education, skills and
is needed. Countries such as Finland and                                                                                                                                                                                                                                                                                                                training, crime, housing and access to
Sweden have smaller regional differences                                                                                                                                                                                                                                                                                                                services, and assesses these at smaller
in GDP per person than Scotland.                                                                                                                                                                                                                                                                                                                        local levels.31

As well as differences between regions, there                                                                                                                                                                                                                                                                                                           Whilst some characteristics of disadvantage
is also a high level of variation in income                                                                                                                                                                                                                                                                                                             in rural communities are not all picked up
and economic activity within regions.                                                                                                                                                                                                                                                                                                                   on this measure, communities in rural areas
                                                                                                                                                                                                                                                                                                                                                        can face other types of challenges such as
                                                                                                                                                                                                                                                                                                                                                        accessibility and connectivity.

30
                   ONS Regional Gross Value Added (Income Approach), Workplace Based. 2013 Figures at NUTS3 Level
                   http://www.ons.gov.uk/ons/rel/regional-accounts/regional-gross-value-added--income-approach-/index.html. GVA per head is measured on a
                   workplace basis where output is allocated to the area where the economic activity takes place, not to where the workers reside. It is not a direct
                   indicator of residents’ income because many people live and work in different areas.
31
                   There are 6,505 datazones across Scotland.
                   http://simd.scotland.gov.uk/publication-2012/introduction-to-simd-2012/overview-of-the-simd/what-is-the-simd/
26 SCOTLAND’S ECONOMIC STRATEGY

   Figure 1.6: Comparison of Geographical Income Distribution at NUTS3 Level                                                               KEY
                                180                                                                                                       GEOGRAPHICAL RANGE
                                                                                                                                          OF GDP PER CAPITA
                                160
                                                                                                                                          NATIONAL GDP
GDP per capita – Euros (000s)

                                140                                                                                                       PER CAPITA

                                120

                                100

                                 80

                                 60

                                 40

                                 20

                                  0
                                             l

                                           ce

                                            n

                                                                  y

                                                               nd

                                                                m

                                                                                ce

                                                                                 y

                                                                                 m

                                                                                      d

                                                                                             nd

                                                                                                       ia

                                                                                                                  s

                                                                                                                         en

                                                                                                                                k

                                                                                                                                     ay
                                          ga

                                                                                                              nd

                                                                                                                              ar
                                          ai

                                                                                     an
                                                               al

                                                                              an

                                                                                                     tr
                                                            do

                                                                              iu
                                        ee

                                                                        an

                                                                                                                      ed

                                                                                                                                   w
                                                           tla

                                                                                               a
                                      u

                                       Sp

                                                            It

                                                                                                                             m
                                                                                                   us

                                                                                                             la
                                                                                   nl

                                                                                            el
                                                                          rm

                                                                           lg
                                   rt

                                                                                                                                 or
                                                         ng
                                      Gr

                                                                      Fr

                                                                                                                  Sw
                                                          o

                                                                                                                          en
                                                                                                           er
                                                                                          Ir
                                                                         Be

                                                                                 Fi

                                                                                                   A
                                 Po

                                                       Sc

                                                                                                                                 N
                                                                        Ge
                                                       Ki

                                                                                                          h

                                                                                                                         D
                                                                                                       et
                                                     d

                                                                                                       N
                                                   te
                                                 ni

 Source: Eurostat
                                                     U

Future Economic Challenges
Our ability to both increase Scotland’s                                                             The historic gap between levels of
competitiveness and reduce inequalities                                                             productivity in Scotland and the UK has
will be influenced by the challenges                                                                been reduced in recent years. However,
currently facing virtually all modern                                                               when seen in an international context,
advanced economies.                                                                                 there is a clear need to improve Scotland’s
                                                                                                    economic performance. Amongst the
A more detailed analysis of Scotland’s                                                              OECD countries Scotland currently ranks
performance on these key measures, and                                                              around the average but below many other
on Scotland’s wider economic performance                                                            Northern European economies such as
is provided in the Scottish Government’s                                                            Germany and Denmark.
State of the Economy report and in the
National Performance Framework.32                                                                   Rebalancing the Economy

Boosting Productivity                                                                               If we are to be successful in our ambitions
                                                                                                    for a more competitive and fairer Scotland
Improving our productivity is about                                                                 we must consider how we want the
making better use of all our resources                                                              structure of the Scottish economy
– whether they are our people,                                                                      to evolve.
infrastructure, or natural assets. It is the
principal long-term driver of economic                                                              We want to move Scotland onto a more
growth. More productive economies can                                                               balanced growth path, with a greater
produce greater quantities of goods and                                                             contribution to economic growth from
services for a given set of resources,                                                              investment and net trade, rather than
typically leading to higher incomes, living                                                         consumption. This will allow our economy
standards and wealth.                                                                               to better withstand economic shocks and
                                                                                                    help ensure that everyone in Scotland can
                                                                                                    contribute to, and benefit from, growth.

32
                       The latest State of the Economy report is available from http://www.gov.scot/Topics/Economy/state-economy. The National Performance Framework
                       can be accessed from http://www.gov.scot/About/Performance/purposestratobjs
SCOTLAND’S ECONOMIC STRATEGY 27

Key challenges for Scotland in this regard                                                       • Rebalancing the economy will require a
are the need to continue to grow and to                                                            stronger role for exporting companies
diversify the business base, reindustrialise,                                                      and sectors to increase sales in products
strengthen the role of export-generating                                                           and services. A strengthened role for
sectors and focus on encouraging firms to                                                          manufacturing will be a key part of this.
invest and to export.                                                                              Manufacturing firms are more likely to
                                                                                                   export and to invest in research and
• Scotland has a relatively small business
                                                                                                   development;34 whilst increasing the
  base with lower rates of business start–
                                                                                                   scale of the manufacturing sector can
  ups than the UK as a whole (see Figure
                                                                                                   help with wider equality objectives in
  1.7). Although progress has been made
                                                                                                   terms of addressing regional imbalances
  in recent years growing the business
                                                                                                   through local spillovers, while providing
  base remains an important issue to
                                                                                                   jobs that are typically high skilled and
  improve upon as a key driver of growth
                                                                                                   well paid.35
  and competition.
                                                                                                 • Increasing exports is also key to
• Recent data from the Global
                                                                                                   rebalancing Scotland’s economy. As well
  Entrepreneurial Monitor (GEM)
                                                                                                   as having positive implications in terms
  shows improvements in the level of
                                                                                                   of the resilience and sustainability of
  entrepreneurial ambition in Scotland in
                                                                                                   economic growthw, there is evidence
  recent years, now similar to UK levels
                                                                                                   that companies that are exposed
  and other major economies, but we will
                                                                                                   to international investment and
  need to build on this improvement by
                                                                                                   competition become more productive.36
  supporting entrepreneurship across the
                                                                                                   Scottish exports have increased by 20%
  entire Scottish economy.33
                                                                                                   in cash terms between 2010 and 2013
                                                                                                   marking good progress toward our
                                                                                                   target of boosting exports by 50% over
                                                                                                   the period 2010 to 2017.

Figure 1.7: VAT/PAYE – Registrations per 10,000 resident adults
                                    70
                                                                                                                                       KEY
VAT/PAYE registrations per 10,000

                                    65
                                                                                                                                        UK
                                    60
                                                                                                                                        SCOTLAND
        resident adults

                                    55

                                    50

                                    45

                                    40

                                    35

                                    30
                                         2002   2003   2004   2005   2006   2007   2008   2009   2010   2011   2012      2013

                                                                                                                      Source: ONS

33
               Global Entrepreneurial Monitoring Scotland 2013 http://www.gemconsortium.org/docs/download/3348
34
                    Scottish Government (2014) Reindustrialising Scotland For the 21st Century http://www.gov.scot/Publications/2014/06/5184
35
               For example, median annual gross earnings, for full-time employees in Scotland, in the manufacturing sector (£27,486 in 2014) are above the
               Scottish median (£27,046). Earnings are particularly high in a number of subsectors including manufacture of machinery and equipment (£35,617)
               and pharmaceuticals (£37,560). Annual Survey of Hours and Earnings 2014
36
               For example, analysis by Harris & Moffat (2013) finds that over the period 1997-2008, “…foreign owned firms contributed relatively more to
               aggregate productivity growth than UK-owned plants over the period.” The Contribution of FDI to Productivity Growth in Britain, 1997-2008, Harris
               and Moffat, March 2013
Labour Market Participation                                                                 • However, a gap remains between the
                                                                                              female labour market participation rate
Greater participation increases an
                                                                                              in Scotland and the best-performing
economy’s potential output and is essential
to supporting sustainable economic                                                            countries in the OECD, such as Iceland,
growth. Bringing more people into the                                                         Norway and Sweden. Employment rates
labour market is key to tackling poverty,                                                     among disabled people, some ethnic
inequality and social deprivation and                                                         minority groups and older workers in
improving health and wellbeing.                                                               Scotland also remain well below the
                                                                                              national average.37
• The participation rate in Scotland has
  been on an upward trend for the past                                                      • Youth unemployment in Scotland,
  20 years, as outlined in Figure 1.8.                                                        whilst lower than in most European
  Female participation rates in particular                                                    countries, also remains above the
  have seen a marked increase. As a                                                           overall unemployment rate in Scotland,
  result, Scotland has a similar or higher                                                    as discussed in Box 1.3.
  female participation rate than many                                                       • The number of people underemployed,
  advanced economies.                                                                         though falling, currently stands
                                                                                              at 248,000.38 Reducing levels of
                                                                                              underemployment and fully utilising
                                                                                              the skills of the Scottish workforce
                                                                                              are also key to supporting sustainable
                                                                                              economic growth.

Figure 1.8: Labour Market Participation Rate39

                            90.0                                                                                                        KEY

                                                                                                                                         MALE RATE

                                                                                                                                         SCOTLAND RATE
                            85.0
                                                                                                                                         FEMALE RATE
 Participation Rate (%)

                            80.0

                            75.0

                            70.0

                            65.0

                            60.0
                               1992   1994   1996   1998   2000   2002    2004     2006    2008     2010    2012     2014

                          Source: Labour Force Survey, Oct-Dec 2014 ONS

37
                Annual Population Survey 2012 and 2013 as cited in the Scottish Government Equality Evidence Finder
                http://www.gov.scot/Topics/People/Equality/Equalities
38
                ONS Labour Force Survey, Jul-Sep 2014, not seasonally adjusted. The ILO definition of underemployment covers those “aged 16 or over who are in
                work and wou ld like to work longer hours in their current job, in an additional job or a different job altogether, at their current basic rate of pay,
                given the opportunity”
39
                ONS, Labour Force Survey, Oct-Dec 2014
SCOTLAND’S ECONOMIC STRATEGY 29

         Box 1.3 – Youth employment

Youth employment outcomes have                                                  Whilst youth unemployment remains
important implications in terms of                                              above the pre-recession levels, significant
competitiveness and reducing inequality.                                        progress has been made in recent months,
                                                                                with Scotland’s youth unemployment
They are of particular relevance given                                          levels and rates now at their lowest in five
the long-term impact unemployment                                               years. Youth unemployment40 in Scotland is
at a young age can have on individuals                                          currently 14.5% – and is currently less than
and the economy as a whole, in terms of                                         half the level observed in some European
productivity and future participation in                                        countries.41
the labour market. There are also wider
implications, for life satisfaction and long-                                   However, whilst it has fallen by 6.8
term health outcomes.                                                           percentage points over the year it remains
                                                                                higher than the overall unemployment
Rates of youth unemployment tend to be                                          rate in Scotland, currently at 5.4%. Similar
higher than in the wider population. Higher                                     trends are observed in other countries.42
youth unemployment is due, in part, to                                          For example, in Denmark and Finland
young people having fewer demonstrable                                          youth unemployment rates are 10.7% and
skills and less work experience which can                                       17.9% while overall unemployment rates
make it harder to find employment. These                                        are 6.4% and 8.9%.
challenges have been magnified in recent
years as a result of the recession.                                             Our target is to reduce youth
                                                                                unemployment by 40% by 2021.

40
     Youth Unemployment Rates are non-seasonally adjusted – estimates for Scotland and UK are from the Labour Force Survey (LFS) Oct-Dec 2014 and
     covers those aged 16-24 while the figures for Denmark and Finland are from Eurostat and cover those aged 15-24.
41
     Spain (52.2%), Greece (50.3%), Croatia (48.1%), Italy (46.5%), Portugal (33.9%), Cyprus (31.8%) and Slovakia (30.2%). Source: Eurostat November 2014
42
     Headline Unemployment Rates are seasonally adjusted – estimates for Scotland and UK are from the Labour Force Survey (LFS) Oct-Dec 2014 and
     covers those aged 16+ while the figures for Denmark and Finland are from Eurostat and cover those aged 15-74.
You can also read