Economic Value of Wild Atlantic Salmon - Atlantic Salmon Federation Prepared for
←
→
Page content transcription
If your browser does not render page correctly, please read the page content below

Economic Value of Wild Atlantic
Salmon

Prepared for:

Atlantic Salmon Federation

Prepared by:

Gardner Pinfold

September, 2011
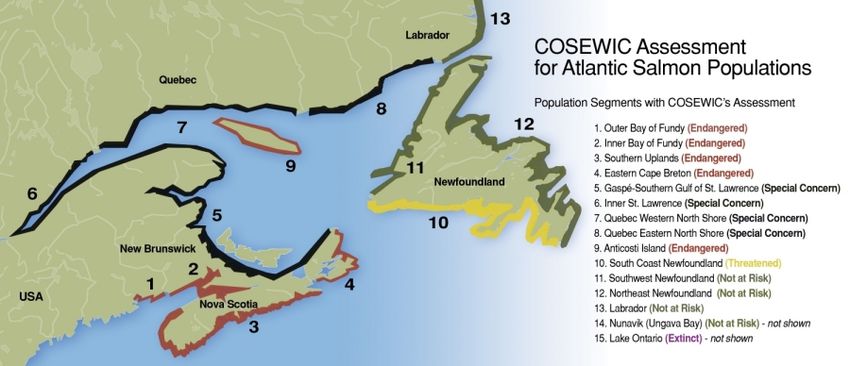

TABLE OF CONTENTS
                                                                                                                                Page

Executive Summary ......................................................................................................... i

I         The Study ............................................................................................................. 1
1.        Background ........................................................................................................... 1
2.        Objectives and scope ............................................................................................ 1

II        Approach ............................................................................................................. 3
1.        Total economic value ............................................................................................ 3
2.        Study tasks ............................................................................................................ 3

III       Salmon Overview ................................................................................................ 5
1.        Salmon life cycle and range .................................................................................. 5
2.        Population status and stressors ............................................................................ 5
3.        Government roles .................................................................................................. 8

IV        Use Values - Salmon Anglers ............................................................................ 9
1.        Angler survey ........................................................................................................ 9
2.        Survey of high economic impact camps.............................................................. 13
3.        Aboriginal fisheries .............................................................................................. 18
4.        Labrador resident food fisheries .......................................................................... 20

V         Other Use and Non-Use Values ....................................................................... 21
1.        Federal and provincial government ..................................................................... 21
2.        Academic research ............................................................................................. 22
3.        Non-profit conservation, restoration, and education spending is about $16 million
          ............................................................................................................................ 23
4.        Aboriginal FSC and food fisheries ....................................................................... 24

VI        Option, Existence, and Bequest Values .......................................................... 27
1.        Background and purpose .................................................................................... 27
2.        Salmon conservation choices ............................................................................. 28
3.        Choice survey results .......................................................................................... 30

VII       Case Studies ...................................................................................................... 41
1.        Overview ............................................................................................................. 41
2.        Exploits - NL ........................................................................................................ 41
3.        Margaree - NS ..................................................................................................... 46
4.        Miramichi - NB ..................................................................................................... 50
5.        Grand Cascapedia - QC ...................................................................................... 54

VIII      Total Economic Value ....................................................................................... 59
1.        Economic impacts from salmon-related spending .............................................. 59
2.        Total non-use value of wild salmon is $105 million ............................................. 62

IX        Investing in Wild Salmon .................................................................................. 65
1.        Basis for investing in wild salmon ....................................................................... 65

Gardner Pinfold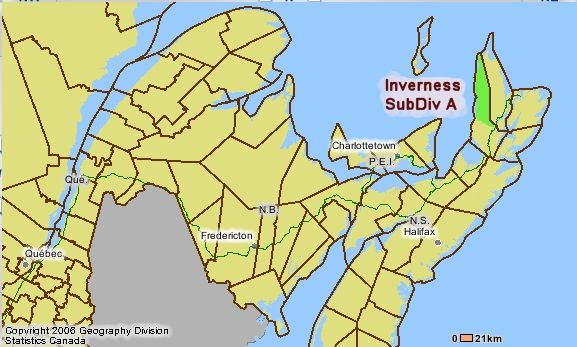
Economic Value of Wild Atlantic Salmon

2.         Making the case for investment .......................................................................... 66
3.         Building a comprehensive program ..................................................................... 68

References                 ............................................................................................................. 69

APPENDIX A:             Key Informants .................................................................................... A - 1
APPENDIX B:             Angler Surveys .................................................................................... B - 1
APPENDIX C:             Angler Survey Methods & Additional Results..................................... C - 1
APPENDIX D:             Choice Survey .................................................................................... D - 1
APPENDIX E:             Choice Methods and Data .................................................................. E - 1
APPENDIX F:             Atlantic & Québec Aboriginal Communities Maps .............................. F - 1

LIST OF TABLES
Total salmon-related spending by province by origin in 2010 ($millions) ......................................... i
Private camp spending on operations and capital by province (2010) ............................................ ii
Total salmon-related spending by activity by province, 2010 .......................................................... v
Total economic impacts of spending for eastern Canada, 2010 ($000s) ........................................ v

Table 4.1.1: Angler survey sample size versus number of salmon anglers by province ................. 9
Table 4.1.2: Average number of salmon fishing days by province in fresh and salt water ............ 10
Table 4.1.3: Angler survey responses for whether anglers fished enough for salmon in 2010 ..... 11
Table 4.1.4: Average salmon-related spending per angler by province by origin in 2010............. 12
Table 4.1.5: Total salmon-related spending by province by origin in 2010 ($millions) .................. 12
Table 4.2.1: Private camp anglers and fishing days by province (2010) ....................................... 17
Table 4.2.2: Private camp spending on operations and capital by province (2010) ...................... 17
Table 4.2.3: Private camp part-time, full-time, and person-years of employment
        by province (2010) ............................................................................................................ 17
Table 4.3.1: Aboriginal FSC fishery spending by province in 2010 ............................................... 19
Table 5.1.1: Fisheries and Oceans spending on salmon-related activities by province, 2010 ...... 21
Table 5.1.2: Provincial spending on salmon-related activities by province, 2010 ......................... 22
Table 5.2.1: Average annual spending on academic wild salmon research since 2001 ............... 23
Table 5.3.1: Non-profit conservation and education spending by province, 2010......................... 24
Table 6.3.1: Choice survey participant self-reported familiarity with Atlantic salmon topics ......... 30
Table 6.3.2: Choice survey participant rating of federal government spending priorities .............. 31
Table 6.3.3: Choice survey participant involvement in outdoor activities. ..................................... 31
Table 6.3.4: Choice survey participant membership in outdoor recreation and environmental
        organizations. ................................................................................................................... 32
Table 6.3.5: Influence of knowing “stakes” on annual willingness to pay (WTP) for different 20-
        year salmon conservation programs ................................................................................ 33
Table 6.3.6: Choice survey participant indicate other new actions they will consider taking after
        the survey ......................................................................................................................... 34
Table 6.3.7: Willingness to pay (WTP) per probable % increase in salmon abundance along the
        “likely” and “very likely” success paths ............................................................................. 38
Table 6.3.8: Why survey participants selected “none” in at least one of their choice tasks. ......... 38
Table 6.3.9: Scores for self-reported rankings of choice attribute importance .............................. 40
Table 6.3.10: Scores for self-reported rankings of rationale for wild salmon conservation and
        restoration ........................................................................................................................ 40
Table 7.2.1: Number of days fished for salmon and all fish in Exploits fishing region (2005) ....... 43
Table 7.2.2: Catch statistics for Exploits fishing region salmon fishing days (2005) ..................... 44
Table 7.2.3: Angler expenditures for the Exploits in 2005 (2010 dollars) ...................................... 44

                                                                                                                       Gardner Pinfold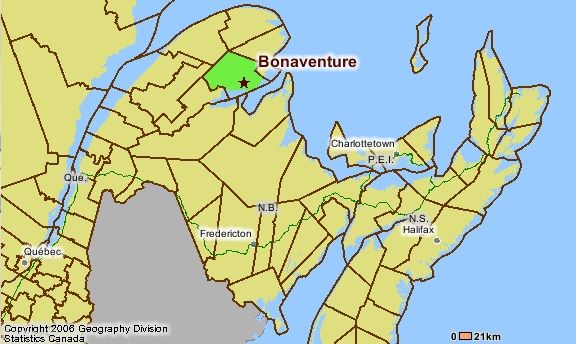
Economic Value of Wild Atlantic Salmon

Table 7.2.4: Historical salmon fishing statistics for NL from 1998-2010 (2010 dollars)................. 45
Table 7.2.5: Economic impacts of angler spending on the Exploits in 2005 ................................. 45
Table 7.3.1: Number of days fished for salmon and all fish in Inverness County (2005) .............. 47
Table 7.3.2: Catch statistics for Inverness salmon fishing days (2005) ........................................ 48
Table 7.3.3: Angler expenditures for the Margaree in 2005 (2010 dollars) ................................... 48
Table 7.3.4: Historical salmon fishing statistics for NS from 1998-2010 (2010 dollars) ................ 49
Table 7.3.5: Economic impacts of angler spending on the Margaree in 2005 .............................. 49
Table 7.4.1: Number of days fished for salmon and all fish in Miramichi (2005) ........................... 52
Table 7.4.2: Catch statistics for Miramichi salmon fishing days (2005)......................................... 52
Table 7.4.3: Angler expenditures for the Miramichi in 2005 (2010 dollars) ................................... 53
Table 7.4.4: Historical salmon fishing statistics for NB from 1998-2010 (2010 dollars) ................ 53
Table 7.4.5: Economic impacts of angler spending on the Miramichi in 2005 .............................. 54
Table 7.5.1: Number of days fished for salmon and all fish in G. Cascapedia (2005) .................. 56
Table 7.5.2: Catch statistics for Cascapedia salmon fishing days (2005) ..................................... 57
Table 7.5.3: Angler expenditures for the Cascapedia in 2005 (2010 dollars) ............................... 57
Table 7.5.4: Historical salmon fishing statistics for QC from 1998-2010 (2010 dollars) ................ 58
Table 7.5.5: Economic impacts of angler spending on the Cascapedia in 2005 ........................... 58
Table 8.1.1: Total salmon-related spending by activity by province, 2010 .................................... 59
Table 8.1.2: Economic impacts by salmon activity for eastern Canada, 2010 ($000s) ................. 61
Table 8.1.3: Total economic impacts of spending for eastern Canada, 2010 ($000s) .................. 61

LIST OF FIGURES
Figure 3.1.1: Wild Atlantic salmon global migration routes ............................................................. 5

Figure 3.1.2: Large and small salmon pre-fishery abundance since 1971 ...................................... 6

Figure 3.1.3: Map of COSEWIC assessment for wild Atlantic salmon populations ......................... 7

Figure 4.2.1: Distribution of spending by anglers in 2010 Gardner Pinfold survey ....................... 15

Figure 4.2.2: Simulated results for random 3% sample of top 10% of anglers according to
        spending in 2010 .............................................................................................................. 16

Figure 6.3.1: Annual household willingness to pay (WTP) for 20-year salmon conservation
        programs according to salmon abundance targets and “likely” or “very likely” success .. 36


Gardner Pinfold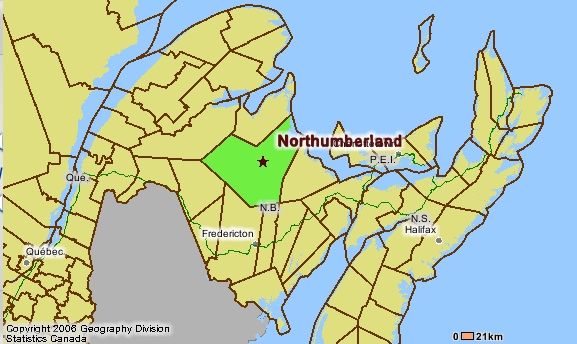
EXECUTIVE SUMMARY
Background
By most indicators, wild Atlantic salmon (Salmo salar) currently face daunting challenges to their
survival throughout much of their traditional range. Many of the historical rivers with salmon
runs have not seen salmon return in recent years, and global remaining populations may only be
20% of their historic levels.
Atlantic Salmon Federation (ASF) is dedicated to the conservation, protection and restoration of
wild Atlantic salmon and the ecosystems on which their well-being and survival depend. It is an
international non-profit organization headquartered in St. Andrews, NB, with regional offices in
Quebec, New Brunswick, Nova Scotia, Prince Edward Island, Newfoundland and Labrador and
Maine.
ASF is garnering support for large conservation initiatives and has commissioned this study in
which the primary goal is to estimate the economic value of wild Atlantic salmon in Canada’s
four Atlantic Provinces and Quebec. The findings can then be weighed against the costs of
various policy and project options. The study includes coverage of:
recreational fishing industry and tourism,
First Nations food, social and ceremonial fisheries,
conservation and enhancement activity, government roles, research and
existence value and other passive use values of the species.
In addition, four case studies are prepared for specific rivers including; the Exploits
(Newfoundland and Labrador), Margaree (Nova Scotia), Miramichi (New Brunswick), and Grand
Cascapedia (Quebec).
Recreational fishing
“Anglers spent an estimated $102 million in 2010 (excluding high economic impact camps).”
A survey of ASF members gathered information from 1,324 anglers and, after excluding those
who frequent high economic impact camps and lodges, the following spending results were
obtained.
Total salmon-related spending by province by origin in 2010 ($millions)
Residence NB NL NS PEI QC Total
Residents $28.0 $19.0 $3.3 $0.2 $21.1 $71.6
Other Canadians $8.3 $5.7 $0.6 $0.0 $2.9 $17.4
Visitors to Canada $7.6 $2.4 $0.4 $0.0 $2.7 $13.1
Total $43.9 $27.1 $4.3 $0.2 $26.7 $102.1
“Anglers at high economic impact camps spent an estimated $26 million in 2010.”
Spending and employment information was collected for 59 high economic impact salmon
fishing camps in four of Canada’s eastern provinces. These were targeted since the top 10% of
Gardner Pinfold i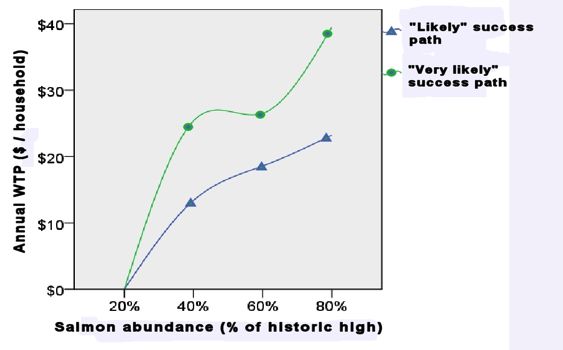
ii                                                        Economic Value of Wild Atlantic Salmon

anglers account for about 48% of total spending. There are upwards of 200 high economic impact
camps, and the 59 sampled provide improved coverage compared to random sampling through a
broad angler survey. The spending at the camps surveyed is presented by province.

Private camp spending on operations and capital by province (2010)
 Province          Operations             Capital               Total
 QC                $11,344,423         $2,359,186        $13,703,609
 NB                 $8,062,895         $1,997,369        $10,060,264
 NS                   $772,440            $50,000            $822,440
 NL                 $1,450,000           $114,000          $1,564,000
 Total             $21,629,758         $4,520,555        $26,150,313

This analysis of high economic impact camps likely underestimates the top 10% of anglers
according to spending. This segment of anglers, possibly representing up to half (48%) of all
spending, is less influenced by fluctuating circumstances and has spent relatively steadily for
decades according to reports from high economic impact camps. This would suggest that total
salmon angler spending has probably remained fairly stable and well above the $100 million
level. This finding differs from previous accounts of recreational salmon fishing expenditures that
fluctuate from a low of $62 million to a high of $191 million.

Aboriginal FSC and Labrador resident food fisheries
“Aboriginal food, social and ceremonial (FSC) fisheries and Labrador resident food fisheries
contribute over $400,000 in spending.”

This does not represent the full value First Nations place on the salmon harvest, only the spending
for such things as gear, supplies, and transportation. The total value is also a function of non-use
values discussed below.

First Nations fisheries for food social and ceremonial (FSC) purposes have priority over other
fishing activities according to the Supreme Court of Canada’s decision in R. v. Sparrow.
Conservation requirements for salmon are recognized and Aboriginals have piloted live trap gear
to replace gill nets. In general a more collaborative approach has been advanced with Aboriginals
increasingly involved in wild salmon management, science, and habitat enhancement projects.

A resident food fishery remained open in Labrador after the last commercial salmon fisheries
ceased in 1999. This is a directed fishery for trout allowing some by-catch of salmon.

Governments, academic researchers, and conservation
organizations
“Federal government spending is about $12 million and provincial government spending is about
$10 million.”

DFO is the lead federal agency with respect to wild Atlantic salmon and spending by other
agencies is negligible. DFO’s $12 million expenditures have historically been divided according
to enhancement and habitat restoration (46%), enforcement (27%), research (24%), and
management (4%).

                                                                                   Gardner Pinfold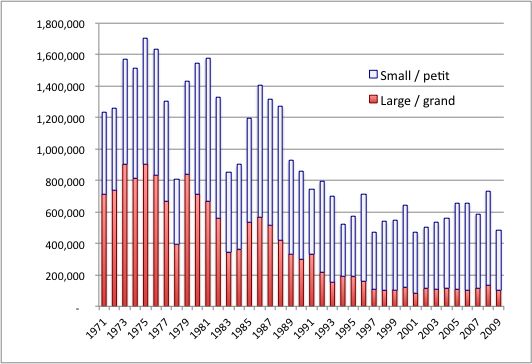
Economic Value of Wild Atlantic Salmon                                                           iii

“Provincial governments collectively spend about $10 million annually.”

Like the federal government the provinces undertake enforcement, monitoring, enhancement and
conservation, but take on a greater role with respect to licensing, tourism and marketing.

“Academic researchers spend $756,000 on wild Atlantic salmon research”

The majority of academic research is funded by the National Science and Engineering Research
Council (NSERC) and the Canadian Foundation for Innovation (CFI), but private sector
companies also contribute significant amounts.

“Non-profit conservation, restoration, and education spending is about $16 million.”

There are at least 126 non-profit organizations and facilities in eastern Canada with a mandate to
conserve salmon and deliver information and education programs. Environmental conservation
and restoration organizations not only spend money but also leverage in-kind contributions and
volunteer efforts with an estimated value of $12 million.

80% Public support and non-use value over $105 million
A random survey of 995 Canadians in Atlantic Canada and Quebec gathered information about
public understanding of salmon issues, willingness to invest in salmon restoration, and
preferences for a long-term wild salmon program.

“The public is not familiar with wild Atlantic salmon.”

When asked about several topics related to wild Atlantic salmon about 61-72% were either not at
all familiar or not very familiar. The survey was designed to provide basic information about wild
salmon to participants so they could still complete the survey.

“Reading one additional screen of information depicting “what’s at stake” in salmon
conservation decisions, took participants only 30 seconds and positively influenced the
proportion of supporters and their willingness to pay for conservation.“

Half of the survey participants were administered one extra screen of information to determine
the value of incremental education. This half was positively influenced to indicate up to an
additional $2.91 per tax-paying household or $11.5 million in total annual support across eastern
Canada.

“There is over 80% public support in Eastern Canada for a sustained 20-year program with new
annual investments of $53M - $157M that will “likely” or “very likely” restore Atlantic salmon
abundance to 40% - 80% of historic highs.”

There is clear support for any options that move wild Atlantic salmon restoration beyond the
status quo. The midpoint in the range of $53 - $157 million suggests there is over $105 million in
public non-use value associated with wild salmon, equivalent to $26 per tax-paying household.

“Eastern Canadian households want to be sure of what they are getting for their investment and
will pay an average premium of $0.18 for each percentage increase in salmon abundance that is
‘very likely’ instead of just ‘likely’. “

Gardner Pinfold
iv                                                         Economic Value of Wild Atlantic Salmon

Probability of success was the most important attribute in survey participant’s choices regarding
wild salmon conservation options. In total this represents $700,000 across tax-paying households
in eastern Canada, effectively for research that can ensure that proposed enhancement measures
will have high rates of success.

“The top two rationales for supporting wild salmon conservation were 1) that salmon should
exist, 2) the importance of natural heritage and ecosystem integrity.”

Survey participants were asked to rank their top three rationales from a list that also included
commercial fishing potential, research potential, international role in species at risk recovery,
recreational fishing potential, First Nations and cultural heritage. Only 7% of survey participants
indicated they would never support such conservation programs.

Four case-study rivers
The case study rivers, like nearly all salmon rivers in Canada, demonstrate that generating
sustainable economic activity is highly valuable, especially given their rural setting. The prime
tourism, recreation, food, and cultural values associated with salmon rivers represent excellent
local opportunities for enjoyment, advancement, and employment.

Exploits (NL) - The Exploits is now recognized as a world-class salmon river and one of the
most successful salmon enhancement projects in North America. In the late 1970s the returning
run of salmon numbered around 1,500 and now the run is self-sustaining at about 40,000 fish.
Annual spending of $3.5 million from angling, tourism, and conservation generates $3.0 million
in GDP, 73 full-time equivalent jobs, and $2.2 million worth of income.

Margaree (NS) - The Margaree-Lake Ainslie River System is a designated Canadian Heritage
River with protection afforded for both cultural and natural heritage values. Compared to the
other case study rivers, it has exceptionally high export value since it boasts the highest rate of
international angler attraction at two-thirds of all anglers on the Margaree. Annual spending of
$2.9 million generates $2.5 million in GDP, 70 full-time equivalent jobs, and $2.1 million worth
of income.

Miramichi (NB) - The Miramichi is recognized for having the largest salmon runs in the world.
The river is home to many salmon camps and lodges attracting visitors from many countries.
Over $20 million in annual spending generates $16 million in GDP, about 637 full-time
equivalent jobs, and $19.1 million worth of income.

Grand Cascapedia (QC) - The Grand Cascapedia is known for having some of the largest
salmon each year. Eighteen of the world’s fifty largest wild Atlantic salmon have come from
rivers of the Gaspe Peninsula including the Cascapedia. Annual spending of about $6.2 million
generates $7.2 million in GDP, 172 full-time equivalent jobs, and $5.2 million worth of income.

Total economic value
“Total spending in 2010 for wild salmon related activities is estimated at $166.0 million.”

This represents “output” in economic terms which is the starting point for the economic analysis.
Breakdowns of all spending are compiled by activity and by province.

                                                                                    Gardner Pinfold
Economic Value of Wild Atlantic Salmon v
Total salmon-related spending by activity by province, 2010
Activity NL NS NB PEI QC Total
Aboriginal and food $226,000 $10,000 $42,000 $0 $132,000 $409,000
Recreational fishing $28,630,000 $5,166,000 $53,951,000 $173,000 $40,363,000 $128,283,000
Federal govt $5,103,000 $2,846,000 $3,951,000 $100,000 $0 $12,000,000
Provincial govt $2,400,000 $560,000 $2,000,000 $300,000 $3,500,000 $8,760,000
Academic research $139,000 $190,000 $122,000 $121,000 $193,000 $765,000
NGOs $859,000 $2,142,000 $10,729,000 $309,000 $1,706,000 $15,745,000
Total $37,357,000 $10,914,000 $70,795,000 $1,003,000 $45,894,000 $165,962,000
“Salmon-related spending creates almost 3,873 FTE jobs and $128 million worth of income.”
The Statistics Canada inter-provincial input-output model is used to generate a set of
conventional economic indicators to show the economic impacts of spending. The FTE
employment estimate understates the number of people that depend on salmon related jobs, and
the total number of dependent jobs could be double since the majority are seasonal or part-time.
Total economic impacts of spending for eastern Canada, 2010 ($000s)
Total
Activities GDP Employment* Income
Aboriginal and food $328 4 $213
Recreational fishing $115,263 3,316 $100,242
Federal government $10,305 107 $7,327
Provincial government $7,414 122 $7,562
Academic research $825 12 $615
NGOs $15,376 311 $12,324
Total $149,511 3,873 $128,283
Source: Statistics Canada input-output analysis model.
*Employment in full-time equivalents (FTE).
“The total annual economic value of wild Atlantic salmon is estimated at $255 million.”
For reference, farmed Atlantic salmon in eastern Canada yielded $270 million in GDP value in
2006 (Gardner Pinfold, 2008). This does not include government spending or academic research
related to salmon aquaculture, so the findings in this study are not perfectly comparable. Having
said this, wild salmon-related GDP of $150 million is about 56% of the GDP associated with
aquaculture salmon in eastern Canada and, unlike farmed Atlantic salmon, there is substantial
public value associated with the wild salmon run. The total wild Atlantic salmon value of $255
million is nearly on par with the economic significance of farmed salmon in eastern Canada.
Investing in wild Atlantic salmon
“The basis for investing in wild salmon begins with policy set by DFO as the lead federal
agency.”
The general direction for conservation and enhancement of salmon populations has been set in
motion by Canada’s Policy for the Conservation of Wild Atlantic Salmon. The policy sets
overarching goals and objectives for activities addressing the health of all Atlantic salmon
populations. Specifically it states that the goal is:
Gardner Pinfoldvi Economic Value of Wild Atlantic Salmon
“to maintain and restore healthy and diverse salmon populations and their habitat, for the benefit
and enjoyment of the people of Canada in perpetuity” (DFO, 2009)
Following assessments by the Committee on the Status of Endangered Wildlife in Canada
(COSEWIC), wild salmon populations may be listed under the Species At Risk Act (SARA)
thereby triggering the development of recovery strategies and action plans.
Finally the Conservation Status Report for Atlantic Salmon in Atlantic Canada and Québec
involves two parts: 1) species information, and 2) anthropogenic considerations (DFO, 2009b and
2009c). “New and proposed species rebuilding and habitat restoration strategies” are put forward
that build on conservation efforts. This provides some insights into the nature and scale of a
comprehensive program for all wild Atlantic salmon in Canada.
“Making the case for investment in wild Atlantic salmon draws on the potential use benefits
(recreational fisheries growth) and non-use benefits (public interest).”
A return to the former peak of angler numbers is viewed as the key driver for growth in spending
for recreational fishing, rather than any increases in the average spending rates per angler. The
return to peak levels is assumed to require gradual building over 20 years, and yet the return on a
$15 million per year investment (ROI) is estimated to be about 18%, the net present value (NPV)
is $51 million, and the breakeven point would be 6 years.
The public survey demonstrated over 80% support for investments in salmon restoration in the
range of $4.50 to $12.50 per tax-paying household. This translates into public support for annual
incremental budget allocations upwards of $57 million. This far exceeds the $15 million that
appears justified on the basis of recreational fishing growth potential. This signals that eastern
Canadians would clearly support such investments and more to reflect their high regard for the
existence of wild Atlantic salmon and the importance of passing the resource on to future
generations.
“Insights from the study are offered to help develop criteria for building a comprehensive wild
Atlantic salmon program.”
Trade-offs will be inevitable in building such a program since not all options can be pursued or at
least not at the same time in all locations. The following may be helpful for decision-makers:
Communicating about wild Atlantic salmon challenges to the public is important for
gaining support even if this concedes past management shortcomings.
Be clear and specific about the goals of wild salmon restoration programs including
where activities will take place, who will benefit and in what ways.
Communicating the likelihood of success for program investments clearly matters to the
public. There is much greater public support for investments that have higher
expectations of success.
A phased approach may be helpful for achieving and demonstrating early success and
this will build support for steps that restore wild salmon stocks toward their historic
highs.
Gardner PinfoldI THE STUDY
1. Background
By most indicators, wild Atlantic salmon (Salmo salar) currently face daunting challenges to their
survival throughout much of their traditional range. Many of the historical rivers with salmon
runs have not seen salmon return in recent years, and global remaining populations may only be
20% of their historic levels. The threats to wild Atlantic salmon must be addressed in a much
more vigorous manner to stem declines and re-establish salmon populations to desirable levels.
Atlantic Salmon Federation (ASF) is dedicated to the conservation, protection and restoration of
wild Atlantic salmon and the ecosystems on which their well-being and survival depend. It is an
international non-profit organization headquartered in St. Andrews, NB, with regional offices in
Quebec, New Brunswick, Nova Scotia, Prince Edward Island, Newfoundland and Labrador and
Maine.
ASF and partners have been involved in recent efforts to decommission dams, lime acidified
waterways, restore salmon habitat, and research to determine the causes of the salmon’s decline.
These efforts suggest there is substantial willingness to stabilize and restore wild Atlantic salmon
populations. These conservation initiatives represent significant investments ranging from several
thousand dollars to over $50 million in the case of a dam decommissioning and habitat restoration
effort on the Penobscot River.
Garnering support for large conservation initiatives often requires economic analysis that
indicates the expected benefits so these can be weighed against the costs of various policy and
project options. A detailed economic study respecting the value of wild Atlantic salmon and
restoring their populations will provide the necessary economic basis for selecting the most
promising conservation measures going forward.
2. Objectives and scope
The goal of the study is to estimate the economic value of wild Atlantic salmon in Canada’s four
Atlantic Provinces and Quebec. The estimated values for recent years will be developed, along
with projections according to potential conservation initiatives. Economic values will be
expressed in conventional economic terms such as economic output, gross domestic product
(GDP), salaries, and jobs associated with direct, indirect, and induced economic activity.
In support of the overall goal, the more specific valuation objectives are broken down according
to the types of wild salmon values and related activities that must be included in the analysis:
recreational fishing industry and tourism,
First Nations food, social and ceremonial fisheries,
conservation and enhancement activity, and
existence value and other passive use values of the species.
In addition, four case studies are to be prepared for specific rivers including; the Exploits
(Newfoundland and Labrador), Margaree (Nova Scotia), Miramichi (New Brunswick), and Grand
Cascapedia (Quebec).
Gardner Pinfold 12 Economic Value of Wild Atlantic Salmon
(This page is intentionally blank.)
Gardner PinfoldII APPROACH
1. Total economic value
It is important to recognize that values associated with Atlantic salmon are also partially related
to: broader activities associated with angling, salmon habitat including watershed ecosystems,
and other species associated with salmon that share the same ecosystems. Anglers value more
than just the salmon, they also value the water resource and foodweb that supports salmon, the
scenery, and other aspects of fishing experiences. Local residents, including non-anglers, may
value the ecosystems for clean water, waste assimilation, and nature enjoyment. All of these
values associated with salmon and their habitat may be improved by efforts to stabilize and
restore salmon populations. Decommissioning dams, liming acidified waterways, and riparian
habitat restoration will have multiple benefits. These are meant to be included when “values
associated with salmon” are discussed in this proposal.
Economists commonly employ a total economic value framework (TEV) to account for the range
of values associated with any resource. The TEV framework provides a checklist of values to
consider for any economic study with an environmental component and includes:
Direct Use Values
o Extractive (e.g., recreational and subsistence fishing)
o Non-Extractive (e.g., catch-and-release sport fishing, wildlife viewing)
Indirect Use Values (e.g., fishing for a species that depends on salmon for food)
Option Values (i.e., the value of deferring use of a resource until later)
Quasi-Option Values (i.e., the value of information in the future)
Non-Use Values (also known as Passive Use Values)
o Existence Values (e.g., the value individuals derive from knowing salmon exist
even if they will never personally see them)
o Bequest Values (e.g., the value individuals derive from knowing that salmon will
not be extirpated/extinct and remain available for future generations)
2. Study tasks
Several tasks are required to determine the full range of values associated with Atlantic salmon.
The tasks include:
analysis of secondary sources,
key informant interviews,
case studies, and
primary data collection from survey instruments.
The ASF has asked for a proposal in two parts, so that the option of pursuing only the first part
could be selected at this time, or the two parts could be pursued in a phased approach. The first
part forms the core of the project including a survey of anglers (to estimate direct and indirect use
values), and the second part adds a choice experiment (to estimate non-use value). These are
described in detail below along with the implications that should be considered.
Gardner Pinfold 34 Economic Value of Wild Atlantic Salmon
Secondary sources
Secondary sources including annual reports, published literature, and public datasets provide
insights regarding the range of values associated with wild Atlantic salmon. However existing
sources tend to be disjointed in terms of their focus and timing. Not all are focused specifically on
wild Atlantic salmon in Canada, nor are they published at the same time. We will review
available sources and extract the most useful portions for this study. A few key sources are
described here to illustrate how they will be used.
Key informant interviews
Much the same as published secondary sources, key informant interviews provide insights for the
range of values associated with salmon. This is most important for two aspects of the study: 1)
ensuring the range of values are assessed and the relationships between values are clear, and 2)
developing the case studies to provide more tangible examples of the values associated with
salmon.
Case studies
The purpose of the case studies is to help make the value of wild Atlantic salmon tangible and
relevant at the local level. Sometimes aggregate values expressed at the provincial or regional
scale are necessary but difficult to grasp and interpret. Local examples demonstrate more clearly
how livelihoods and close relationships to salmon rivers have developed, and it is easier to
illustrate certain values on a human scale. Four case studies are requested covering the following
salmon rivers:
Exploits (Newfoundland and Labrador),
Margaree (Nova Scotia),
Miramichi (New Brunswick), and
Grand Cascapedia (Quebec).
Primary data collection
Two surveys are used to capture salmon use and non-use values. First, a salmon angler survey
aims to quantify use value, including direct and indirect uses such as angler expenditures for gear,
licences and registration, transportation, and accommodation. Second, a choice experiment is a
survey for the general population that aims to quantify non-use values including: option values,
quasi-option values, existence and bequest values.
Gardner PinfoldIII SALMON OVERVIEW 1. Salmon life cycle and range Wild Atlantic salmon hatch in freshwater and generally travel by river to the ocean and spend much of their life at sea (some wait multiple years before making the journey). Salmon typically return from the sea to the river where they hatched, and often to the same site on the river in order to spawn (reproduce). There are nearly 1,100 rivers in Canada that have currently or historically been home to salmon runs. Wild Atlantic salmon migrate from these rivers to gather in large concentrations typically off the western and eastern coasts of Greenland, and in waters around the Faroe Islands. Salmon will spend one or more years at sea before returning to their river of origin to spawn. Some will travel up to 4,000 kms on this journey (see map of migration routes). Wild Atlantic salmon, unlike Pacific salmon that die after spawning, can repeat this extraordinary life cycle many times. Figure 3.1.1: Wild Atlantic salmon global migration routes Source: ASF 2. Population status and stressors Status The number of adult Atlantic salmon that would spend two years at sea, and if not caught would return to North American rivers to spawn, was estimated to be about 900,000 fish around 1975 (see Figure 3.1.2), although it is believed the numbers were much higher when European settlers first arrived in North America. In just over two decades their numbers dropped by almost 90% to about 100,000 and this number has remained relatively stable since then. For those salmon that return after only 1 year at sea, commonly known as grilse, the decline has not been as steep , going from about 800,00 to about 400-500,000 in the same time period. (source ICES North Atlantic Salmon Working Group Report). Almost all of this production has originated in Canada, with only a few % being produced in the USA. Gardner Pinfold 5
6                                                            Economic Value of Wild Atlantic Salmon

The decline in salmon destined to be large spawners has been particularly troubling as these fish
are predominately female, and due to their large size at spawning, they carry a disproportionate
number of eggs, relative to the smaller grilse. It is also only these fish destined to be large
salmon that migrate to distant waters such as Greenland and even the Faroe Islands, and were
historically commercially fished in those areas.

Figure 3.1.2: Large and small salmon pre-fishery abundance since 1971

Source: ICES, 2011.
Note: Large salmon numbers do not include repeat spawners.

The drop in salmon numbers has not occurred evenly across eastern Canada. Many rivers no
longer have any salmon return. The rivers that have suffered the greatest losses tend to be in
southern areas, while more northern rivers in less populated areas maintain healthier salmon runs.

The Committee on the Status of Endangered Wildlife in Canada (COSEWIC) is responsible for
assessing the status of species. The following map (Figure 3.1.3) shows the COSEWIC’s
recommended status for wild Atlantic salmon in different parts of Canada. COSEWIC makes
recommendations on the status of species to the Government of Canada. It is up to the Federal
Government to accept or reject the committee’s recommendations. Presently COSEWIC’s
proposed status ranking is under review by the federal government therefore the present status of
the species holds. The greatest concern is for Bay of Fundy populations (endangered), coastal
Nova Scotia (endangered and special concern), Anticosti Island (endangered), and the southern
coast of Newfoundland (threatened).

                                                                                    Gardner Pinfold
Economic Value of Wild Atlantic Salmon 7 Figure 3.1.3: Map of COSEWIC assessment for wild Atlantic salmon populations Source: ASF Stressors A number of factors are known to threaten wild Atlantic salmon even though it is not clear which factors are causing the most harm. Some factors only affect salmon from certain rivers, while other factors can affect salmon broadly. The following is by no means an exhaustive account of salmon stressors but provides some insights. All legal and illegal forms of fishing of commercial, recreational, or First Nations reduce salmon numbers. Some restrictions on fisheries protect large spawners or prevent certain harmful gear from being used. Recreational fisheries are increasingly required to release live salmon back into the water instead of harvesting them. Hydroelectric power dams and other barriers to control water flow on rivers can prevent salmon from reaching the upper waters of these rivers where they used to spawn (reproduce). Hydroelectric dams can also harm or kill fish that pass through the turbines in the dam even if there are ladders or other mechanisms in place to help fish overcome the barriers. Waste water from communities, pesticides from agriculture or forestry, sediment and other pollutants that runoff into rivers can harm and kill salmon. Acid precipitation from air pollution generated by manufacturing plants and combustion processes can also make rivers too acidic for salmon to survive. Decreases in the amount of food available to salmon or increases in the number of animals that eat Atlantic salmon can reduce salmon populations. Changes in water temperatures and other marine ecosystem characteristics can affect their survival and reproduction success. Over 90% of all commercial aquaculture by value in Canada involves raising domesticated Atlantic salmon in net cages at the mouth of rivers where wild salmon pass by. Wild Salmon populations in the vicinity of aquaculture operations in Canada have been designated either threatened (southern Newfoundland) or endangered (Bay of Fundy). The Committee on the Status Gardner Pinfold
8                                                         Economic Value of Wild Atlantic Salmon

of Endangered Wildlife in Canada (COSEWIC) have identified salmon farming as a key threat.
Farmed salmon can spread diseases and parasites to wild salmon, while escaped domesticated
salmon compete for food and habitat in freshwater, and interbreed with wild salmon thereby
weakening the wild gene pool

3.      Government roles
The Government of Canada passed a Species at Risk Act (SARA) that set out certain
responsibilities and actions that must be taken when species are in danger of becoming locally or
globally extinct. The Department of Fisheries and Oceans (DFO) takes the lead role regarding
fish and other marine species and has annually spent about $20 million in recent years on all
species at risk programs (not just for Atlantic salmon).

DFO undertakes a wide range of activities to support wild salmon including monitoring,
assessment, research, regulation and licensing, enforcement, and grants and contributions to other
organizations and agencies. The Department published The Wild Atlantic Salmon Conservation
Policy (2009) in response to the salmon population declines and rising concern about long-term
sustainability. Although the policy contains promising measures for conserving and restoring
stocks, insufficient funds are available for implementation. The Department has been handed
budget cuts in recent years including announced cutbacks in the 2011 Budget that are expected to
be phased in over the next three years.

Provincial governments play varying roles in salmon management across eastern Canada.
Enforcement of recreational fisheries is often a joint effort between the federal government and
the provinces. Licensing of recreational fishing is typically administered by the provinces, with
some exceptions for Aboriginal and food fisheries. Provinces undertake a small amount of
research and monitoring, and may manage access and infrastructure for certain waters that are
public or crown reserves.

                                                                                   Gardner Pinfold
IV USE VALUES - SALMON ANGLERS
1. Angler survey
Survey design and purpose
The salmon angler survey aims to quantify use value, including direct and indirect uses. The
survey design was similar to the DFO 2010 recreational fishing survey. The survey for each
province differed somewhat given the distinct licensing schemes and fishing management
context. The survey questions are included in Appendix B and additional tables of results are in
Appendix C. French versions were also made available for New Brunswick and Québec.
The first part of the survey gathered information regarding licences held, species fished, locations
of fishing effort, catch, and harvest. Anglers were asked to indicate their level of satisfaction with
the amount of fishing and what were the reasons for any shortfalls. The second part of the survey
addressed all forms of angling expenditures including major purchases and investments,
packages, and other expenditures. The third part of the survey sought information about the
household including other resident anglers and trip information. The fourth and final part solicited
opinions about salmon management measures, and about priority assigned to ASF strategies.
The information collected has several purposes:
The survey provides information from ASF members including their opinions on
priorities that can help guide the organization,
The survey data provides a basis for estimating 2010 spending by all Canadians and
international visitors,
The survey data provides insight into spending patterns that suggests alternative
approaches for estimating and interpreting salmon angler spending totals in Canada.
Sampling to represent anglers in Canada
The angler survey was administered to a stratified random sample of the ASF membership list. Since
ASF membership does not match the distribution of anglers by province it was necessary to draw
more or less from the membership list in each province and abroad to represent the distribution of
anglers. The following illustrates the sample relative to the number of anglers in each province.
Table 4.1.1: Angler survey sample size versus number of salmon anglers by province
Province Anglers* Sample
Number % Number %
NB 15,833 38% 569 43%
NL 13,832 33% 115 9%
QC 9,000 22% 485 37%
NS 2,598 6% 132 10%
PEI 474 1% 21 2%
Total 41,737 100% 1,324 100%
*The number of anglers is not the equivalent to the number of salmon licences, since multiple licences can be held by
anglers in some provinces. The number of licences sold is higher than the number of anglers.
Gardner Pinfold 910 Economic Value of Wild Atlantic Salmon
The number of anglers in each province is based on 2005 DFO audited licensing data from the
provinces. For the DFO recreational fishing survey, about 2.7% of all anglers were sampled
resulting in about 1,113 salmon anglers surveyed.
Since the survey of ASF members captured 1,324 anglers this appears adequate (more than 1,113
collected by DFO in 2005) however there are some small discrepancies from the distribution of
anglers by province. The one concern is where the province of NL was under-sampled (9%
sample versus 33% actual). The question here is whether NL data is sufficiently representative,
and the 117 respondents from that province is well above typical thresholds for small sample
sizes (over about 30).
Weights are assigned to all data to arrive at aggregate findings by province. Weights not only
account for the distribution of anglers by province, but also the origin of the anglers including
residents of the province, Canadian visitors from other provinces, and international visitors (see
Appendix C for details). This is especially important given the differences in their spending
patterns, trip characteristics, and fishing activity levels.
Just over half of average 24 days spent fishing are for salmon
Survey participants were asked how many days were spent fishing in freshwater and saltwater by
targeted species. The following table highlights salmon fishing days versus days fishing for other
species.
Table 4.1.2: Average number of salmon fishing days by province in fresh and salt water
Province Freshwater Saltwater Salmon (F+S)
# % # % # % Total
NB 19.8 90% 2.2 10% 14.1 64% 22.0
NL 17.0 80% 4.1 20% 13.6 65% 21.1
QC 20.9 80% 5.4 20% 9.9 38% 26.3
NS 24.2 88% 3.4 12% 13.0 47% 27.7
PEI 37.8 92% 3.4 8% 3.8 9% 41.2
Average 20.5 85% 3.5 15% 12.5 52% 24.1
The average number of fishing days was 24 with 85% spent in freshwater and the balance spent
in saltwater. Salmon fishing days were 52% of the total, with the highest salmon fishing
percentages in NL (65%) and NB (64%), and the lowest percentages in PEI (9%).
Two-thirds of anglers want more salmon fishing
When asked if they fished for salmon as much as they would have liked in 2010, two-thirds
(66%) of respondents said “no”. The following table shows the results by province and overall
average.
Gardner PinfoldEconomic Value of Wild Atlantic Salmon 11
Table 4.1.3: Angler survey responses for whether anglers fished
enough for salmon in 2010
Province No Yes
NB 73% 27%
NL 65% 35%
QC 63% 37%
NS 50% 50%
PEI 59% 41%
Average 66% 34%
The relatively high average is not surprising but the reasons given for not fishing more help to
shed some light on the issues. When survey participants were asked why they did not fish more,
the top three reasons given were:
#1 reason – not enough fish
#2 reason – not enough time
#3 reason – not enough access to sites
The results highlight two resource constraints namely fish (#1) and access to sites (#3). The
second reason is related to angler priorities.
Survey participants were also asked why they think others may not be fishing as much as they
could, and the following top three answers were given:
#1 reason – not enough fish
#2 reason – youth are not as interested in fishing
#3 reason – other sports and leisure activities are taking precedent
The top reason of not having enough fish is re-confirmed as a resource constraint, however two
external factors are raised as #2 and #3. There is a perception of increasing competition from
other leisure activities and interests that are garnering the attention of youth and other anglers
generally. These reasons can be intertwined if, for example, salmon fishing is not competing well
with other leisure activities and interests because of the number one reason that there is not
enough fish and access. It is more difficult to create an enjoyable and memorable fishing
experience if few or no fish are caught.
Excluding high economic impact camps, salmon anglers spent
$2,418 on average in 2010
Average salmon-related spending profiles were developed based on weighted responses for each
province, and according to those who were residents in the province, visitors from other
provinces, and visitors to Canada (Table 4.1.3).
Since almost 100% of salmon anglers indicated that their preferred species is salmon and their
expenditures relate to the pursuit of salmon, it could be argued that all reported spending should
be included in the profiles. However, not all fishing days were for salmon and it could also be
argued that some of the expenditures are not linked to salmon. To reconcile these issues, the
midpoint between 100% and the percentage of days fished for salmon in each province was used
Gardner Pinfold12 Economic Value of Wild Atlantic Salmon
to adjust the profiles to better reflect salmon-related spending. Overall this means about 75% of
total reported spending is included in the profiles.
Later in this report we discuss the highest spenders among all anglers that frequent private fishing
camps and lodges, and these individuals are removed from the following spending profiles.
Removing these “high spenders” is done to avoid double-counting when combining the results
from the angler survey and the survey of high economic impact camps. The survey respondent
weights by province and angler origin also account for the removal of identified high spenders.
Table 4.1.4: Average salmon-related spending per angler by province by origin in 2010
Residence NB NL NS PEI QC Average
Residents $2,174 $1,322 $2,028 $436 $2,038 $2,164
Other Canadians $4,383 $4,698 $2,676 $7,082 $4,606
Visitors to Canada $2,455 $3,878 $879 $954 $3,221 $2,672
Total $2,340 $2,617 $1,868 $473 $2,671 $2,418
The overall average of $2,418 is bolstered by the highest spenders in QC ($2,671) and NL
($2,617). The lowest average spenders are in PEI ($473). Spending is highest for visitors from
other provinces, followed by visitors to Canada, and lowest for residents within each respective
province. This trend is consistent across the provinces except in NS where resident spending
outpaces that of visitors to Canada.
To put the overall $2,418 average (angler weighted) value in historical context, the DFO
recreational fishing survey spending averages were adjusted for inflation with province-specific
CPI indices to obtain 2010 values. The average (angler weighted) spending rates by year were:
$1,833 in 1988, $1,623 in 1990, $3,226 in 1995, $2,257 in 2000, and $1,492 in 2005. The average
of $2,418 falls within this range and is just above the straight average of the historical values
($2,086).
Excluding high economic impact camps, salmon anglers spent a
total of $102 million in 2010
The average spending profiles above are grossed up to provincial estimates by applying weights
that represent the number of actual salmon anglers divided by the sample size from the survey.
Results are shown in the following table and further details on weights and calculations for
spending totals are described in Appendix C.
Table 4.1.5: Total salmon-related spending by province by origin in 2010 ($millions)
Residence NB NL NS PEI QC Total
Residents $28.0 $19.0 $3.3 $0.2 $21.1 $71.6
Other Canadians $8.3 $5.7 $0.6 $0.0 $2.9 $17.4
Visitors to Canada $7.6 $2.4 $0.4 $0.0 $2.7 $13.1
Total $43.9 $27.1 $4.3 $0.2 $26.7 $102.1
The largest shares of total spending come from NB (43%), NL (27%), QC (26%), which together
account for 95% of the total. The total is also comprised mainly from province residents (70%),
followed by other Canadians (17%), and the balance from visitors to Canada (13%).
Gardner PinfoldEconomic Value of Wild Atlantic Salmon 13
The breakdown of totals according to spending categories is 29% for major purchases and
investments, 23% for packages, and 48% for other expenditures (accommodation, food, travel,
and supplies).
Major purchases and investments include: fishing, camping, and boating equipment,
special vehicles and trailers, land and buildings.
Packages include: fees paid to lodges, guides, or outfitters that include a complete range
of services such as lodging, food, transportation etc.
Other expenditures include: accommodations and campsite fees, food, travel costs within
the province, boating and equipment rental costs, fishing supplies, guide services, fishing
licences and access fees.
Keep in mind the anglers at high economic impact camps and lodges have been excluded from
the above profiles and, once this segment of anglers is discussed below, their values can be added
to obtain total spending for all anglers.
2. Survey of high economic impact camps
Spending and employment information was collected for 59 high economic impact salmon
fishing camps in four of Canada’s eastern provinces. This sampling of camps included 29 camps
from New Brunswick, 21 from Québec, 6 from Newfoundland and Labrador, and 3 from Nova
Scotia. There are likely over 200 camps, lodges, outfitters, and commercial fishing guide
operations throughout the five eastern provinces. This survey was meant to sample the high
economic impact camps to better understand patterns in their spending and activities.
Individuals frequenting these camps may pay according to daily or weekly rates, but are often
invited as guests, charged an annual fee for membership, or provided a share of ownership. Not
all of these camps are profit-driven, and many would not be viable as a business. The owners and
operators expenses are frequently for the enjoyment of the salmon run rather than for generating
revenues.
These camps deserve specific attention for two main reasons 1) their indirect influence on
recreational fishing activity, and 2) their direct spending influence on local economies. The
historical and cultural significance of camps and their residents has influenced generations of
anglers to become more involved in the pursuit of salmon. This has shaped the magnitude of the
salmon economy immeasurably. The direct spending by camps is much more measureable and
will be presented in quantitative terms.
Influence on recreational fishing and the value of salmon
There are many instances where leisure activities pursued by royalty, heads of state, and society’s
elite have been adopted widely. Recreational salmon fishing and the establishment of fishing
camps is a prime example. Historians point to the 1700s when British administrators established
“camps” once they confirmed the tales of enormous salmon. The “camps” were much more than
the name suggests since they included a full suite of staff serving a guest’s every need, and
facilities that demonstrated very careful attention to fine details. Indeed some of today’s high
economic impact camps date back well over a hundred years and continue to boast world-class
accommodations, food, scenery, and fishing opportunities.
Gardner PinfoldYou can also read