GFMS PLATINUM GROUP METALS SURVEY 2017 - New Age Metals Inc.
←
→
Page content transcription
If your browser does not render page correctly, please read the page content below
Spine - 3.5mm
                                                                                      Outside Back Cover - 210mm                                                                                Front Cover - 210mm

                                                                                                                                GFMS
                                                                                                                                 GFMSPLATINUM
                                                                                                                                      PLATINUMGROUP
                                                                                                                                               GROUPMETALS
                                                                                                                                                     METALSSURVEY
                                                                                                                                                            SURVEY2017
                                                                                                                                                                   2016

mbi.com        www.valcambi.com
                                                                                                                                                                          GFMS PLATINUM GROUP METALS
                                                                                                                                THOMSON REUTERS

a.co.jp        www.tanaka.co.jp

                                                                                                                                                                          SURVEY 2017
                                                                                                                                                                               cover sponsors

               © 2017 Thomson Reuters. All rights reserved. Republication or redistribution of Thomson Reuters content,
               including by framing or similar means, is prohibited without the prior written consent of Thomson Reuters.
               Thomson Reuters and the Kinesis logo are trademarks of Thomson Reuters.

          Platinum Survey Cover 2017.indd 1                                                                                                                                                                           26/04/2017 10:28:07
THE GFMS TEAM AT THOMSON REUTERS GRATEFULLY ACKNOWLEDGES
  THE GENEROUS SUPPORT FROM THE FOLLOWING COMPANIES FOR
       THIS YEAR’S GFMS PLATINUM GROUP METALS SURVEY

                                     TANAKA PRECIOUS METALS
                                       A leading company in the field of precious metals,
                                        With superior creativity and technical excellence,
                          We build customer trust through rapid responses that exceed expectation,
                                       Contribute to the creation of a prosperous society,
                       As well as to the future of the planet through sustainable use of precious metals.

     Valcambi is a leader in precious metals refining and operates one of the world’s largest and most efficient integrated
     precious metals plants situated on a 33 hectare site, at Balerna, Switzerland.
     We are one of the world’s largest manufacturers of minted ingots. Reacting to the demands of investors in different
     markets around the globe we are continuously carefully developing within the size range from 0.5 g to 1,000 g, gold,
     silver, platinum and palladium minted bars in different forms and new designs. For our clients, according to their
     wishes we customise individually obverse and reverse of the bars, certificates and tailored packaging solutions.
     All products produced in our foundry and minting facilities are certified by our laboratory, carefully inspected by our
     operators, individually packed and controlled before shipment. The Hallmark is not only a guarantee for quality of
     Swiss workmanship, it guarantees also the fineness of the most sought after bars in the world, desired by precious
     metals connoisseurs and investors alike.
     A Valcambi manufactured bar is not only sold at an outstanding price but is synonymous with unique craftsmanship,
     guaranteed fineness, transparency and reliability.

     Cover designed by Valcambi and executed by BtoB Creativity, Coldrerio, Switzerland.
GFMS PLATINUM GROUP
METALS SURVEY 2017
BY:

Rhona O’Connell, Head of Metals Research & Forecasts
Cameron Alexander, Manager
Ross Strachan, Manager
Bruce Alway, Manager
Sudheesh Nambiath, Lead Analyst
Johann Wiebe, Lead Analyst
Ling Wong, Senior Analyst
Erica Rannestad, Senior Analyst
Samson Li, Senior Analyst
Dante Aranda, Senior Analyst
Natalie Scott-Gray, Analyst

OTHER CONTRIBUTORS:
IFR Production, Thomson Reuters
Karen Norton, Senior Analyst
Wenyu Yao, Senior Analyst
Linda Zhang, Analyst

PUBLISHED MAY 2017 BY THOMSON REUTERS

The Thomson Reuters Building, 30 South Colonnade
London, E14 5EP, UK
E-mail: gfms@thomsonreuters.com
Web: financial.tr.com/eikon-metals

TABLE OF CONTENTS
1. Summary and Price Outlook                                                                      5
   • Introduction 5 • Platinum in 2016 6 • Palladium in 2016 7 • Rhodium in 2016 8 • Outlook 9

2. PGM Prices                                                                                    10
   • Platinum & Palladium 10 • Rhodium 11

3. Investment                                                                                    13
   • Overview 13 • Commodity Exchanges 13 • Retail Investment 14

4. Supply                                                                                        17
   • Mine Production 17 • Production Costs 21 • Autocatalyst Recycling 22
   • Jewellery Scrap Supply 24 • Above-Ground Bullion Stocks 24

5. Demand                                                                                        27
   • Autocatalyst Demand 28 • Jewellery 35 • Dental 40 • Electronics 40
   • Glass 42 • Chemical 43 • Petroleum 44

6. Appendices                                                                                    46
   •   Appendix 1 - Platinum Supply and Demand (ounces)
   •   Appendix 2 - Palladium Supply and Demand (ounces)
   •   Appendix 3 - Platinum Supply and Demand (tonnes)
   •   Appendix 4 - Palladium Supply and Demand (tonnes)
   •   Appendix 5 - Rhodium Supply and Demand (ounces)
   •   Appendix 6 - Rhodium Supply and Demand (tonnes)

FOCUS BOXES
   •   Ruthenium and Iridium Prices                                                               11
   •   Platinum and Palladium Price Correlations                                                 12
   •   Platinum, Palladium and Rhodium Exchange Traded Funds                                     15
   •   Uncovering Earnings Surprises in the PGM Sector using SMART Estimates                     19
   •   Fuelling the Future                                                                       45
© THOMSON REUTERS 2017.

All content provided in this publication is owned by Thomson Reuters and/or its affiliates (the “Thomson Reuters
Content”) and protected by United States and international copyright laws. Thomson Reuters retains all proprietary
rights to the Thomson Reuters Content. The Thomson Reuters Content may not be reproduced, copied, manipulated,
transmitted, distributed or otherwise exploited for any commercial purpose without the express written consent of
Thomson Reuters. All rights are expressly reserved.

TRADEMARKS

“Thomson Reuters” and the Thomson Reuters logo are trademarks of Thomson Reuters and its affiliated companies.
The third party trademarks, service marks, trade names and logos featured in this publication are owned by the
relevant third parties or their affiliates. No use of such mark, names or logos is permitted without the express written
consent of the owner.

DISCLAIMER OF WARRANTIES AND NO RELIANCE

This publication is provided by Thomson Reuters on an “as is” and “as available” basis. Thomson Reuters makes no
representations or warranties of any kind, express or implied, as to the accuracy or completeness of the Thomson
Reuters Content. Thomson Reuters is an aggregator and provider of information for general information purposes
only and does not provide financial or other professional advice. Thomson Reuters is not responsible for any loss or
damage resulting from any decisions made in reliance on the Thomson Reuters Content, including decisions relating
to the sale and purchase of instruments, or risk management decisions.

ISSN: 2397-5784 (Print)
ISSN: 2397-5792 (Online)

THOMSON REUTERS SURVEYS

GFMS GOLD SURVEY 2017                                                 31st March 2017
GFMS COPPER SURVEY 2017                                                 5th April 2017
GFMS BASE METALS REVIEW AND OUTLOOK                                     10th May 2017
GFMS PLATINUM GROUP METALS SURVEY 2017                                   9th May 2017
WORLD SILVER SURVEY 2017                                                 11th May 2017
GFMS GOLD SURVEY 2017: Q2 UPDATE AND OUTLOOK                                  July 2017
GFMS BASE METALS REVIEW AND OUTLOOK                                 30th October 2017
GFMS GOLD SURVEY 2017: Q3 UPDATE AND OUTLOOK                             October 2017
GFMS GOLD SURVEY 2017: Q4 UPDATE AND OUTLOOK                             January 2018

ACKNOWLEDGEMENTS

The estimates shown in GFMS Platinum Group Metals Survey for the main components of mine production,
scrap, fabrication, investment and stock movements are calculated on the basis of a detailed supply/demand
analysis for each of the markets listed in the main tables. In the vast majority of cases, the information used
in these analyses has been derived from visits to the countries concerned and discussions with local traders,
producers, refiners, fabricators and central bankers. Although we also make use of public domain data where
this is relevant, it is the information provided by our contacts that ultimately make GFMS Surveys unique. We
are grateful to all of them.
NOTES
UNITS USED:

  troy ounce (oz) =                         31.1035 grammes
  tonne =                                   1 metric tonne, 32,151 troy ounces

• Unless otherwise stated, all statistics on supply and demand are expressed in terms of fine metal content.
• All references in this publication to “ounces” refer to troy ounces.
• Unless otherwise stated, US dollar prices and their equivalents are for the p.m. fixes of the London Platinum and
Palladium Fixing Company Limited for prices prior to 1st December 2014 and the p.m. LBMA Platinum Price and LBMA
Palladium Price from 1st December onwards and the Johnson Matthey London a.m. Rhodium Price.
• Throughout the tables, totals may not add due to independent rounding.
TERMINOLOGY:
  ”-”                                       Not available or not applicable.
  ”0.0”                                     Zero or less than 0.05.
  ”dollar”, “$”                             U.S. dollar unless otherwise stated.
  “3PGM”                                    Platinum, palladium & rhodium
  ”4E”                                      Four elements: platinum, palladium, rhodium and gold (3PGM+Au).
  ”6E”                                      Six elements: 4E plus iridium and ruthenium (5PGM+Au).

Estimates of supply include mine production and the recycling both of scrapped autocatalysts and old jewellery, but
exclude contributions from above-ground stocks, such as supplies from stocks controlled by state institutions in Russia.
Demand estimates are net of recycling with the exception of autocatalyst and jewellery, where gross demand is shown
- i.e. the total amount of metal absorbed to these two sectors. Estimates of recycling from scrapped autocatalysts and
jewellery are shown separately as part of supply given their scale and potential for change. Estimates of demand exclude
the movements of any above-ground stocks held within the specified industries, for example any changes in stocks held
by the automotive industry.

By simple arithmetic, this leaves either a “Physical Surplus or Deficit” (in previous publications “Gross Surplus or
Deficit”) before any movements in above-ground stocks are considered. This is a critical measure of the underlying
fundamentals of platinum and palladium and indicates the extent to which fabrication demand may have depended
on the release of above-ground stocks, or otherwise. At the same time, this also indicates the change in global above-
ground stocks.

Unless otherwise stated, all references to “above-ground stocks” of platinum and palladium refer to stocks of refined
metal, of a form and quality accepted as good delivery in the London and Zurich market and the world’s principal
commodity exchanges. Our supply/demand tables also show “Estimated Movements in Stocks”. These specific
movements relate only to above-ground stock holdings for which reasonable estimates of movement can be made and
attributed. A listing and breakdown of these appears in the more detailed tables in the Appendices section of this Survey.

Having allowed for the Estimated Movements in Stocks as defined above, the “Net Balance” (previously “Residual
Surplus or Deficit”) is arrived at by deduction. A negative Net Balance implies the extent to which other above-ground
stocks, including those held by financial institutions and/or investors, were released to meet fabrication demand.
Conversely, positive Net Balance implies the extent to which these other above-ground stock holdings were augmented.
However, this should not be construed as indicating the change in global above-ground stocks. For this, please refer to
the reported Physical Surplus or Deficit.
GFMS PLATINUM GROUP METALS SURVEY 2017
1. SUMMARY AND OUTLOOK
INTRODUCTION in the annual average masked a substantial intra-year
improvement in prices, of 22%, a pattern which has
Last year was another tough one for many producers and continued so far in 2017.
SUMMARY AND OUTLOOK
investors in platinum, palladium and rhodium, as dollar
denominated prices slid for the second successive year on Indeed, having averaged just over $1,000/oz between
an annual average basis. Indeed, on this basis, platinum 2007-2012 the gap between platinum and palladium
stumbled below $1,000/oz for the first time since 2005 has continued its relentless drop to less than $200 at the
as prices fell for the sixth year in a row which, when time of writing. This superior performance for palladium
coupled with a thirteen year low for rhodium, meant is unsurprising given that 2016 marked another year
dollar basket prices for PGMs were exceptionally low. of substantial deficit, this time of 1.2 Moz (37 t). This is
underpinned by palladium autocatalyst demand growing
This poor price performance arguably flies in the face of robustly as sales in countries with a preference for
deficits for these metals. However, the platinum market is palladium-based aftertreatment rose strongly, especially
arguably more accurately described as broadly balanced in China ahead of the tax increase on 1st January. In fact,
and the platinum price performance in key producer the continued run of deficits led to indications that this
currency terms was far better than in dollars; for example was, at times, causing market tightness for palladium,
in rand terms it rose 9% on an annual average basis to an extent that had not occurred in that market since
and in roubles by 3%. Despite this, mine production of early in this century. Contrastingly, platinum demand
all PGMs, but particularly platinum dropped back, in is struggling as diesel is under growing pressure from
no small part a function of limited capital expenditure politicians and dropped below 50% of light vehicle sales
in earlier years. Meanwhile, for palladium the decline last year in the crucial European market.
WORLD PLATINUM SUPPLY AND DEMAND
(000 ounces) 2007 2008 2009 2010 2011 2012 2013 2014 2015 2016 %
Supply Change
Mine Production
South Africa 5,075 4,676 4,603 4,750 4,740 4,182 4,368 3,220 4,522 4,305 -5%
Russia 917 830 793 785 818 803 741 687 721 711 1%
North America 324 342 294 238 389 338 337 397 365 396 9%
Others 267 309 358 411 457 472 565 552 550 634 15%
Total Mine Production 6,584 6,156 6,048 6,183 6,404 5,796 6,011 4,856 6,158 6,046 -2%
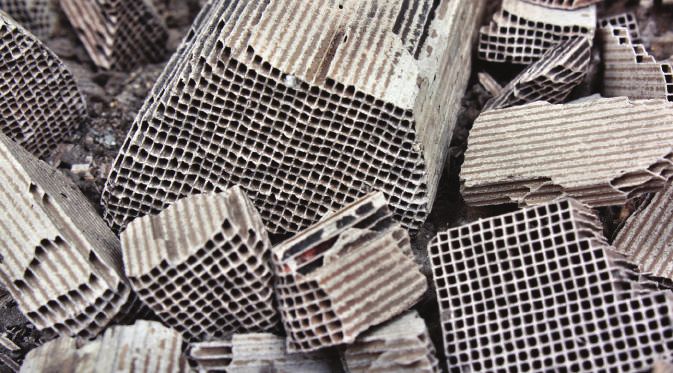
Autocatalyst Scrap 910 1,007 786 904 996 927 1,050 1,093 992 1,041 5%
Old Jewellery Scrap 560 966 496 522 606 512 491 516 546 574 5%
Total Supply 8,054 8,130 7,331 7,609 8,006 7,234 7,551 6,466 7,696 7,661 0%
Demand
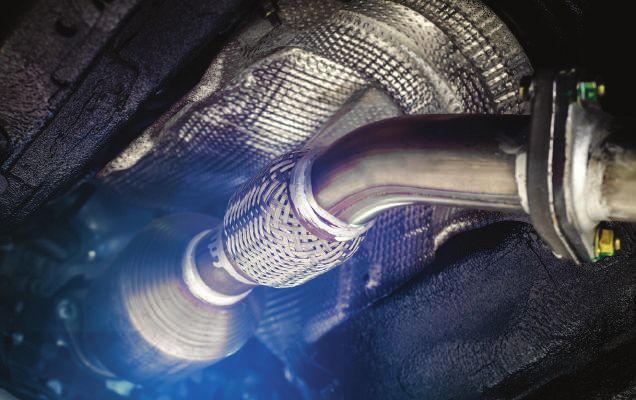
Autocatalysts 4,109 3,575 2,541 3,018 3,090 2,974 2,957 3,112 3,211 3,286 2%
Jewellery 2,061 1,847 2,678 2,201 2,388 2,585 2,656 2,558 2,466 2,176 -12%
Chemical 370 341 283 482 487 399 432 595 476 553 16%
Electronics 397 292 254 252 225 195 169 162 151 148 -2%
Glass 431 507 91 505 338 361 22 (74) 183 291 59%
Petroleum 150 191 163 168 144 126 107 122 96 117 22%
Other Industrial 472 456 431 494 559 621 649 700 681 741 9%
Retail Investment 23 452 313 95 312 282 136 141 582 540 -7%
Total Demand 8,013 7,662 6,755 7,215 7,542 7,543 7,128 7,317 7,846 7,853 0%
Physical Surplus/(Deficit) 41 468 576 394 464 (309) 423 (851) (150) (192)
Stock Movements (394) (402) 281 (574) (245) (539) (1,892) 1,082 210 55
of which ETF Release/(Build) (194) (102) (384) (574) (145) (239) (892) (218) 260 5
Net Balance (353) 65 857 (181) 220 (848) (1,469) 231 60 (137)
LBMA PM Price (US$/oz) $1,302.81 $1,577.53 $1,203.50 $1,608.98 $1,721.87 $1,551.48 $1,486.72 $1,387.57 $1,052.91 $988.76 -6%
Source: GFMS, Thomson Reuters; LBMA
5
GFMS PLATINUM GROUP METALS SURVEY 2017

                      PLATINUM IN 2016                                                    in the dollar denominated platinum price. The modest
                                                                                          increase, the third in succession, was entirely the result
                      One quirk for 2016 is that total supply and total demand            of a 15% jump in Chinese collections, to an all time high,
                      for platinum were barely changed, leaving the market                as slow moving stock was returned for remelt. Elsewhere,
                      broadly balanced. However this masks major changes as               lower platinum prices accounted for the drop in scrap
                      mine supply declines were offset by rising flows of both            supply with sizeable falls in Japan and North America.
SUMMARY AND OUTLOOK

                      jewellery and autocatalyst scrap. Meanwhile, demand
                      rose for industrial applications, which was offset by a             Autocatalyst scrap also rose, by 5% in 2016, reversing
                      slump in offtake from the jewellery sector.                         half of the prior year’s losses to reach 1.04 Moz (32.4 t).
                                                                                          The increase was fuelled by higher returns from Europe,
                      Platinum mine production fell moderately in 2016,                   aided by a recovery in the total recyclable value of
                      by 2%, to stand at 6.05 Moz (188 t) driven by lower                 vehicles, and emerging markets.
                      production from South Africa’s five largest operations.
                      Few mines escaped disruptions to production.                        Turning to demand, platinum consumption in
                      Stoppages, mine suspensions, and stringent capital                  autocatalyst applications rose by 2% to 3.3 Moz (102.2 t)
                      allocation in light of no recovery in metal prices, were            last year, less than half the pace of palladium demand
                      behind much of the drop. As detailed on page 21, the                growth. This increase was due to higher offtake in Europe
                      closure of high cost shafts and rand weakness pushed                and emerging markets, which was partially offset by
                      costs down by 9% on a Total Production Cost basis, while            lower demand in North America and Japan. Rising
                      increasing the peer group’s EBIT by 104% to $1,009 M,               offtake in Europe might seem surprising given that this
                      year-on-year. The drop in costs placed 30% of production            was the first full year following the VW scandal and
                      under water, down from 33% in 2015.                                 diesel is losing market share. However, overall sales
                                                                                          grew strongly and diesel production was higher in 2016,
                      Global platinum jewellery scrap edged 5% higher in 2016             as were loadings to meet the Euro 6b legislation which
                      to an estimated 0.57 Moz (17.9 t) despite a 6% decline              applies to all vehicles from September last year.

                      WORLD PALLADIUM SUPPLY AND DEMAND

                      (000 ounces) 2007 2008 2009 2010 2011 2012 2013 2014 2015 2016    %
                      Supply											                                             Change
                      Mine Production
                       South Africa                2,677      2,365   2,481      2,646    2,686      2,391      2,432     2,008      2,653     2,470    -7%
                       Russia                      3,049      2,701   2,677      2,722    2,704     2,624       2,527      2,582     2,575     2,526    -2%
                       North America                995        908     688         726     959        953         934        978       925       932     1%
                       Others                       329        407     475         518      512       528         575       568        561       635    13%
                      Total Mine Production        7,050      6,381   6,321      6,612    6,861     6,497       6,468      6,136      6,713    6,563    -2%
                      Autocatalyst Scrap            957       1,200   1,077      1,307     1,514     1,472      1,587       1,813     1,604     1,719    7%
                      Old Jewellery Scrap            185        192     116        179     248         223        230       248        266       275     3%
                      Total Supply                 8,192      7,772   7,515     8,098     8,623      8,191     8,286       8,197     8,584     8,557    0%

                      Demand
                      Autocatalysts                4,797     4,489    4,032      5,303    5,594      6,188      6,376      6,647      6,991    7,360     5%
                      Jewellery                    1,281      1,295    1,110       797      674       595         525        478       345       299 -13%
                      Dental                         615       620     602        590       567       546          511       475       449       426    -5%
                      Chemical                      388        372     304         367      382        378        410       396        395       435    10%
                      Electronics                  1,275      1,347   1,240       1,451   1,487      1,500      1,378      1,358      1,200    1,080 -10%
                      Other Industrial                91         91     84         101      103        110        110         117       116       113   -3%
                      Retail Investment              45         94      170         80       61         37         38         45        45        45    0%
                      Total Demand                 8,491     8,309    7,543     8,689     8,868     9,354      9,349       9,515     9,540     9,757    2%

                      Physical Surplus/(Deficit)   (300)      (537)    (28)      (591)    (245)     (1,162)   (1,063)     (1,318)     (956)   (1,200)
                      Stock Movements               620        899     593       (289)    1,282      (148)      (300)      (299)       577       527
                       of which ETF Release/(Build) (280)     (381)   (507)     (1,089)     532      (448)         (0)     (899)       727       637
                      Net Balance                   320        362     566       (880)    1,037     (1,311)    (1,363)    (1,616)     (379)     (673)
                      LBMA PM Price (US$/oz) $354.78        $352.25 $263.22    $525.24 $733.63     $643.19    $725.06    $803.23    $691.63   $613.72   -11%
                      Source: GFMS, Thomson Reuters; LBMA

                      6
GFMS PLATINUM GROUP METALS SURVEY 2017

WORLD PLATINUM SUPPLY                                                               WORLD PLATINUM DEMAND

                                            Rise    Fall * Rest of the World                                                    Rise      Fall
                      7,700                                                                               7,900
                                                                                                                                                                   +21
                                                                                                          7,850                                              +60
                      7,650                                            +28
                                                                +31                                       7,800                                        +75
                      7,600

                                                                                        Thousand Ounces
    Thousand Ounces

                                                         +49

                                                                                                                                                                               SUMMARY AND OUTLOOK
                                                                                                          7,750
                                                   +84                                                                                           +77
                      7,550                                                                               7,700

                                                                                                          7,650
                      7,500                                                                                                              +108
                                                                                                          7,600
                                     -217
                      7,450                  -10                                                                              -42
                                                                                                          7,550        -290
                                                                                                                                    -3
                      7,400                                                                               7,500
                              2015   SA     RUS    RW* Autocat NA     Jewell 2016                                 2015 Jewell Ret Elect Glass Chem Auto Other Petro 2016

       Source: GFMS, Thomson Reuters                                                         Source: GFMS, Thomson Reuters

Platinum jewellery demand declined by 12% in 2016 to                                Mine production of palladium contracted by 2% to total
reach 2.18 Moz (67.7 t). China accounted for the bulk of                            6.57 Moz (204 t) last year as output fell in South Africa,
this loss, hindered by a softer economy and a market                                Russia, and Canada, but was supported by the ramp-up
share loss to yellow 18-carat jewellery. Elsewhere,                                 of operations in Zimbabwe and the United States. The
fabrication demand in North America was also dragged                                closure of high cost shafts in South Africa, processing
lower by a lack of promotion and the high cost of                                   constraints in Russia, and lower grades in Canada echoed
jewellery when platinum was trading at a steep discount                             some of the challenges faced by these countries in 2012.
to gold. Japanese demand held up well, declining only at                            At the asset level, the largest decrease was registered at
the margin, while European offtake was also impacted by                             Norilsk’s Russian operation, while the largest increase
a lack of promotional activity.                                                     was posted at Ngezi in Zimbabwe, lifting the country’s
                                                                                    supply by 20% year-on-year.
Turning to industrial demand, growth was recorded
in most industry segments in 2016 with a combined                                   Almost exactly offsetting the decline in mine production
increase of 17% year-on-year. The most pronounced gains                             was an increase in scrap flows, from both autocatalysts
were recorded from the glass and petroleum sectors                                  and jewellery. Autocatalyst scrap supply rose by 7%
which rebounded 59% and 22% respectively, the former                                in 2016 to 1.72 Moz (53.5 t) to the second highest level
boosted by new manufacturing capacity built in China.                               recorded. The increased receipts occurred in all regions
Moreover, chemical and the other industrial sectors also                            with the developed world flows that had been postponed
enjoyed a healthy rise, with the former benefiting from                             in 2015 finally starting to recover in line with stronger
a recovery in capacity expansions in paraxlyene (PX).                               steel and palladium prices.
The only outlier last year was electronics demand which
eased 2% in part due to a drop in global PC demand.                                 The recycling of old palladium jewellery scrap edged
                                                                                    3% higher in 2016 to 0.27 Moz (8.6 t), an historic high.
Lower prices and a lack of expectation last year impacted                           The ongoing remelt of old jewellery inventory in China
retail investment which contracted by 7% on the 2015                                accounted for the bulk of the rise. European recycling
record level to an estimated 0.54 Moz (16.8 t). While                               was also marginally higher due in part to higher prices in
remaining at historically high levels a hefty fall from                             sterling terms, which boosted recovery in the UK.
Japan accounted for the bulk of the decline. Elsewhere,
the release of a platinum coin in Austria boosted                                   Palladium demand in autocatalyst applications reached
the European number while North America was also                                    7.36 Moz (228.9 t) last year, the fifth successive all-
stronger, jumping to a four-year high.                                              time high, and an annual increase of 5%. The key factor
                                                                                    underpinning this strong growth was the robust pace
PALLADIUM IN 2016                                                                   of both global gasoline production and sales. This was
                                                                                    driven by tax breaks in China and increased market
Palladium’s Physical Deficit grew by a quarter in 2016 to                           share for gasoline in Europe, and to a lesser extent an
1.20 Moz (37.3 t). Adjusting for stock movements (from                              improving economy there. The 18% increase in Chinese
ETF redemptions), the Net Balance rose to a deficit of                              offtake in this sector saw it overtake Europe to top spot
0.67 Moz (20.9 t).                                                                  for the first time.

                                                                                                                                                                           7
GFMS PLATINUM GROUP METALS SURVEY 2017
WORLD PALLADIUM SUPPLY WORLD PALLADIUM DEMAND
Rise Fall * Rest of the World Rise Fall
8,600 9,800 +40 +0
+369
+7
+9 9,700
8,550 +74
9,600
8,500
Thousand Ounces
Thousand Ounces
9,500
SUMMARY AND OUTLOOK
+115
8,450 9,400 -120
-46 -23 -3
9,300
8,400
-183
9,200
8,350
-49 9,100
8,300 9,000
2015 SA RUS Autocat RW* Jewell NA 2016 2015 Elec Jewell Den Other Auto Chem Retail 2016
Source: GFMS, Thomson Reuters Source: GFMS, Thomson Reuters
Demand for palladium in industrial applications was RHODIUM IN 2016
broadly weaker, with total combined offtake falling 7%
to a 10-year low of 2.05 Moz (63.9 t). A double-digit The rhodium market realised a surplus of almost
percentage fall in electronics offtake due to economic 200,000 ounces last year, the largest annual surplus in
pressures, combined with a 3% drop in the other our records and the fourth consecutive year of annual
industrial sector helped offset healthy gains in chemical oversupply. At the same time, the average price hit its
and petroleum applications. Lower palladium prices lowest level since 2003. Despite averaging 27% lower
failed to arrest the slide in dental offtake which declined than in 2015, at $693.50/oz, rhodium prices stabilised
by 6% in 2016 due to continued substitution losses. in 2016. Rhodium traded above $800/oz in the fourth
quarter of the year and prices have continued to
Palladium jewellery fabrication declined in 2016 strengthen in 2017, rising above $1,000/oz in March for
despite the 11% fall in the dollar price, retreating 13% the first time since July 2015.
to an estimated 0.30 Moz (9.3 t). Losses were again
concentrated in China as the market there struggles for After years of aggressive thrifting following the metal’s
survival with a sole fabricator remaining, while elsewhere rise to $10,000/oz in 2008, industrial users appear to
demand was subdued, retreating in all other key markets. have sidelined these efforts. This scale back from thrifting
WORLD RHODIUM SUPPLY AND DEMAND
(000 ounces) 2007 2008 2009 2010 2011 2012 2013 2014 2015 2016 %
Supply Change
Mine Production
South Africa 658 631 683 653 647 587 599 449 624 615 -1%
Others 143 131 132 131 149 153 154 149 151 155 3%
Total Mine Production 801 762 815 784 796 741 752 598 775 771 -1%
Autocatalyst Scrap 203 234 193 232 265 245 272 322 284 318 12%
Total Supply 1,004 995 1,009 1,016 1,061 985 1,024 920 1,058 1,089 3%
Demand
Autocatalysts 1,004 943 743 791 755 748 722 679 675 683 1%
Chemical 73 73 69 71 78 81 84 88 90 94 5%
Glass 76 89 143 140 129 201 118 51 53 81 54%
Other 23 171 24 38 35 72 92 95 124 37 -70%
Total Demand 1,176 1,276 979 1,040 998 1,102 1,015 912 941 895 -5%
Physical Surplus/(Deficit) (172) (281) 29 (23) 64 (117) 9 8 117 194
ETF Release/(Build) (17) (36) (49) (4) 5 (4)
Net Balance (172) (281) 29 (23) 47 (152) (40) 4 122 190
JM London Price (US$/oz) 6,191 6,564 1,595 2,453 2,021 1,275 1,064 1,173 952 693 -27%
Source: GFMS, Thomson Reuters; Johnson Matthey
8GFMS PLATINUM GROUP METALS SURVEY 2017
WORLD RHODIUM SUPPLY & DEMAND
Total demand fell to 894,682 ounces, which was 5%
Supply Demand
Autocatalyst scrap Non-Autocatalyst
lower than the previous year. Autocatalyst demand,
1,400 12,000
Mine Production Autocatalyst which accounted for 76% of the total, increased by
Rhodium Price
1,200 10,000 1% last year. This was the first annual increase since
1,000 2010 and was driven by increased usage of lean NOx
8,000
Thousand Ounces
traps in small vehicles, which are loaded with rhodium.
SUMMARY AND OUTLOOK
US$/oz
800
6,000
Chemical and glass demand also increased in 2016, by
600 5% and 54%, respectively. These two components made
400
4,000 up just shy of 20% of total demand. Demand in our
‘Other’ category, which includes physical investment,
200 2,000
jewellery, thermocouples, and various other applications,
0 0 contracted by 70% last year, offsetting gains in the three
2007 2009 2011 2013 2015 main segments.
Source: GFMS, Thomson Reuters; Johnson Matthey
Physical investment demand, which is mostly in bar form
coupled with a newly launched rhodium ETF helped for the retail market and sponge form at the institutional
rhodium find its floor in the medium term, positioning its level, declined by 84% last year to about 16,600 ounces,
price for recovery into 2017. as strong initial interest in retail bars, a relatively new
product offering, in the North American and European
Standard Bank launched a physical ETF in South Africa markets dissipated and Chinese investors liquidated due
backed by rhodium in late 2015. Since its launch, the to financial stress from persistent unrealised losses in the
ETF has amassed almost 50,000 ounces as of April market. Jewellery demand also weakened on the back
2017, equivalent to about one month’s worth of market of lower gold and silver jewellery fabrication. The bulk of
demand. The ‘AfricaRhodium’ ETF accounted for 46% rhodium is used to plate jewellery.
of global rhodium ETF holdings by the end of 2016 and
while this ETF increased by 47,900 ounces last year, OUTLOOK FOR 2017
the European ETFs shed 43,000 ounces in the period.
On a net basis, global rhodium ETF holdings increased Platinum has been the worst performing precious metal
by a little over 4,000 ounces, after declining by around in the year to date, continuing a pretty underwhelming
5,350 ounces in 2015. performance in 2016. We do not expect it to continue
to lag its peers substantially as the market has priced
Rhodium supply increased by 3% to 1.1 Moz. Mine in much of the bad news, notably with respect to diesel
supply fell to 770,677 ounces in 2015, 0.5% lower than usage, and that it is starting a recovery, albeit a cautious
production in 2015. The bulk of the decline is owed to and difficult one. We are looking for a small fundamental
strategically reduced output from high-cost shafts in deficit this year as mine production continues to be
South Africa amid an unfavourable price environment. hindered by the lack of investment in earlier years.
The 12% increase in autocatalyst scrap supply more than
offset the drop in mine output. Palladium is in a persistent large deficit and the market
is tightening, a development we think will be increasingly
felt in the coming years, with more bouts of higher lease
PLATINUM PREMIUM
rates. This has also been translating into a strong price
2,000 Platinum/Palladium Ratio 6.0 recovery, and while the market is susceptible to a short
Platinum-Palladium Spread term correction we would expect prices to recover from
Platinum-Palladium Spread, US$/oz
5.0 that to be back in excess of $800 well before year-end.
1,500
Platinum/Palladium Ratio
4.0 More detailed outlooks are produced by the GFMS
1,000 team at Thomson Reuters, which presents its supply
3.0 and demand forecast data, regular commentary and
price forecasts to customers via Thomson Reuters Eikon
500
2.0
subscriptions. For more information please visit:
financial.tr.com/eikon-metals.
0 1.0
Q1-02 Q1-06 Q1-10 Q1-14
Source: GFMS, Thomson Reuters
9GFMS PLATINUM GROUP METALS SURVEY 2017
2. PGM PRICES
PLATINUM & PALLADIUM assets. While platinum showed strength towards the
end of January, and broke over the $900/oz barrier in
After declining 28.0% in 2015, the platinum price February, palladium remained weak and hovered around
rebounded by 3.6% in 2016. However, the annual average the $500/oz area in the first two months. According
price still dropped 6.1%, from $1,053/oz to $989/oz in to the CFTC reports, managed money net positions in
2016. The average 20-day rolling price volatility increased platinum were 14 tonnes at the end of 2015. After a
to 24% last year, from 19% the year prior. The increase small step back in January 2016, net long positions in
in price volatility was heightened in January, when the platinum began a more meaningful uptick as of the
meltdown in global equities markets dragged down the start of February, indicating a stronger investment
platinum price, causing the average price volatility for the interest. Meanwhile, managed net positions in palladium
month to spike to 32%, a relatively high level. During the were 27 tonnes by the end of 2015, and declined in early
period, neither the increase in the gold price, the robust 2016, dropping to 13 net tonnes by the end of February.
demand during this period from the vehicle sector, nor
the active purchasing by Japanese private investors, did Momentum in both platinum and palladium prices
not offer much support to the platinum price. Total ETF accelerated in March. Platinum finally broke over the
holdings were relatively stable throughout the year, only $1,000/oz barrier and stayed above that level in late
PGM PRICES
losing 5,096 ounces (0.16 t), or 0.2%. April, with palladium following suit by breaking over
$600/oz. The increase in metal prices was stimulated by
On the other hand, after falling 31.6% in 2015, palladium a weaker dollar, as a slowdown in the U.S. manufacturing
prices rebounded strongly, increasing by 20.7% in 2016. sector and reduced consumer spending lowered
The annual average price was still 11.3% lower however, expectations for an interest rate rise, which consequently
averaging $614/oz last year. The strong performance pushed the dollar index down to the 92 level, the lowest
in the palladium price last year was mainly attributed level since January 2015. However, palladium soon
to the robust growth in the vehicle production sector, dropped back under the $600/oz barrier in early May,
particularly from China. The Chinese automobile market while platinum sank below $1,000/oz in late May. The
was stimulated by the tax cut policy imposed on small dollar index bounced back from April’s low boosted by a
light duty vehicles in October 2015, which brought series of encouraging U.S. economic data. The result of
life back to the domestic auto industry. Total vehicle the Brexit in late June did affect the PGMs, and instead
production in China increased 14.4% over 2015 output. set up for further price appreciation in July. The platinum
The increase in the palladium price last year was in and palladium prices increased by 15.1% and 6.1%
spite of the continual outflows of ETFs, which lost respectively for the first half of 2016.
637,140 ounces (19.8 t), or 27.2% during the year.
Platinum started July with a bang, breaking above the
Both platinum and palladium prices were dragged down $1,000/oz again, and palladium regained above the
during the first month of the year, as turmoil in the global $600/oz barrier the following trading day. Both metals
equity markets forced market capital into safe haven were benefited by positive auto sales figures from Europe
and China. Managed net long positions in platinum
PGM PRICES: SOUTH AFRICAN RAND
increased in July, and peaked at the equivalent of 67
600 Platinum 3,000 tonnes on the 9th August. The 67 tonnes net position
Palladium
was the second highest recorded, just one tonne shy of
500 Rhodium (RHS) 2,500
the historical high recorded on the 8th July 2014. Net
long positions in platinum then slowly retreated as short
Rand/kg (thousands)
Rand/kg (thousands)
400 2,000
positions began to build, and ended the quarter at 33 net
300 1,500
tonnes. Platinum prices, however, reacted more slowly.
200 1,000 The price managed to break above the $1,100 level by
late July, and did not peak until the 10th August, when
100 500 it hit $1,182/oz. Meanwhile, palladium largely traded in
the range of $660-720/oz during the third quarter, with
2007 2009 2011 2013 2015 2017 managed net money position equivalent to 42 tonnes by
Source: Thomson Reuters the end of September.
10GFMS PLATINUM GROUP METALS SURVEY 2017
PRECIOUS METALS PRICE PERFORMANCE
RHODIUM
Au Ag Pt Pd Rh
2015 1,160 15.68 1,053 692 952 Rhodium prices averaged $693/oz last year, a 27.2%
2016 1,251 17.14 989 614 693 decrease from the year before due to the continual
Change (yoy) 7.8% 9.3% -6.1% -11.3% -27.2% increase in supply combined with falling demand. Total
Source: GFMS, Thomson Reuters; LBMA; Johnson Matthey
supply increased 2.9% year-on-year to 1.1 Moz (33.9 t),
mostly due to an increase in auto catalyst scrap, which
With the market directing its attention to the possibility jumped from 26.8% of total supply in 2015 to 29.2%
of further interest rate rises in the United States, in 2016. On the other hand, total demand fell 4.9%
platinum fell below $1,000/oz again in early October, to 0.9 Moz (27.8 t), mostly dragged down by physical
and palladium fell below $700/oz. Platinum and investment, jewellery, thermocouples and other
palladium began to diverge in November, as the election applications.
of Donald Trump to the presidency of the United States
helped industrial metals including palladium, but Automotive catalytic converters accounted for over
platinum was dragged down by gold and silver. The 76% of total rhodium demand last year, and increased
palladium price peaked at $770 by the end of November, modestly by 1.2% to 0.7 Moz (21.2 t). Glass demand also
and closed the year at $670/oz. surged 53.7% to 81,253 ounces (2.5 t) of rhodium last
year, mainly from increased demand from China. Total
Meanwhile platinum continued to sink and closed ETFs also increased 4.1%, to 0.1 Moz (3.2 t) during 2016.
PGM PRICES
the year at $898/oz. Net managed long positions in
platinum dropped heavily in the final quarter, falling to Net balance last year increased 55% to 0.2 Moz (5.9 t)
13 net tonnes by the end of the year, while palladium surplus. We expect the surplus to continue to increase
amounted to 40 net tonnes. The platinum/palladium in the future, as an increase in autocatalyst scrap will
ratio averaged 1.63 last year, but the ratio contracted continue to be an important component of supply for the
as palladium started to catch up in the second half. The market. Rhodium ended the year at $770/oz, an increase
strong momentum in palladium continued into the first of 16.7%. With higher demand and limited supplies,
quarter in 2017 as the average ratio fell to 1.26. rhodium spiked over 33% in early 2017 and closed at
$1,025/oz by the end of the first quarter of 2017.
RUTHENIUM & IRIDIUM PRICES price slowly started to trend upwards. In the second half of the
year, the situation became more problematic as availability
Ruthenium prices suffered their eighth consecutive annual was limited. As a result, the iridium price increased further and
price decline in 2016, with the price averaging $41.6/oz last sellers were waiting for higher levels. The situation caused the
year, a 12.4% year-on-year decrease. The price was relatively iridium market to become even less liquid and this continued
stable last year, as the highest price throughout the year into 2017. However due to the small size of the market, there is
was $42/oz and the lowest at $40/oz. The continual fall little opportunity for investors to become actively involved.
in ruthenium prices was mainly attributed to the decline in
shipment and demand for hard disk drives (HDDs). Global RUTHENIUM & IRIDIUM PRICES
HDDs shipments fell by an estimated 9.6% in 2016, with a shift
1,200 200
of consumer preferences away from traditional PCs to mobile Iridium
180
devices. In contrast to 2016, the price has risen dramatically so 1,000
160
far in 2017, by over 60% until the time of writing, as industrial
140
800
Ruthenium (US$/oz)
buying has increased in Asia, with limited supplies available.
Iridium (US$/oz)
120
600 100
On the other hand, the annual average price of Iridium
80
Ruthenium
increased 6.0% last year, to $576/oz. Iridium is mainly used 400
60
in electronics, as well as spark plugs, electrodes and chemical 40
200
catalysts. Prices were stable in the first few months of the 20
year. However, with such a small market, especially with tight 0 0
2011 2012 2013 2014 2015 2016 2017
supply, any meaningful demand could boost iridium prices.
Signs of life began to show in iridium price in May, with the Source: GFMS, Thomson Reuters
11GFMS PLATINUM GROUP METALS SURVEY 2017
QUARTERLY CORRELATION COEFFICIENTS
PLATINUM AND PALLADIUM PRICE
(daily log returns)
CORRELATIONS 2015 2016 2016 2016 2016 2017
Q4 Q1 Q2 Q3 Q4 Q1
Platinum and palladium belong to the same group in the Platinum-Palladium 0.91 0.76 0.81 0.26 -0.41 0.19
periodic table and therefore share similar physical and
Platinum
chemical properties, and tend to occur together in mineral
Gold 0.94 0.94 0.36 0.66 0.85 0.38
deposits. Both are used in automotive catalytic converters,
US$/Euro Rate 0.72 0.70 0.34 -0.17 0.82 -0.07
electronics, jewellery and act as catalyst during chemical
CRB Index 0.81 0.87 0.58 -0.04 -0.58 -0.21
process. The automotive sector dominates platinum and
Oil (WTI) 0.77 0.61 0.15 -0.45 -0.54 0.71
palladium usage in autocatalysts, representing 42% and
75% of gross usage respectively in 2016. From the supply Palladium
side, both metals are also fairly concentrated, with mine Gold 0.95 0.64 0.27 -0.11 -0.57 0.79
production from South Africa accounting for over 56% of US$/Euro Rate 0.81 0.60 0.36 0.43 -0.50 0.32
total platinum supply last year. Supply for palladium is CRB Index 0.86 0.86 0.48 0.76 0.69 0.52
more diversified, with mine production from South Africa Oil (WTI) 0.84 0.84 -0.10 -0.26 -0.02 -0.25
and Russia constituting 29% and 30% of total supply Source: GFMS, Thomson Reuters
respectively last year.
The platinum and palladium correlation was very high The gold/platinum ratio increased to a daily average of
PGM PRICES
during the first half of the year, as both metals were being 1.27 in 2016, compared to 1.11 in 2015. In 2016, the market
dragged down by the global equities market meltdown focused on potential impacts brought by political incidents
starting the year. A soft dollar in April enhanced strength (i.e. Brexit, the presidential election of the United States)
in commodities, only to retreat in May as the dollar and the interest rate time table of the Federal Reserve. All
rebounded. Gold did relatively well in June, as market these events had huge influences on the demand for flight
capital to safe haven assets prior to the Brexit vote. to safety, and the strength of the dollar, and in turn, gold
became a spotlight focus.
In the third quarter, the correlation between platinum and
most other commodities began to diverge, but it retained a This momentum has carried forwarded into 2017. Despite
fairly high correlation with gold. With wage negotiations in the Federal Reserve raising interest rates in March, the
South Africa going peacefully and a lack of price direction, dollar actually showed weakness after the event. Prices
the market started to pay attention to the price differences of base metals also retreated in the first quarter, as the
between platinum and gold. After an average gold/ market became more rational after assessing Donald
platinum ratio of 1.27 in the first half of last year, the ratio Trump’s actions. The increasing geopolitical tensions, and
fell to 1.23 in the third quarter. Strong sales of vehicles in the upcoming voting in several European countries, also
China provided support for palladium prices during the boosted safe haven demand. The gold/platinum ratio
period. averaged at 1.25 during the first quarter of 2017.
Platinum remained highly correlated with gold in the final
quarter of the year, but posted strong negative correlations
with other commodities. The U.S. equity market and the PLATINUM, PALLADIUM AND OTHER COMMODITIES
dollar both advanced, celebrating Donald Trump’s victory
in the presidential election in November, as the market 120 Platinum CRB
became optimistic and capital flowed from risk haven assets Palladium Oil (WTI)
into riskier assets. Prices of base metals also surged, as
Index, 2nd January 2015 = 100
100
Donald Trump promised the market he would reform the
country’s infrastructure. While platinum is also an industrial
metal, it was being dragged down with gold and silver, 80
and the gold/platinum ratio increased to 1.29 in the final
quarter. On the other hand, palladium did well in the final 60
quarter, supported by strong auto sales in China, and its
price saw the peak of the year in late November.
40
Jan-15 Jul-15 Jan-16 Jul-16 Jan-17
Source: Thomson Reuters
12GFMS PLATINUM GROUP METALS SURVEY 2017
3. INVESTMENT
• Total Identifiable Investment in platinum, which includes concerns over interest rate decisions in the Unites States
retail investment and ETF inventory build, gained 66% in and their potential knock-on effect on the domestic
2016 to 535,000 ounces (6.7 t). In indicative value terms, currency. In hindsight it may be viewed that after a record
investment demand amounted to $529 million. rise in net longs in July 2015, investors were cautious
following US interest rate decisions and in measuring its
• The gains in our platinum Identifiable Investment figure influence on domestic currency.
was solely attributable to the losses in ETF holdings. Last
year they posted a much smaller outflow (5,000 ounces Turning to palladium, from a net long position by
or 0.16 t) than in 2015 (0.26 Moz or 8.1 t). speculators at 7,000 ounces at beginning of the year it
reversed to a net short of 1,431 ounces (44 kilogrammes)
• Palladium suffered net disinvestment for the second by the end of 2016. The reversal from net long to shorts
consecutive year in 2016, to total 593,000 ounces first occurred in July, though it was followed by panic
(-18.4 t). Again, investors’ net outflows in ETFs were buying as the price went higher. However, the short
responsible for the decline. position built up by September as signs of a potential
price reversal were being supported by news related to a
• Meanwhile, rhodium ETF positions gained 4% in 2016, to weakness in precious metals prices and lower demand.
total 104,421 ounces (3.2 t).
CFTC reports on managed money positions on NYMEX,
COMMODITY EXCHANGES which include both futures and options, provide a good
proxy for investor activity on the exchange. Looking to
Net investor positions on TOCOM futures are used to platinum in 2016, the sharp 49% year-on-year decline of
analyse investment activity on the exchange. Starting net managed long positions in 2015 was reversed in 2016
with platinum, net long positions declined last year, to gain 9% in 2016 to 0.41 Moz (13 t). Bargain hunting at
falling from 263,000 ounces (8.2 t) at the beginning of lower price levels and reallocating of funds to platinum
the year to 66,000 ounces (2.0 t) by year end. Investor were visible from December 2015 as the price declined to
activity was tepid even during the first eight months when the lowest since 2009 and the build up in long positions
platinum prices in dollar terms gained by 36% (as on 10th gathered steam by the second week of February last year.
August). As of end-May net longs were 186,000 ounces Net long positions were volatile during 2016 overall, as
(5.8 t), but speculators started taking profits as prices the price increased from $868 at the beginning of the
INVESTMENT
rallied through June and July to the extent that they year to $1,182 on 10th August, the highest level since 6th
were net short during these two months; in July 353,000 March 2015, however by the end of the year the price was
ounces (11.0 t) were on the short side. This trend is in only $30 higher than at the start of the year. During the
contrast to western markets and is primarily attributed to same time frame the net long more than doubled from
a stronger Japanese yen which in the first seven months 0.45 Moz (14 t) to peak at 2.2 Moz (67 t) before dropping
appreciated by 17%, thereby partly negating the gains back by the end of year to 0.41 (13 t). The investor activity
in the dollar price. The impact was to an extent that was intense enough to lift the net long positions to a
while the dollar platinum price gained by 36% from the record high level; this was in contrast to 2015 when
beginning of the year to 2016 peak of $1,182 during the short positions had touched a record high. Meanwhile,
same period the yen price gained only 10%. While this palladium posted a 47% year-on-year increase in
is a reasonably strong gain, it was likely tempered by managed net long positions, rising to 1.2 Moz (40 t). That
IDENTIFIABLE INVESTMENT*
Platinum Palladium
(000 ounces) 2013 2014 2015 2016 Change 2013 2014 2015 2016 Change
Retail Investment 136 141 582 540 -7% 38 45 45 45 -
Exchange Traded Funds 892 218 (260) (5) n/a 0.1 898 (727) (637) n/a
Total Identifiable Investment 1,028 359 322 535 66% 38 944 (683) (593) n/a
Indicative Value $M** 1,528 498 339 529 56% 28 758 (472) (364) n/a
*Excludes investment activity in the futures and OTC markets.
**Indicative value calculated using annual average volume and prices.
Source: GFMS, Thomson Reuters
13GFMS PLATINUM GROUP METALS SURVEY 2017
NET INVESTOR POSITIONS ON THE TOCOM AND NYMEX
(end-period; positive represents net longs) Platinum Palladium
Q1.16 Q2.16 Q3.16 Q4.16 Q1.16 Q2.16 Q3.16 Q4.16
TOCOM Futures Contracts 11,575 (6,646) 14,616 4,100 383 251 (769) (89)
- equivalent in ounces (000) 186 (107) 235 66 6 4 (12) (1)
NYMEX Futures Contracts 15,159 13,484 21,058 8,223 7,577 5,115 13,450 12,742
- equivalent in ounces (000) 24 21 33 13 24 16 42 40
Source: TOCOM, CFTC
said, investor activity was mixed, after rising by 112% from demand foe oa palladium investment. However, while
the beginning of the year at 868,000 ounces (27 t) to North American retail investment increased by 3% year-
early August at 1.8 Moz (57 t); thereafter it declined by on-year, global investment stay flat at 45,000 ounces
68% to 595,000 ounces (19 t), only to rebound by 114% (1.4 t).
by end of the year.
Physical platinum investment in Europe gained 564%
Total platinum volumes traded on the Shanghai Gold year-on-year in 2016 to 43,181 ounces (1.3 t), reversing
Exchange (SGE) in 2016 were higher by 79% year-on- four years of consecutive declines. Crucial to this was
year, rising to 1.67 Moz (26.4 t). The gains were fuelled the introduction of a new Philharmonic platinum coin
by the increase in fabrication demand from autocatalyst, in February 2016 by the Austrian Mint. With respect
chemicals and glass industry as the majority of the to other emerging markets in the platinum investor
trading is driven by fabricators from industrial and segment, there have been increased enquiries from the
jewellery fabrication. high income segment in India for investing in platinum,
but the lack of transparent price discovery, which is also
RETAIL INVESTMENT related to low liquidity, hasn’t helped its growth.
Investment demand for platinum last year declined by In the coin sector, platinum demand soared by 102%
7% to 540,443 ounces (16.8 t), primarily due to a fall in year-on-year in 2016 to 115,199 ounces (3.6 t), the highest
demand from Japan, which has historically taken the since we started keeping records. North America, which
largest share of total investment demand. Japan’s share contributes 54% of the demand, noticed an increase of
of total retail investment averaged 54% in the previous 66% year-on-year in 2016 to 62,192 ounces (1.9 t). That
five years; however last year’s share was 77%. Thus, its said, American Eagles reported sales of 20,000 ounces
INVESTMENT
17% year-on-year decline in 2016 to 415,000 ounces (0.62 t). With no platinum coin release in 2015, volumes
(12.9 t) weighed heavily on global retail demand. That in January 2017 were the equivalent to the whole of
said, it is important to note that 2015 volumes were at 2016. Demand elsewhere also grew strongly, particularly
a record 498,000 ounces (15.5 t). The key trigger for aided by the aforementioned new platinum coin from the
volumes of this magnitude in the last two years, which is Austrian Mint.
equivalent to 7.5% of mined platinum production, were
price weakness and expectations for a recovery. It wasn’t
a surprise to see investors lining up at stores when the
price was hovering in range of $800 to $900 during PLATINUM RETAIL INVESTMENT
November and December following a fall from $1,182
Other Europe
attained on 10th August. Interestingly some of these were 600
Japan North America
investors who had taken profits in Q3 as the local price 500
had rallied by 10% since the beginning of the year.
400
Thousand Ounces
In North America, platinum retail investment increased 300
by 15% year-on-year to an estimated 63,262 ounces
200
(2 t), in sharp contrast to the decline in Japan. Firstly
the size of the investment market is very small and 100
American investors were relatively slow, with growth of 0
just 10% in 2015, while investment in Japan had grown
-100
by approximately 800%. On a relative basis American 2007 2009 2011 2013 2015
investors were responsible for 74% of retail investment Source: GFMS, Thomson Reuters
14GFMS PLATINUM GROUP METALS SURVEY 2017
PLATINUM, PALLADIUM AND RHODIUM NET MOVEMENTS IN PLATINUM, PALLADIUM & RHODIUM ETFS
EXCHANGE TRADED FUNDS
2015 2016 YoY% Jan-Mar*
(000 ounces) 2017
Platinum ETF holdings ended 2016 marginally lower at Platinum (260) (5) n/a 72
2.48 Moz (77.2 t), making it the lowest year-end total Palladium (727) (637) n/a (161)
in four years. Price was a critical factor; after initially Rhodium (5.4) 4.1 n/a (1.9)
rallying by 36% its decline eroded investor confidence Source: Respective ETF issuers
and it eventually ended just 3.5% higher year-on-year.
In value terms the ETF holdings increased by 3.2% year-on-year, with large gains coming from Glitter ETF.
year-on-year to $2.3 Bn; this at its peak for the year On the other hand the second largest NewPlat ETF
touched $2.83 bn on 10th August. The biggest addition declined 18% year-on-year and the third highest ZKB
in a single day last year was on 28th April, where ETF noticed 5% gains in holdings. These three together
holdings gained by 57,643 ounces (1.8 t), in reaction are approximately 80% of the ETF holdings, and they
to the price crossing $1,000 that week for the second together had a net outflow of 40,712 ounces (1.3 t).
time in four months. Looking at it on a quarterly basis
the fourth quarter noted a net inflow of 116,969 ounces Moving to palladium ETFs, we saw more intense
(3.6t) as against a net outflow of 117,451 ounces (-5.5 t) liquidation; declines were across all the major ETFs.
in Q3. ETF Securities, which has the largest holdings declined
13% with a net outflow of 96,459 ounces (3.0 t). The
In the case of palladium the ETF holdings declined by sell off was even larger at Source ETF with a net
27% year-on-year to 1.7 Moz (53.1 t), to the lowest level outflow of 132,435 ounces (4.1 t). Net outflow from the
in seven years and in value terms to $1.1 bn. The biggest top three ETFs, which together constitute 73% of the
addition in 2016 to palladium ETFs was 59,970 ounces ETF holdings, was at 399,839 ounces (12.4 t). The first
(1.9 t) on 6th June, largely driven by bargain hunting. quarter of 2017 saw significant further liquidations, with
palladium holdings dropping a further 161,073 ounces
The ETF investment activity was primarily driven by (5.0 t). The drop occurred almost entirely in under a
factors that were driving gold prices, U.S. interest rates, week in mid-January in the ETF Securities London fund.
Trump elections and wage negotiations between AMCU
and the three largest platinum producers in South Total holdings in rhodium ETFs gained 4% year-
Africa, Amplats, Implats and Lonmin. Unfavourable on-year in 2016 to total 104,421 ounces (3.2 t). The
movements in the rand, concerns over the health of notable development last year was an increase in
INVESTMENT
European diesel demand in addition to continued holdings at Africa Rhodium ETF; from less than a
concerns over the Chinese economy encouraged percentage share in the Rhodium ETF market a year
disinvestment from the metals in H2 2016. ago, its share had spiralled to 46% by end of 2016 by
adding 47,938 ounces (2.0 t) over the year following
Taking a look at each of the major ETFs, starting its introduction in late 2015. A large part of the rise
with platinum, holdings at ETF Securities were the appears to have been a shift from the DB Physical
highest at 908,732 ounces (28.3 t), rising by 15% Rhodium ETC fund which happened in March 2016.
PLATINUM ETF HOLDINGS PALLADIUM ETF HOLDINGS
Others* Absa NewPlat Others* Absa NewPall
3,000 Standard Bank Julius Baer 2,000 3,500 Standard Bank Julius Baer 1,000
AfricaPlatinum AfricaPalladium
2,500 3,000
1,600
Price 800
2,500
2,000
Thousand Ounces
Thousand Ounces
Price
1,200
2,000
US $/oz
US$/oz
1,500
1,500 600
800 ZKB
1,000 ZKB
1,000
ETFS USA 400 ETFS USA
500 500
ETFS London & Australia ETFS London & Australia 400
0 0 0
Jan-12 Jan-13 Jan-14 Jan-15 Jan-16 Jan 17 Jan-12 Jan-13 Jan-14 Jan-15 Jan-16 Jan-17
Source: GFMS, Thomson Reuters; collated from respective ETF issuers’ data Source: GFMS, Thomson Reuters; collated from respective ETF issuers’ data
15GFMS PLATINUM GROUP METALS SURVEY 2017
4. SUPPLY
• Global refined platinum mine production contracted MINE PRODUCTION
by 2% to total 6.05 Moz (188.0 t) in 2016, led by lower
supply from South Africa. SOUTH AFRICA
• Palladium production fell at an equal rate accentuated by South African platinum production fell by 5% last
sharper losses in South Africa and Russia, partially offset year, with palladium registering a sharper 7% drop.
by higher production from Zimbabwe. South Africa was unable to retain the top spot as the
world’s largest producer of palladium due to lower
• Global Total Production Costs (expressed in U.S. dollars) production from its five largest operations managed
fell by 9% in 2016 to $974/PtEqoz, primarily led by lower by Lonmin, Amplats/Sibanye, and Implats. The
costs at Marikana and Amandelbult. closure of high cost shafts at Marikana resulted in a
0.15 Moz (4.7 t) drop in 3PGE sales. Of the three metals,
• Producers (excluding Norilsk Nickel) cut capital platinum production contracted the most, registering a
expenditure by 22% to $1 Bn.
PGM PRODUCTION VARIANCE
WORLD PLATINUM MINE PRODUCTION 6,200 Rise Fall * Rest of the World
6,150
(000 ounces) 2014 2015 2016 Change
Platinum Thousand Ounces
South Africa 3,220 4,522 4,305 -5% 6,100
+7
+26
Russia 687 721 711 -1% 6,050 +86
Zimbabwe 398 398 484 22%
6,000
Canada 278 242 268 10%
5,950
United States 119 122 129 5%
-217 -10
Others 154 152 150 -1% 5,900 -2
World Total 4,856 6,158 6,046 -2% 5,850
Source: GFMS, Thomson Reuters
5,800
2015 SA RUS RW* ZIM CAN US 2016
WORLD PALLADIUM MINE PRODUCTION 6,800
6,750
(000 ounces) 2014 2015 2016 Change
Palladium Thousand Ounces
Russia 2,582 2,575 2,526 -2% 6,700
South Africa 2,008 2,653 2,470 -7% 6,650
Canada 578 519 512 -1%
6,600
United States 401 406 420 3% +14 +8
6,550 +65
Zimbabwe 325 323 388 20%
-183
Others 243 238 246 4% 6,500
World Total 6,136 6,713 6,563 -2% 6,450
-49 -7
Source: GFMS, Thomson Reuters
6,400
2015 SA RUS CAN ZIM US RW* 2016
780
WORLD RHODIUM MINE PRODUCTION
SUPPLY
(000 ounces) 2014 2015 2016 Change 776
Rhodium Thousand Ounces
South Africa 449 624 615 -1%
772 +6
Russia 87 88 87 -1%
Zimbabwe 36 35 41 17%
768
Canada 22 24 23 -4%
United States 3 3 3 -1% -9 0
764 -1
Others - - - - -1
World Total 598 775 771 -1%
760
Source: GFMS, Thomson Reuters 2015 SA RUS CAN US ZIM 2016
Source: GFMS, Thomson Reuters
17You can also read