Polystyrene Pollution in the Yarra River - Sources and Solutions - Yarra Riverkeeper ...
←
→
Page content transcription
If your browser does not render page correctly, please read the page content below
Polystyrene Pollution
  in the Yarra River
  Sources and Solutions
Disclaimer
The Yarra Riverkeeper Association (YRKA) advises that the
information contained in this publication comprises gener-
al statements based on research. The reader is advised and
needs to be aware that such information may be incomplete
or unable to be used in any specific situation. No reliance or
actions must therefore be made on that in formation without
seeking prior expert professional, scientific and technical
advice. To the extent permitted by law, the YRKA excludes all
liability to any person for any consequences arising directly or
indirectly from using this publication (in part or in whole) and
any information or material contained in it.
Acknowledgments
This work has been supported by the Victorian Government
through Round 3 of the Port Phillip Bay Fund. We acknowl-
edge the critical participation of all stakeholders who en-
gaged with the YRKA, particularly our partners in this project
including the Department of Environment Land Water and
Planning, Parks Victoria, Melbourne Water, Cleanaway and
most notably, Cleanwater Group. We would also like to ac-
knowledge the incredible level of participation and assistance
provided by the key informants and local community groups
engaged throughout this project, particularly Neil Blake of the
Port Phillip Eco Centre as well as the Scout Group, Ross and
Ramona Headifen of Beach Patrol, Jillian Sokol of Love Our
Streets, Narelle Huxley of Sea Shepherd and Victoria Clarke
from the City of Melbourne.
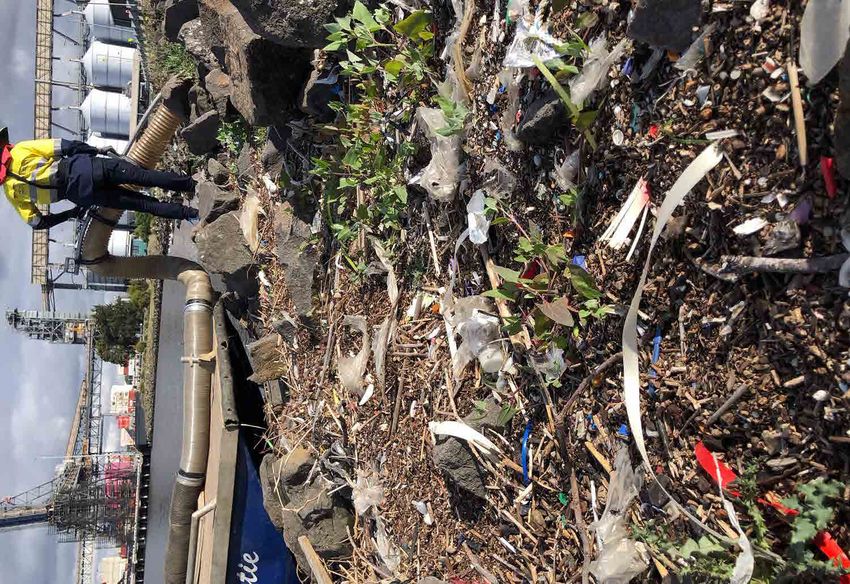
Figure 1
Polystyrene on Yarra river bank
Anthony Despotellis
2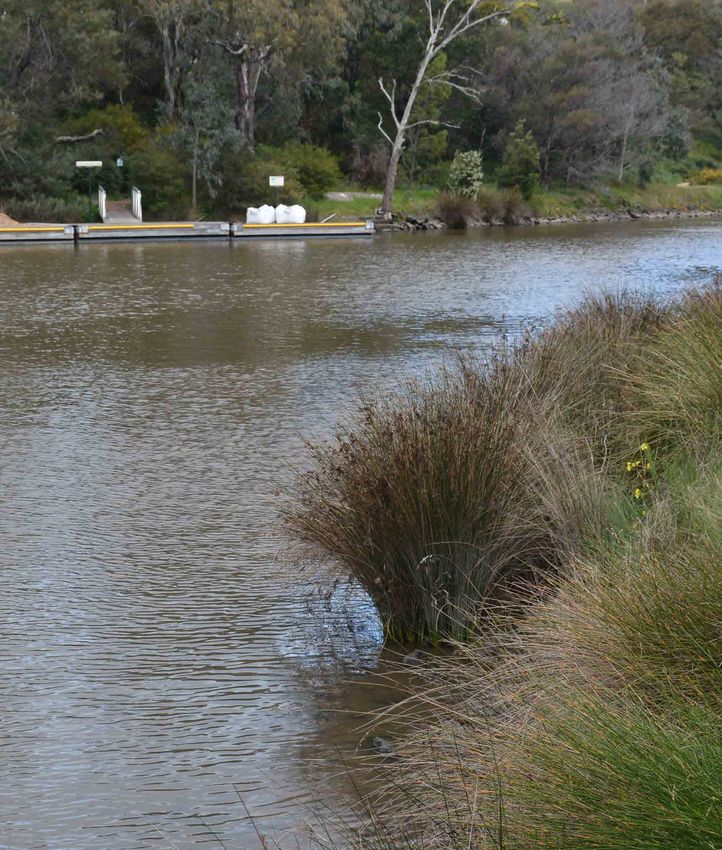
Polystyrene Pollution: Sources and Solutions 3
Disclosure Statement
      Cleanwater Group (CWG) acknowledges that some of the
      recommendations made herein (particularly regarding the pro-
      tection of stormwater infrastructure in hotspot areas) could be
      construed as in the interest of the company, as CWG provides
      such services and stands to gain financially if an employment
      opportunity should arise. In light of this, all possible efforts
      have been made to ensure impartiality in all recommendations
      and discussions provided. Cleanwater Group does not pro-
      mote their business practices in this document, nor one tech-
      nology or supplier over another. The advice they put forward
      in this document is therefore meant to be taken as general
      in nature. It is also acknowledged that the company will only
      participate in any possible future action that may be taken in
      this space if the process of involvement is deemed to be fair,
      unbiased and based on merit.

    Recommended Citation
      It is recommended that this report be cited as: Barmand, S.,
      Goodsell, K., Yardley, D., Kowalczyk, N. (2020). Polystyrene
      Pollution in the Yarra River: Sources and Solutions. Yarra River-
      keeper Association

                                                                       Figure 2
                                                    Microplastics in the soil at
                                                               the Docklands
4                                                        Anthony Despotellis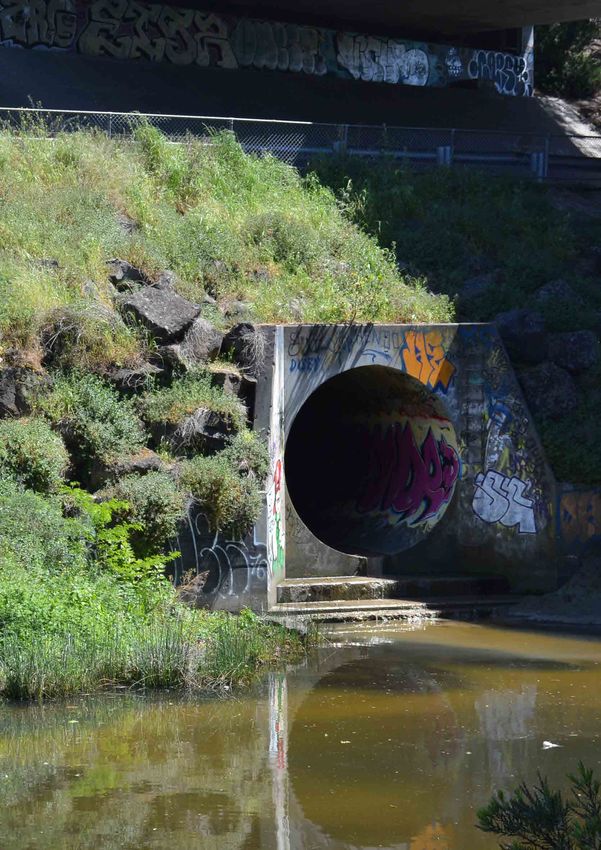
Polystyrene Pollution: Sources and Solutions 5
The Yarra Riverkeeper Association
       The Yarra Riverkeeper Association (YRKA) is the credible and
       authoritative voice for the Yarra, Melbourne’s own beautiful,
       resilient, iconic river. The Association is an independent com-
       munity of citizen advocates that works solely in the interest of
       the river with the advocacy strategy built around the motto:
       ‘Our Yarra, healthy, protected and loved’. The Yarra Riverkeep-
       er team monitor the river by boat and on foot, by bike and by
       canoe. That enables the Association to build a detailed under-
       standing of the complex interactions of the ecology of river and
       its role in the City of Melbourne. This understanding is shared
       with the community through the Association’s educational pro-
       grams, website, and social media. YRKA’s aims are to protect
       the Yarra from mouth to source, to revitalise the river and to
       foster love for the river by current and future generations.

    The Cleanwater Group
       The Cleanwater Group is a profit-for-purpose business with a
       mission to reduce the amount of plastic and other pollutants
       entering our ocean. We do this by focusing on prevention,
       data collection, source reduction, and community engage-
       ment. Our vision is a world where plastic is valued so much so
       that it no longer pollutes the environment.

                                                                      Figure 3
                                                      Nikki at the Yarra River
                                                            Blitz on the Yarra
6                                                               Anton Tejeda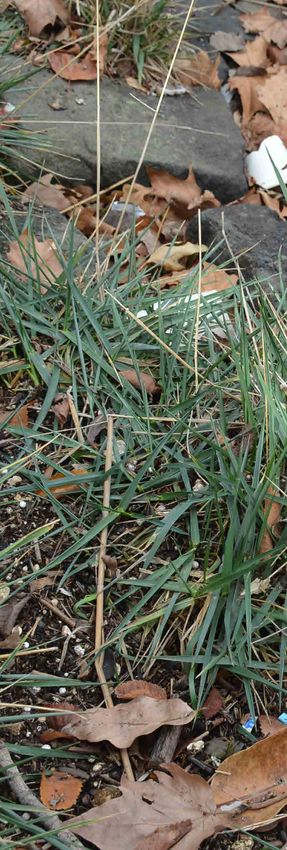
Polystyrene Pollution: Sources and Solutions 7

Table of Contents

    1.0 Introduction                                       16
      Where the Yarra meets Port Phillip Bay               16
      Litter in the Yarra River                            18
      Expanded Polystyrene in Australia                    19
      EPS Recycling                                        21
      Polystyrene in the Yarra River                       23
      Environmental Impacts of EPS                         26

    2.0 Aims                                               28
      Area of Study                                        30

    3.0 Methods and Objectives                             32
      Field Investigations                                 38

    4.0 Results                                            40
      Desktop Research                                     40
      Polystyrene Litter Rating Tool                       44
      Heatmap of Polystyrene Hotspots on the Yarra River   46
      Field Investigation                                  50
      Key Informant Survey                                 62

    5.0 Discussion and Limitations                         64
      Sources of Polystyrene Pollution             64
      Best-Practice Examples Observed in the Field 67
      The Regulatory Environment                   68
      Limitations72

8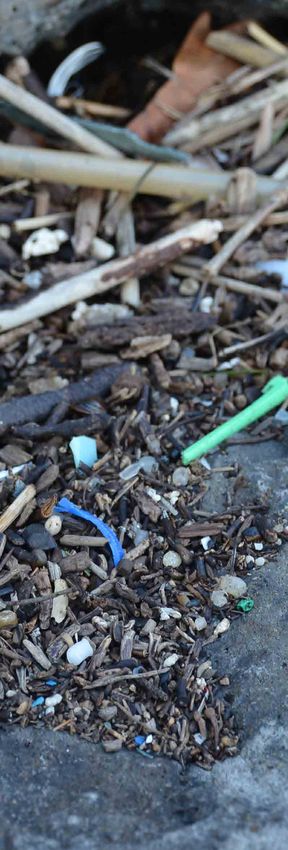
6.0 Recommendations                                                              74
  Expand and Improve the Polystyrene Collection and Recycling Network             74
  Develop Comprehensive Industry Waste Management Plans                           76
  Review Current Legislation and Revise Where Needed                              77
  Monitor and Strengthen Current Control Measures for Waffle Pod Pollution        78
  Develop a Stronger Knowledge Base on the EPS Industry                           79
  Phase Out Unnecessary Packaging                                                 79
  Rethink Packaging Design                                                        79
  Support market development                                                      80
  Expand the Use of Environmentally-Friendly Alternatives                         80
  Improve Consumer Education                                                      80

7.0 EPS Drop-off locations                                                       81

8.0 Conclusion                                                                   82

9.0 References                                                                   84

10.0 Appendices                                                                  88
  Appendix A Polystyrene Hotspot Rating Tool – Natural Environment                88
  Appendix B Decision-Support Tree                                                90
  Appendix C Semi-Structured Interview Template                                   91

                                                  Polystyrene Pollution: Sources and Solutions   9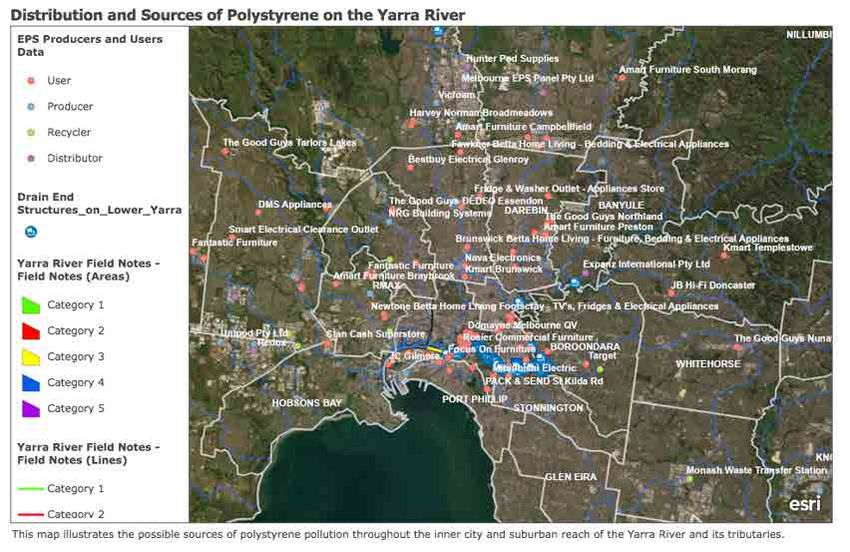
List of Figures                                            Figure 11
                                                                Top 10 most common items collected from the banks
                                                                                                                         24

                                                                of the lower Yarra River (between Church Street Bridge
                                                                and MacRoberston Bridge), based on a 100kg (20 bags)
                                                                sample on 18 April 2018.
     Figure 1                                              2   Figure 13                                               25
     Polystyrene on Yarra river bank                           Examples of polystyrene used in white goods packaging
     Anthony Despotellis                                       YRKA
     Figure 2                                              4   Figure 14                                               25
     Microplastics in the soil at the Docklands                Close-up of Bandalong litter trap
     Anthony Despotellis                                       contents in the lower Yarra.
                                                                YRKA
     Figure 3                                              6
     Nikki at the Yarra River Blitz on the Yarra               Figure 12                                               25
     Anton Tejeda                                              Average Bandalong litter trap composition between
                                                                years 2017 and 2019.
     Figure 4                                             15
     Vacuuming the Yarra River banks                           Figure 15                                               28
     Cleanwater Group                                          The Yarra River
                                                                Anthony Despotellis
     Figure 5                                             16
     Map of the Yarra River showing the boundaries              Figure 16                                               31
     of each of the four reaches and its entry                  Map of the inner-city reach
     into Hobsons Bay.                                         (Source: Melbourne Water, 2018)
     Figure 6                                             16   Figure 17                                               31
     The Yarra River                                           Map of the suburban reach
     Anthony Despotellis                                       (Source: Melbourne Water, 2018)
     Figure 7                                             19   Figure 18                                               36
     Example of EPS waffle pod used in the                      Decision-support tool for mapping
     construction of a concrete slab                           (large-scale version included in Appendix B).
     (WPMA, 2017)
                                                                Figure 20                                               41
     Figure 8 - Above                                     20   Snapshot of map illustrating users, producers,
     Various uses of expanded polystyrene in                    recyclers and distributors of polystyrene
     the packaging and construction industries.                identified through desktop research
     Figure 9 - Above                                     21   Figure 19                                               41
     General material flows for EPS Packaging                   Number of potential sources identified
     (Source: EPS Industry Alliance Packaging, 2019).          using desktop research
     Figure 10                                            23   Figure 21                                               45
     Average composition of a Bandalong litter trap in          Polystyrene Hotspot Rating Tool –
     the Yarra River (combining all litter traps between        Natural Environment
     years 2017-2019 and excluding organic matter which
     accounts for approx. 60% of trap contents).

10
Figure 22 45 Figure 34 - Above 58
Polystyrene Hotspot Rating Tool – Number of observations according to site type
Stormwater Drainage
Figure 36 59
Figure 23 - Top 46 Number of observations made per suburb
Bubble Map illustrating qualitative
data on EPS hotspots on the Yarra River Figure 35 59
Number of Observations per LGA
Figure 24 - Bottom 46
Heatmap illustrating qualitative data on
EPS hotspots on the Yarra River Figure 38 61
Map illustrating polystyrene hotspot ratings
Figure 25 48 for each field observation
Drain on the Merri Creek
Anthony Despotellis Figure 37 - Left 61
Cleanwater Group vacuuming the
Figure 26 50 Yarra River bank
Number of observations recorded per month
Figure 38 65
Figure 27 51 Example of biodegradable alternative
Number of observations per type of source to EPS peanuts
(blue colour includes all observations; orange
colour includes only observations that Figure 39 67
marked some level of polystyrene pollution) Example of effective border fence netting
to contain EPS leakage
Figure 29 53
Percentage of observations per hotspot Figure 40 67
category rating Example of border fence that does not
contain proper netting
Figure 28 53 Figure 41 67
Number of observations per Example of truck tarp that can be used
hotspot category rating to contain EPS during transport
Figure 30 54 Figure 42 72
Most common types of EPS observed The Yarra River
Anthony Despotellis
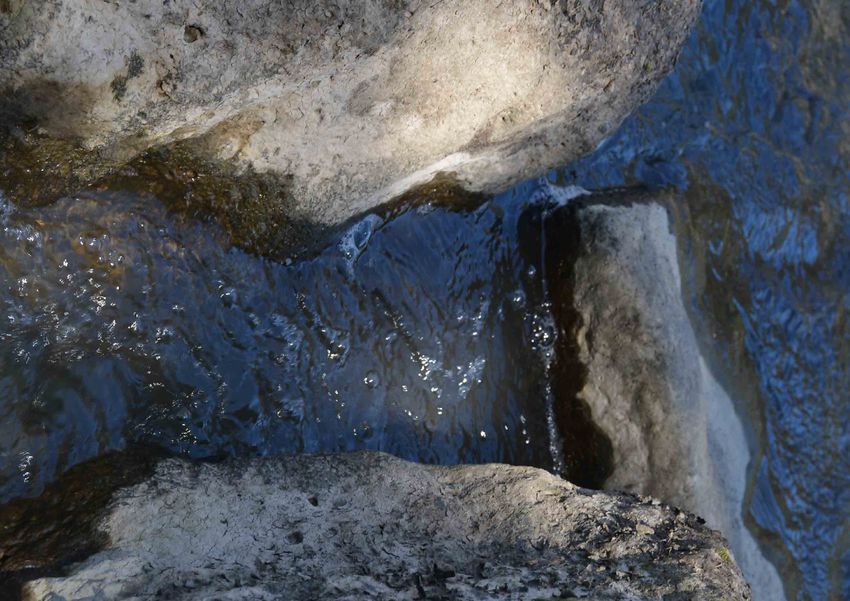
Figure 31 - Right 54
Yarra River rocks Figure 42 75
Anthony Despotellis Recyclable and non-recyclable forms
of EPS in Victoria
Figure 32 56 (MWRRG 2018).
Number of observations according to
source industry Figure 43 82
The Yarra River
Figure 33 57 Anthony Despotellis
Number of observations recorded in
each land use zone
Polystyrene Pollution: Sources and Solutions 11List of Tables
Table 1 33
Summary of objectives and methods
Table 2 35
EPS Packaging Types (APCO, 2019)
Table 3 38
Types of Data Recorded in
Field Observations
Table 4 43
Descriptions and Reasoning for
Layers included in the Potential
Sources and Distribution Map
Table 5 63
List of Key Informants
Table 6 71
Penalties for waterway pollution
in Australia (Federal and State)
12Polystyrene Pollution: Sources and Solutions 13
Executive Summary

  Polystyrene is pervasive on the Yarra River. Since 2018, polystyrene
  has consistently been found to be the highest littered item found
  on the River. Being both a light weight and brittle material, means
  that the ecological impacts of polystyrene, which can unfold
  gradually over time, can be widespread and devastating for the
  River and Port Phillip Bay.

  This report presents the findings of a study aiming to identify
  potential sources of polystyrene, particularly expanded
  polystyrene, pollution along the inner city and suburban reaches
  of the Yarra River. Data was gathered over the period from
  September to October 2019, with supplementary data added in
  January 2020. Both desktop research and field observations were
  conducted, in combination with a key informant survey through
  semi-structured interviews.

  With over 80% of field observations finding some level of
  polystyrene leakage, the results suggest that polystyrene
  leakage is widespread and prevalent within every industry that
  manufactures, distributes, handles and/or uses the material.
  In most cases, observations can be linked back to one of 64
  sources with photographic evidence provided. While the analysis
  identified that the retail industry, which uses polystyrene in white
  goods, brown goods and general packaging, is likely to be a
  major contributor of polystyrene pollution, the construction and
  building industry is, collectively, likely to also be a significant
  source, even though the amount of data collected on building
  sites was relatively limited as there is only a narrow window of a
  few days when EPS products can be observed being placed into
  concrete slabs or as insulation at a site. The results have been
  presented in an interactive geographical information system map,
  which will later be incorporated into the Yarra Atlas, with an access
  portal available on the Yarra Riverkeeper Association website.

  Figure 4
  Vacuuming the Yarra
  River banks
  Cleanwater Group                            Polystyrene Pollution: Sources and Solutions   15
1.0 Introduction
Where the Yarra meets Port Phillip Bay
The Yarra River traverses an enormous invasive species and habitat loss,
range of habitats from pristine forested as well as poor water quality. Water
catchments to a range of agricultural quality has been adversely affected by
lands and dense urban areas. The Yarra litter, pollution incidents, sewerage,
flows 242 kilometres from headwaters to stormwater quality, and climate change.
sea – from its source on the flanks of Mt The Yarra River discharges into the
Baw Baw in the Yarra Ranges National northern most section of Port Phillip Bay,
Park, north-east of Melbourne, through Hobsons Bay. Port Phillip Bay is the largest
the Yarra Valley and greater Melbourne marine embayment in Victoria, with an area
into Port Phillip Bay at Newport. More of approximately 1,930 square kilometres,
than one-third of Victoria’s population a coastline of 333 kilometres and a
lives in the Yarra catchment, which catchment area close to 10,000 square
spans about 4000 square kilometres and kilometres. Melbourne, with a population
includes 50 rivers and creeks (Melbourne in 2018 of 4.9 million people, surrounds
Water Corporation, 2018). much of the Bay. The Yarra River provides
most of the freshwater inflow into the Bay
The Yarra River corridor is 22% and is the largest litter contributor.
urbanised, 21% natural vegetation and
57% agricultural (Melbourne Water
Corporation, 2018). Historically, the Legend
Yarra River (Inner city)
Yarra River was treated as a large, open
Yarra River (Suburban)
Yarra River (Lower Rural)
Yarra River (Upper Rural)
Parks and Reserves
dumping site, transporting human
Councils
detritus out of sight and out of mind.
In 2018, the State of the Yarra and its
Parklands investigation reported 18 of
the 25 environmental health indicators
were ‘poor’. Only 1 of the overall 36
indicators scored in the ‘good’ category,
which was the indicator for “post
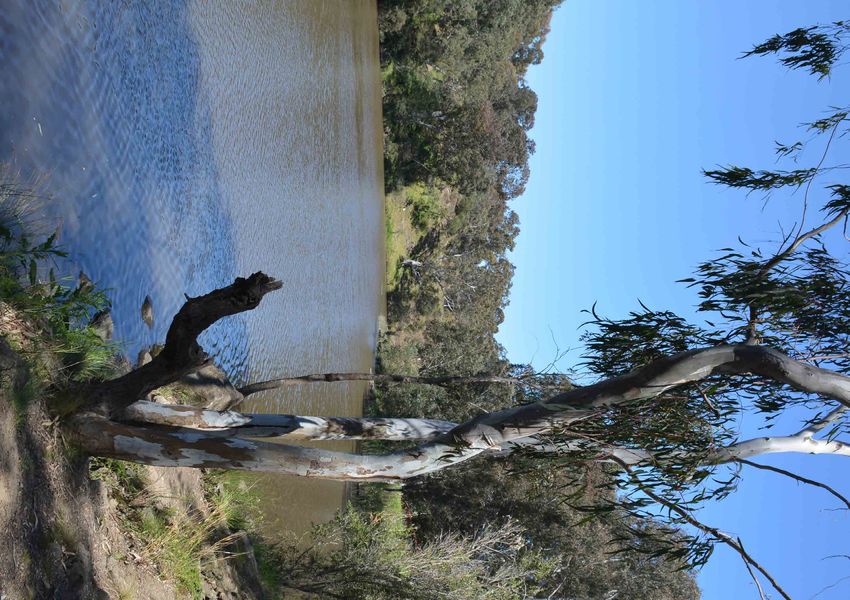
Figure 5
settlement colonial heritage” (Victoria, Map of the Yarra River showing the
2018). The three main issues facing boundaries of each of the four reaches
and its entry into Hobsons Bay.
the Yarra today are overdevelopment,
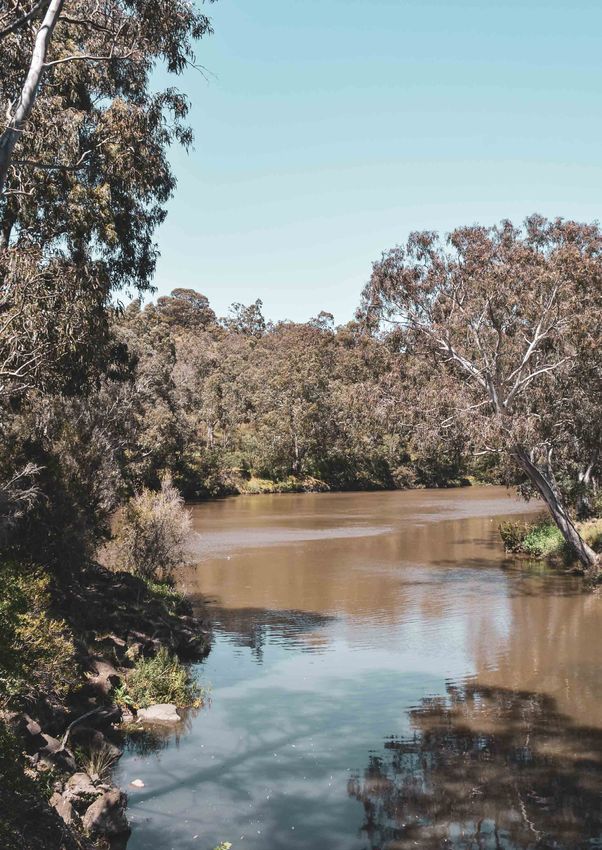
Figure 6
The Yarra River
16 Anthony DespotellisPolystyrene Pollution: Sources and Solutions 17
Litter in the Yarra River

     Waterways such as rivers act as a major      Seeking to identify potential sources
     transport pathway for all sizes and          and distributions of polystyrene on the
     types of litter. High plastic litter loads   Yarra, YRKA submitted an application for
     in rivers, including both macro and          the Port Phillip Bay Fund Round 3 Grant
     microplastics, are due to high levels        from Victoria Government’s Department
     of mismanaged plastic waste arising          of Environment, Land, Water and
     from population-rich river catchments.       Planning. Upon successfully receiving
     The State of the Bays 2016 report            this grant, the YRKA partnered with the
     highlighted the impact of waterway           Cleanwater Group to research, map and
     litter on Port Phillip Bay beaches,          conduct field inspections of potential
     including the potential for litter to        sites around the inner-city and suburban
     cause injury, high toxicity in biota and     reaches of the Yarra, where high-
     even death. The State of the Yarra 2019      volumes of polystyrene were thought
     report further identifies litter as a key    to be leaking into the environment and
     threat to our waterways and highlights       finding their way into the river.
     an increasing trend in litter volumes        The project aimed to track down key
     along the river corridor.                    sources of polystyrene pollution and
                                                  identify potential solutions to contain
     Through YRKA’s Litter and Flows and          this material at the source. This report
     the Yarra River Blitz projects, it was       has been prepared in order to present
     identified that polystyrene, especially      the results of this study and provide
     expanded polystyrene (EPS), is the           recommendations on source reduction
     most prevalent and pervasive litter          actions that can be implemented to
     item in the Yarra River. Since April         prevent polystyrene from entering our
     2018 and following 7 Blitz events            iconic waterways and Port Phillip Bay.
     approximately 38,000 kg of polystyrene
     contaminated soil and general waste
     have been removed from the Yarra’s
     riverbanks and reedbeds. Microplastic
     trawl sample analyses also indicated
     that over 828 million litter items flow
     into Port Phillip Bay annually from the
     Yarra’s surface waters, and over 612
     million (74%) of these are microplastics,
     including polystyrene fragments
     (Charko et al, 2018).

18
Expanded Polystyrene in Australia
EPS, derived from the addition According to Expanded Polystyrene
polymerization of phenyl ethane (styrene Australia (EPSA), the national industry
monomer), is produced in white beads body for all manufacturers and distributors
consisting of a number of closed cells, of EPS products across Australia, an
solidly supported and heat-sealed estimated 71,000 tonnes of EPS is
tangentially to each other, which contain consumed annually, growing at a rate of
still air occluded inside (Tsivintzelis et al., 5% per annum. This consists of:
2007). PS foam is produced by treating
crystalline PS with a blowing agent, - 47,000 tonnes, which is domestically
typically a hydrocarbon or carbon dioxide, manufactured from imported resins.
to produce a cellular structure in the Of this, 70% is used in the built
material, which reduces the brittleness, environment, in long-term use such as
making it an excellent cushioning and waffle pods used in housing construction
insulating material. Its use in food and engineering/manufacturing
and electronics packaging, airplane components (Metropolitan Waste and
and automotive parts, and sporting Resource Recovery Group, MWRRG,
equipment (among other applications), 2018). Approximately 30% of this is
has increased in the last few years due used for packaging, typically single-
to its advantages of being lightweight, use or short-term packaging that can
easy to form, acoustic and thermally be recycled after use. Of the 30%,
insulating, inexpensive to produce, approximately half is exported as fresh
cushioning, dimensionally stable, and heat food packaging;
and moisture resistant (Castro et al. 2017).
- 24,000 tonnes imported as packaging
In Australia, the expandable polystyrene with products;
manufacturing industry produces and
markets long life-cycle products, such as - 3,000 tonnes, which is the estimated
geoblocks, cornices, insulation systems amount of EPS reprocessed
for construction, and refrigerators, as and used locally.
well as short life-cycle products, such
as multipurpose boxes and packaging
systems for the transport of fragile
goods and foods, to name a few.
Figure 7
Example of EPS waffle pod
used in the construction of a
concrete slab
(WPMA, 2017)
Polystyrene Pollution: Sources and Solutions 19It is also estimated that the total amount disturbance and improve the time-
of EPS used in packaging is 44,000 efficiency of building sites (WPMA,
tonnes, distributed into the following 2017). “Waffle pods are EPS blocks
applications (Australian Packaging incorporated into building foundation
Covenant Organisation, APCO, 2018): slabs to significantly reduce the
amount of concrete (along with
20,000 tonnes for electrical and other benefits) required (One Planet
electronic products; Consulting, 2018:8).”
24,000 tonnes for other packaging, In practice, waffle pods are laid out
according to the site’s foundation
plan and are evenly placed in a grid-
Of the EPS that is being used in like pattern using spacers between
construction (which constitutes 70% each pod (EPSA, 2014c). Each pod is
of all EPS used in Australia), it is around 1.09m wide by 1.09m long,
estimated that more than 90% is with thicknesses ranging from 150mm,
consumed as waffle pods, with the 225mm, 300mm, and 375mm depending
remainder going into composite on the site specifications (EPSA, 2014c).
structure insulated wall panels Reinforcing mesh is then placed on
and other building products (One top of the pods, prior to concrete
Planet Consulting, 2018; Expanded being poured on top of and between
Polystyrene Australia, EPSA, the pods to complete the foundation
2019a). Waffle pods are used in the (EPSA, 2014c). It is common practice
construction of concrete slabs for both to over-order waffle pod material in
residential homes and commercial order to ensure that there is enough on
industrial buildings (Waffle Pod hand during construction. In addition,
Manufacturers of Australia, WPMA, there are also off-cuts generated on
2017). They are made from EPS, and site during the installation process (One
act as void formers for concrete slabs. Planet Consulting, 2018).
They are known to reduce construction
costs, provide insulation, reduce soil
Figure 8 - Above
. Various uses of expanded
polystyrene in the packaging
20 and construction industries.EPS Recycling
While EPS is reported to be 100% to the 2017-18 Australian Plastics
recyclable (EPSA, 2014b), it is estimated Recycling Survey commissioned by the
that “almost all EPS in Australia currently Australian Government Department of
goes in general waste to landfill (One Environment and Energy, New South
Planet Consulting, 2018:15).” This Wales Environment Protection Authority,
is largely due to polystyrene being and others, the national recycling rate
excluded as an acceptable form of for expanded polystyrene is now lower,
recyclable material in residential at 7.6% with the major end-market use
kerbside collections, as well as the lack being for waffle pods (Envisage Works,
of a consistent EPS recycling collection 2019). In terms of EPS packaging,
and drop off services for most users according to a 2018 EPSA study, the
apart from isolated cases run by bulk- national recycling rate is relatively low
goods retailers (e.g. Harvey Norman and with approximately 3,000 tonnes of
the Good Guys) or local councils. EPS recycled locally and 6,000 tonnes
exported for recycling (EPSA, 2018).
In terms of EPS recycling, there are This forecasts a recycling rate for EPS
different figures reported for the amount packaging in Australia at 29% (Envisage
of polystyrene recycled in Australia. Works, 2016). This is in contrast to the
EPSA (2014b) reports that during the NSW EPA, which reported that less than
2018/19 period, over 5,800 tonnes of 10% of EPS was recycled in NSW (being
EPS was recycled, which is in line with one of the most poorly recycled plastics
One Planet Consulting (2018)’s reported in the state). It estimated that 12,000
recycling rate of 12.1% for EPS across all tonnes of EPS is disposed to landfill
applications over the 2015-2016 period. each year, taking up 240,000 cubic
More recently, however, according metres of landfill space.
Figure 9 - Above
General material flows for EPS
Packaging (Source: EPS Industry
Alliance Packaging, 2019). Polystyrene Pollution: Sources and Solutions 21A report by One Planet Consulting Limited collection network: EPS
(2018:15) that was commissioned by is generally not collected through
ACT NoWaste, summarises the problem kerbside systems and the network of
for EPS: “EPS is inert in landfill and drop-off points are fragmented and not
lasts for hundreds of years. However, accessible by all consumers. Logistics
it occupies a large volume (space) in are relatively expensive due to the high
landfill for a long time. Positively, it is volume-to-weight ratio.
recyclable and there is a market demand
for it in Australia and offshore; however, Economics of disposal: It is cheaper for
collection costs are often greater than a consumer to landfill EPS than pay for
landfill costs.” recycling.
The key challenges summarised Quality of collected materials: High
by APCO (2018) for recycling and levels of contamination in many
recovering EPS and other foamed commercial and industrial sources
plastics include: reduce its commercial value.
Challenges in landfill: While EPS only Alternative materials: Some users are
makes up a small percentage of solid switching from EPS to alternative foams
waste to landfill, it takes up a lot of such as expanded polypropylene (EPP)
space and inhibits the compaction of and expanded polyethylene (EPE) which
waste. These problems and associated are less recyclable.
costs to local government are not
reflected in landfill disposal costs. End markets: There are limited local
markets for recovered EPS (most is
Impacts in litter: EPS is one of the most exported at present).
common materials found in illegally
dumped rubbish. In the litter stream, Consumer engagement: There is a high
EPS is a particular problem because it is level of consumer frustration as they do
lightweight and easily breaks down into not know if or how to recycle EPS
small pieces.
22Polystyrene in the Yarra River
One of the benefits of monitoring litter in c) Community clean-ups, and;
river systems is the relatively intact structure
of litter items, making them identifiable. d) Vacuuming reedbeds and riverbanks
This is in contrast with marine litter, which along the Yarra.
is often degraded, making it nearly
impossible to track the sources of the litter. As illustrated below, the quantitative and
The Litter and Flows Project highlighted qualitative data gathered through these
the main litter types found along and audits clearly revealed that Expanded
within the Yarra River by using the following Polystyrene (EPS) was the most abundant
auditing methods: litter item, both in terms of quantity and
volume.
a) Bandalong litter trap audits;
b) Microplastic trawls;
Figure 10
Average composition of a Bandalong litter trap in
the Yarra River (combining all litter traps between
years 2017-2019 and excluding organic matter which
accounts for approx. 60% of trap contents).
Polystyrene Pollution: Sources and Solutions 23Figure 11
Top 10 most common items collected from the
banks of the lower Yarra River (between Church
Street Bridge and MacRoberston Bridge), based on
a 100kg (20 bags) sample on 18 April 2018.
From these audits, it was identified Meat/fruit trays and food packaging
that polystyrene pollution comes in a including cups, bowls, clam shells
number of forms as listed below. An (packaging);
example of the various types can be
seen in the photo included in Figure 14. Polystyrene balls (Christmas decorations
and other décor);
Polystyrene sheets (in various thickness Polystyrene beads (in various
- likely a construction industry source); dimensions);
Polystyrene blocks (whole and cut offs - Polystyrene peanut shape packaging;
likely a construction industry source);
Flexible polyethylene foams.
Polystyrene packaging for small
and large appliances (packaging) as
illustrated in Figure 9;
24Figure 12
Average Bandalong litter
trap composition between
years 2017 and 2019.
Figure 13 Figure 14
Examples of polystyrene used in Close-up of Bandalong litter trap
white goods packaging contents in the lower Yarra.
YRKA YRKA
Polystyrene Pollution: Sources and Solutions 25Environmental Impacts of EPS
Worldwide, EPS is commonly reported have EPS fragments and greater
as one of the top items of debris concentrations of HBCD in their
recovered from riverbanks, shorelines tissues than mussels that live on other
and beaches (Thaysen et al., 2018). It’s materials (Jang et al., 2016). These
widespread distribution and persistence studies confirm that HBCD from
have resulted in EPS being found in the EPS leach into the environment and
gut contents of freshwater invertebrate surrounding organisms.
and vertebrate wildlife (Jianann et
al., 2018). In addition to physical EPS In 2015, the European Union banned
material, styrenes, the building blocks HBCD (hexabromocyclododecane),
of the polymer, are found in marine the brominated flame retardant used in
and freshwaters and sediments globally polystyrene building insulation, arguing
(Kwon et al., 2015, 2017). Because that the health and environmental hazards
polystyrene plastic is thought to be one associated with HBCD were significant.
of the only sources of styrenes in the HBCD is not manufactured in Australia
environment, the styrene contamination but is imported in EPS resin, as liquid
is likely a result of polystyrene dispersions and as a component of
weathering and leaching in marine and the EPS in finished articles, (Australian
freshwater systems (Kwon et al., 2017). Government, Department of Health-
Furthermore, in some parts of the world Hexabromocyclododecane (HBCD)).
EPS has been cited as a source of other
chemicals to the environment (Rani et Polystyrene is more harmful than other
al., 2015; Jang et al., 2017) and wildlife types of plastic because it is composed of
(Jang et al., 2016). relatively hazardous chemicals (Lithner et
al., 2011). Under certain conditions, EPS
In Asia, hexabromocyclododecanes leaches styrene and benzene, chemicals
(HBCDs) have been detected in EPS that have known toxic properties (Gibbs
buoys and other consumer products and Mulligan, 1997; Niaz et al., 2017).
(Rani et al., 2014). This contamination Laboratory toxicity studies suggest
originates from recycled EPS materials polystyrene microspheres can impact
containing flame retardants. The same feeding behaviour (Besseling et al.,
research group found that sediments 2012; Cole et al., 2015), cause weight
near aquaculture farms using recycled loss (Besseling et al., 2012), and affect
EPS buoys have relatively higher reproduction (Cole et al., 2015; Sussarellu
concentrations of HBCD compared et al., 2016) in invertebrate species. More
to other sites (Al-Odaini et al., 2015). research into the impact of EPS and
Further, mussels living on EPS buoys associated chemicals in vertebrates are
26needed to confirm broadscale negative
ecological impacts.
Although inconclusive, these results
highlight potential environmental
impacts of large volumes of EPS within
the Yarra River. Many governments have
now accepted the recommendation
from the science community that society
should not wait until there is more
quantified evidence of the degree of
damage before acting to reduce marine
plastic pollution impacts (Lavers and
Bond, 2017, Gall and Thompson, 2015).
In their report ‘Marine Plastic Debris
and Microplastics’, the United Nations
stated that there is a moral argument
that we should not allow the ocean to
become further polluted with plastic
waste, and that marine littering should
be considered a “common concern
of humankind” (UNEP, 2016). Locally,
the wildlife living in and around the
Yarra River is diverse, with one-third of
Victoria’s animal species found in the
Yarra catchment. The river and local
surrounds are home to 22 species of
fish, 190 bird species, 10 frog species,
16 reptile species and 38 species of
mammals, with several of these listed
as endangered. Hence, immediate
measures to manage plastic pollution
at all stages of its life, particularly at
the early stages where plastic sources
are known and can be more easily
contained, need to be addressed.
Polystyrene Pollution: Sources and Solutions 272.0 Aims
The specific aim of this project was to
identify potential sources of expanded
polystyrene that are polluting the
inner city and suburban reaches of
the Yarra River. The secondary aim of
this project was to gauge the level of
understanding amongst the industry on
the extent and severity of polystyrene
pollution around the Yarra River, and
map hotspots identified through the
Yarra River Blitz project.
The final aim of this study was
to develop a list of actions and
recommendations to reduce further
pollution from the sources identified as
contributors, with the ultimate goal of
preventing this substance entering the
Yarra River and Port Phillip Bay.
Figure 15
The Yarra River
Anthony Despotellis
28Polystyrene Pollution: Sources and Solutions 29
Area of Study

     The area of study for this research         The second, inner city reach, starts
     covered the inner city and the suburban     at Dight’s Falls which marks a clear
     reaches of the Yarra River. Both reaches    transition from the suburban to the
     have been designated and described by       inner city and is also the transition
     Melbourne Water Corporation (2018b) in      point between tidal and freshwater
     the Yarra Strategic Plan Map Book.          flows. The reach then extends
                                                 through industrial areas on the river
     The first, suburban reach, extends          flats, well-established residential
     from Warrandyte which sits at the           neighbourhoods, the Melbourne CBD,
     edge of metropolitan Melbourne, to          parklands and recreation spaces down
     Dights Falls in Abbotsford. This reach      to the central city where it ends (at
     primarily consists of a near-continuous     Webb Bridge). While the precincts of
     network of parklands and conservation       Docklands, Fishermans Bend and the
     areas as it transitions from rural at the   Port of Melbourne are not technically
     metropolitan edge to suburban once          considered part of the inner city reach
     it gets closer to central Melbourne         by Melbourne Water Corporation
     (Melbourne Water Corporation, 2018b).       (2018b), they were included in this study.

30
Figure 16
Map of the inner-city reach
(Source: Melbourne Water, 2018)
Figure 17
Map of the suburban reach
(Source: Melbourne Water, 2018)
Polystyrene Pollution: Sources and Solutions 313.0 Methods and Objectives
In order to identify potential sources locations of each Bandalong Litter Trap.
and distributions of polystyrene on the Discussions with key industry leaders
Yarra River, data on EPS manufacturers, were held using a semi-structured
high-volume users, recyclers and interview in order to measure the
distributors was first collected using current understanding of polystyrene
desktop research. These potential pollution around Melbourne, as well as
sources were then mapped using an to identify other potential sources and
interactive geographic information hotspots that could be included in the
system which also included data on study. Finally, each potential source was
major polystyrene hotspots on the inspected using observations in the
Yarra River (informed by the Yarra River field in order to gauge the potential
Blitz project), drainage catchments, level of contribution of polystyrene
stormwater outlets on the River, and the pollution originating from that source.
32Objective Method
Desktop research with geographical
Identify potential polystyrene producers information system (GIS) analysis
located near the inner city and suburban and map output, combined with a
reaches of the Yarra River. key informant survey through semi-
structured interview.
Desktop research with GIS analysis
Identify high-volume polystyrene
and map output, combined with a
users located within the inner city and
key informant survey through semi-
suburban reach of the Yarra River.
structured interview.
Create a polystyrene leakage/litter rating Literature review of Yarra River Blitz
system to assess sites based on Victoria data, Microplastic trawl data, and
Litter Action Alliance’s “Litter Hotshots community-group data, paired with
Rating Tool.” graphic design.
GIS analysis paired with qualitative
Create a heatmap of polystyrene analysis through semi-structured
hotspots on the Yarra River. interviews with Yarra River Blitz site
supervisors.
Conduct inspections of 50 sites along the
inner city and suburban reach of the Yarra Field observation using mobile GIS
River in order to identify how polystyrene data capture tools.
leakage and spillage occurs.
Identify which procedures can be put in Desktop research, literature review, and
place to reduce polystyrene pollution. analysis of field data.
Table 1
Summary of objectives and methods
Polystyrene Pollution: Sources and Solutions 33The target type of polystyrene included In order to identify potential sources
in this study was EPS which is used in of EPS producers and users, a desktop
a range of applications that are listed research study was conducted using
by the Australian Packaging Covenant web-based searches in Google (using
(2019) and illustrated in Table 2 keywords such as: polystyrene products
below. Note that the last row for Melbourne; polystyrene manufacturing
construction applications has been Melbourne; EPS Melbourne; thermocol
added as, “significant volumes of EPS manufacturing Melbourne; packaging
are used in long-term applications, Melbourne; waffle pods Melbourne),
such as building insulation panels and the Yellow Pages (using keywords
waffle pods for the housing construction such as: polystyrene products; EPS
industry and engineering/manufacturing polystyrene in Greater Melbourne),
components (APCO, 2019:8).” the White Pages, and Gumtree (using
keywords such as: polystyrene in
Melbourne). Despite this, delineating
which users and producers used EPS
over other types of polystyrene proved
difficult. Therefore, all potential sources
that could be verified as manufacturing
or using polystyrene on a daily basis
were included in the map. The line of
logic on whether to include a search
result in the study followed the decision
tree (next page).
34Application Description Examples
Consumer packaging to insulate hot or
cold food (e.g. hamburgers, noodles,
Foam coffee or juice cups,
Single-use food packaging ice cream) or beverages. Distributed by
foam trays and clamshells.
quick service restaurants (QSR), food
halls, cafes etc.
Consumer fresh produce Consumer packaging used to sell Foam meat and fresh
packaging products in retail stores. produce trays.
B2B packaging to distribute fresh
produce to supermarkets, restaurants
Business-to-business fresh etc. Used to provide insulation and Boxes for broccoli, beans,
produce boxes cushioning to fresh or frozen foods seafood, etc.
vulnerable to temperature and/or
impact.
Used to prevent movement and for On-line retail sales, e.g.
Loose fill EPS ‘peanuts’ cushioning in consumer and B2B loose fill in cardboard
packaging. boxes.
Moulded packaging to prevent Protective packaging
movement and protect electrical for white good and
Dry bulky goods packaging and electronic products, furniture, electronics, e.g.
homewares etc. Used for consumer and computers, TVs, printers,
B2B products. fridges, toasters.
Organ transport,
Used for insulation and/or cushioning for
Specialist applications temperature-controlled
transport or storage.
pharmaceuticals, etc.
Used in long-term use for the building
construction industry (e.g. for slabs and Building insulation panels
Construction applications
footings, geofoam) and engineering/ and waffle pods.
manufacturing components.
Table 2
EPS Packaging Types (APCO, 2019)
Polystyrene Pollution: Sources and Solutions 35Figure 18
Decision-support tool for mapping
(large-scale version included in
Appendix B).
36As noted in the decision tree, each In addition, a second method of data
potential source was categorised as collection was used following a key
either a user, recycler, producer or informant survey with a semi-structured
distributor. In order to contain the interview process. The intention of
geographic extent of potential sources this qualitative method was to gauge
within a reasonable area and ensure that expert opinion on potential sources and
potential pollution originating from that hotspots in order to qualify the premises
source would likely reach the Yarra River and assumptions made for the analysis
to some degree, the majority of users, and recommendations made in the final
recyclers, producers, and distributors report. A sample of the semi-structured
included in the map were located within interview is provided below as well as in
5km of either the inner-city reach, the Appendix C of this report.
suburban reach, or a tributary of the
Yarra that connects with one of the
two reaches. There were a few unique
cases outside of these criteria, where
sources were deemed as potentially
significant or worth observation (e.g. for
comparison or to serve as a control site)
and were thus included in the map.
Polystyrene Pollution: Sources and Solutions 37Field Investigations
Field investigations were then
conducted from October 2019 to
January 2020. Observations collected
in the field were guided by the results
of the desktop study on potential
sources located around the Yarra River.
Field data was collected using a digital
smart-form in the same geographical
information system as the map of
potential sources and hotspots of
polystyrene, in order to ensure that
each observation (or record) could be
geo-referenced for easy visualisation
in the final project map. Data collected
ranged from the location of the site to
specific information on the status, type
and condition of stormwater drains
inspected. A comprehensive list of
information collected is included in
Table 3 below.
Table 3
Types of Data Recorded in Field
38 ObservationsData Recorded Description
Location GPS coordinates were collected in order to include each observation on
the final project map
Time and Date -
Source Type Where identifiable, the source type was recorded (either user, producer,
recycler or distributor) for categorisation
Local Government Area -
Suburb -
Accuracy of the Geopoint This is a qualitative assessment to ensure geolocations are accurate and
corrected where needed
Presence of Observable This is a qualitative assessment (either yes, no or other) on whether
Pollutants pollutants can be observed at the site
Presence of Polystyrene This is a qualitative assessment (either yes, no or other) on whether
Pollution polystyrene pollution can be observed at the site
Polystyrene Hotspot Where polystyrene pollution is observed, this quantifies the level of
Rating pollution according to the 1-5 Category ratings developed in the two
Polystyrene Hotspot Rating Tools as part of the desktop study
Distribution of Polystyrene This is a qualitative assessment of whether the incidence of polystyrene
pollution is either widespread or clustered in a specific area
Most Common Types of Where possible to discern, this qualitative assessment records the most
EPS Observed common types of EPS observed at the site, including the categories:
EPS Balls, Bulk Goods / Box Packaging, Drink and Food Packaging, EPS
Peanuts, Insulation, Waffle Pods, or Unknown
Industry Source Where possible to discern, the source industry of the polystyrene (based
on either the closest potential source or the type of EPS observed) was
recorded, including the categories: Building and Construction, General
Packaging (this category was used if the specific type of EPS packaging
could not be determined), White Goods, Brown Goods, Recycling,
Furniture, Office Supplies and Unknown
Land-use Zone This includes the land-use zone of the site where the observation was
recorded, ranging from River or Creek, to Shopping Precinct, Residential
Area, Recycling or Waste Transfer Centre, Industrial Area, General
Commercial (which is generally a stand-alone commercial business not in a
shopping centre, e.g. Bunnings), or a Transport Corridor
Site Type The site type was recorded to provide a finer level of detail on the site (i.e.
the area being observed within the land-use zone). This includes: Loading
Dock, Stormwater Drain or Outlet, River, Street or Footpath, Car Park,
Landfill, Side of Highway, or the General Environment
Notes This includes any important points worthy to note from the observation
Stormwater Data This includes specific information on the status, type and condition of
stormwater drains or outlets inspected
Polystyrene Pollution: Sources and Solutions 394.0 Results
Desktop Research
The desktop study revealed 139 The geographical locations of each
potential sources of polystyrene potential source identified in the
pollution reaching the Yarra River. desktop study was then mapped using
These were categorised as either users, an interactive geographic information
producers, recyclers or distributors. Of system as illustrated in the map
these, 130 were verifiable as currently snapshot on the right.
operating and using, handling or
manufacturing expanded polystyrene in In order to further improve the
some way. Users mostly included white analysis and hone-in on potential
goods retailers, brown goods retailers, sources of polystyrene, a number
furniture suppliers, packaging suppliers of additional layers of information
(e.g. Pack and Send) and retailers of were added to the map, including:
office supplies. Producers included all data collected on each Yarra River
those verified as manufacturing EPS or Blitz; a layer of the qualitative data
products deriving from EPS. Recyclers on polystyrene concentrations for
included recycling and waste transfer various sites on the Blitz (using the
facilities that accept EPS for collection Polystyrene Hotspot Rating Tool –
and/or recycling, while distributors Natural Environment); and layers that
were characterised as potential sources illustrate stormwater drain outlets on
that sell EPS packaging or building the Yarra, Victorian Local Government
products wholesale. From the desktop Area (LGA) boundaries, the location
study, 99 users, 18 producers, 7 recyclers of microplastic trawls conducted by
and 6 distributors were identified. Of YRKA and Port Phillip EcoCentre,
the producers and distributors, 10 waterway drains and tributaries, and
were identified as participating in an sub-catchment boundaries. The list of
industry association such as Expanded layers with accompanying descriptions
Polystyrene Australia and/or Waffle Pod and reasoning is provided in Table 4,
Manufacturers of Australia (WPMA). over the page.
40Figure 19
. Number of potential sources
identified using desktop research
Figure 20
Snapshot of map illustrating users,
producers, recyclers and distributors
of polystyrene identified through
desktop research
Polystyrene Pollution: Sources and Solutions 41Layer Title Description Reasoning
This layer provides information on potential
sources (categorised as producers, users, The information provided in this layer
EPS Producers and Users
recyclers and distributors) of polystyrene will be used for field observations and is
Data
around the Yarra River that have been a key component of the study.
identified through desktop research
The Yarra River Blitz has been running
This layer provides qualitative data on since 2018. Data gathered from the
polystyrene concentrations for various sites field includes quantities of all pollutants
on the Yarra River Blitz. The data averages and does not disaggregate polystyrene
Yarra River Blitz EPS
scores from 1-5 (5 being the highest from other plastics observed. This rating
Hotspot Data
concentration) from Cleanwater Group provides a qualitative assessment of
field team supervisors through one-on-one concentrations of EPS at the various
interviews. sites visited on the Yarra River through
key stakeholder elicitation.
This layer provides field data from day
This information is important to include
sheets submitted to the YRKA during
Yarra River Blitz Data (Nov as it contains quantities, photos,
each Yarra River Blitz. The data has been
2019); (Aug 2019); (May and field notes from the Yarra River
disaggregated to be a separate layer for
2019); (March 2019); (March Blitz which is an important source of
each event so that certain events can be
2018); (Nov 2018) observational data of EPS occurrence on
toggled on and off, depending on how the
the river.
viewer wants to visualise the map.
This layer provides important Field Notes
from the Yarra River Blitz. In this layer, This layer provides field data from the
points designate areas of significance (e.g. Yarra River Blitz, including area extent of
bandalong trap locations or boat ramps). all sites visited on the Yarra River. It also
Yarra River Blitz Field Notes Lines illustrate geographic locations of provides locations of previous analysis
(Areas); (Lines); (Points) interest such as the extent of microplastic work conducted on the Yarra such as the
trawls or the end of a reach of the Yarra microplastic trawl site and the location
River. Areas illustrate the extent of area of all Bandalong litter traps. It is useful
cleaned for a particular site during Yarra for hotspot analysis work.
River Blitz events.
This layer is important to include so that
This layer includes the geographic sources and stormwater networks can
Victorian LGAs boundaries of each Local Government Area be visualised within the context of the
in Victoria. governing body that is responsible for
regulating/maintaining them.
42This layer from Melbourne Water illustrates The reason this layer has been included
the boundaries of each sub-region of the is because its primary purpose is
Melbourne Water operating region as for reporting targets, performance
Subcatchment Boundaries - part of the Healthy Waterways Strategy objectives, conditions, values etc.
Healthy Waterways Strategy 2018. The layer includes 5 catchments relating to the Healthy Waterways
(Werribee, Maribyrnong, Yarra, Dandenong, Strategy, and therefore is relates data
Westernport) and 69 sub-catchments (69 from the PS study back to relevant sub-
polygons). catchment areas for Melbourne Water.
This layer from Melbourne Water illustrates
the watershed/hydraulic catchment of major
waterways. The Major Catchment layer
Geographic extent of various
divides each primary catchment into the
catchments is important when studying
Major Waterways Drains tributaries of a primary river. The delineation
the distribution and flow of pollutants
and Tributaries Catchments of a Major Catchment is by the watershed
into a major waterway such as the Yarra
(natural or constructed) of a major drain or
River.
watercourse. Examples include: Tributary of
Yarra River, Darebin Creek, Tarago River, and
Corhanwarrbul Creek.
This dataset displays the Yarra River This has been included to aid
Yarra River DTP locations within the municipal boundary of visualisation of the River when viewing
the City of Melbourne. at the synoptic scale.
Catchments of all This dataset from Melbourne Water This has been included as it is useful for
Waterways and Drains - DR illustrates the catchment areas for all understanding distribution and flow of
MWC Catchment Waterways and Drains. pollutants in the context of stormwater.
This layer from Melbourne Water illustrates
the location and extent of natural and
constructed wetlands and lakes. This data
set is used to indicate the location and types
This layer was assessed however
Constructed Wetland of assets used for stormwater treatment and
determined not to be necessary at this
Stormwater Quality Assets flow management, for ongoing condition
time.
monitoring, maintenance and hydrologic
or vegetation analysis and to assist with the
planning and design, construction of future
stormwater management options.
Table 4
Descriptions and Reasoning for Layers
included in the Potential Sources and
Distribution Map
Polystyrene Pollution: Sources and Solutions 43Polystyrene Litter Rating Tool
In preparation for the field investigation, While creating the tool, it became
a polystyrene litter rating system was clear that there would be a need for a
developed in order to assess sites based separate rating system that followed a
on the concentration of polystyrene similar model but contained metrics and
observed. This rating system followed photos specific to assessing polystyrene
the model developed by the Victoria concentrations in stormwater drains, as
Litter Action Alliance in their “Litter this would be a key component of the
Hotshots Rating Tool,” however, was field investigation. As such, a separate
made specific to polystyrene instead “Polystyrene Hotspot Rating Tool –
of all types of litter. Categories were Stormwater Drainage” was created.
assigned and assessed using field data
and photos collected during the Yarra
River Blitz. While the example photos
provided in the tool are taken in a
riparian environment, it is intended
that this rating tool be applied when
assessing polystyrene concentrations
in both natural areas as well as in
developed areas such as parking lots,
nature strips, streets, footpaths, etc.
where leakage has occurred. A larger
scale version provided in Appendix A.
44Figure 21
Polystyrene Hotspot Rating Tool –
Natural Environment
Figure 22
Polystyrene Hotspot Rating Tool –
Stormwater Drainage
Polystyrene Pollution: Sources and Solutions 45Heatmap of Polystyrene Hotspots on the Yarra River
Following the desktop study respondent could not recall the level
identifying users, producers, recyclers of polystyrene pollution with certainty
and distributors of EPS that could or did not visit a particular site in
be potential sources for polystyrene their time spent on the River, the field
pollution on the River, a series of was left blank. The average score per
short, one-on-one interviews were site was then calculated across the
conducted with three Cleanwater three respondents, with photographic
Group employees that had served evidence collected where available. The
as site supervisors on one or more results of this qualitative assessment
Yarra River Blitz events that took place were then included in the interactive
quarterly, over the period covering map, illustrating the locations of
November 2018 to November 2019. hotspots on the Yarra River, and the
The supervisors were shown a map of intensity to which polystyrene occurs in
the Yarra River with all 39 sites cleaned each area. Figures 23 and 24 illustrate
on the Yarra River Blitz illustrated in this data as a bubble chart, which shows
green. Using their experience and large symbols for larger data values,
observations in the field, they were and a heatmap, which shows areas
then asked to qualitatively assign a of high activity with stronger (hotter)
category rating to each site using colours, respectively.
the “Polystyrene Hotspot Rating Tool
– Natural Environment.” Where a
Figure 23 - Top
Bubble Map illustrating
qualitative data on EPS
hotspots on the Yarra River
Figure 24 - Bottom
Heatmap illustrating
qualitative data on EPS
hotspots on the Yarra River
46Polystyrene Pollution: Sources and Solutions 47
“   While the number of observations per source type remain
         relatively small, it is interesting to note that approximately
         81% of EPS users, 83% of recyclers, 71% of producers and
         67% of distributors investigated had some level of polystyrene
         pollution somewhere around their site or in close enough
         proximity to be able to be attributed to their activities.
     										”

                                                                        Figure 25
                                                          Drain on the Merri Creek
48                                                            Anthony Despotellis
Polystyrene Pollution: Sources and Solutions 49
Field Investigation

     Using the data obtained from the          A total of 64 sites were investigated
     desktop study and the interactive GIS     with 107 observations recorded and
     map that could be accessed remotely,      375 photos captured in the field. The
     field inspections were conducted in       difference between the former two
     October, November and December            figures is due to some sites having
     2019, as well as January 2020. The        more than one instance of polystyrene
     locations of potential sources were       pollution in the surrounding area (e.g.
     informed by the GIS map of users,         evidence of polystyrene in a stormwater
     producers, recyclers and distributors,    drain in front of the site, as well as
     which ranged from manufacturers           along the border fence and in the
     of EPS in industrial areas, and high-     creek downstream from the site). Of
     volume users such as white and brown      all the sites investigated, 42 could be
     goods suppliers, to recycling centres     categorised as users of EPS, 6 could
     that accept EPS and residential           be identified as recyclers (or waste
     development sites that use EPS            transfer stations), 7 as producers and 3
     products for insulation and concrete      as distributors, with varying instances
     foundations. The types of sites where     of pollution observed around each site.
     observations were recorded ranged         Note that some sites where polystyrene
     from retail loading docks, border         leakage was observed could not be
     fences, footpaths and nature strips, to   linked back to a particular source and
     stormwater drains and sections of the     were therefore not included in the list of
     Yarra River and its tributaries.          source types.

                                                                                   Figure 26
                                                                      Number of observations
50                                                                       recorded per month
Figure 27
Number of observations per type of source
(blue colour includes all observations; orange
colour includes only observations that
marked some level of polystyrene pollution)
Polystyrene Pollution: Sources and Solutions 51You can also read