Polymer modelling unveils the roles of heterochromatin and nucleolar organizing regions in shaping 3D genome organization in Arabidopsis thaliana ...
←
→
Page content transcription
If your browser does not render page correctly, please read the page content below
Nucleic Acids Research, 2021 1
                                                                                                                          doi: 10.1093/nar/gkaa1275

Polymer modelling unveils the roles of
heterochromatin and nucleolar organizing regions in
shaping 3D genome organization in Arabidopsis
thaliana

                                                                                                                                                                  Downloaded from https://academic.oup.com/nar/advance-article/doi/10.1093/nar/gkaa1275/6097670 by guest on 21 February 2021
                                 1,*
Marco Di Stefano                       , Hans-Wilhelm Nützmann2 , Marc A. Marti-Renom                                       1,3,4,5
                                                                                                                                        and
Daniel Jost6,*
1
  CNAG-CRG, The Barcelona Institute of Science and Technology (BIST), Barcelona, Spain, 2 The Milner Centre for
Evolution, Department of Biology and Biochemistry, University of Bath, Bath BA2 7AY, UK, 3 Universitat Pompeu
Fabra, Barcelona, Spain, 4 CRG, The Barcelona Institute of Science and Technology (BIST), Barcelona, Spain,
5
  ICREA, Barcelona, Spain and 6 Université de Lyon, ENS de Lyon, Univ Claude Bernard, CNRS, Laboratoire de
Biologie et Modélisation de la Cellule, Lyon, France

Received May 08, 2020; Revised November 16, 2020; Editorial Decision December 18, 2020; Accepted January 13, 2021

ABSTRACT                                                                          pave the way for a comprehensive characterization
                                                                                  of the generic principles that are likely to shape and
The 3D genome is characterized by a complex or-
                                                                                  regulate the 3D genome in many species.
ganization made of genomic and epigenomic lay-
ers with profound implications on gene regulation
                                                                                  INTRODUCTION
and cell function. However, the understanding of the
fundamental mechanisms driving the crosstalk be-                                  In eukaryotic cells, the genome structure is characterized by
tween nuclear architecture and (epi)genomic infor-                                a complex three-dimensional (3D) organization (1–3) that
mation is still lacking. The plant Arabidopsis thaliana                           plays a crucial role in regulating gene function and expres-
is a powerful model organism to address these                                     sion (4,5), and in determining cell-fate decisions (6–9), and
                                                                                  cell-development (6,10).
questions owing to its compact genome for which
                                                                                     Microscopy and chromosome conformation capture (3C)
we have a rich collection of microscopy, chromo-                                  (11) techniques have been used to unveil the architectural
some conformation capture (Hi-C) and ChIP-seq ex-                                 folding of the genome. Using microscopy techniques such
periments. Using polymer modelling, we investigate                                as FISH (12), 3D-FISH (13,14) and cryo-FISH (15), it
the roles of nucleolus formation and epigenomics-                                 was possible to visualize that each chromosome occupies
driven interactions in shaping the 3D genome of A.                                a distinct portion of the nucleus called chromosome ter-
thaliana. By validation of several predictions with                               ritory (CT) with a non-random radial location (12–14).
published data, we demonstrate that self-attracting                               High-throughput chromosome conformation capture (Hi-
nucleolar organizing regions and repulsive constitu-                              C) (16) confirmed the presence of CTs by probing much
tive heterochromatin are major mechanisms to reg-                                 stronger cis- than trans-chromosome interactions (16,17).
ulate the organization of chromosomes. Simulations                                Analysis of Hi-C maps also revealed the presence of a typ-
                                                                                  ical checkerboard pattern that reflects the physical segre-
also suggest that interphase chromosomes maintain
                                                                                  gation of the genome into multi-megabase chromatin com-
a partial structural memory of the V-shapes, typi-                                partments (16,18). These are characterized by different GC-
cal of (sub)metacentric chromosomes in anaphase.                                  content, gene density and epigenomic marks, suggesting
Additionally, self-attraction between facultative het-                            that they mostly match the classical partition of the genome
erochromatin regions facilitates the formation of                                 in hetero- and euchromatin (19–22). At the sub-megabase
Polycomb bodies hosting H3K27me3-enriched gene-                                   level, Hi-C experiments also revealed that the genome is or-
clusters. Since nucleolus and heterochromatin are                                 ganized into self-interacting regions termed topologically
highly-conserved in eukaryotic cells, our findings                                associating domains (TADs) (17,23,24), that have been also
                                                                                  visualized by super-resolution microscopy approaches (25).

* To
   whom correspondence should be addressed. Tel: +34 934 033 743; Fax: +34 934 037 279; Email: marco.distefano@cnag.crg.eu
Correspondence may also be addressed to Daniel Jost. Tel: +33 4 72 72 86 30; Fax: +33 4 72 72 80 00; Email: daniel.jost@ens-lyon.fr
Present address: Marco Di Stefano, Institute of Human Genetics, CNRS, Chromatine et Biologie Cellulaire, Montpellier, France.

C The Author(s) 2021. Published by Oxford University Press on behalf of Nucleic Acids Research.
This is an Open Access article distributed under the terms of the Creative Commons Attribution-NonCommercial License
(http://creativecommons.org/licenses/by-nc/4.0/), which permits non-commercial re-use, distribution, and reproduction in any medium, provided the original work
is properly cited. For commercial re-use, please contact journals.permissions@oup.com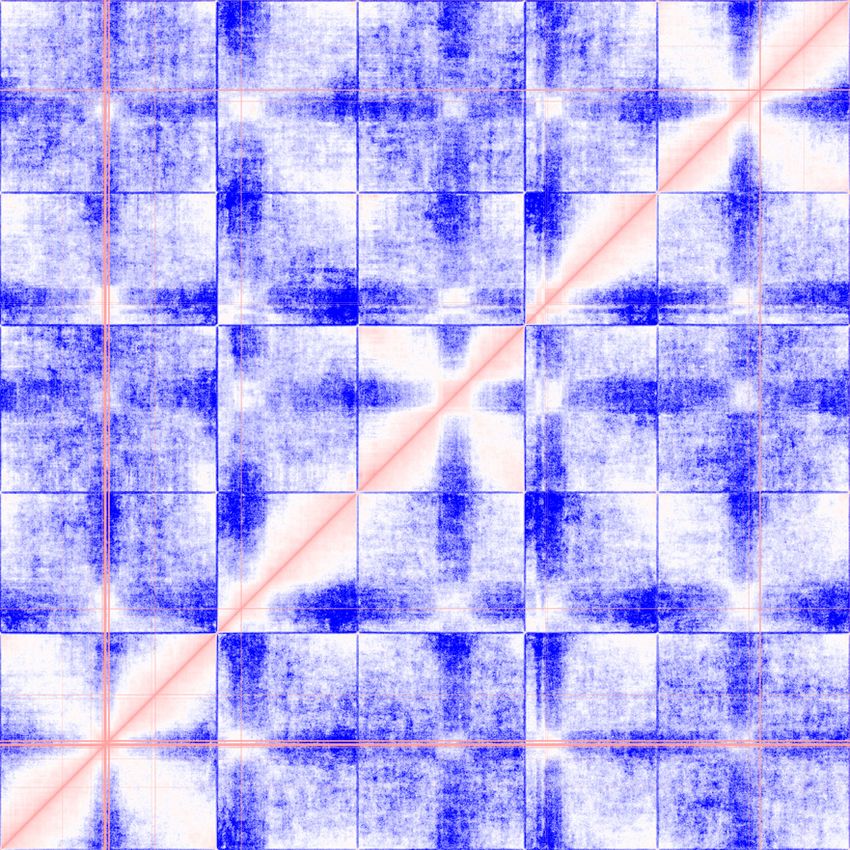
2 Nucleic Acids Research, 2021

In mammals and Drosophila melanogaster, TADs are con-            nisms leading to the genome organization in A. thaliana is
sidered the structural and functional units of the genome        still missing.
that define the regulatory landscape (26–28).                       Here, we test the hypothesis that the interactions be-
   In animals, computational studies based on polymer            tween epigenomic states, as previously suggested (33–37)
modelling enabled to relate the organizational layers of         in other species, are driving forces of the genome structural
the genome to specific active and passive physical mecha-        organization in A. thaliana (59). We use polymer modelling
nisms. The formation of chromosome territories may be fa-        and molecular dynamics together with epigenomic data to
cilitated by the slow relaxation dynamics of topologically-      generate genome-wide chromosome models. By providing
constrained polymers (29–32). The segregation between ac-        quantitative comparisons of our predictions with Hi-C and

                                                                                                                                 Downloaded from https://academic.oup.com/nar/advance-article/doi/10.1093/nar/gkaa1275/6097670 by guest on 21 February 2021
tive and repressive chromatin compartments was suggested         microscopy data, we demonstrate that four fundamental el-
to be primed by micro-phase separation promoted by fac-          ements may be sufficient to determine the genome organiza-
tors such as heterochromatin protein 1 (HP1) and polycomb        tion in A. thaliana. First, chromosomes need to be precon-
group (PcG) proteins binding to repressive histone marks         ditioned as V-shaped objects. Second, the self-attraction of
(33–37). The formation of TADs was associated with mech-         NORs shapes the overall nuclear organization. Third, the
anisms of active (38,39) or passive (40) loop-extrusion.         repulsion between constitutive heterochromatin and other
   Within plants, Arabidopsis thaliana is an important           epigenomic states explains the segregation and the localiza-
model organism for structural genomics studies and has           tion at the nuclear periphery of chromocenters. Fourth, the
the most comprehensive collection of chromosome data             self-attraction between facultative heterochromatin regions
available. Its genome, that is constituted by 5 chromo-          recovers the formation of self-interacting gene-clusters at
somes, is diploid, and is smaller (∼120 mega-base pairs,         local scales.
Mb) and gene-denser compared to other plant genomes,
which makes it more suitable for computational studies.
                                                                 MATERIALS AND METHODS
   In interphase, A. thaliana chromosomes are organized
as well-defined chromosome territories (41–45) with gen-         Our work consists of three main parts: (i) processing of
erally no preferential radial positioning nor chromosome         ChIP-seq datasets to segment the A. thaliana chromosomes
pairing (41,46,47). Notable exceptions are the short arms of     into distinct epigenomic states; (ii) genome-wide molecular
acrocentric chromosomes 2 and 4, and the telomeres. The          dynamics simulations models and (iii) analysis of the ob-
former host the nucleolus-organizing regions (NOR2 and           tained 3D models and validation against published experi-
NOR4), that typically associate in a single nucleolus at the     mental data.
centre of the nucleus (41,48–50). The latter cluster at the
nucleolar periphery (42–46). Within chromosome territo-
                                                                 Epigenomic states analyses
ries, A. thaliana chromatin contains active and repressive
chromatin (51), that are organized in structural domains         ChIP-seq epigenomic data at 400 bp of resolution for 4
(42,43). The chromocenters (including centromeres and            histone marks: H3K4me2, H3K4me3 (signatures of ac-
peri-centromeres), that are the largest heterochromatic re-      tive genes), H3K27me3 (signature of facultative, polycomb-
gions, are spatially and dynamically confined at the nuclear     like heterochromatin) and H3K9me2 (specific to constitu-
periphery (41,46,52,53) and anchor protruding euchromatic        tive heterochromatin) were collected from published works
loops of about 0.1–1.5 Mb resulting in a looped rosette over-    (44,45). To each 3 kb-genomic region of the genome, an av-
arching structure (46). In individual nuclei, chromocenters      erage epigenomic signal was assigned for each of the four
may also self-associate, leading to trans-chromosome con-        marks. A K-means algorithm (Euclidean distance, k = 4)
tacts and larger heterochromatin foci (42–46). Hi-C data         allowed clustering the 3 kb-regions into four groups: ac-
have also revealed the existence of long-range cis- and trans-   tive chromatin (AC) enriched in H3K4me2/3, facultative
chromosomal contacts, the so-called KNOT Engaged El-             heterochromatin (FH) enriched in H3K27me3, constitutive
ements (a.k.a. IHIs) structure (42,43) that has structural       heterochromatin (CH) enriched in H3K9me2 and undeter-
counterparts in other plant species such as the compact          mined (UND) depleted in all these four marks. The lengths
silent centre (CSC) in rice (54). At fine scales, although       and the genomic localization of the domains assigned to
TADs are not prominent features (44,55), TAD-boundary-           each of the four chromatin states were used to generate the
like elements have been shown to correlate with open chro-       plots in Figures 1B and C and in Supplementary Figure S1.
matin and actively transcribed genes (44), and local self-
interacting domains can be formed between H3K27me3-
                                                                 Genome-wide chromosome simulations
enriched gene-clusters (56,57). At the scale of a few kilo-
base pairs (kb), local chromatin loops are suggested to con-     The chromosome polymer model. Molecular dynamics
nect the 5 and 3 ends of genes (45).                           simulations of the diploid A. thaliana genome were run us-
   Previous modelling exercises (58), using a phenomeno-         ing the 30 nm-fibre model (60), in which each bead hosts 3
logical ad-hoc coarse-grained polymer model, have sug-           kb of DNA sequence and has a diameter of 30 nm. Each A.
gested that the peripheral positioning of the chromocenters      thaliana chromosome was represented as a chain of beads
and the central localization of the nucleoli may be the conse-   using the Kremer–Grest bead-spring model (61,62). This
quences of entropic forces emerging from the formation of        model allowed to represent chromatin as a 30 nm-thick fi-
large permanent cis-chromosome loops and of steric con-          bre with a persistence length of 150 nm (63) and to avoid
straints. However, a detailed description and characteriza-      chain crossings (Supplementary Methods). The lengths of
tion of the specific biological and physico-chemical mecha-      A. thaliana chromosomes (in bp and in models’ beads) and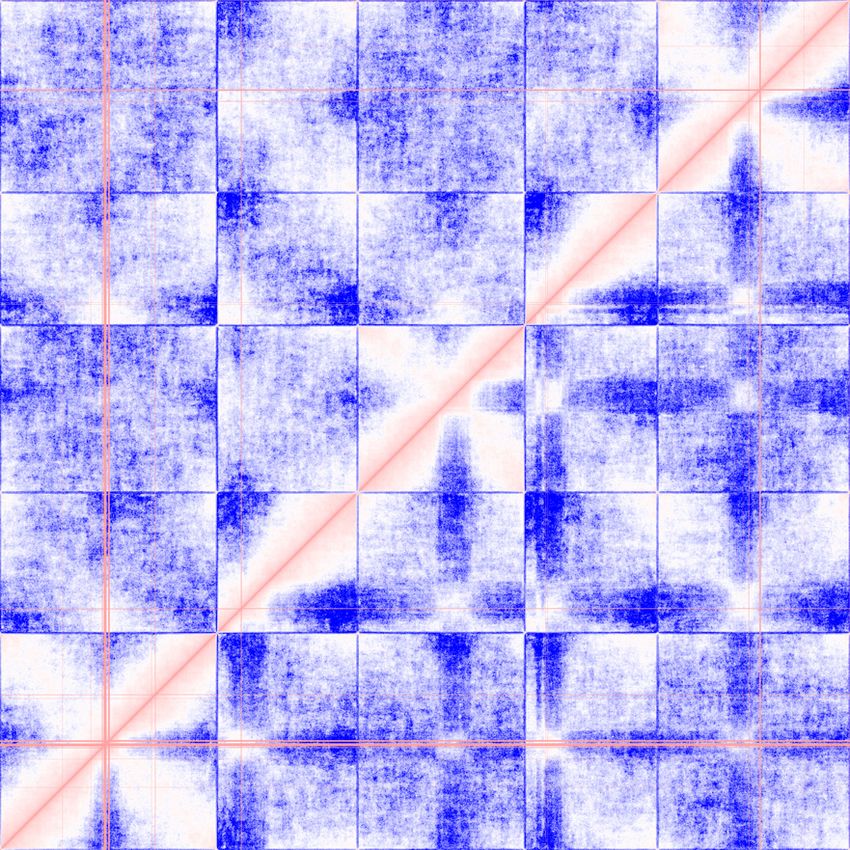
Nucleic Acids Research, 2021 3
the genomic locations of special sequences (NORs and cen- chromosome models in a spherical nuclear environment are
tromeres) were based on the reference genome TAIR10 illustrated in the Supplementary Videos S2, S3 and S4 and
(Supplementary Table S1). described in details in Supplementary Methods. For each of
Additional epigenomics-based short-range interactions the tested mitotic-like chromosome shapes, 50 different ini-
were added to test how the attractions or repulsions between tial conformations were simulated for the optimal param-
the A. thaliana chromatin states shape the chromosome or- eter sets derived in the single-chromosome study (Figure
ganization. These interactions have been modelled using at- 3). To test the relative importance of the model parameters,
tractive or repulsive short-range (Lennard-Jones) potentials several variant genome-wide simulations were performed in
of variable strengths: from 10−6 to 1.0 kB T for repulsive in- which the optimal epigenomic-based interactions were per-
Downloaded from https://academic.oup.com/nar/advance-article/doi/10.1093/nar/gkaa1275/6097670 by guest on 21 February 2021
teractions and from 0.025 to 1.00 kB T for attractive ones, turbed one-by-one. The set of explored scenarios is sum-
where kB = 1.38 × 10⁻²³ J/K is the Boltzmann constant, marised in Supplementary Figures S7 and S8.
and T = 298 K is the temperature of the system (Supplemen-
tary Methods). Finally, the dynamics of the polymer model KNOT engaged elements-driven steered molecular dynam-
was simulated by integrating the (underdamped) Langevin ics. Fifty steered molecular dynamics simulations were
equation of motion using LAMMPS (64). Each of the simu- performed to promote the spatial proximity between the
lated trajectories lasted for 120 000 τ LJ (internal LAMMPS KNOT engaged elements (KEEs) (42,43) starting from the
time-unit) and allowed to generate 39 distinct models (1 final snapshots of the optimal-model simulations. In partic-
model every 3000 τ LJ starting from 6000 τ LJ ). Since the ular, harmonics were applied between the central beads of
equilibration time of dense or semi-dilute polymer solu- the KEEs regions each spanning ∼450 kb. Briefly, the dis-
tions largely exceeded the simulation time (29), the obtained tances between the central beads of the KEEs were com-
models are out-of-equilibrium structures in which physical puted both cis- and trans-chromosome in all the 50 ini-
properties of the system have reached a quasi steady state. tial conformations and the closest bead pairs across all the
See for example the Supplementary Video S1, that shows snapshots were co-localized (Supplementary Methods) us-
the convergence over time of the average contact probabil- ing the experimental FISH association rates (43) (20% of
ity (P) versus the genomic distance (s). the KEE6–KEE1, 35% of the KEE5–KEE4, 66% of the
KEE6–KEE3 and 16% of the KEE5–KEE10 pairs), or the
Single-chromosome preliminary simulations. Single- average rate of 34% for all the other KEEs pairs.
chromosome simulations were performed for chromosome
4 (Chr4) described as a chain of 6195 beads (excluding the
Analysis of the polymer models
NOR4 to simplify). To enhance the statistics, we simulated
at the same time five copies of Chr4 placed in a cubic Comparison with Hi-C data. Three Hi-C datasets for
simulation box (size 2.76 m) with periodic boundary A. thaliana Col-0 seedlings were downloaded from the
conditions (DNA density of 0.004 bp/nm3 ). In the initial sequence read archive (SRA) (Supplementary Table S2)
conformation, each model chromosome was prepared using fastq-dump (version 2.8.2, https://github.com/ncbi/
in a linear rod-like shape to mimic an elongated mitotic sra-tools/wiki). Each experiment was processed through
state (29), and the five copies were placed in a random, the TADbit pipeline (65) (https://github.com/3DGenomes/
yet non-overlapping arrangement. For each of the 50 tadbit). Briefly, the pipeline consists of (i) checking
considered parameter sets (Supplementary Figures S2–S4), the quality of the FASTQ files; (ii) mapping of the
the dynamics of 10 independent trajectories were then paired-end reads to the A. thaliana reference genome
simulated using LAMMPS (Supplementary Methods and (release TAIR10 ftp://ftp.ensemblgenomes.org/pub/release-
Figure 2) and subsequently analysed (see below). 40/plants/fasta/arabidopsis thaliana/dna/) using GEM (66)
taking into account the DpnII restriction enzyme cut-site
The genome-wide models. For genome-wide simulations, using fragment-based mapping (65); (iii) filtering to remove
we tested the effect of distinct initial conformations, which non-informative reads using the following (default) TAD-
can be associated with mitotic-like chromosomes. Specif- bit filters: self-circle, dangling-ends, error, extra-dangling-
ically, chromosomes were arranged as (i) linear rod-like ends, duplicated and random-breaks (65); (iv) merging of
objects as for the single-chromosome simulations (Supple- the datasets into a single one for the restriction enzyme
mentary Figure S6A and Supplementary Video S2), (ii) V- DpnII; (v) normalization of the merged datasets using the
shaped objects generated by linear pullings along parallel OneD (67) method at 3 and 30 kb resolution. Before merg-
directions (Supplementary Figure S6B and Supplementary ing the datasets (point (iv)), their mutual consistency was
Video S3) or (iii) V-shaped chromosomes generated by lin- verified using the reproducibility score (R-score) (68). The
ear pulling along radial directions (Supplementary Figure obtained R-score values ranged between 0.56 and 0.84 indi-
S6C and Supplementary Video S4). V-shape cases mim- cating consistency between the merged datasets (68).
icked the pulling of kinetochores by microtubules during For each simulated configuration, contacts were com-
metaphase and also accounted for the observation that the puted using a cut-off distance of 200 nm which charac-
Hi-C interaction probability versus the genomic distance terizes roughly the spatial resolution of Hi-C experiments
(see Figure 3E) increases after 10 Mb (the typical size of (69,70). From these contacts, we then built contact maps for
an arm in A. thaliana chromosomes) indicating an enrich- the single-chromosome and genome-wide cases. From these
ment of inter-arm contacts. The procedures to generate the maps, the average contact probability P(s) was quantified
distinct chromosome shapes, to form the nucleolus by pre- by averaging the predicted contact frequency over all the
conditioning the NORs arrangement, and to confine the pairs of loci at the same genomic distance (s). To compare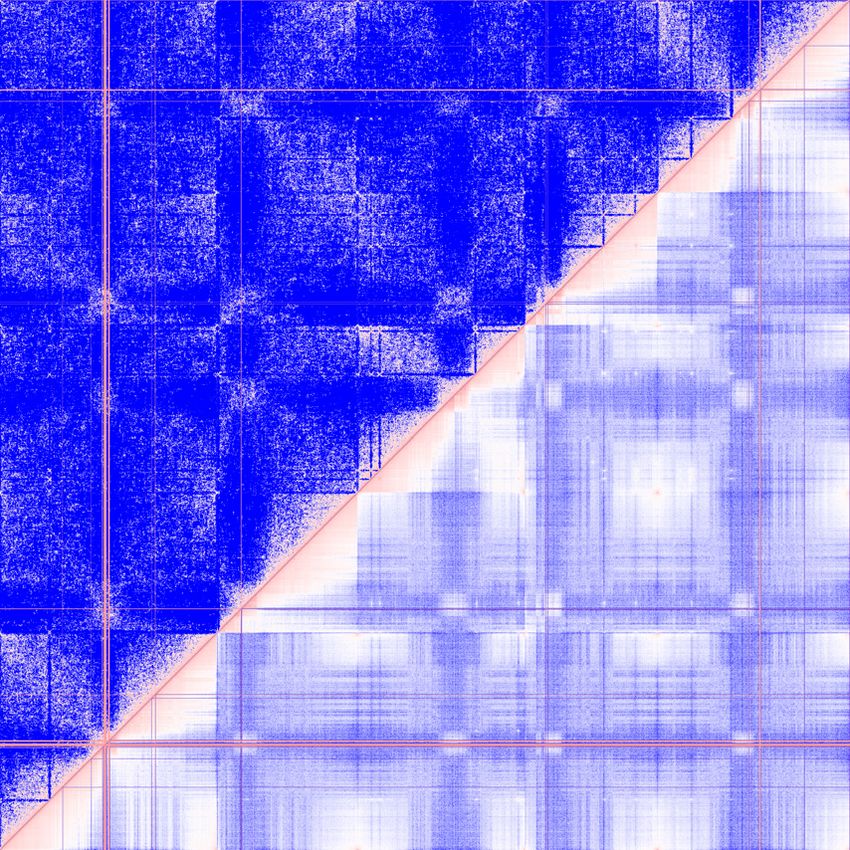
4 Nucleic Acids Research, 2021
visually predicted and experimental Hi-C data, the number RESULTS
of contacts in the models were re-scaled such that the av-
Epigenomics-driven folding of A. thaliana chromosomes us-
erage number of contacts at a genomic distance of 300 kb
ing polymer models
(the number of bp in one Kuhn segment of the polymer
models) equals the experimental one. Quantitative com- In this study, we tested the hypothesis that specific inter-
parisons were made using the Spearman correlation coef- actions mediated by epigenomics are driving forces of the
ficient (SCC) analysis applied to the P(s), genome-wide and genome structural organization in A. thaliana. To this end,
cis-chromosome matrices, and the compartment strength we applied to a plant species a modeling method that has
(CS) analysis (71) for each chromatin state. CS definition is been previously applied to the fly (33,37) and human (34–
Downloaded from https://academic.oup.com/nar/advance-article/doi/10.1093/nar/gkaa1275/6097670 by guest on 21 February 2021
based on the observed-over-expected (OoE) map. This map 36,72–75) genomes and that posits that epigenomics-driven
is computed as the entries of the contact or Hi-C map di- interactions partition the genome into spatial compart-
vided by the P(s) for the corresponding genomic distance s. ments. Here, we built polymer models of the chromosomes
For each bin (b) of a given epigenomic state, the CS was then using beads of 30 nm hosting each 3 of chromatin (Figure
quantified as the ratio between the average OoE value of b 1A). We used short-range attractive and repulsive interac-
with bins of the same epigenomic state and the average OoE tions between 3 kb-regions defined by their epigenomic state
value of b with any other bin in the same chromosome. CS in conditions of density and confinement mimicking the nu-
scores of all the bins of a given epigenomic state are then clear environment.
pulled together to form the CS distribution of that state, Based on the enrichment in epigenomic marks (44,45),
that were shown in the figures of this work. In this metric, we assigned to each 3 kb-region one of four chromatin
no compartmentalization corresponds to CS = 1, whereas states (33) (Materials and Methods). A total of 52% of the
any pattern of compartmentalization yields to CS > 1. genome was assigned to active chromatin (AC) enriched in
H3K4me2 and H3K4me3, 14% to facultative, polycomb-
like heterochromatin (FH) decorated with H3K27me3,
Nuclear positioning of genomic regions. Radial positions
14% to constitutive heterochromatin (CH) enriched in
of the beads for each epigenomic state were used to build
H3K9me2 and 12% to undetermined (UND) regions that
the histogram of the number of beads per concentric nu-
were depleted in all the considered epigenomic marks (Fig-
clear shell of width 250 nm. Similar conclusions can be ob-
ure 1B and C, and Supplementary Figure S1).
tained using binnings of 125 or 500 nm (Supplementary
Extending previous modeling approaches, the remain-
Figure S9). The probabilities per shell were obtained by di-
ing parts of the A. thaliana genome were assigned to two
viding the number of particles by the volume of each shell.
other genomic categories that we used as complementary
For each parameter set, histograms were computed for each
to the epigenomic states. The nucleolar organizing regions
of the replicates. The means and standard errors computed
(NORs), that are the constitutive sequences of the nucleo-
over the replicates are reported as bar plots and error bars
lus (41,49,50), account for 6% of the genome and are lo-
respectively (Figure 4F–J and; Figure 5G–L; Figure 6G–
calized in the small arms of chromosomes 2 (NOR2) and 4
I; Supplementary Figure S9; and Supplementary Figures
(NOR4). The telomeres, that account for about 1% of the
S10–S17, panels A–E). To compare the radial distributions
genome, are the ∼150 kb regions at the ends of each chro-
of two parameter sets, Wilcoxon tests were performed to
mosome (Figure 1C, Supplementary Figure S1, and Sup-
compare each paired (corresponding replicates) distribu-
plementary Table S1). To account for the high concentra-
tion without assuming any specific shape for the two distri-
tions of RNA and proteins within the nucleolus (41,49,50)
butions under comparison. The null hypothesis is that the
and for the typically increased stiffness of the telomeres (76),
mean heights over the replicates give zero difference and the
NORs and telomeric 3 kb-regions were modelled as thicker
alternative is that the difference of the means is either higher
beads (Figure 1A) of diameter 132 nm allowing to mimic
or lower than zero (two-sided statistical test). A very strin-
the formation of a spherical nucleolus of radius about 1.4
gent threshold for significance (P-value < 0.0001) was cho-
m as typically observed in A. thaliana nuclei (50,77) (Sup-
sen to single out only the most relevant differences in bins
plementary Methods). Excluding the NORs, the more ex-
occupancies.
tended epigenomic domains of ∼400 kb were assigned to
constitutive heterochromatin (CH) (Figure 1B) and, con-
Number of distinct chromocentric regions. Each chromo- sistently with previous analysis (78,79), were localized at
center was considered as a sphere (radius = the radius the chromocenter (centromeric and pericentromeric region)
of gyration of the constitutive particles; centre = their of each chromosome (Figure 1C and Supplementary Fig-
centre of mass) (Figure 4L). The overlap between two ure S1A–E). In our analysis, chromocenters are interspersed
spheres was computed using the formula in Weisstein, with short sequences hosting active chromatin (maximum
Eric W. ‘Sphere-Sphere Intersection.’ From MathWorld– size 54 kb) and facultative heterochromatin (maximum size
A Wolfram Web Resource. http://mathworld.wolfram.com/ 18 kb), which is consistent with the presence of ‘punctual’
Sphere-SphereIntersection.html. The average number of active genes like the 5S rRNA gene clusters in the peri-
distinct chromocenters was computed varying the over- centromeres of chromosomes 4 and 5 (80). Overall, the ge-
lap volume threshold between 0.0 and 1.0 every 0.01. The nomic regions occupied by active chromatin and facultative
threshold of 0.34 corresponded to an average of 8.6 distinct heterochromatin were organized into many interspersed do-
chromocenters, which was the closest to the experimental mains of shorter lengths (maximum 93 kb for AC and 84 kb
measure of 8.6 ± 0.2 chromocenters (46). for FH, and median 6 kb for AC and 3 kb for FH).
Nucleic Acids Research, 2021 5
Epigenomic state
Active Constitutive heterochromatin Facultative heterochromatin NORs and TELs Undetermined
A B C
Occupied fraction of 30kb regions
30nm ~ 3kb
1
1000
0
Domain length (kb)
1
0
1
100
Downloaded from https://academic.oup.com/nar/advance-article/doi/10.1093/nar/gkaa1275/6097670 by guest on 21 February 2021
0
1
0
132nm ~ 3kb
10
1
Attraction
0
0 5 10 15 20
Repulsion Number of domains Genomic position (Mb)
7040 1315 3295 10 3880 Chromosome 4
Figure 1. Epigenomics-driven co-polymer models of A. thaliana chromosomes. (A) Scheme of the polymer model. Chromosomes are modelled as self-
avoiding bead-spring chains where each monomer represents a 3 kb-portion of chromatin and is characterized by its epigenomic state: active (red), consti-
tutive heterochromatin (green), facultative heterochromatin (blue), NORs and telomeres (grey), and undetermined (black). Attractive or repulsive short-
range interactions account for epigenomics-driven relationships between beads. (B) Distributions of the genomic length spanned by individual epigenomic
domains (bottom: total number of domains per state). Each violin plot shows the density of the points smoothed with a Gaussian kernel with the standard
parameters of R geom violin function (129). (C) Profiles of each chromatin state along chromosome 4. Each profile is binned at 30 kb and the height of the
bars indicates the fraction of the 30 kb-bin occupied by 3 kb-regions of the corresponding chromatin state.
Single-chromosome analysis allows parameterizing the ate a phase from which some proteins may be excluded
epigenomics-driven interactions (81,82). Overall, the collected evidence is yet not conclu-
sive on whether the in vivo formation of HP1 phases is
To find the optimal epigenomics-driven model, we designed
mainly driven by attraction between HP1 or by repulsion of
a strategy to minimize the amount of calculations needed
HP1 with other chromatin states or with other chromatin-
and yet get a good understanding of how the different pa-
binding proteins. LLPS, in general terms, can be triggered
rameters affect the final compliance with the experiments.
via both self-attraction of a compound (in this case HP1) or
We focussed initially on the folding of chromosome 4 as
via a repulsive interaction of a compound with the others
it is the shortest in A. thaliana (Supplementary Table S1)
present in the system, as it occurs for hydrophobic phases
and neglected for simplicity the nucleolar organizing region
(85). On top of the CH-driven interactions, we tested sep-
(NOR4). We simulated a toy-model with five copies of chro-
arately the self-attraction of the active-chromatin (AC) re-
mosome 4 with random initial placements and orientations
gions (Figure 2D and Supplementary Figures S2–S4) and of
in a cubic box with periodic boundary conditions at the typ-
the facultative heterochromatin (FH) beads (Figure 2E and
ical DNA density ( = 0.004 bp/nm3 ) of the A. thaliana
Supplementary Figures S2–S4). The latter interactions are
nuclear environment. In the initial conformation, the five
based on the observations that the binding of RNA PolII to
model chromosomes were prepared as linear rod-like ob-
active genes can prime micro-phase separation (86,87) and
jects to mimic elongated mitotic states (29) (Material and
polycomb-mediated interactions can form local domains
Methods).
hosting H3K27me3-enriched gene-clusters (56,88,89).
As illustrated in Figures 2A–E, we tested different types
In total, we tested 50 distinct scenarios with strengths of
of short-range interactions involving the epigenomic chro-
interaction ranging from 10−6 to 1.00 kB T for repulsions
matin regions defined above: self-attraction (full circles) and
and 0.025–1.00 kB T for attractions (Supplementary Figures
repulsion (dashed lines). Unless specified, the model beads
S2–S4). One kB T typically represents an energy of the or-
interact with an excluded volume potential that allows the
der of the thermal noise. The selected values of interaction
fibre to maintain a thickness of 30 nm and to avoid chain
strength allowed sampling distinct scenarios in which each
crossing (Supplementary Methods). Specifically, we started
of the imposed interactions varied between a small fraction
exploring three distinct scenarios for the interactions in-
to the same order (1.00 kB T) of the thermal noise. For each
volving the constitutive heterochromatin (CH) regions (Fig-
of the 50 distinct scenarios, we simulated 10 independent
ure 2): repulsions between CH beads and the other epige-
trajectories of a few hours (30,62) using Langevin dynam-
nomic states (Figure 2A), self-attraction between CH beads
ics (Material and Methods) and obtained an ensemble of
(Figure 2B), and a combination of the two (Figure 2C).
∼400 conformations per parameter set (Figures 2F–J for il-
These cases aimed to describe interactions driven by het-
lustrative snapshots at the end of the simulations).
erochromatin protein 1 (HP1) both in vitro and in vivo. Re-
To select the optimal interaction model, we computed
cent papers showed that HP1 (or its counterparts in plants
predicted contact maps at 30 kbp resolution (Figures 2K–
LHP1 and ADCP1) can promote liquid-liquid phase sepa-
O and Materials and Methods) on the generated 3D mod-
ration (LLPS) mediated by intrinsically disordered regions
els and compared them with the experimental Hi-C maps
(IDR) in vitro (81,82), can favour the formation of hete-
(44,45). The comparisons included the Spearman correla-
rochromatin compartments in vivo (81,83,84), and gener-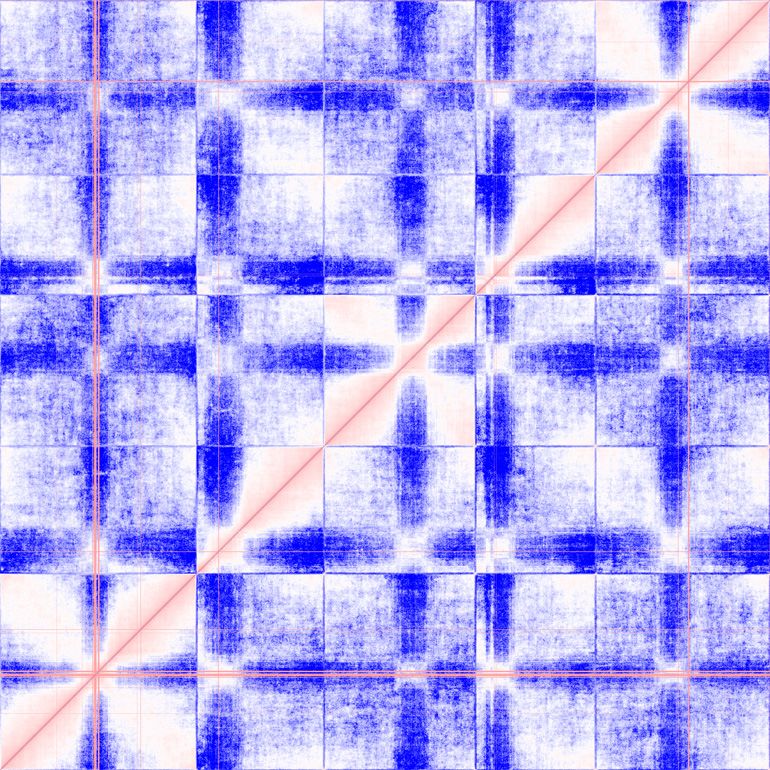
6 Nucleic Acids Research, 2021

                                                                              Epigenomic state
              Active chromatin                          Constitutive heterochromatin           Facultative heterochromatin                   Undetermined
                               A                       B                      C                            D                            E

          Attraction
         Repulsion

         F                                        G                      H                           I                            J

                                                                                                                                                                                    Downloaded from https://academic.oup.com/nar/advance-article/doi/10.1093/nar/gkaa1275/6097670 by guest on 21 February 2021
             1 m

         K                    Prediction          L Prediction          M Prediction                 N Prediction                 O Prediction
                                                                                                                                                      4.0

                                                                                                                                                             Log10 (norm. values)
                  30kb bins

                                                                                                                                                      2.0

                                                                                                                                                      0.0

                                                                                                                                                      -2.0

                                                                                                                                                      -4.0
                                     Experiment            Experiment             Experiment                   Experiment                Experiment
         P           5.0                          Q                     R                         S 1.3                       T
                                                                                                                              1.2
                                                                                                     1.2
             CS

                     2.5
                                                                                                                              1.1
                                                                                                     1.1
                     1.0                                                                                                      1.0
                                                                                                     1.0
         ATTR(kBT)                                    0.20 0.30 0.40         0.05 0.20 0.30                0.10 0.20   0.40           0.50   1.00
      REPU(10-4 kBT)          1.95    3.90 7.81                              3.90 0.10 3.90
             SCC 0.82 0.82 0.81                       0.72 0.76 0.77         0.82 0.79 0.82                0.82 0.83 0.84             0.83   0.82

Figure 2. Parameterization of epigenomics-based interactions. (A–E) Networks representing the investigated sets of epigenomics-driven interactions. A
link between two nodes represents a specific interaction. Other combinations are presented in Supplementary Figures S2–S4. (F–J) Illustrative snapshots
of conformations obtained for each interaction network in the case of optimal consistency with the experiments (see panels P–T). Particles’ colours reflect
their epigenomic state. These and other graphical representations of model chromosomes were rendered with the VMD graphical package (130). (K–O)
Predicted contact maps for the five simulated interactions sets (top left triangles) are shown together with the cis-chromosome 4 Hi-C maps (bottom right
triangles). (P–T) The compartment strength (CS) and the Spearman correlation (SCC) analysis between the experimental and predicted contact maps
(Materials and Methods) are presented for a selection of parameters’ sets. Each Hi-C CS distribution is represented in the background of the plot with a
colored band which spans the range of values from the first to the third quartiles. Boxes highlight the optimal cases.

tion coefficient (SCC) (90,91), which captures the overall                                 As expected, as the strengths of epigenomic interaction
similarity between model and experiment, and the compart-                               are increased, the CS augments (Figures 2P–T and Supple-
ment strength (CS) (71) for each epigenomic state (CH, AC,                              mentary Figures S2–S4). Interestingly, we found that opti-
and FH), that quantifies the degree of compartmentaliza-                                mal parameters for CS are also close to optimal for SCC,
tion of a given state by measuring the contact enrichment                               with weak or intermediate values for interaction strengths.
within versus between chromatin domains (Figures 2P–T,                                  For example, in the simulations where the optimal CH self-
Supplementary Figures S2–S4, and Materials and Meth-                                    attraction (ECH = 0.30 kB T) is combined with increasing
ods).                                                                                   AC self-attraction (Supplementary Figures S3 and S5), we
   The obtained SCC values were larger than 0.70 for all                                observed that the intra-arm contact pattern of chromosome
the tested interaction models (Figures 2P–T and Supple-                                 4, that was made of strips (∼100 kb thick), was well cap-
mentary Figures S2–S4) indicating that the explored mod-                                tured only for mild interaction strength. As the AC inter-
els allow capturing the overall arrangement of chromo-                                  action strength was increased, the separation between en-
some 4. These high correlations are mainly due to the                                   riched and depleted strips became sharper with the effect of
formation of a segregated domain (Figures 2K–O) at the                                  degrading the similarity of the CS with the Hi-C map.
chromocenter, that, in the models, is favoured by the CH-                                  The highest SCC value of 0.83 and the optimal similarity
driven interactions. In fact, the addition of self-attraction                           with the Hi-C compartment strength values were obtained
within AC or FH improves marginally the SCC only by                                     for the CH-repulsive scenario (ECH-* ∼ 0.0004 kB T) to-
1%. The difference between CH-scenarios (Figures 2P–R)                                  gether with self-attraction within active chromatin and fac-
is also weak (at most 0.05) with the CH repulsion scenario                              ultative heterochromatin (EAC–AC = 0.20 kB T and EFH-FH
overall leading to higher similarity between models and                                 = 0.50 kB T) regions (Figures 2S–T). Hence, this set of in-
experiments.                                                                            teractions was used to generate genome-wide models.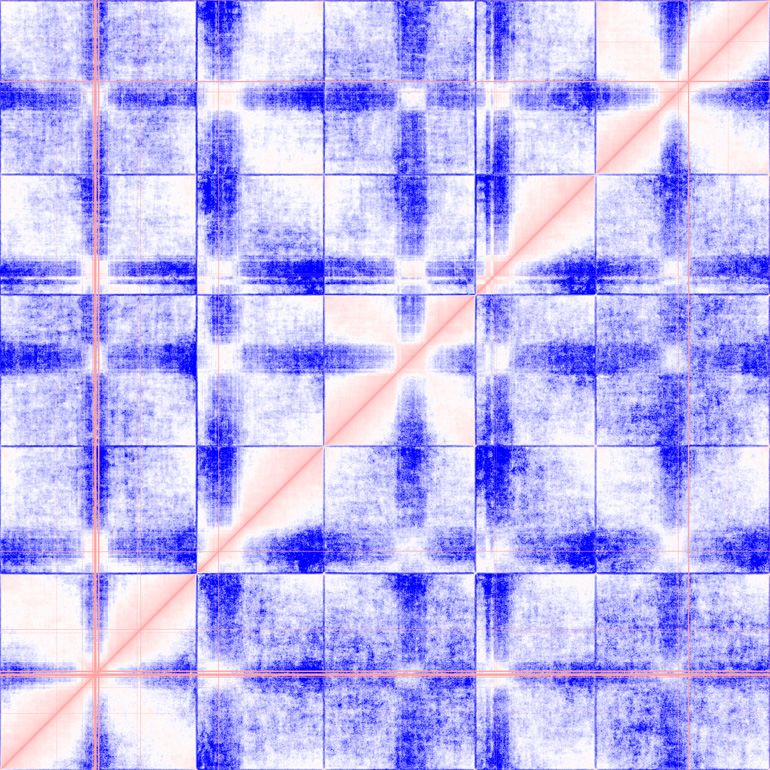
Nucleic Acids Research, 2021 7
A Active Constitutive Facultative
All interactions NORs and TELs Undetermined
chromatin heterochromatin heterochromatin
Attraction
Repulsion
B C D Prediction E F
4.0
1.0
Linear shape
101
.82 .81 .76
Downloaded from https://academic.oup.com/nar/advance-article/doi/10.1093/nar/gkaa1275/6097670 by guest on 21 February 2021
2.0 ~ s-0.84 .75 .73
10-1
0.5
0.0 .44
.22
10-3
-2.0
105 106 107
1µm -4.0
0
Experiment
Norm. contact frequency
G H I Prediction J K
Log10 (norm. values)
4.0
Spearman correlation
1.0
parallel pulling
.87 .87 .88
101
V-shape from
2.0 .72 .77 .74
~ s-0.84
10-1
0.0 .49
0.5
-2.0
Prediction
Experiment
10-3
105 106 107
-4.0
1µm
0
Experiment
L M N Prediction O P
4.0
radial pulling
V-shape from
101
1.0
.85 .85
2.0 .77 .78
~ s-0.84 .69 .73
10-1
0.0
.49
0.5
-2.0
10-3
1µm 105 106 107
-4.0
Experiment Genomic distance (bp)
0
Chr1 Chr2 Chr3 Chr4 Chr5
Ge
Ch me
Ch
Ch
Ch
Ch
P(s
no
r1
r2
r3
r4
r5
)
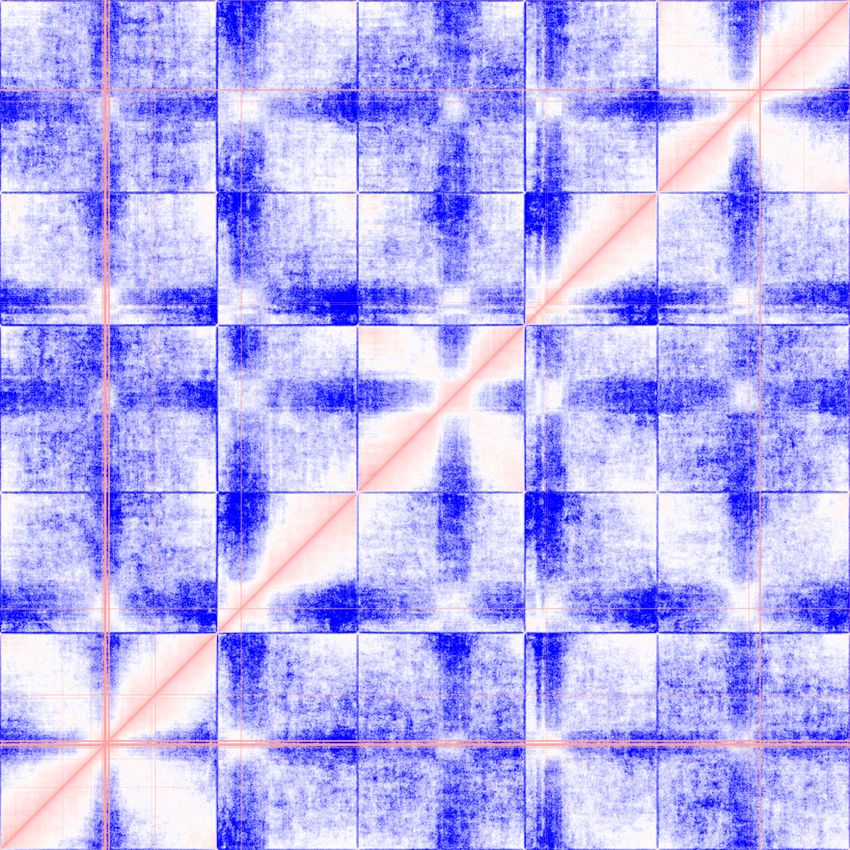
Figure 3. Genome-wide simulations: exploring the optimal epigenomics-based interactions and the effects of initial conformation. (A) Network of physical
interactions used in the genome-wide simulations. In the red rectangle, the network is decomposed to highlight the interactions of each chromatin state.
(B–P) Results of the genome-wide simulations for three alternative initial conformations: linear (B–F), V-shape from parallel pulling (G–K), and V-shape
from radial pulling (L–P). (B, G, L) Examples of initial (for a copy of chromosome 1) and (C, H, M) final (for all chromosomes) conformations. (D, I,
N) Predicted genome-wide contact maps (top left triangles) together with the corresponding experimental Hi-C map (bottom right triangles). In panel
D, the main features of the genome-wide contact maps are highlighted with overlying boxes: in black the cis-chromosome contacts accumulation, which
is a signature of the presence of chromosome territories, and in brown the contacts between chromocenters. (E, J, O) Average cis-chromosome contact
probability (P) versus genomic distance (s) is computed from simulations (black curve) and from Hi-C (red curve). The power-low decay fitted on the Hi-C
contact probability between 1 and 10 Mb is indicated with a dashed line. (F, K, P) Spearman correlation coefficients (SCC) computed to compare the
models and the Hi-C data from genome-wide maps (magenta), cis-chromosome matrices (black), and P(s) (orange). The red box highlights the optimal
case.
Genome-wide models reveal an overall preferential V-shape ulations (Figure 3A). To characterize the contact patterns
for A. thaliana chromosomes of the obtained models (representative snapshot in Figure
3C), we computed the genome-wide contact map (Figure
To generate genome-wide models, we prepared each of
3D) and the average probability of contact P as a func-
the 10 model chromosomes (chromosomes 1 to 5 in two
tion of the genomic distance s between genomic regions
copies each, Supplementary Table S1) as rod-like objects
on a set of ∼2000 conformations and compared them with
made of stacked rosettes along the main axis (29,62), each
the genome-wide interaction map and the P(s) obtained
mimicking a simplified shape of elongated mitotic chromo-
from Hi-C experiments (44,45) (Figure 3E and Material and
somes (Supplementary Videos S2 and Supplementary Fig-
Methods).
ure S6A). The positions and orientations of each chromo-
From the models, we recovered the contact patterns of
some were chosen randomly inside a sphere of diameter 5.0
the Hi-C at the genome-wide scale. Cis-chromosome areas
micrometres (m), that is the typical A. thaliana nuclear size
of the contact map (see black dashed squares in Figure 3D)
(77).
had much more contacts than the trans-chromosome ones.
From 50 independent replicates of these initial chromo-
This feature indicates that the models well captured the or-
some conformations (Figure 3B), we simulated a few hours
ganization of the nucleus into distinct chromosome territo-
of the full genome dynamics (62) applying the optimal set
ries (41–44). The epigenomics-driven models also recapit-
of parameters inferred from the single-chromosomes sim-
ulated the contact enrichment between chromocenters of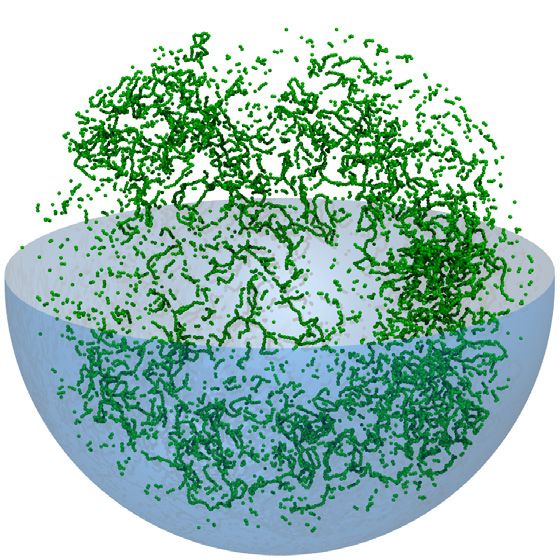
8 Nucleic Acids Research, 2021

different chromosomes (see brown squares in Figure 3D)            computing the genome-wide contact map and the P(s) (Fig-
indicating that the effective repulsions between CH and the       ures 3I and J). Applying the SCC analysis to compare with
other chromatin states recover both the segregation of chro-      Hi-C, we observed that preconditioning the chromosomes
mocenters at the cis-chromosome scale and the effective           in V-shaped conformations allowed capturing qualitatively
trans-chromosome attraction between chromocenters (41–            and quantitatively the behaviour of the P(s), whose model
46,52). To quantify the similarities of the models with ex-       versus Hi-C SCC increased dramatically from 0.22 to 0.88
periments, we computed the CS for each epigenomic state           (Figures 3J and K). The comparison of the contact maps
and the SCC between the genome-wide maps, the 5 cis-              (Figure 3K) were slightly improved (between 4 and 6% in
chromosome maps (Figure 3F) in Hi-C and in our predic-            SCC) for the genome-wide and the cis-chromosome cases of

                                                                                                                                  Downloaded from https://academic.oup.com/nar/advance-article/doi/10.1093/nar/gkaa1275/6097670 by guest on 21 February 2021
tions. The comparisons between contact maps resulted in           the acrocentric chromosomes 2 and 4, and the metacentric
similar CS distributions (Supplementary Figure S8A) and           chromosome 3. SCC of the other metacentric chromosomes
significant SCC values. We found that the minimal SCC of          (chromosomes 1 and 5) were only marginally degraded (3
0.44 was obtained for the genome-wide contact maps, where         and 2% in SCC respectively). The distributions of compart-
the size of the compared samples is ∼7 000 000, and that          ment strength (Supplementary Figure S8) were shifted to-
in the per-chromosome comparisons the SCCs were always            wards larger values in the V-shaped chromosomes, but yet
larger than 0.70 (sample-size > 180,000).                         they were largely consistent with the Hi-C ones. The over-
   Interestingly, we found a discrepancy between the experi-      all improvement of the results with V-shaped chromosomes
mental and the predicted contact probabilities P(s) (Figure       prompted us to use this chromosome shape for the rest of
3E). The experimental P(s) exhibits two regimes: at short         the genome-wide simulations.
and intermediate genomic distances (100 kb < s < 10 Mb)              Interestingly, we also tested the possible formation of V-
P(s) decays as s−0.84 , which is very well captured by the mod-   shaped chromosomes from a radial chromosome pulling
els. But, at larger genomic distances (s > 10 Mbp), corre-        which is less biologically-founded (Figures 3L–P, Supple-
sponding to the typical range of inter-arm contacts, the ob-      mentary Video S4, Supplementary Figure S6C, and Materi-
served increase of P(s) in Hi-C is missing in our prediction.     als and Methods). We found overall lower correlations with
Confirming the visual impression, we found a weak SCC             the Hi-C (Figure 3P). In particular, the SCC of the P(s)
value ( = 0.22 for sample-size = 1,014) when comparing the        dropped from 0.88 for the parallel pulling case to 0.78 for
predicted and observed P(s) (Figure 3F).                          the radial one.
   To account for the inter-arm increase of contacts in the
Hi-C maps, we designed a novel strategy to precondition
                                                                  The epigenomics-driven models capture the nuclear organiza-
the chromosome models as V-shaped arrangements (Figure
                                                                  tion in A. thaliana
3G). The preconditioning attempted to incorporate an ef-
fective memory of chromosome structure throughout the             To further characterise the models obtained from the op-
cell cycle, which was suggested by Carl Rabl already in           timal set of parameters, we looked at the preferential nu-
1885 (92) based on microscopy observations of dividing            clear location of the regions assigned to each epigenomic
cells in salamanders. Additional elements in favour of a          state (Figures 4A–E) and computed the distribution of
persistent V-shape organization of interphase chromosomes         their radial positions (Figures 4F–J, Supplementary Figure
were provided by modelling studies in several species, in-        S9, and Material and Methods). To disentangle which of
cluding yeast (93–96), drosophila (97), and human (98). In        the typical nuclear positioning was to attribute to the spe-
A. thaliana, during anaphase chromosomes are pulled, cen-         cific epigenomics-based interactions, we designed and per-
tromeres first, towards opposite poles of the mother cell         formed a reference set of simulations in which the initial V-
(52,99). This results in a V-shape organization for metacen-      shaped chromosome positioning and the NORs and telom-
tric chromosomes 1, 3 and 5 and in hook-like structures for       eres attractions were maintained, but the other interactions
acrocentric chromosomes 2 and 4. Assuming that chromo-            were removed (see networks in Supplementary Figures S7
somes exhibit inherent properties of long-polymers in dense       and S8B). The results of this variant system are shown in
or semi-dilute solutions (31,32,100), we hypothesize that         the histograms in Figures 4F–J in white colour as a term
chromosomes will maintain an effective memory of these            of comparison with the optimal interaction model whose
V-like shapes during interphase.                                  results are shown in the characteristic colour of the epige-
   Accordingly, we initially arranged each chromosome             nomic state.
in a linear (rod-like) shape (Supplementary Figure S6A)              Interestingly, we found that the nucleolus typically as-
and then pulled it by the kinetochore (centromere) with           sumed a round shape with a radius ∼1250 nm and occu-
harmonic forces along parallel directions (Supplementary          pied the centre of the model nucleus (Figures 4A and F).
Video S3 and Supplementary Figure S6B). To allow for the          The telomeres tended to localize at the nucleolar periph-
dragging of the entire chromosome structure, during the           ery (Figures 4B and G). These features were consistent with
pulling process we pinned the chromosomes in a looped             the reference model in which NORs and telomeres were in-
conformation using harmonic bonds bridging regions at a           volved in the same interactions. Notably, the constitutive
typical separation of ∼40 kb (14 model beads) (Supplemen-         heterochromatin (CH) domains typically occupied the out-
tary Methods).                                                    ermost shell of the nucleus in the optimal model but not
   We simulated 50 replicates of the system with V-shaped         in the reference one (Figures 4C and H), in which the CH
chromosomes using the optimal epigenomics-driven in-              repulsions were removed. The active-chromatin tended to
teractions and characterized quantitatively the obtained          a slightly less peripheral positioning than in the reference
conformations (representative snapshots in Figures 3G–H)          interaction model (Figures 4D and I). Overall, these results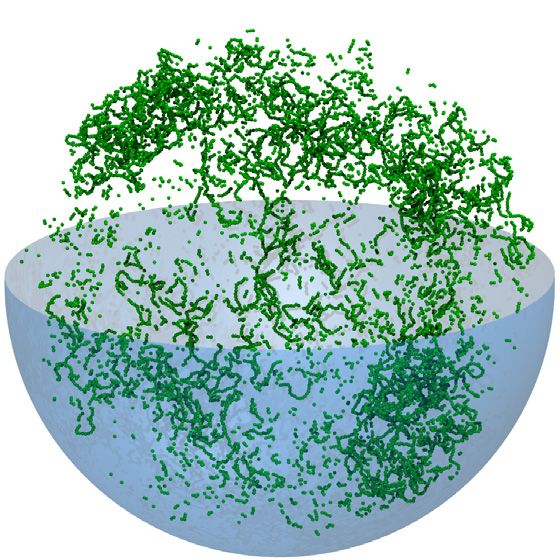
Nucleic Acids Research, 2021 9

                                                                                                                                                                   Downloaded from https://academic.oup.com/nar/advance-article/doi/10.1093/nar/gkaa1275/6097670 by guest on 21 February 2021
Figure 4. Nuclear positioning of the epigenomic states. (A–E) Representative snapshots of the nuclear localization of 3 kb-beads for each epigenomic
state. (F–J) Probability to find a bead in concentric shells (thickness 250 nm) of the nucleus for each epigenomic state for the optimal interaction model
(Figure 3A) (coloured bars). White bars illustrate the results of a null model (Supplementary Figure S7B) where all but NORs and telomeres interactions
are switched off. The significantly enriched/depleted shells with respect to the null model (two-sided Wilcoxon statistical test with P-value < 0.0001) are
marked with asterisks. Similar conclusions can be derived by varying the thickness of the shells to 125 or 500 nm (Supplementary Figure S9). (K) Predicted
number of contacts within 200 nm with NORs particles along the different chromosomes. The top 10% of the contacting regions are highlighted in red.
(L) Each group of centromeric beads per chromosome is represented by a sphere (radius = the radius of gyration of the constitutive particles; centre =
their centre of mass). Spheres with a volume overlap larger than 34% the volume of the smaller sphere are part of the same focus. (M) Number of distinct
centromeric foci per simulated conformation (dark green bars) and per experimental single cell (46) (light green bars). Error bars were computed as the
square root of the average value under the hypothesis of a Poissonian distribution. For each bin, we tested if the predicted average frequency is similar to the
observed experimental counts (null hypothesis) by computing the P-value of the predictions assuming Poisson distribution for experiments. All P-values
were higher than 0.02 making impossible to reject the null hypothesis.

are consistent with experimental evidence on the typical po-                       ment with the experiments (50), we found that the top 10%
sitioning of the nucleolus at the nuclear centre (41,49,50),                       regions making contacts with the NORs particles are the
of telomeres at the nucleolar periphery (42–46), and of het-                       telomeric regions of each chromosome and the short arms
erochromatic regions at the nuclear periphery (46,52).                             of chromosomes 2 and 4 (Figure 4K). As a consequence,
   Next, we tested whether the preferential locations of the                       also the chromocenters of chromosomes 2 and 4 are in-
nucleolus and heterochromatin are also consistent with the                         volved in many contacts with the nucleolus and are typically
fact that the telomeres, and chromocenters of chromosomes                          found in a perinucleolar location in agreement with the ex-
2 and 4 (which host the NORs) associate with the nu-                               perimental data (46,52).
cleolus forming the so-called nucleolar-associated domains                            Next, we tested whether the typical location of the het-
(NADs) (50), which are stable landmarks of the A. thaliana                         erochromatic regions at the nuclear periphery is also con-
genome organization and are maintained under heat stress                           sistent with the experimental evidence that groups of chro-
conditions (101). In A. thaliana, NADs correspond to repet-                        mocenters coalesce together in 8.6 ± 0.2 distinct foci (46).
itive elements that are transcriptionally silenced by repres-                      Specifically, in each snapshot of the trajectories, we consid-
sive histone modifications and DNA methylation. To iden-                           ered the regions composing each of the 10 centromeres (as a
tify the predicted NADs in the nuclear models, we com-                             proxy of the chromocenters, Supplementary Table S1) and
puted per each 3 kb-region (one bead) in the models the                            associated to each of them a sphere centred at the centre of
number of contacts with the NORs particles within a dis-                           mass of the beads with a radius equal to their radius of gy-
tance cutoff of 200 nm (Materials and Methods). In agree-                          ration (Figure 4L). Per each chromocenters pair, we com-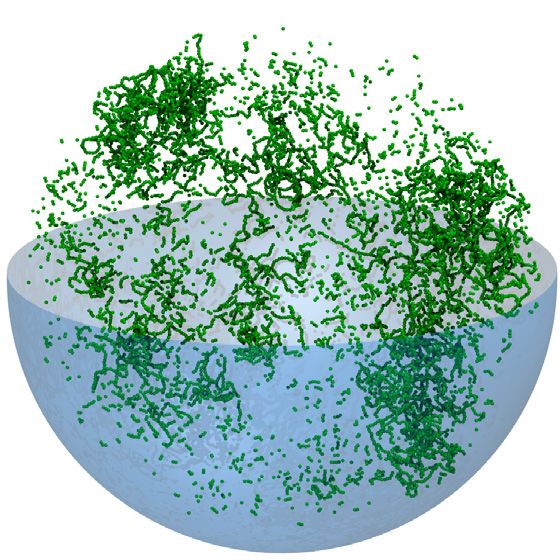
10 Nucleic Acids Research, 2021
puted the overlap volume between the two representative tions also affected the nuclear positioning of the constitu-
spheres. To compare with experiments (46), we selected the tive heterochromatin, active chromatin and facultative het-
threshold of the significant overlap to 0.34 so that the aver- erochromatin, that are found in more central nuclear posi-
age number of distinct chromocenters in the model nuclei tions despite the maintenance of the epigenomics-driven in-
over the 50 replicates simulations is 8.6 that matches the av- teractions (Figure 5J and Supplementary Figure S12C–E).
erage number measured experimentally (8.6 ± 0.2). Over- Varying the size of the self-attracting NORs particles had
all, the distribution computed from the models is slightly also large impacts on the nuclear positionings of all the
skewed towards larger numbers of foci than the experimen- chromatin states. Small NORs beads induced the forma-
tal one (Figure 4M). Yet, the corresponding distribution of tion of a smaller nucleolus of radius about 1 m (Figures
Downloaded from https://academic.oup.com/nar/advance-article/doi/10.1093/nar/gkaa1275/6097670 by guest on 21 February 2021
chromocenters’ numbers resembles the experiments with all 5E and 5H) and allowed all the other chromatin states to
the predicted values per bin showing no significant differ- occupy more central nuclear positions (Supplementary Fig-
ences with the experimental measures. The differences with ures S13C–E). In particular, the constitutive heterochro-
the prediction might be also due to an underestimation of matin (which maintained its repulsive interactions) lost its
the linear size of the centromeric regions in the A. thaliana preferential peripheral positioning (Figure 5K) indicating
reference genome, which was used to define the length of the that, in our prediction, the nucleolar push is necessary to
model chromosomes (102). Larger centromeric sequences recapitulate the expected CH positioning at the nuclear pe-
would likely favour co-localisation in the models and skew riphery. This is confirmed by the simulations performed
the predicted distribution in Figure 4M closer to experimen- with larger NORs beads that lead to a nucleolus that oc-
tal data. cupies almost the entire nucleus (Figures 5F and I) and that
pushes all the chromatin states towards the nuclear periph-
ery with an enhanced effect for CH (Figure 5L and Supple-
NORs and heterochromatin interactions shape the nuclear or-
mentary Figures S14C–E).
ganization in A. thaliana
Interestingly, the large changes in nuclear positioning in-
To test the role of each epigenomics-based interaction, we duced by each of the NORs’ variant systems had a marginal
generated models for eight variant cases in which we modi- effect on the respective contact patterns. The corresponding
fied the interactions involving one chromatin state at a time. genome-wide contact maps, that did not include the NORs
Specifically, we perturbed the optimal interaction model regions for consistency with the Hi-C interaction maps, ap-
(Figure 3A) by removing the self-attraction among NORs peared to be visually very similar to the one obtained for
and telomeric regions (Figure 5A and Supplementary Fig- the optimal interaction model (Figures 5M–O) and quan-
ure S12), removing the repulsions between CH beads and titatively correlated equally well with the Hi-C interaction
the other epigenomic states (Figure 6A and Supplementary maps (Supplementary Figures S7C–E).
Figure S15), removing the self-attraction between AC re- The removal of the repulsive interactions between CH
gions (Supplementary Figure S10), and removing the self- beads and the other epigenomic states (Figure 6A) had the
attraction between FH beads (Supplementary Figure S11). effect to push the heterochromatic regions towards the nu-
To further test the role of the nucleolus and of the con- clear centre so that CH beads are less probably found in
stitutive heterochromatin, we varied the size of the NORs the outermost nuclear shell than in the optimal interaction
particles (Figure 5B–C and Supplementary Figures S13– model (Figures 6D and G). Notably, the CH neutrality also
S14), and tested the alternative CH interactions schemes of marginally affected the nuclear location of the other epige-
Figures 2B and C, where the constitutive heterochromatin nomic (AC and FH) states by pushing them slightly towards
was self-attractive and self-attractive+repulsive respectively the nuclear centre (Supplementary Figures S15D–E). Inter-
(Supplementary Figures S15 and S16). estingly, the main reverberation of the CH perturbation ap-
Each of the variants was compared to the optimal model pears in the genome-wide contact map. Specifically, the sig-
by considering the radial distributions of chromatin states natures of the segregation of the centromeric regions are vi-
and by performing a SCC analysis on the genome-wide con- sually lost, and the trans-chromosome sections of the map
tact maps. are different from the correspondent parts in the optimal in-
We found that removing only the self-attraction of the teraction case (Figure 6J). Quantitatively, the similarity of
NORs and the telomeric beads and maintaining the other the model and the Hi-C contacts map were degraded with
epigenomic-driven interactions caused dramatic nuclear re- respect to the optimal model both in terms of the Spearman
arrangements involving all the chromosomes. As expected, correlation (SCC = 0.43 vs SCC = 0.49 for the optimal),
the compact nucleolus was disrupted (Figure 5D, represen- and the CS distribution that was only marginally matching
tative snapshot) and the NORs regions were spread over the the Hi-C (Supplementary Figures S7F and 8F). Although
entire nucleus, resulting in an enrichment of NORs beads the average contact probability as a function of the genomic
at the nuclear periphery and a depletion at the centre with separation, P(s), is captured accurately (SCC = 0.93) (Sup-
respect to the optimal interaction model (Figure 5G). Inter- plementary Figure S7F).
estingly, these findings are qualitatively consistent with the The two variant simulations in which the constitutive het-
imaging data in human Dnmt1-deficient cells where the nu- erochromatin (CH) was involved in purely self-attractive
cleolus is disrupted and the nucleolar rRNA genes are scat- (Figure 6E) and in combined self-attractive and repulsive
tered throughout the nucleus (103). The telomeres expect- (Figure 6F) interactions also showed significant differences
edly lost their preferential perinucleolar positioning and re- with the optimal model case. Neither of the two scenar-
localized in more peripheral shells of the nucleus (Supple- ios leaded to a significant peripheral localization of CH as
mentary Figure 12B). The perturbation of NORs interac- the optimal case (Figures 6H and I) demonstrating that, al-Nucleic Acids Research, 2021 11
Downloaded from https://academic.oup.com/nar/advance-article/doi/10.1093/nar/gkaa1275/6097670 by guest on 21 February 2021
Figure 5. NORs shape the A. thaliana nuclear organization. (A–C) Perturbed interaction networks. The interactions that are removed from the optimal
case are crossed in magenta. The cartoons of the polymers illustrate the variation in size of the NORs beads. (D–F) Illustrative snapshots for NOR beads in
each of the perturbed systems shown in panels A–C. (G–L) Distributions of the radial positions of the 3kbp-regions in the perturbed systems (dark colour)
compared to the optimal interaction model (light colour) for the NORs (G–I) and the CH (J–L) (epi)genomic states. Significant differences (two-sided
Wilcoxon test P-value < 0.0001) are marked with asterisks. (M–O) Genome-wide contact maps for the perturbed cases (top left triangles) vs maps obtained
from the optimal interaction model (bottom right triangles). Complementary results on the simulations presented here are shown in Supplementary Figures
S12–S14.You can also read