Scholarship @ Claremont - Claremont Colleges
←
→
Page content transcription
If your browser does not render page correctly, please read the page content below

Claremont Colleges
Scholarship @ Claremont

CMC Senior Theses                                                                   CMC Student Scholarship

2020

Industrial Policy for Regional Development in Lithuania
Guoda Terleckaite
Claremont McKenna College

Follow this and additional works at: https://scholarship.claremont.edu/cmc_theses

   Part of the Eastern European Studies Commons, Economic Policy Commons, International Relations
Commons, and the Soviet and Post-Soviet Studies Commons

Recommended Citation
Terleckaite, Guoda, "Industrial Policy for Regional Development in Lithuania" (2020). CMC Senior Theses.
2484.
https://scholarship.claremont.edu/cmc_theses/2484

This Open Access Senior Thesis is brought to you by Scholarship@Claremont. It has been accepted for inclusion in
this collection by an authorized administrator. For more information, please contact
scholarship@cuc.claremont.edu.
Claremont McKenna College

Industrial Policy for Regional Development
               in Lithuania

                Submitted to
               William Ascher

                    By
              Guoda Terleckaite

                     For
                Senior Thesis
                 Spring 2020
                May 11, 2020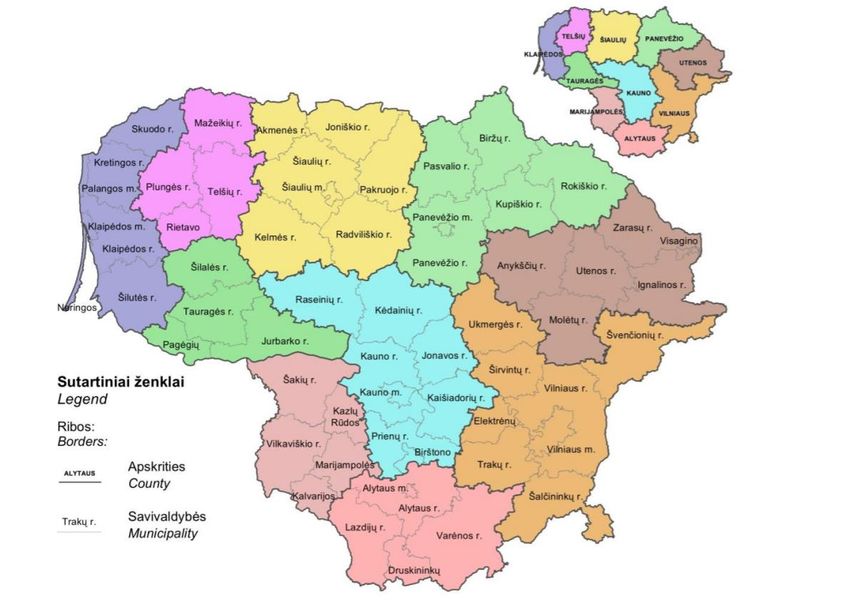
Abstract
Lithuania is internationally recognized as a high-income developed country, but the high

standard of living is limited only to a small minority of citizens. While the capital is emerging as

a financial center and a hub for information technology, cities in the Western and Central parts of

Lithuania are rapidly declining. Formerly industrial regions, Šiauliai, Panevėžys, Alytus, Utena,

Tauragė, Telšiai and Marijampolė, now suffer from massive emigration, brain drain, high

unemployment rates, and an increased risk of poverty and social exclusion among residents.

Unlike larger cities, poorer counties have not been magnets for foreign direct investment and

have benefited little from large-scale infrastructural projects. This thesis explores the weaknesses

and strengths of the declining regions and assesses the Lithuanian government’s capacity to

enact an industrial strategy to help reduce regional disparities. The analysis is also based on Dani

Rodrik’s framework for the institutional infrastructure and the design of an industrial policy. The

thesis culminates in a list of policy recommendations, considering the distinctive problems

facing the declining regions.

                                                 1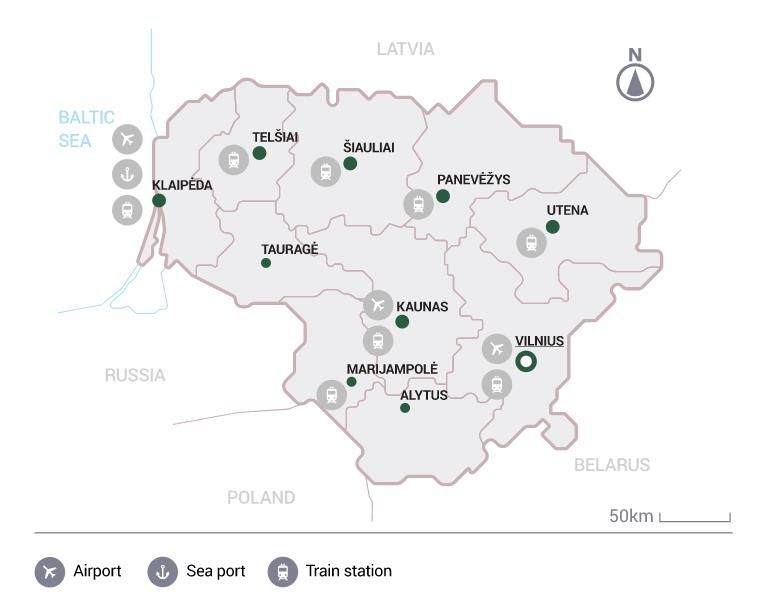
Acknowledgements
       I would like to thank Professor William Ascher, without whom this thesis would not have

been possible. Thank You for Your patience, guidance, encouragement, mentorship, and moral

support. Writing this extensive analysis has helped me to better understand my home country,

my family and myself. I hope that You enjoy reading this thesis as much as I enjoyed writing it.

       I would also like to thank Professor Minxin Pei, Professor Jennifer Taw, Professor

Aseema Sinha, Professor Mieczyslaw Boduszynski, Professor Michael D. Steinberger, and

Professor Jeffrey Flory for exceptional lectures, and for sparking my passion for international

development.

       In addition, I would like to thank Birutė Kurbanovaitė and Invest Lithuania, for helping

me understand regional problems in Lithuania and for your relentless effort to reduce regional

disparities. Your work is crucial for the successful future of the whole country.

                                                 2
Contents
Introduction ................................................................................................................................4
Regional Outlook ........................................................................................................................5
Determinants of Regional Disparities ........................................................................................ 10
Natural Resources and Regional Specializations........................................................................ 16
Soviet Industrial Policy ............................................................................................................. 18
History of Lithuania’s Industrial Strategy .................................................................................. 22
Lessons from Poland ................................................................................................................. 26
Industrial Strategy Literature ..................................................................................................... 29
Institutional Infrastructure in Lithuania ..................................................................................... 35
Industrial and Policy Strategies ................................................................................................. 47
Conclusion ................................................................................................................................ 55
Sources ..................................................................................................................................... 58
3Introduction
Over the last three decades, Lithuania followed a path of development, economic growth,
and innovation, with Vilnius at the forefront. However, most of the nation’s smaller cities and
towns have been excluded from these processes and continue to decline rapidly. Central and
Western regions of Lithuania lack social and physical infrastructure, experience high population
loss through aging and emigration, receive little EU funding and struggle to attract foreign direct
investment. The World Bank considers Lithuania a high-income country, but the reality is very
different. With soaring unemployment rate, low wages and rising at risk-poverty rate, residents
of the poorer counties are not enjoying the same standard of living as their counterparts in the
capital and larger cities.
The Lithuanian government must take serious measures to reduce regional disparities, not
only for the sake of social justice, but for the sake of the overall economy. The poor performance
of seven out of ten counties places a drag on the national economy, forcing the government to
spend on social welfare programs, instead of using those resources to create more wealth.
This thesis assesses the Lithuanian government’s capacity to enact an industrial strategy
to uplift the declining regions. Because Lithuania is deficient in this capacity, this thesis outlines
strategies to acquire it. The analysis culminates with a list of recommendations that Lithuania’s
government can implement to reduce current regional disparities.
4Regional Outlook
Counties and Municipalities of the Republic of Lithuania 1
Researching Lithuania on the Internet, it is not uncommon to encounter headlines
featuring phrases like “the hub of financial technology”, “the Baltic Tiger,” and “the heart of
Europe”. Below these headlines one can find photos of the capital’s high-rises or a birds-eye
view of its well-preserved Old Town. Judging from these descriptions, Lithuania strikes as a
1
Statistical Yearbook of Lithuania, The Lithuania Department of Statistics, (Vilnius: 2013),
http://istmat.info/files/uploads/53236/statistical_yearbook_of_lithuania_2013.pdf
5cultural center with auspicious economic prospects. Unfortunately, these characteristics are only
true for Vilnius.
Lithuania’s landmass stretches over 65,300 km, of which the capital region constitutes
only 14 percent. Similarly, Vilnius county residents account for roughly 21 percent of the whole
Lithuania’s population. Despite constituting a small part of the country, the capital is the
unequivocal economic nucleus. In 2018 the capital’s contribution to the national gross domestic
product (GDP) reached 41 percent, or more than €18 billion.2 Such an outcome may partially be
due to lower unemployment rate, which remains around 4.4 percent in the capital, compared to
7.1 percent in the rest of the country.3 Another explanation points to wage disparity, averaging
at €200 more in the capital compared to smaller counties. Lastly, Vilnius is a magnet for foreign
direct investment (FDI). In 2018 FDI inflows in Lithuania amounted to €17 million, of which
€11 million went to the capital.4 Sixty-four percent of the remaining five million euros was
shared by the second and third largest cities. Per capita FDI in 2018 amounted to €14,755 for
Vilnius residents and €2,557 to citizens in other parts of the country.5
While the capital region is developing and thriving, smaller cities and towns are
vanishing. Over the last ten years, an average of 80,000 people have left Western and Central
Lithuania annually. In 2010 the figure reached 107,570.6 Although the capital region was not
2
“GDP at Current Prices,” The Lithuanian Department of Statistics, accessed May 9, 2020
https://osp.stat.gov.lt/statistiniu-rodikliu-analize#/
3
“Unemployment Rate” The Lithuanian Department of Statistics, accessed May 9, 2020
https://osp.stat.gov.lt/statistiniu-rodikliu-analize#/
4
“Foreign Direct Investment at The End of The Period,” The Lithuanian Department of Statistics, accessed May 9,
2020 https://osp.stat.gov.lt/statistiniu-rodikliu-analize#/
5
“Foreign Direct Investment Per Capita at The End of The Period,” The Lithuanian Department of Statistics,
accessed May 9, 2020 https://osp.stat.gov.lt/statistiniu-rodikliu-analize#/
6
“Departures and Emigrants,” The Lithuanian Department of Statistics, accessed May 9, 2020
https://osp.stat.gov.lt/statistiniu-rodikliu-analize#/
6immune to emigration either, international or internal emigrants constituted only 2.8 percent of
the local population in 2019. On the other hand, emigrants in smaller counties, such as
Marijampolė, Šiauliai, Tauragė, and Telšiai, accounted for over four percent of residents in the
same year. The loss of population in the capital and other larger cities is also offset by relatively
high numbers of immigrants, compared to the other regions. Vilnius alone welcomes roughly
25,000 new immigrants every year. In Kaunas and Klaipėda, the second and third largest cities,
immigrant inflows increase the population by 20,000 and 13,000 annually. Since 2017 only
Vilnius, Kaunas, and Klaipėda have maintained positive net migration.7
Similar to emigration as a whole, internal net migration is only positive in Vilnius,
Kaunas and Klaipėda. Most other counties lose around 3,000 to 4,000 people annually to internal
migration, with Panevėžys and Šiauliai reaching around 6,401 and 8,789 in 2018, respectively.8
However, the crude departure rate was highest in Šiauliai, Tauragė, Telšiai with roughly 34
emigrants per 1000 of the population. In Tauragė, the crude net internal migration rate reached
10.4 in 2018.9
However, the most worrisome aspect about emigration is not the high figures, but the
profile of the emigrants. Residents leaving their communities are usually young, college-
educated professionals. In 2018, almost 73.6 percent of emigrants were between ages fifteen and
forty-four.10 These are precisely the people that are needed to solve the problems in the declining
7
“International and Internal Migration: Net Migration” The Lithuanian Department of Statistics, accessed May 9,
2020 https://osp.stat.gov.lt/statistiniu-rodikliu-analize#/
8
“Internal Migration: Departures,” The Lithuanian Department of Statistics, accessed May 9, 2020
https://osp.stat.gov.lt/statistiniu-rodikliu-analize#/
9
“Crude net internal migration rate,” The Lithuanian Department of Statistics, accessed May 9, 2020
https://osp.stat.gov.lt/statistiniu-rodikliu-analize#/
10
“Emigration by Age”, European Migration Network https://123.emn.lt/en/#chart-8-desc
7regions. As the youth leave their hometowns, the median age in Central and Western regions of
Lithuania has increased, averaging at 45 years, with Utena even reaching 50.11 High outflow of
emigrants and low fertility rates raise the dependency ratio and put even more of a strain on the
youth who remain in their hometowns.
Emigration in Central and Western Lithuania left the regions with a shortage of labor
force. In 2019 unemployment in Vilnius was 4.4 percent, less than the country’s average of 6.3
percent. On the other hand, unemployment in other parts of Lithuania averaged at 7.1 percent,
with Utena county recording the highest 10 percent. Youth unemployment is another problem in
smaller counties. In the capital, youth unemployment is similar to the general unemployment
level. However, in the rest of Lithuania the percentage is significantly larger. Utena, again, is the
unfortunate leader in this category, with over 30 percent of unemployment among 15-24-year-
olds in since 2016. In other poor counties, youth unemployment fluctuates between 15 and 20
percent.12
Those who are employed are only slightly better-off. On average, monthly salaries in
smaller counties reach about €700-800, while in the capital the average is over €1,000.13 Of
course, different sectors yield different compensations. Some of the higher-paying jobs can be
found in the fields of information and communication, public administration and defense, as well
as science and technology. However, these sectors are concentrated in the capital. Majority of the
labor force in smaller counties is employed in manufacturing, healthcare and education, as well
11
“Median Age of The Population at The Beginning Of The Year,” The Lithuanian Department of Statistics,
accessed May 9, 2020 https://osp.stat.gov.lt/statistiniu-rodikliu-analize#/
12
“Unemployment Rate” The Lithuanian Department of Statistics, accessed May 9, 2020
https://osp.stat.gov.lt/statistiniu-rodikliu-analize#/
13
“Wages: Average Earnings Monthly,” The Lithuanian Department of Statistics, accessed May 9, 2020
https://osp.stat.gov.lt/statistiniu-rodikliu-analize#/
8as in trade of motor vehicles and motorcycles. Although these sectors are prominent in the
capital region as well, the labor force there is more diversified. For example, better-paying
sectors like information and communication, science and technical activities and public
administration account for four percent, six percent, and nine percent of all employees in the
capital. On the other hand, the same categories in Central and Western parts of Lithuania
constitute one, two and four percent of the labor force, respectively.14
Poverty in Lithuania has also increased. Since 2014, the share of persons living at risk of
poverty and social exclusion in rural areas rose from 32 percent in 2014 to 36 percent 2018,
peaking at 40 percent in 2016.15 In smaller towns, the figure increased as well, but less
dramatically. In Vilnius, Kaunas, Klaipėda, Šiauliai and Panevėžys, the share of those living at
risk of poverty and social exclusion has decreased steadily over the years, constituting only 19
percent in 2018.
The most at-risk groups include single adults (56.2 percent), single parents (53.5 percent)
as well as families with three children or more (37.2 percent).16 The elderly also remain an group
of interest in this category, with at risk of poverty rate doubling from 20.8 percent in 2012, to
over 41 percent in 2018.17 Although pensions have increased over the last ten years, they remain
low. In 2019, the average pension was €344.4.18 Unemployment benefits were a little lower,
14
“Labor Productivity of the National Economy: Employment,” The Lithuanian Department of Statistics, accessed
May 9, 2020 https://osp.stat.gov.lt/statistiniu-rodikliu-analize#/
15
“Share of persons living at risk of poverty or social exclusion,” The Lithuanian Department of Statistics, accessed
May 9, 2020 https://osp.stat.gov.lt/statistiniu-rodikliu-analize#/
16
Ibid.
17
“At-risk-of-poverty rate of persons aged 18 and older,” The Lithuanian Department of Statistics, accessed May 9,
2020 https://osp.stat.gov.lt/statistiniu-rodikliu-analize#/
18
“Pensions: Pension Sizes” State Social Insurance Fund Board, accessed May 9, 2020 http://atvira.sodra.lt/lt-eur/
9about €337 per month.19 Considering that the average amount needed to make ends meet in
Lithuania in 2018 was estimated at €414 (€428 in smaller cities and towns), it is difficult to
understand why poverty is not more prominent.20 One explanation for this phenomenon could be
increased reliance on social networks at retirement age and in times of crisis. However, given the
prevalence of emigration, these networks may be less reliable in the future.
Even those who are not at risk of poverty may be one accident or illness away. In 2017
46 percent of Lithuanians report inability to face expected financial expenses of €260. In rural
areas the share is as high as 61 percent and reaches 65 percent in Telšiai. Respondents also
expressed inability to afford one week of annual holiday away from home. This sentiment was
especially strong among those living in smaller towns and rural areas, with over 60 percent
agreeing in Marijampolė and Telšiai.21
Determinants of Regional Disparities
Regional problems in Lithuania are not an accident. High unemployment and poverty
rate, low salaries, and loss of educated youth, are all outcomes of systematic developmental
neglect. It is no surprise that the capital attracts students, entrepreneurs, and highly skilled
workers. Most of the nation’s universities are located in Vilnius, along with the largest financial
firms, such as Nasdaq, Western Union, Danske Bank, as well as Swedish giants Swedbank and
SEB. Invest Lithuania on its brochure states that Vilnius is: “Home to two thirds of the country’s
IT talent, as well as the majority of its technology universities and colleges. Vilnius is a hub for
19
“Benefits: Unemployment insurance benefits sizes,” State Social Insurance Fund Board, accessed May 9, 2020
https://atvira.sodra.lt/en-eur/
20
“Amount of Money Needed to Make Ends Meet, Per Capita Per Month,” The Lithuanian Department of Statistics
https://osp.stat.gov.lt/statistiniu-rodikliu-analize#/
21
Income and Living Conditions, The Lithuanian Department of Statistics, (Vilnius: 2017), 37-38
https://osp.stat.gov.lt/services-portlet/pub-edition-file?id=30782
10software development, IT R&D and computer game development.”22 The capital is also well-
connected nationally and internationally by Vilnius International Airport, railway and bus
stations, as well as four-lane highways (hereafter expressways).
Compared to the capital, Lithuania’s poorer counties lack physical infrastructure, cluster
development, quality of higher education institutions and talent. Lithuania’s two expressways
connect only four out of ten counties and neither reach the fourth largest city, Šiauliai. Without
proper road infrastructure, a car ride from Kaunas to Šiauliai (approximately 149 km) takes over
two hours. Yet, the same time is needed to travel from Kaunas to Klaipėda (approximately 215
km) using expressway A1.
A weak road network is not the only problem. Trains also primarily serve larger cities
and counties. For example, Vilnius-Kaunas train runs 19 times per day. The cheapest ticket costs
€4.80 and the journey takes about an hour and a half. On the other hand, a two-hour ride from
Šiauliai to Vilnius is only available six times per day and the cheapest ticket is €11.60.23 Tauragė
and Alytus counties cannot be reached by a passenger train at all.24 Regarding logistics, the train
system is rather comprehensive, but the main centers are again in Vilnius and Kaunas. There are
also international routes, which primarily connect the four largest cities to China, Russia,
Turkey, and the rest of Europe.
22
“Vilnius Region: Where Top Talent and Great Ideas Meet,” Invest Lithuania, accessed May 9, 2020
https://investlithuania.com/wp-content/uploads/2017/09/Regions-of-Lithuania_Vilnius.pdf
23
“Tickets,” Lithuanian Railways, accessed May 9, 2020
https://www.traukiniobilietas.lt/portal/info/naujitvarkarasciai
24
“Routes, trains and stations,” Lithuanian Railways, accessed May 9, 2020
https://www.traukiniobilietas.lt/portal/info/lgmap
11Lithuania’s Transportation Infrastructure25
Vilnius, Kaunas and Palanga International are the three main airports in Lithuania and all
of them are located far from poorer counties. Šiauliai is the only county that has a military
airport. One of the largest military airports in the former Soviet Union, Šiauliai International
Airport now houses NATO Baltic Air Policing. In 2003 the airport was permitted to serve as a
civil air transport and offer cargo services. Some of its clients are American Kalita Air, Turkish
MNG Airlines and Uzbekistan Airways.26 In 2015 the airport held 14 percent share of the total
Lithuanian cargo volume. Despite limited cargo and passenger service, the airport is largely
25
“Regions of Lithuania,” Invest Lithuania, accessed May 9, 2020 https://investlithuania.com/investment-locations/
26
“About Us,” Šiauliai International Airport, accessed May 9, 2020 https://www.Šiauliai-airport.com/apie-mus/
12underutilized, with the government, military, and aviation specialists unable to find a common
ground.27
Port of Klaipėda is the only port in Lithuania, connecting sea, land. and railway routes.28
It can accommodate vessels 400 in length, provides an annual 65 million tons cargo handling
capacity and is always open. The port welcomes international cruises, ranging from Scandinavia,
UK, Italy, Portugal, Bahamas, and the Marshall Islands.29 Besides Palanga, Šiauliai, Kaunas,
Klaipėda and Vilnius, the rest of Lithuania does not have any large transportation infrastructure
to facilitate connectivity.
Free Economic Zones (FEZ) is another aspect that makes some cities more attractive for
entrepreneurs. Currently there are seven such zones in Lithuania, five of which are located in
smaller cities, while the remaining two are in Klaipėda and Kaunas. Kaunas’ FEZ has an area of
291 hectares and includes: a production and logistics zone; close proximity to the airport and to
the second largest cargo-loading station in Lithuania; convenient public transport system
between the FEZ and the city; access to the expressway and other amenities.30 Most of the
territory is developed and utilized for greenfield investments. Like all FEZ in Lithuania, Kaunas
also offers substantial tax incentives, which helped attract Continental, Hollister and Chemsys, as
well as several logistics, electronics, food, and pharmaceutical companies.31
27
Kęstutis Masiulis, “Kęstutis Masiulis. Kaunas Recovering, Next Šiauliai and Panevėžys,” Delfi, November 12,
2017 https://www.delfi.lt/news/ringas/politics/k-masiulis-kaunas-atsigauna-toliau-Šiauliai-ir-
Panevėžys.d?id=76296495
28
“About the Port,” Port of Klaipėda, May 9, 2020 https://www.portofKlaipėda.lt/about-the-port
29
“Cruise Season for 2020,” Port of Klaipėda, May 9, 2020 https://www.portofKlaipėda.lt/cruise-season-for-2020
30
“About Kaunas FEZ” Kaunas Free Economic Zone, Accessed May 9, 2020 https://ftz.lt/?lang=en
31
“Investors,” Kaunas Free Economic Zone, Accessed May 9, 2020 https://ftz.lt/investors/?lang=en
13Free Economic Zones in smaller counties, such as Marijampolė, Kėdainiai, Panevėžys,
Šiauliai, and Akmenė simply cannot compete Kaunas. For example, the size of Šiauliai FEZ is
107 ha. Although Šiauliai is a larger county, (8,537 km² compared to 8,086 km²), its FEZ is half
the size of Kaunas’. Despite being smaller territory, most of Šiauliai FEZ is unoccupied; out of
107 ha, only 13ha is currently in use. Šiauliai FEZ was established in 2015, a decade later than
Kaunas, and is yet underdeveloped. Whether it is the lack of experience or the lesser quality of
resources, Šiauliai FEZ simply cannot compete with either Kaunas or Klaipėda. Unfortunately,
there seems to be no protection against such competition.
Panevėžys FEZ is even smaller, encompassing only 34 ha. It has access to the city’s
industrial district and is connected to major suppliers that operate in Panevėžys, as well as
commercial, residential, and manufacturing facilities. One of Lithuania’s famous real estate
companies Ogmios group has two legal offices, as well as construction management and
maintenance units in the area.32 There are only three companies in Panevėžys FEZ: Norway’s
clothing company Devold, furniture maker IMG, and local marketing company Spektrus.33
Similar to Šiauliai, Panevėžys FEZ lacks not only better resources to attract foreign companies
but also larger land sizes.
The FEZ of Kaunas and Klaipėda are not only larger in size, have stronger transportation
infrastructure, but can also offer access to clusters of different businesses and industries. Free
economic zones in bigger cities are often located nearby science and technology parks, such as
Nemunas and Santaka valleys in Kaunas, and Marine Valley in Klaipėda. These types of
facilities bridge the gap between the scientific community and the private sector. They promote
32
“About Us,” Panevėžys Free Economic Zone, accessed May 9, 2020 https://www.pfez.lt/about-pfez/
33
Ibid.
14startups, innovation and collaboration between local entrepreneurs and multinational
corporations. While the quality of free economic zones varies among counties, Alytus, Telšiai
and Utena do not have such zones at all.
Academic institutions are another important factor for regional development. Quality
higher education programs attract talented youth and can lead to establishment of science and
technology parks which spur innovation and entrepreneurship. Out of 20 universities in
Lithuania, 11 are located in the capital, five in Kaunas, two in Klaipėda, one in Šiauliai and
Telšiai. Lithuania also has 22 colleges, which offer more specialized programs and workforce
education. Out of 22 colleges in the country, seven are in the capital, five in Kaunas, four in
Klaipėda, two in Šiauliai, and one in each Utena, Panevėžys, Marijampolė and Alytus. Tauragė
is the only county in the country with neither a university, nor a college. It is also one of the
poorest counties in the country with the second highest proportion of emigrants.
The range and the quality of the university and college programs differ radically among
the regions. In Kaunas and Vilnius students can choose from dozens of degree paths, including
biomedical engineering, information systems and cyber security, global marketing, financial
engineering, as well as mechatronics and robotics.34 English is also the primary language of
instruction in many the nation’s more prominent universities, which gives the graduates an
advantage when competing for positions at multinational organizations. On the other hand,
Šiauliai county, which has only one university cannot match the quality and the variety of
34
“Bachelor and Integrated studies,” Vilnius University, accessed May 9, 2020
https://www.vu.lt/en/studies/bachelor-studies; “Bachelor's and Integrated Programmes,” Kaunas University of
Technology, accessed May 9, 2020 https://biomedicine.ktu.edu/; “Undergraduate studies,” Vilnius Technical
University, accessed May 9, 2020 https://www.vgtu.lt/for-international-students/degree-programmes-in-english-
language/undergraduate-studies-/50783?lang=2
15programs offered at the two largest cities. Šiauliai University offers only four academic paths:
economics, business administration, software engineering and music pedagogy. In Utena,
Panevėžys, Marijampolė, and Alytus, the situation is even starker. Although these counties each
have one college, the primary language of instruction is Lithuanian, and the range of programs is
limited. Moreover, since graduate programs are limited, those students who intend to continue
their education must move to a larger city or emigrate abroad.
The exodus of students to the capital or other countries contributes to the aging of the
workforce in the smaller cities and towns. Considering that skills obtained at universities are not
tailored to the markets of their hometowns, graduates have little incentive to return. One example
of this skills mismatch is in research and development. Most employment opportunities in this
industry are located in Vilnius, Kaunas or Klaipėda. According to the Lithuanian Department of
Statistics, only four counties allocated funding for R&D between 2012 and 2016. Out of a €182
million gross expenditure on R&D in 2015, 58 percent was spent by Vilnius, 36 percent by
Kaunas, and five and one percent by Klaipėda and Šiauliai respectively.35 This uneven allocation
is expected, given the absence of R&D opportunities in poorer counties, but it is not sustainable
in the long-term if Lithuania is to reduce regional disparities.
Natural Resources and Regional Specializations
Despite the absence of social and physical infrastructure, smaller counties have a lot to
offer, especially in regard to natural resources. Alytus and Utena counties possess 4,494 and
5,820 hectares of unutilized agricultural land, respectively. Alytus is also the only county in the
35
Research and Development Activities in Lithuania, The Lithuanian Department of Statistics, (Vilnius: 2017), 11
https://osp.stat.gov.lt/services-portlet/pub-edition-file?id=27980
16whole country to surpass Vilnius in the share of forest cover.36 Pakruojis, Joniškis, Akmenė,
Biržai and Rokiškis municipalities in the North of Lithuania are rich in dolomite, an important
resource in the chemical industry and the production of glass, bricks and ceramics. The largest
volume of peat can be found in Šiauliai and Panevėžys counties, while limestone is present only
in Akmenė municipality, Šiauliai county. Clay is another key resource, which can be used in
building bricks or tiles. More than half of Lithuania’s clay is concentrated in Šiauliai county,
while smaller concentrations can be found in Utena and Marijampolė. Lastly, a significant
amount of oil can be found in Kretinga and Šilutė municipalities in the Western part of the
country.37
Invest Lithuania, the main agency for foreign direct investment and business
development established by the Ministry of Economy and Innovation, released its own map of
regional specializations. According to this resource, smaller counties possess competitive wood
processing, furniture, textile as well as food and beverage industries. Alytus and Panevėžys also
seem have a comparative advantage in machinery and electrical equipment, while Telšiai ,
Utena, and Marijampolė have strong metal processing and machinery industries.38 In contrast,
the specializations in Vilnius and Kaunas include life sciences, information, financial, and
medical technology, as well as advanced electric and mechanical engineering.
36
“Forest Coverage,” The Lithuanian Department of Statistics https://osp.stat.gov.lt/services-portlet/pub-edition-
file?id=1908
37
“Lithuania’s Natural Resources,” Lithuania’s Public Encyclopedia, accessed May 9, 2020
https://www.vle.lt/Straipsnis/Lietuvos-eksploatuojamos-naudingosios-iskasenos-117599
38
“Regions of Lithuania,” Invest Lithuania, accessed May 9, 2020 https://investlithuania.com/investment-locations/
17Soviet Industrial Policy
After Stalin’s death in 1953, the Khrushchev’s administration established a Seven Year’s
plan focusing on reducing regional disparities. In Lithuanian SSR, the Soviet government
decelerated industrialization in the larger cities and shifted its focus towards expanding and
modernizing smaller towns. The goal was to establish ten regional centers, with a 50-60km
radius, 30-50 thousand residents in the center, and 200-600 thousand residents in each county.39
The plan also included theaters, schools, cultural centers, gyms, museums, libraries, and public
transportation. The Soviet industrial model gave rise to five regional centers – Alytus,
Marijampolė, Utena, Plungė ir Jurbarkas – as well as five industrial towns Jonava, Kėdainiai,
Mažeikiai, Švenčionėliai, and Rokiškis. Similar to urban development, villages were also
planned out to ensure water supply, sewerage, central heating, electricity, radio, and telephone.
The government was not only concerned with practical aspects of well-being, but also aesthetics.
In Rokiškis, the government decided to build a park to improve the appearance of the “Pergalė”
collective farm. Afterwards, parks were established in almost all such settlements.40
The industrial development strategies were led by enthusiastic technical experts, who
were part of Sovnarkhozy (the regional industrial administration), established in 1957. Although
this type of economic-administrative reform was abolished shortly in 1965, it left a lasting
impact by creating an elite of regional technical experts modernizing the industry and creating a
feeling of regional economic autonomy.41 It also contributed to the growth of larger cities, like
39
Marija Drėmaitė, “Industrialization and Urbanization,” Mo Museum, accessed May 9, 2020
http://www.mmcentras.lt/kulturos-istorija/kulturos-istorija/architektura/19551959-modernizmo-
startas/industrializacija-ir-urbanizacija/78195
40
Ibid.
41
Ibid.
18Klaipėda, Šiauliai and Panevėžys, causing almost a double increase in urban population between
1960 and 1976.42
Despite its initial successes, the Soviet model was one of the most important factors
contributing to Lithuania’s current regional disparities. It is no secret that in the former USSR
state-owned factories operated inefficiently and resulted in either shortages or overproduction.
Prior to World War II, Lithuania’s industrial sector was small, accounting only for ten percent of
all employment.43 Industry encompassed mostly food processing, light industry, and
woodworking. However, the industrial development under the Soviet leadership in the 1960s and
1970s comprised mostly of machine building, chemicals, and electronics industries.44 By 1990s,
employment in machine building and metallurgy sectors accounted for 38 percent of all
industrial employment, or 193,200 workers.45 On average, 800 workers worked in one enterprise,
which was much higher than 160 workers in the rest of the European Community.46
The Soviet Union operated nearly 600 state-owned industrial enterprises in Lithuania,
240 of which specialized in machine building and chemical subsectors. All enterprises were
highly monopolistic or oligopolistic, had high degree of integration with Soviet Industry, and
were producing goods for military purposes, especially in electronics and telecommunication
industries.47 For some goods Lithuania was the main supplier to the Soviet Union. For example,
Panevėžys accounted for 80 percent of all compressors for buses and large cars, while Vilnius
42
“Soviet Lithuania: Urban Population,” The Lithuanian Department of Statistics, accessed May 9, 2020
https://osp.stat.gov.lt/statistiniu-rodikliu-analize#/
43
Lithuania: The Transition to a Market Economy, A World Bank Country Study, (Washington D.C: World Bank,
1993), 149 https://elibrary-worldbank-org.ccl.idm.oclc.org/doi/citedby/10.1596/0-8213-2350-4
44
Ibid.
45
Ibid., 151
46
Ibid., 150
47
Ibid., 149
19held an 85 percent market share in the fuel diesel pump industry.48 Yet, as the Soviet Union
relied on Lithuania for manufactured goods, so Lithuania relied on Soviet Union for raw
materials, such as metals, crude oil, basic chemicals, cotton, wool and other inputs.49
Although the Soviet industrialization model penetrated every region of Lithuania, it was
especially important in Central and Western Lithuania. Tauragė benefited from establishment of
vegetable, ceramics, computer element factories, as well as a renovation of a meat processing
plant.50 Šiauliai became known for its meat, textile, leather and bicycle industry as well as for a
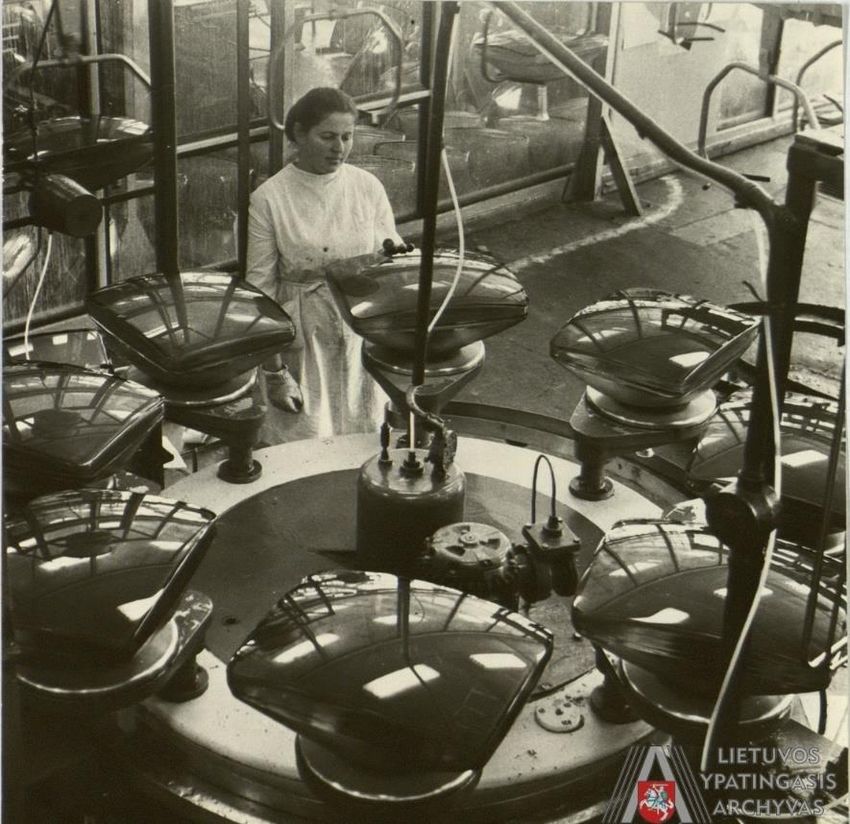
giant TV manufacturer “Tauras.”51 In Panevėžys a glass factory “Ekranas” was built, along with
a cables industry and an auto compressor plant.52 In Marijampolė, the Soviet government
nationalized and renovated a sugar factory, established a concrete factory and a bread processing
plant.53 Industrial development prompted the rise of new districts and towns, such as Naujoji
Akmenė, Elektrėnai and Visaginas.54
Panevėžys “Ekranas” Factory55
48
Ibid., 151
49
Ibid.
50
“History of Tauragė,” Tauragė District Municipality https://www.Tauragė.lt/go.php/Tauragės-istorija71623;
Gintautas Čižiūnas, “Tauragė: History, Dates, Facts,” Samogitian Land, December 23, 2010
http://samogitia.mch.mii.lt/ZZ_2010_4/ZZ_2010_4_4_15.pdf
51
“Šiauliai ‘Tauras’ TV Sets,” Rekvizitai, accessed May 9, 2020
https://rekvizitai.vz.lt/en/company/siauliu_tauro_televizoriai/
“Šiauliai in the Soviet System,” Šiauliai Tourism Information Center, accessed May 9, 2020
http://siauliuistorija.lt/2018/02/01/pramones-situacija-mieste/
52
“History,” Panevėžys Aurida, accessed May 9, 2020 https://www.aurida.lt/en/istorija/
53
“City in Soviet Era” Marijampolė District Municipality, accessed May 9, 2020
https://www.Marijampolė.lt/go.php/lit/Miestas-sovietmeciu
54
“Elektrenai District Municipality,” Elekrenai District Municipality, accessed May 9, 2020
https://www.elektrenai.lt/index.php?2818834700, “Socialist Industrialization” Lithuanian Public Encyclopedia,
accessed May 9, 2020 https://www.vle.lt/Straipsnis/socialistine-industrializacija-88159
55
“The Economy of Soviet Lithuania: From Industrialization To Perennial Scarcity,” Lithuanian Special Archive
(LYA), accessed May 9, 2020 http://virtualios-parodos.archyvai.lt/lt/virtualios-parodos/34/sovietines-lietuvos-
ekonomika-nuo-industrializacijos-iki-nuolatinio-stygiaus-lya/exh-92/pramone/case-507#slide1
20The fall of the Soviet Union destroyed Lithuania’s manufacturing sector and along with it
the newly established towns. Lithuania lost not only its main consumer but also its main supplier.
Exporting products was also not an option, as Western goods were not only cheaper, but also of
higher quality. By 1992, the output in more than half of all Lithuania’s enterprises declined; in
the case of chemical and forest industries, the decline surpassed 50 percent. 56 The output of the
food industry and the machine building and metallurgy industry, declined by 44 and 48 percent
respectively.57 From 1985 to 1990, Lithuania’s industrial personnel were reduced by almost 40
thousand.58 Due to an investment halt, factories started to close, unemployment skyrocketed and
consumption decreased, forcing the country into recession.
56
Lithuania: The Transition to a Market Economy, 151-152
57
Ibid., 151-152
58
“Soviet Lithuania: Industrial personnel,” The Lithuanian Department of Statistics, accessed May 9, 2020
https://osp.stat.gov.lt/statistiniu-rodikliu-analize#/
21History of Lithuania’s Industrial Strategy
After the restoration of independence in 1990, one would expect that the Lithuanian
government would continue to develop the country and enact an even more impressive industrial
strategy. Yet, despite the rhetoric of patriotism and national unity, Lithuania’s efforts to mitigate
the rising regional disparities have been minimal at best.
Over the last thirty years Lithuania prepared a number of plans, programs and strategies
emphasizing the ever-growing regional disparities and the need to rectify them. However, the
Regional Development Program 2006 and the Regional Social and Economic Disparities
Reduction 2007-2010 Program outline no concrete actions to improve the situation. On the
contrary, explaining that smaller counties may not have the capacity to take full advantage of the
EU structural funds, the government encourages to continue directing the largest portion of
investments to the developed regions.59 The documents state that capitals and larger industrial
centers, with favorable investment climate, well-developed infrastructure and skilled labor are
predisposed to higher investment inflows and higher economic growth. Therefore, expecting a
more equal economic performance among Lithuania’s counties is unreasonable. The problem
these statements is that they regard investment climate, infrastructure, and skilled labor to be
fixed factors. As evidenced by the growth of industrial towns during the Soviet era, quite the
opposite is true.
59
Juknys, Romualdas, National Sustainable Development Strategy Implementation Report 2008-2010, The Ministry
of Environment of the Republic of Lithuania, (Vilnius: Vytautas Magnus University, April 2012), 79
http://am.lrv.lt/lt/veiklos-sritys-1/es-ir-tarptautinis-bendradarbiavimas/darnus-vystymasis/darnus-vystymasis-ir-
lietuva/nacionaline-darnaus-vystymosi-politika/darnaus-vystymosi-igyvendinimas-lietuvoje/nacionalines-darnaus-
vystymosi-strategijos-igyvendinimo-2008-2010-metais-ataskaita
22To make matters worse, Invest Lithuania generated a map of regional specializations,
which according to the former Minister of Agriculture Evaldas Gustas, acts as guide helping
counties redirect their resources towards more efficient activities. 60 Similarly, the former director
of Invest Lithuania, Arvydas Arnašius claims that according to this map, “some Lithuanian
regions, especially in regard to manufacturing, can successfully compete with Vilnius.”61
However, the reality is very different. It is unreasonable to claim that poorer counties have a fair
chance, when the capital outperforms them in all aspects, including physical infrastructure,
connectivity, cluster development, and skilled labor. Moreover, in 2017 Vilnius had the highest
value added to GDP ratio in manufacturing and construction sectors, which are typically listed as
the specializations of the declining regions.62 Even if Invest Lithuania’s map can provide some
insight to regional specializations, poorer counties lag in the lowest end of the value chain.
It would be incorrect to claim that the Lithuanian government made no effort to improve
regional disparities. Like the other former Soviet states, Lithuania is a recipient of EU’s
structural and investment funding. From 2014 to 2020, Lithuania has received over eight billion
euros of EU investment, with more than 60 percent in Cohesion and Regional Development
Funds, which are specifically geared towards minimizing economic and social disparities,
improving infrastructure, supporting SMEs, encouraging innovation, research and promoting
sustainable development as a whole.63 Most of the funds were used to strengthen competitiveness
60
Barauskas, Albertas, “The Characteristics of Regional Investment Attractiveness,” Vakarų Expresas, October 8,
2014 https://www.ve.lt/naujienos/lietuva/vakaru-lietuva/regiono-investiciju-patrauklumo-ypatumai-1245830/
61
Ibid.
62
“Gross Value Added at Current Prices” The Lithuania Department of Statistics, accessed May 9, 2020
https://osp.stat.gov.lt/statistiniu-rodikliu-analize#/
63
“European Regional Development Fund,” The European Commission, accessed May 9, 2020
https://ec.europa.eu/regional_policy/en/funding/erdf/; “The European Structural and Investment Funds: Lithuania,”
The European Commission, accessed May 9, 2020 https://cohesiondata.ec.europa.eu/countries/LT
23of SMEs, ease connectivity, improve resource efficiency and environmental protection, and
create a low-carbon economy. One especially note-worthy project is Rain II. The project was
started in 2009 and aimed to provide rural residents, businesses, and public institutions with
access to broadband. The initiative was extremely successful, reaching 700,000 inhabitants,
twice as much as its predecessor RAIN I. Together the projects covered over a million of
inhabitants.64
In addition to RAIN I and II, there were also other smaller initiatives to spur regional
development, specifically in the spheres of business, transport infrastructure, education, tourism,
and the environment. From 2007 to 2013, EU funding supported the renovation of many
museums, tourism-oriented mansions, camp sites and parks in Lithuania’s towns and cities.
Performance venues, libraries, and youth centers also received funding, although such projects
were fewer. Yet, the highest share of funding for categories that are more conducive to
development, such as infrastructure and education, was allocated to Vilnius. While smaller
counties underwent street and road renovations, such projects were usually small-scale and cost
less than half a million euros. On the other hand, Vilnius spent €42 billion expanding a major
highway.65 Klaipėda also completed a similar project, spending over €32 million, while Kaunas
received almost €15 million for the airport modernization.66
This unproportional allocation of the EU funding continued in other spheres as well.
Between 2007 and 2013, seven academic insitutions were financed by the EU, yet only one of
64
“RAIN-2,” Broadband Internet, accessed May 9, 2020 https://www.placiajuostis.lt/en/rain-2; “RAIN” Broadband
Internet, accessed May 9, 2020 https://www.placiajuostis.lt/en/rain
65
“The Connection Of The Trans-European Network. The Second Stage Of The Vilnius City Western Bypass,” The
EU Structural Aid 2007-2013, accessed May 9, 2020 http://www.esparama.lt/projektas?id=25781
66
“Project Map,” The EU Structural Aid 2007-2013, accessed May 9, 2020 www.esparama.lt/projektu-
zemelapis?lat=54.686113&lng=25.196543&types=63,13,41&zoom=7#title
24them was in a poorer county. The goal of the project at Panevėžys College was to minimize
energy costs by renovating strategic buildings and improving insulation. On the other hand, the
projects in Vilnius and Kaunas were much more complex and included: updating laboratory
equipment and computer software for materials, and nano and light technology research;67
improving the quality of programs through modernization of information and communication
technology;68 and adoption of specialized testing for recognition of gifted students.69 In 2012
Vilnius University was engaged in 50 projects financed by the EU structural funds.70
Considering that Vilnius University is one of the most prominent academic insitutions in the
nation, the complexity of projects is expected. However, regional disparities will not shrink if
colleges and universities in the declining regions are not given the same opportunities to upgrade
their programs, labs, and management.
In the following 2014-2020 period, the two primary destinations for the EU cohesion and
regional funding was still Vilnius and Kaunas, receiving €186 million and €156 million,
respectively. However four smaller counties were allotted a rather generous amount. Telšiai
received €121 million, Marijampolė – €113 million, Panevėžys – €74 million and Utena – €69
million.71 Although equalizing the distribution of investment takes time, it is, nevertheless,
possible. Lastly, for the year 2021-2027, the amount of EU structural funds allotted to Lithuania
67
“Laser Physics Teaching Laboratory,” Vilnius University, accessed May 9, 2020
https://www.ff.vu.lt/en/lrc/studies/teaching-laboratories/laser-physics-teaching-laboratory
68
“Development and Implementation of Internal Study Quality Management System at Vilnius University,” The
EU Structural Aid 2007-2013, accessed May 9, 2020 http://www.esparama.lt/projektas?id=26067
69
“Recognition of Gifted Students: Standardization And Application Of Psychological Instruments,” The EU
Structural Aid 2007-2013, accessed May 9, 2020 http://www.esparama.lt/projektas?id=25952
70
“Vilnius University,” The EU Structural Aid 2007-2013, accessed May 9, 2020 http://www.esparama.lt/projektu-
zemelapis?lat=54.683061&lng=25.28718&types=13,14&id=31912&zoom=10#title
71
“Project and disbursements of statistics,” 2014-2020 Operational Programme for the European Union Funds
Investment in Lithuania, accessed May 9, 2020 https://www.esinvesticijos.lt/en/statistics/projektai
25is planned to be reduced by 24 percent.72 This reduction may require the government to seek
financing somewhere else, even for small-scale projects. Considering that poorer counties were
not a priority in the past, the decline in EU grants may further exacerbate the situation in the
future.
Lessons from Poland
Lithuania is not an exception when it comes to regional disparities. Lagging regions are
not only common to the EU itself, but also to most former Soviet Union states and satellites.
According to OECD 2018 data, regional disparities in Poland have increased since 2002,
resulting in 44 percent lower GDP per capita in Lubelskie, Poland’s poorest region, when
compared to its richest, Mazowieckie. While the productivity of the country grew on average 4.5
percent annually, productivity in the lagging regions such as Swietokrzyskie barely reached 1.2
percent. However, backwardness is measured not only in productivity. Per capita income,
employment opportunities, access to social services, housing availability, safety, environmental
conditions, and overall life satisfaction are all important factors to consider. The regions in the
bottom 20 percent were marked by high crime rate, pollution, poor access to broadband services,
low income and almost double unemployment level when compared to the wealthy regions.73
Similar to Lithuania, the fall of the Polish People’s Republic resulted in high
unemployment, poverty, and the decline of industrial towns. To combat these problems, the
government engaged in a number of initiatives, both at the national and local levels. Initially, the
development strategy was loosely coordinated and ineffective. Only in 1998, with the Act on
72
Rapid Case Review: Allocation of Cohesion Policy Funding To Member States for 2021-2027, European Court of
Auditors, March 2019, 28 https://www.eca.europa.eu/lists/ecadocuments/rcr_cohesion/rcr_cohesion_en.pdf
73
Regions and Cities at a Glance 2018: Poland, Organization for Economic Co-operation and Development, last
updated March 5, 2019 https://www.oecd.org/cfe/POLAND-Regions-and-Cities-2018.pdf
26Voivodship Self-Government, Poland finally achieved some regional development objectives.
The act redrew regional boundaries and created sixteen large districts which were independent to
use the EU’s funds for development purposes. However, the voivodships were responsible for
establishing institutions to manage the funds they received. Between 2004-2006, Poland
received €12.8 billion, which were dedicated to “to develop a competitive economy based on
knowledge and entrepreneurship, capable of long term harmonious development, assuring
growth of employment and achieving social, economic and spatial cohesion with the European
Union on a national and regional level.”74 This objective was supposed to be achieved through
modernization of industry, investment in human resources, increasing employment, improving
investment climate, structural agricultural transformation and reinforcing development potential
of regions, while countering marginalization.75 However, only €2760.7 million out of the original
€12.8 billion were designated for regional development support. Furthermore, the richest areas,
Mazowieckie and Śląskie, received the largest share of funding.
In the following 2007-2013 period, seven new operational programs were put in place,
including Infrastructure and the Environment, Innovative Economy, Human Resources,
Development of Eastern Poland, Technical Assistance Program, 16 Regional Operational
Programs (ROP), and European Territorial Cooperation Operational Programs (ETCOP).76
Unfortunately, like in the previous period, most of the funding did not benefit regional
economies. Out of €100 billion given to Poland in 2007-2013, only 23.8 percent was allocated to
ROP, 1.0 percent to ETCOP and 3.4 percent to Development of Eastern Poland directly.
74
Strzelecki, Zbigniew, “Regional Policy in Poland in the Years 2004-2013,” Mazovian Office for Regional
Planning, no.17 (2015), 25
75
Ibid.
76
Ibid. 26
27Moreover, the regions that received the largest portion of this funding were again, Mazowieckie
and Śląskie.77
Having learned the lessons of the previous two development periods, the Polish
government departed from short-term subsidies to underprivileged areas and designed a long-
term decentralized development model. The new approach included multi-sectoral cooperation,
with regional public policy goals defined for specific territories, considering their unique social,
economic, and environmental conditions.78 However, some objectives, including building a
knowledge-based economy, increasing public-private R&D cooperation, supporting cluster
development, revitalizing institutions in the business environment, and improving access to
finance for SMEs were common among all the regions.79
In 2017, the World Bank together with the European Commission, and the Polish
government prepared a report analyzing Polish regional disparities. The report acknowledged
that the lags of some regions is a natural outcome of industrialization and urbanization. However,
the problems of the backward regions, albeit inevitable, are real and cannot be overlooked. With
this mindset, the World Bank and the EU launched Lagging Regions initiative, first implemented
in Podkarpackie and Świetokrzyskie in Poland. The program was a huge success, resulting in
faster business registration in the two regions and a vocational education training system in
Świetokrzyskie.80 However, perhaps the most important achievement of the project was the
understanding what development objectives to prioritize, and which ones to deemphasize.
77
Ibid. 28
78
Ibid.
79
Ibid., 29-30
80
Poland Catching-Up Regions: Key Regional Development Dynamics, World Bank, (Washington D.C.: World
Bank, 2017), http://documents.worldbank.org/curated/en/302621496224344309/Poland-catching-up-regions-key-
regional-development-dynamics
28Since Poland funneled much of its EU funding to improving physical infrastructure in the
country, further improvements to increase connectivity among the regions would only generate
modest benefits. Of course, in areas where basic connectivity is poor, the prescription would be
different and investment in physical infrastructure should be encouraged. However, the initial
assessment of the future benefits before such a prescription is crucial. On the other hand, the
government should always continue to invest in human capital, specifically through healthcare
and education.81 According to the World Bank’s Competitive Cities for Jobs and Growth report,
human capital and innovation are two of the most important determinants in spurring economic
growth in upper-middle and high-income countries.82 While the World Bank acknowledges the
difficulty in achieving spatial converge, it emphasis its feasibility for the upper-middle income
countries and stresses its importance as part of the public policy.83
Industrial Strategy Literature
In international development literature, intra-state regional development is rarely touched
upon. International development still primarily refers to developing and developed countries, not
developing and developed regions. Besides analysis of Sub-Saharan Africa, Latin America or
Southeast Asia, there is little mention of regionalism within the broader development topic.
Perhaps the notion of development deserves to be seen from a different perspective. Lithuania
today is considered a high-income country, with little need for development. Yet, the problems
in Lithuania’s smaller towns are not that different from the problems in the developing countries.
Poverty, poor health, high unemployment, little economic opportunity, and grim life prospects
81
Ibid., 41
82
“Competitive Cities for Jobs and Growth: What, Who, and How,” World Bank, (Working Paper, World Bank
2015) https://openknowledge.worldbank.org/handle/10986/23227
83
Poland Catching-Up Regions: Key Regional Development Dynamics, 36
29You can also read