The effect of recombination on the evolution of a population of Neisseria meningitidis
←
→
Page content transcription
If your browser does not render page correctly, please read the page content below
Downloaded from genome.cshlp.org on October 17, 2021 - Published by Cold Spring Harbor Laboratory Press

Research

The effect of recombination on the evolution
of a population of Neisseria meningitidis
Neil MacAlasdair,1,8 Maiju Pesonen,2,8 Ola Brynildsrud,3,4 Vegard Eldholm,3
Paul A. Kristiansen,3,9 Jukka Corander,1,5,6 Dominique A. Caugant,3,7
and Stephen D. Bentley1
1
 Parasites and Microbes, Wellcome Sanger Institute, Cambridge CB10 1SA, United Kingdom; 2Oslo Centre for Biostatistics and
Epidemiology (OCBE), Oslo University Hospital Research Support Services, Blindern, 0317 Oslo, Norway; 3Division for Infection
Control and Environmental Health, Norwegian Institute of Public Health, 0213 Oslo, Norway; 4Department of Food Safety and
Infection Biology, Faculty of Veterinary Science, Norwegian University of Life Science, 0454 Oslo, Norway; 5University of Oslo,
Department of Biostatistics, Blindern, 0317 Oslo, Norway; 6Helsinki Institute for Information Technology HIIT, Department of
Mathematics and Statistics, University of Helsinki, 00014 Helsinki, Finland; 7Department of Community Medicine, Faculty of
Medicine, University of Oslo, Blindern, 0316 Oslo, Norway

        Neisseria meningitidis (the meningococcus) is a major human pathogen with a history of high invasive disease burden, partic-
        ularly in sub-Saharan Africa. Our current understanding of the evolution of meningococcal genomes is limited by the rarity
        of large-scale genomic population studies and lack of in-depth investigation of the genomic events associated with routine
        pathogen transmission. Here, we fill this knowledge gap by a detailed analysis of 2839 meningococcal genomes obtained
        through a carriage study of over 50,000 samples collected systematically in Burkina Faso, West Africa, before, during,
        and after the serogroup A vaccine rollout, 2009–2012. Our findings indicate that the meningococcal genome is highly dy-
        namic, with highly recombinant loci and frequent gene sharing across deeply separated lineages in a structured population.
        Furthermore, our findings illustrate how population structure can correlate with genome flexibility, as some lineages in
        Burkina Faso are orders of magnitude more recombinant than others. We also examine the effect of selection on the pop-
        ulation, in particular how it is correlated with recombination. We find that recombination principally acts to prevent the
        accumulation of deleterious mutations, although we do also find an example of recombination acting to speed the adapta-
        tion of a gene. In general, we show the importance of recombination in the evolution of a geographically expansive pop-
        ulation with deep population structure in a short timescale. This has important consequences for our ability to both
        foresee the outcomes of vaccination programs and, using surveillance data, predict when lineages of the meningococcus
        are likely to become a public health concern.
        [Supplemental material is available for this article.]

Neisseria meningitidis, the meningococcus, is a species of bacteria                 times during their lifetimes, so there are an uncertain number of
found exclusively in humans. It can cause meningitis, an infection                  carriage infections and transmission events in a human popula-
of the membranes covering the brain and spinal cord, as well as                     tion. This presents a challenge for controlling the disease, and in
septicemia (Stephens et al. 2007). These infections are difficult to                order to reduce the incidence of IMD, effective polysaccharide-
treat, even with antimicrobials, and have a high case fatality                      conjugate vaccines against serogroups A, C, W, and Y have been
rate. Of the 12 serogroups defined on the basis of the structure of                 developed and introduced in national vaccination programs.
the capsular polysaccharide, six (A, B, C, W, X, and Y) are respon-                 These vaccines are, however, expensive and not affordable for
sible for nearly all cases of invasive meningococcal disease (IMD)                  low-income countries. Therefore, a monovalent conjugate
worldwide. In contrast to strains that are capable of causing                       serogroup A vaccine was produced and successfully introduced
disease, non-disease-causing carriage isolates are typically unen-                  in large-scale vaccination campaigns in countries of the so-called
capsulated. However, most infections of encapsulated and unen-                      “meningitis belt” of sub-Saharan Africa (Diomandé et al. 2015;
capsulated N. meningitidis are asymptomatic, with the bacteria                      Trotter et al. 2017) a region stretching from the Gambia and
being carried in the oropharynx of human populations without                        Senegal to Ethiopia (Molesworth et al. 2002).
causing disease with a prevalence of ∼5%–10% (Christensen                                 Prior to the vaccination campaigns that started at the end of
et al. 2010). It is likely that essentially all individuals will be colo-           2010, the overall incidence of meningococcal meningitis in the re-
nized by potentially IMD-causing bacteria once or even several                      gion was substantially higher than anywhere else in the world and
                                                                                    included epidemics that occurred in the winter months every five
                                                                                    to 12 years (Trotter and Greenwood 2007). Though the vaccine has
8
 These authors contributed equally to this work.                                    been very effective at controlling meningitis epidemics caused by
9
 Present address: Coalition for Epidemic Preparedness Innovations,                  serogroup A, the main cause of IMD in the meningitis belt
0473 Oslo, Norway
Corresponding author: nm12@sanger.ac.uk
Article published online before print. Article, supplemental material, and publi-   © 2021 MacAlasdair et al. This article, published in Genome Research, is avail-
cation date are at https://www.genome.org/cgi/doi/10.1101/gr.264465.120.            able under a Creative Commons License (Attribution 4.0 International), as de-
Freely available online through the Genome Research Open Access option.             scribed at http://creativecommons.org/licenses/by/4.0/.

31:1–11 Published by Cold Spring Harbor Laboratory Press; ISSN 1088-9051/21; www.genome.org                                       Genome Research               1
                                                                                                                                     www.genome.org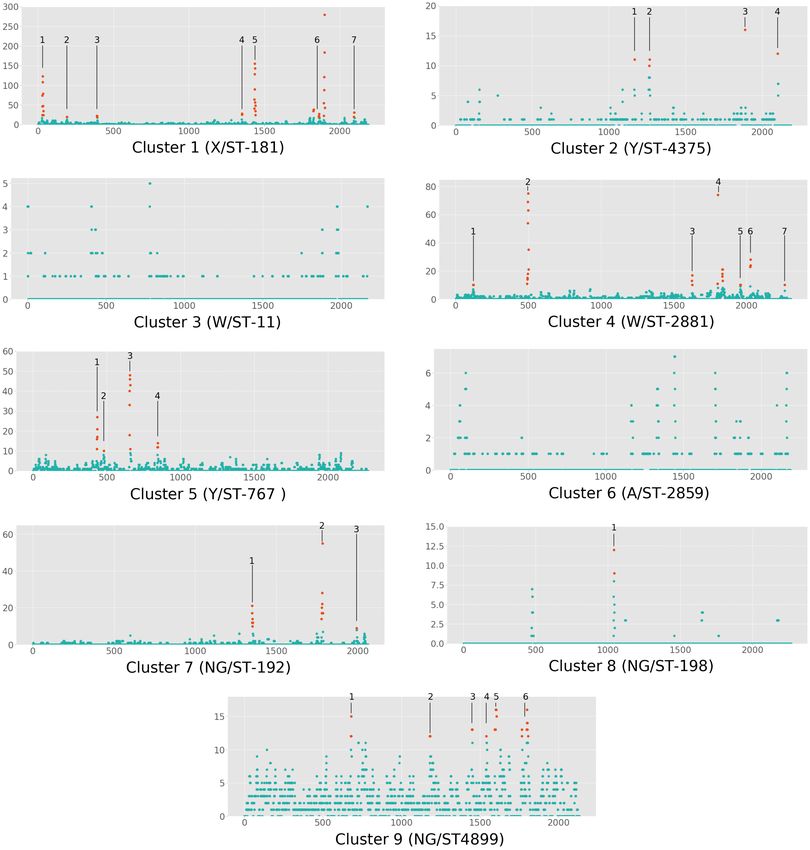
Downloaded from genome.cshlp.org on October 17, 2021 - Published by Cold Spring Harbor Laboratory Press

MacAlasdair et al.

(Diomandé et al. 2015; Trotter et al. 2017), other serogroups (C, W,          late, which are then used to construct phylogenies, infer recombi-
and X) have emerged or expanded in the region, reducing the ini-              nation events, and perform tests for selection. Our study
tial impact of the vaccine (Topaz et al. 2019). There is also concern         recapitulates the finding of previous molecular studies on this pop-
that virulent strains circulating in the population might switch              ulation, but leveraging whole-genome data, this study additionally
capsule or that less virulent strains not covered by the current vac-         sought to determine whether lineages that make up this popula-
cine might acquire virulence genes (Bårnes et al. 2017; Brynildsrud           tion have significantly different recombination rate phenotypes;
et al. 2019).                                                                 if different lineages have specific recombination hotspot regions
      Both of these potential scenarios are driven by the ability of          —loci where much more recombination takes place compared to
bacteria from the genus Neisseria to be naturally transformable               elsewhere in their genomes; to what extent recombination is occur-
and to readily recombine their DNA with one another (Obergfell                ring between the different lineages which make up this population;
and Seifert 2015), in concert with selection (Arnold et al. 2020).            and finally, whether it is possible to ascertain the evolutionary
Various mechanisms of recombination have been described in N.                 causes and effects for recombination in this population. Though re-
meningitidis (Schoen et al. 2009; Marri et al. 2010; Joseph et al.            combination in N. meningitidis has been a known phenomenon
2011), involving abundant and diverse repetitive DNA sequences                and studied for some time (Zhu et al. 1999), we believe this study
in its chromosome. The evolutionary and epidemiological effects               to be the first to detail the extent of variation in recombination
of recombination in N. meningitidis have been studied in some de-             rate within a sampled population and to characterize how and
tail (Marri et al. 2010; Joseph et al. 2011; Retchless et al. 2018), but      why recombination affects the evolution of the population.
less work has been undertaken to describe how the extent of re-
combination varies both between different lineages of N. meningi-
tidis and between different regions of its complete genome in a               Results
single circulating carriage population. In particular, there is little
understanding of how this recombination affects the process of                Population structure
natural selection. Studies across diverse populations and species             The PopPUNK clustering of the successfully sequenced Burkina
have suggested that there is likely some variation (Castillo-                 Faso collection of 2838 carriage isolates returned 17 clusters, five
Ramírez et al. 2012; Ezewudo et al. 2015), and this variation in re-          of which were single isolate and three that had fewer than 10 iso-
combination rate is particularly relevant amid the disruption of              lates. These eight clusters were not considered in the downstream
population structure caused by large-scale vaccine introduction               per-cluster analyses—the remaining nine clusters accounting for
(Potts et al. 2018).                                                          99% of the isolate collection. These clusters broadly correspond
      Burkina Faso, located in the center of the meningitis belt, his-        to the dominant serogroups and sequence types (STs), as indicated
torically has had a high burden of disease caused by serogroup A              in Figure 1: with cluster 1 being composed entirely of serogroup X
meningococci (Nicolas et al. 2005) and was one of the first coun-             and 96% of ST-181; cluster 2 composed 99.8% of serogroup Y and
tries to introduce the serogroup A conjugate vaccine in a mass vac-           98% of ST-4375; cluster 3 composed entirely of serogroup W and
cination campaign in 2010 (Kristiansen et al. 2013). Since then,              98% of ST-11; cluster 4 composed 99% of serogroup W and 93%
the incidence of IMD has decreased overall, but there have been               of ST-2881; cluster 5 composed 99% of serogroup Y and 59% of
meningitis outbreaks caused by serogroups W and X, belonging,                 ST-767; cluster 6 composed entirely of serogroup A and 99% of
respectively, to the sequence types (STs) 11 and 181 (Kristiansen             ST-2859; cluster 7 composed wholly of nongroupable (NG) or cap-
et al. 2013).                                                                 sule-null (cnl) isolates and 82% of ST-192; cluster 8 composed en-
      Here, we present a detailed population genetic analysis, focus-         tirely of NG/cnl and 100% ST-198; and cluster 9 composed 100%
ing on recombination, in a collection of 2838 N. meningitidis car-            of NG/cnl and 52% of ST-4899. Among these clusters, we found
riage isolates collected from three areas
of Burkina Faso over the course of the im-
plementation of the serogroup A vaccine,
from 2009 to 2012. This collection has
been previously studied using molecular
typing techniques (Kristiansen et al.
2013, 2014) which identified ST-181 as
the dominant lineage in this population
during the time period when sampling
was performed. It further showed that
the vaccine was effective at reducing the
incidence of its target, serogroup A iso-
lates, with none of the previously preva-
lent serogroup A ST-2859 clone detected
after vaccination. This was, however, as-
sociated with an increase in the incidence
of the disease-causing serogroup X ST-
181 complex and also with the introduc-
tion and expansion of the disease-caus-
ing serogroup W ST-11complex. In this
                                                Figure 1. Core genome phylogeny, annotated with PopPUNK-inferred clusters, serogroups, and se-
study, we use whole-genome sequencing
                                                quence types for all Burkina Faso isolates in the collection. Clusters are numbered 1–9 from left to right,
with Illumina short-read technology to serogroups are indicated with colors as per the legend, and sequence types for the seven largest clusters
generate de novo assemblies for each iso- are indicated with labels. NG indicates that the isolates were nonserogroupable.

2    Genome Research
        www.genome.org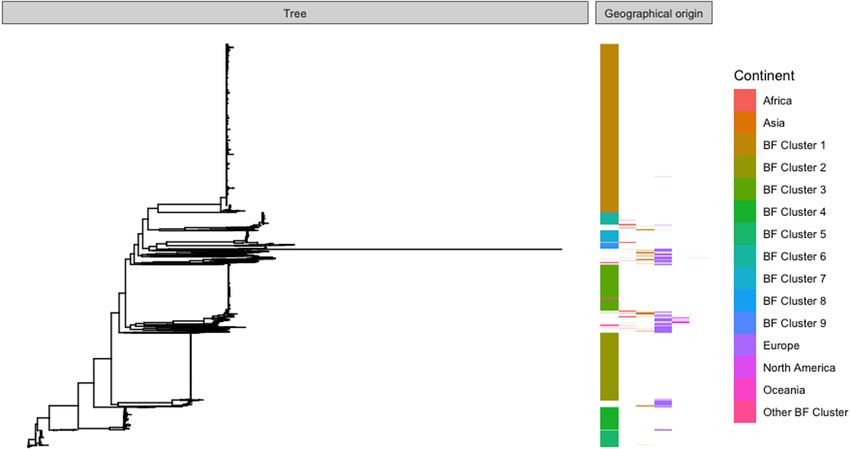
Downloaded from genome.cshlp.org on October 17, 2021 - Published by Cold Spring Harbor Laboratory Press
Recombination and evolution: N. meningitidis
the major disease-causing lineages occurring in Burkina Faso pre- Table 1. Average ρ/θ, recombination events per mutation, and θ,
(clusters 3 and 6) and post-vaccine introduction (clusters 1 and number of nonrecombinant mutations per branch, for each cluster
as determined by cluster-by-cluster Gubbins analysis
3) (Kristiansen et al. 2013). Disease surveillance since the imple-
mentation of the serogroup A vaccine in Burkina Faso has shown Cluster (dominant serogroup Number of
these lineages, clusters 1 and 3, to be the predominant causative and ST) ρ/θ isolates θ
strains of meningococcal IMD (Diallo et al. 2017). Based on the
dominant serogroups and serogroup predictions for each cluster, Cluster 1 (X/ST-181) 0.1053 1361 3.72
Cluster 2 (Y/ST-4375) 0.0082 539 6.63
we can see further that the clusters contain between 1% and Cluster 3 (W/ST-11) 0.0249 373 1.21
24% isolates which have likely varied their capsular phenotype. Cluster 4 (W/ST-2881) 0.1460 180 8.99
Figure 2 includes the entire Burkina Faso collection, as well as Cluster 5 (Y/ST-767) 0.0710 135 8.19
the global whole-genome sequences collected as described in the Cluster 6 (A/ST-2859) 0.0542 86 4.16
Cluster 7 (NG/ST-192) 0.0524 95 25
Methods. From the figure, we can see that the Burkina Faso popu-
Cluster 8 (NG/ST-198) 0.0154 22 27.7
lation is composed of nine independently evolving lineages, Cluster 9 (NG/ST4899) 0.1930 23 49.1
where isolates from each cluster are more closely related to globally Average 0.0745 14.97
sampled isolates from their respective clusters as opposed to iso-
lates sampled from other clusters within Burkina Faso.
combination span three orders of magnitude, from 10−1 to 10−3,
with clusters 1, 4, and 9 being on the order of 10−1, cluster 2 being
Cluster recombination rates on the order of 10−3, and the remainder being on the order of 10−2.
Average recombination event per mutation event (ρ/θ) rates for This post hoc difference testing suggested that there are essentially
each cluster, as well as the overall average rate between all clusters, three recombination phenotypes—the highly recombinant line-
are shown in Table 1. These were calculated by averaging the per- ages (and serogroups): 1 (X/ST-181), 4 (W/ST-2881), and 9 (NG/
branch ρ/θ rates inferred by Gubbins. In general, the rates were on ST4899), the moderately recombinant clusters/serogroups: 3(W/
the order of 10−2 with the average rate for the entire collection be- ST-11), 5(Y/ST-767), 6(A/ST-2859), 7(NG/ST-192), and 8(NG/ST-
ing 0.0745. The per-cluster average recombination rate ranged 198), and the relatively nonrecombinant cluster 2 (Y/ST-4375).
from 0.0082 to 0.1930, a difference of two orders of magnitude.
The Kruskal–Wallis test on the per-branch per-mutation rates for
Within-cluster loci with elevated recombination rates
each cluster returned an H-statistic of 440.977, with the associated
P-value of 3.17 × 10−90, so there were at least two groups that were Recombination across the genome for each cluster is summarized
significantly different from one another. As the estimated average in Figure 4, and the genes contained within each cluster’s candi-
recombination rates are scaled to the different mutation rates of date hotspots are fully described in Table 2. From these results, spe-
each cluster, the difference in recombination rates suggested that cifically those shown in Figure 4, we can see that in most clusters
the clusters must be inherently different in terms of their recombi- there are regions of the genome with substantially more recombi-
nation rate. nation than the background level, though we cannot distinguish
To determine which clusters were significantly different from their relative levels of significance. Seven of the clusters had obvi-
one another, Dunn’s test was used for post hoc statistical testing. ous peaks in the Manhattan plot of recombinations, whereas clus-
The full results from this set of pairwise tests are shown in Figure ters 2 and 6 did not. Inspecting the annotation of the reference
3 with markers for a significant difference from another cluster genomes for each cluster revealed a number of genes frequently
on the top of the individual violin plots. In general, the rates of re- present within these regions with elevated levels of recombina-
tion. In particular, pilES, the pilin genes,
were present in clusters 1, 4, 5, 7, 8, and
9. Clusters 1, 4, 5, and 7 had regions con-
taining genes associated with iron up-
take. The transferrin-binding protein
gene tbpB was present in clusters 1, 4, 5,
and 7, and various portions of the bipar-
tite outer membrane hemoglobin recep-
tor gene hpuA/B were present in clusters
4 and 5.
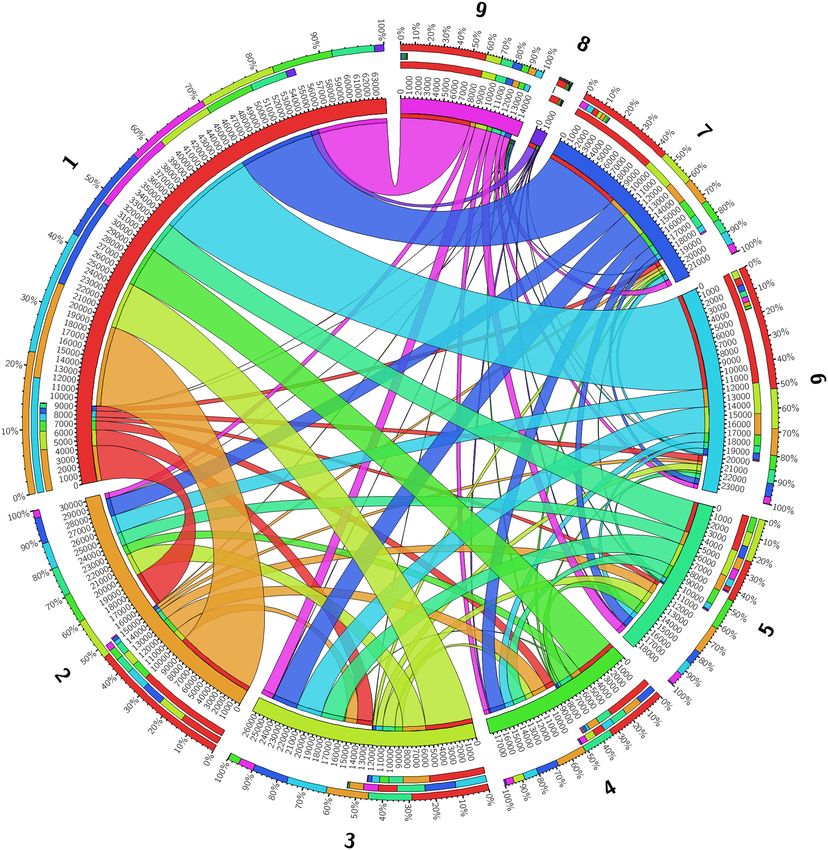
Recombination between clusters
The network of recombinant sequence
region counts between donor and recipi-
ent clusters inferred from each gene in
the pan-genome of the nine major clus-
ters in the Burkina Faso collection is illus-
trated in Figure 5. A loose correlation
between the size of each cluster and the
Figure 2. Core genome phylogeny of the Burkina Faso collection with the global background collec-
number of contiguous recombinant se-
tion, arranged in order by first Burkina Faso and then alphabetical by continent, and annotated with col-
ors for cluster, for Burkina Faso isolates, and continent of origin, for the global background collection (cf. quences identified within was seen,
Supplemental Table S4). though there were exceptions to this
Genome Research 3
www.genome.org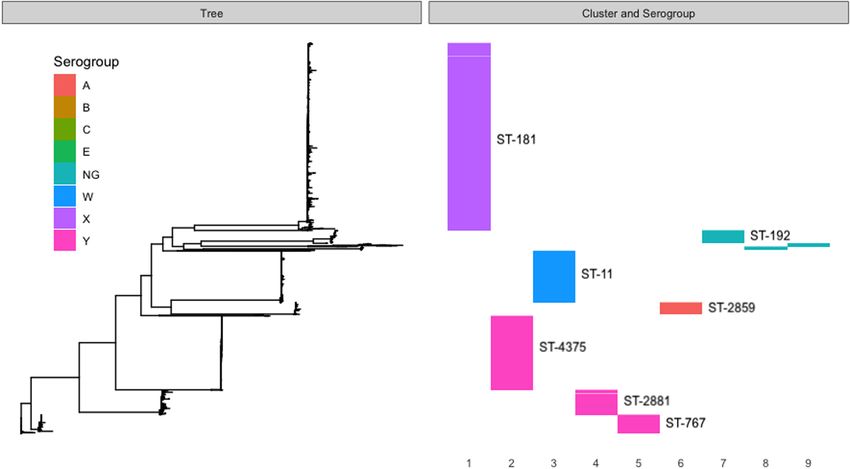
Downloaded from genome.cshlp.org on October 17, 2021 - Published by Cold Spring Harbor Laboratory Press

MacAlasdair et al.

                                                                                                               for a gene was 27. Six of these genes
                                                                                                               were hypothetical proteins without a
                                                                                                               known annotation, two genes were
                                                                                                               phage-associated and had some pseudo-
                                                                                                               genized copies, and the last three genes
                                                                                                               were hpallM, a restriction enzyme, an
                                                                                                               uncharacterized peptidase, and the exbD
                                                                                                               membrane protein. As these genes are
                                                                                                               generally not well-described, they likely
                                                                                                               include artifacts from the annotation or
                                                                                                               pan-genome inference stage or are sim-
                                                                                                               ply unusual regions of the genome
                                                                                                               that do not evolve like other genes, re-
                                                                                                               sulting in unusually high dN/dS estimates
                                                                                                               for these genes. Consequently, these 11
                                                                                                               genes were excluded from figures and
                                                                                                               further analysis.
Figure 3. Violin plot of the per-isolate ρ/θ, recombination events per mutation event, as calculated by              Even with those genes excluded,
Gubbins for each cluster. The average ρ/θ per cluster is indicated by the purple triangles and these are also
enumerated in Table 1. The top and bottom of the white boxes indicate the third and first quartiles, re-       correlating the dN/dS and number of sepa-
spectively, and the whiskers of the plot represent the maximum and minimum values. The orange back-            rate recombinant sequence regions iden-
ground shading represents the distribution of inferred recombination rates within each cluster.                tified per gene in the pan-genome with
Significant differences between clusters, as determined by a Kruskal–Wallis nonparametric analysis of var-     a nonparametric Spearman’s rank corre-
iance on all the per-branch rates for each cluster, followed by post hoc statistical testing for differences
between groups using Dunn’s test and the conservative Holm-Bonferroni correction for multiple testing,         lation returned a highly significant nega-
is indicated by cluster numbers above each cluster’s violin plot.                                              tive correlation coefficient of −0.122,
                                                                                                               with P = 2.21 × 10⁻⁶. As can be seen in
                                                                                                               Figure 6, however, one gene has a dN/dS
pattern that reflected the per-cluster estimates of recombination                   value of over 10 and 42 separate recombinant sequence regions
rate for each cluster. For instance, cluster 5 was involved in more                 identified within. This is dpnA, a DNA methylation modification
exchanges of contiguous recombinant sequence than cluster 4, de-                    enzyme. Additional analysis of this gene with BUSTED and
spite being smaller at 135 isolates compared to 280. This was also                  FUBAR confirmed that it is under gene-wide selection
true of the smallest clusters 8 and 9, where 9 was involved in many                 (BUSTED, P = 0.00015) and that a single amino acid site is under
more exchanges of contiguous recombinant sequence than 8.                           selection (FUBAR, posterior probability = 0.9039). The 42 branch-
      Among the main lineages (clusters 1–9), clusters 1, 3, and 4                  es of the phylogeny which featured the recombination were also
received more DNA by recombination than they donated, whereas                       tested with aBSREL to see whether they were under selection,
2, 5, 6, 7, 8, and 9 donated more DNA than they received. The re-                   and one of these branches was found to be under selection (P
sults indicated that clusters with lower recombination rates, which                 = 0.00059).
make up a smaller proportion of the population (e.g., clusters 2, 5–
9), donate more of the identified contiguous recombinant se-
quences than they receive, whereas clusters with a higher recombi-
                                                                                    Discussion
nation rate or that are larger in population size, namely 1 and 4,                  The first, immediate conclusion from the composition of our sam-
and 1 and 3, respectively, receive more DNA than they donate.                       ple of N. meningitidis carriage isolates from Burkina Faso is that,
      Across the pan-genome of 2861 genes, the average number of                    over the course of the sampling period, the population was com-
contiguous recombinant sequences identified per gene was 63.03,                     posed primarily of nine independently evolving lineages.
with 1084 genes not having any recombinant sequences detected,                      Bacteria of these lineages were more closely related to isolates of
and the number of recombinant sequences being deteced per gene                      the same lineage from other parts of the world than to isolates
ranging from 1 to 9015, in genes where a nonzero number of re-                      from other lineages within Burkina Faso, as indicated by Figure
combinant sequences were detected. Six genes had more than                          2, reflecting the deeply stratified population structure of N. menin-
5000 separate contiguous recombinant sequences inferred: an                         gitidis, where clonal lineages with a distant common ancestor co-
IS200-like transposase, the flavinyl transferase apbE, an unnamed                   exist in space and time, evolving largely independently. Seven of
P1 outer membrane protein, the microcin resistance gene tldD,                       the lineages making up the Burkina Faso population were present
the adhesin gene mafA, and the sRNA regulatory protein yhbJ.                        in all four years of sampling. Two lineages, however, were not con-
                                                                                    sistently detected. Cluster 3, the serogroup W/ST-11 lineage, was
                                                                                    first detected in our collection in 2011 and then also in 2012 but
Selection and recombination in the pan-genome                                       was not present in 2009 or 2010, although it caused a large epi-
dN/dS was successfully estimated with SNPGenie for 1804 genes of                    demic in Burkina Faso in 2002 (Koumaré et al. 2007). This may
the 2861 genes in the pan-genome, with the remaining genes be-                      therefore represent either a re-introduction of the lineage after it
ing singletons or not having enough diversity to allow the calcula-                 had gone locally extinct or an increase in population size to be
tion to be performed. The average dN/dS for the pan-genome was                      once again detectable after the population perturbation caused
1.563, with values for individual genes ranging from 0 to 396.66.                   by vaccination. Cluster 6, the serogroup A lineage, is the other clus-
Relatively few genes, 119 of 1804, had a dN/dS greater than one                     ter which was not detected throughout our sampling period, being
(Supplemental Table S2). Eleven genes had unusually high esti-                      found in 2009, 2010, and a single isolate in 2012. The isolate in
mates for dN/dS—over 70—and the next highest dN/dS estimate                         2012 was substantially divergent from the rest of the lineage

4    Genome Research
        www.genome.org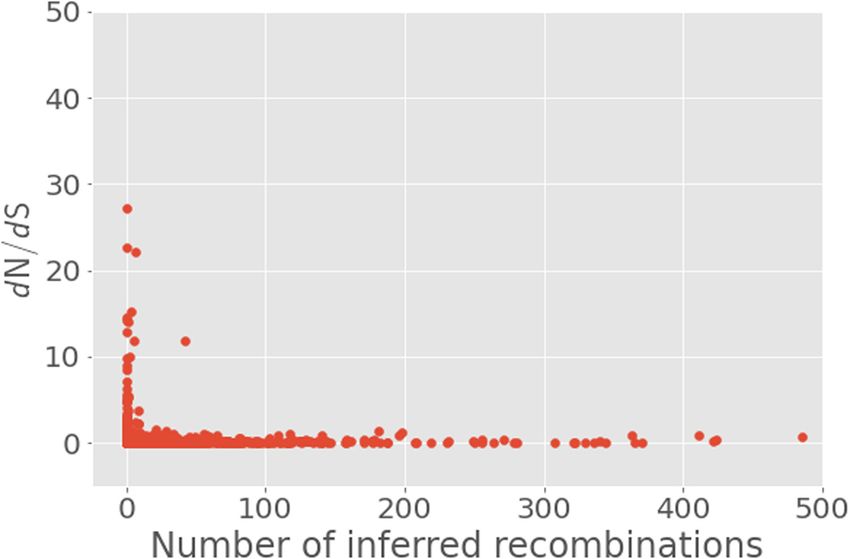
Downloaded from genome.cshlp.org on October 17, 2021 - Published by Cold Spring Harbor Laboratory Press

                                                                                                Recombination and evolution: N. meningitidis

        A                                                                      B

        C                                                                      D

        E                                                                      F

        G                                                                      H

                                             I

Figure 4. Per-cluster Manhattan plots of the number of recombinations per discrete 1000-base pair window in each cluster’s unique reference genome.
Plots for Clusters 1–9 are in panels A–I, respectively. The number of recombinations in a window is indicated on the y-axis, and the position on the genome,
in kilobases, is on the x-axis. Regions with elevated rates of recombination, determined manually based on obvious peaks in the plot, are highlighted in
orange, and the genes within each numbered region are fully described in Table 2.

(Supplemental Fig. S1) and belonged to a different sequence type,               a fluctuating yet consistent population in Burkina Faso across the
ST-7, whereas the earlier isolates of the lineage belonged to ST-               time period of our sampling.
2859. Given that this lineage was the target of the vaccine intro-                    The significant differences in the levels of recombination be-
duced in Burkina Faso at the end of 2010, it seems likely that the              tween different clusters is an important and interesting result. As
original serogroup A lineage was extinct by 2011 in Burkina Faso                far as we are aware, this is the first study of a large, contemporane-
and the 2012 isolate represents a re-introduction from abroad.                  ous population of N. meningitidis that has used whole-genome data
The dynamic changes in the composition of our population un-                    to estimate and compare the recombination rates of different line-
derscore the need for carriage surveillance in monitoring the evo-              ages within the population. Though it has been shown in other
lution of N. meningitidis in order to guide future intervention.                species and with more disparate sampling, we show here that,
Though there were shifts in the population composition of our                   even within narrow geographical and temporal constraints, the
sample, including lineages which were restricted to a subset of                 lineages composing this population of N. meningitidis differ in
the sampling period, a majority of the lineages that made up the                their propensity to recombine by orders of magnitude. This has
study population were present throughout and therefore do reflect               important implications for how likely it is for any bacterium

                                                                                                                             Genome Research              5
                                                                                                                                www.genome.org
Downloaded from genome.cshlp.org on October 17, 2021 - Published by Cold Spring Harbor Laboratory Press
MacAlasdair et al.
Table 2. Regions with elevated rates of recombination found by inspecting discrete window Manhattan plots of recombination counts for peaks
Cluster (dominant No. of
serogroup and ST) hotspots Genes in hotspots
Cluster 1 (X/ST-181) 7 1: (Prolyl endopeptidase, argA, MJ0042 family finger-like domain gene, pyrE, putative uracil-DNA
glycosylase, ribosomal-protein-alanine acetyltransferase, yeaZ, hypothetical lipoprotein, fda, xerC,
dxs, miaB) 2: (adhA, fimA, macA) 3: (tbpB, lbpA), 4: (glmM, dhpS, aroF, putative AsmA-like protein) 5:
(tbpA, tbp2, glr, putative yjeE-like ATPase, amiC, Fic/DOC cell division protein, rlmL) 6: (ntrX, kinB,
lipB, lipA, rfbC, rfbA, pilT, yccS, pilS5, pilE, pilS2, pilE, lpxC, yqjI) 7: (porB, fetA, trmE)
Cluster 2 (Y/ST-4375) 4 1: (IS1106 transposase) 2: (tspB, phage-associated protein) 3: (lpxC) 4: (ISNme1 transposase, Fic/DOC
hypothetical protein)
Cluster 3 (W/ST-11) 0 NA
Cluster 4 (W/ST-2881) 7 1: (16S rRNA, tRNA-Ile, tRNA-Ala) 2: (Fic/DOC cell division protein, amiC, hypothetical ATPase, glr,
hypothetical protein, tbpB, tbpA) 3: (fda, lipoprotein, yeaZ, putative acetyltransferase) 4: (lpxC, pilE,
hypothetical protein) 5: (yccs, pilT, yggS) 6: (dtpT, hypothetical periplasmic protein, hpuB, hpuA) 7:
(pilC)
Cluster 5 (Y/ST-767) 4 1: (pilE, pilS6, pilS5, pilE_2, fimbrial protein P9-2 precursor, hypothetical protein, pilE_3) 2: (PilC) 3:
(tpbA, tpbB, fimbrial protein P9-2 precursor), (hpuB, hemoglobin-haptoglobin-utilization protein) 4:
(heme oxygenase, putative lipoprotein, putative tbp-like)
Cluster 6 (A/ST-2859) 0 NA
Cluster 7 (NG/ST-192) 3 1: (tbpA, tbpB, glr) 2: (pilE_1, pilE_2, pilE_3, pilE_4, pilE_5, pilE_6, hypothetical protein, pilE_7, lpxC,
IS1106 transposase, IS1106A3 transposase) 3: (hemoglobin-haptoglobin-utilization protein)
Cluster 8 (NG/ST-198) 1 1: (pilE_2, pilE_3, pilE_4, pilS5)
Cluster 9 (NG/ST-4899) 6 1: (uracil-DNA glycosylase, pyrE, MJ0042 family finger-like protein, argA) 2: (dapA, hypothetical
lipoprotein, pip) 3: (glmM, dhpS, AsmA-like protein) 4: (aniA, nor) 5: (lbpA, tbpB, tbpA, tbpB_2) 6:
(pilC, pilE_4, pilE_5, lpxC, yqjI, alx)
The genes contained within a single region are indicated with a set of parentheses.
from a given lineage to pick up genetic material from another lin- a similar population size but differ greatly in the number of be-
eage, potentially a disease-causing one. This is of particular impor- tween-cluster recombinant sequences detected in each cluster. It
tance with regard to the efficacy of current vaccines and the design is clear, though, that the primary factor that determines how
of future ones. much recombination lineages undergo in the pan-genome is the
The rate of recombination within clusters was not entirely de- proportion of each cluster within the population at large, and
termined by the clusters’ relative size in the population—and hence the stochastic opportunity of recombining, particularly in
hence stochastic opportunity, assuming that the proportions of terms of the likelihood of an encounter between two random indi-
lineages in our sample reflect those in the general population— viduals of different lineages. This is in contrast to the within-line-
and though recombination rate is doubtlessly affected by many age recombination rates which were not correlated with
factors, this does suggest that there are lineage-specific genetic population size. The recombination pattern in some clusters also
components affecting the rate of recombination in N. meningitidis. suggests that the inherent recombination rate of a lineage affects
Though there exists an understanding of the mechanisms that un- how recombination proceeds between itself and other lineages.
derlie recombination in the species (Obergfell and Seifert 2015), For example, cluster 2, despite being the second largest cluster, do-
knowledge of how these and other genetic factors that affect the nates DNA more often than it receives DNA, like the much smaller
rate of recombination differ between lineages has not yet been ful- clusters 5–9. This is as one would predict, as the donation of DNA
ly explored. This awareness would not only be important to our in a recombination event is governed principally by the rate at
understanding of the evolution of N. meningitidis and other which bacteria from different lineages physically encounter one
Neisseria, but it would also allow for a more detailed monitoring another in the same host, whereas receiving DNA is further affect-
of the populations of these serious human pathogens. Finally, it ed by how likely the receiving bacteria is able to take up the DNA.
is worth noting that the highest rate of recombination, more Therefore, in lineages with low inherent recombination rates, such
than twice the average, was seen in one of the NG clusters, cluster as cluster 2, we expect to see a bias toward donating rather than re-
9. Nonserogroupable N. meningitidis, which may lack the whole ceiving of DNA, compared to what is expected based on the size of
capsule operon or simply have loss-of-function mutations in key the cluster. Though this effect is clearly dwarfed by the effect of
capsular genes, are rarely implicated in disease. However, given cluster size in general, this suggests that more recombinant lineag-
the extremely high recombination rate of the nongroupable clus- es of N. meningitidis, may be able to incorporate and maintain more
ter 9, some NG/cnl N. meningitidis bacteria may play a larger role variation from other lineages, including from lineages that them-
in the evolution of a geographical population than their frequency selves are not particularly recombinant (Supplemental Fig. S2).
would suggest. Therefore, it may prove worthwhile to monitor Although this may not be particularly surprising, it suggests that
NG/cnl N. meningitidis more closely in future study. the inherent recombination rate has important consequences for
Recombination in the pan-genome of all the lineages follows how flexible the genome of a lineage is likely to be in response
a pattern that is loosely consistent with the estimated within-clus- to different selection pressures and how likely it is that it may be-
ter rates. Clusters with higher estimates of average recombination come more virulent, antibiotic-resistant, or escape a vaccine.
rate, ρ/θ, also generally have more inferred within-gene separate The radically different amounts of recombination in
contiguous recombinant sequence in the pan-genome than clus- different regions across the genome of most lineages within this
ters with lower estimates of ρ/θ, when the population size of the population, combined with the discovery of consistent genes
cluster is taken into account. For instance, clusters 8 and 9 have within regions of elevated recombination, suggest two things: first,
6 Genome Research
www.genome.orgDownloaded from genome.cshlp.org on October 17, 2021 - Published by Cold Spring Harbor Laboratory Press
Recombination and evolution: N. meningitidis
are more temporally and geographically
diverse, to fully explore the genetic and
evolutionary factors driving elevated re-
combination rates in these regions.
The pattern of recombination
events in the per-gene analysis of the
pan-genome is largely as expected given
the within-cluster results, with an IS200
transposase, surface-exposed genes such
as the adhesin mafA, and the microcin re-
sistance gene tldD among the top five
most recombinant genes. Other genes ex-
pected to be highly recombinant, such as
the iron uptake genes tbp2/tpbB and the
surface-exposed T cell stimulating pro-
tein tspB, also have many inferred recom-
binations and are among the top 15 most
recombinant genes. Although these
genes are known to be generally very re-
combinant in Neisseria, it is also likely
that the disruption of the population by
vaccination has caused substantial shifts
in the population size of each lineage
which, in most cases, apart from cluster
6, was likely a population expansion.
During this demographic shift, lineages
will have had more opportunity to selec-
tively adapt to different hosts and also
persist to exchange DNA, and these
events are presumably contributing to
the consistently high levels of recombi-
nation detected in different genes, partic-
Figure 5. Chord diagram of the count of recombinant regions identified by fastGEAR between the clus- ularly immune targets, across the
ters in the Burkina Faso N. meningitidis carriage collection. Clusters are positioned on the main circle of different lineages.
the diagram, with the arc length of the cluster indicating the number of recombination events. The dN/dS values for each gene in the
Linkages between clusters represent the number of recombinant regions occurring between those clus- pan-genome follow a pattern that is
ters with their width representing the number of regions and the color indicating the donating lineage.
The three stacked bars outside the main diagram indicate, from outermost to innermost, the proportion of broadly expected, with most values being
the total number of recombinant regions in each cluster colored by the other cluster involved, those same very low, and relatively few genes—119—
proportions only for the count of recombinant regions received, and those proportions for regions do- having a dN/dS > 1. It is difficult to draw
nated in the focal cluster. specific conclusions from a simple gene-
wide estimate of dN/dS, but the significant
negative correlation with the number of
that recombination in the N. meningitidis genome is elevated in separate contiguous recombinant sequences for each gene in the
certain regions; and second, that multiple lineages within the pop- pan-genome and the gene’s estimated dN/dS can inform us as to
ulation are experiencing routine ongoing adaptation to human the general evolutionary role played by recombination in this
hosts. In particular, the elevated rates of recombination in pilin
and iron uptake genes—found across clusters 1, 2, 4, 5, 7, 8, and
9, as well as in previous work (Linz et al. 2000)—corroborates
that these genes are crucial determinants of the ability of N. men-
ingitidis to survive within a human host. Pilin genes, expressed
on the surface of the bacteria, are targeted by the immune system
(Wachter and Hill 2016), and the pilE gene is further known to be
highly recombinant (Aho et al. 2005), due in part to the various
mechanisms of phase variation. Human hosts are typically very
iron-deficient environments for bacteria to grow in, resulting in
a strong selective pressure on iron uptake pathways (Perkins-
Balding et al. 2004; Yu et al. 2014), and iron-binding proteins
have been shown to be very diverse and have repeats which may
promote both intra- and inter-genomic recombination close by
Figure 6. Scatter plot of number of recombination events versus dN/dS
(Acevedo et al. 2014). Further work should explore methods of de-
for genes in the pan-genome of the entire Burkina Faso collection of car-
termining which of these regions of elevated recombination are riage isolates. Genes with abnormally high estimates of dN/dS were exclud-
statistically significant and consistently so across data sets which ed from the plot as described in the text.
Genome Research 7
www.genome.orgDownloaded from genome.cshlp.org on October 17, 2021 - Published by Cold Spring Harbor Laboratory Press
MacAlasdair et al.
population. One of the evolutionary explanations of the mainte- resistance. In this study, we have conducted such an analysis on
nance of recombination in populations has been that it prevents a collection of N. meningitidis carriage samples from Burkina
the accumulation of deleterious mutations (Felsenstein 1974). Faso. We have demonstrated how using high-throughput whole-
Given the significant negative correlation count of recombinant se- genome sequencing and subsequent computational analyses on
quences and dN/dS in the pan-genome, and the fact that nonsynon- whole-genome data allow for the possibility of understanding
ymous mutations are generally more likely to be deleterious, the differential effects of recombination on the evolution of the
avoiding the accumulation of deleterious mutations, or enhancing various lineages within this population, how the lineages of the
the effect of negative selection, seems to be the primary role played population are interacting with each other, and the evolutionary
by recombination in this population. In spite of this, a single gene explanations which underlie these patterns.
in the pan genome, the dpnA DNA methylation modification en-
zyme, has both a substantial number of recombinant sequences,
42, and an elevated dN/dS estimate of 11.8. All of these sequence re-
Methods
gions identified as recombinant originate from an unknown bacte- Sample collection and laboratory analysis
rium outside the collection, and 41 ended up in the cluster 1
To assess the impact of the monovalent serogroup A conjugate vac-
lineage, with the final one ending up in cluster 2. Further analysis
cine on meningococcal carriage, 50,811 samples were collected
of this gene with the BUSTED algorithm for detecting gene-wide
over the course of four years, from 2009 to 2012, in 10 rounds of
episodes of selection confirmed that it has been under selection,
sampling. This took place across three sites in Burkina Faso: the
and using the FUBAR method for detecting specific sites under se-
Bogodogo arrondissement of the capital city, Ouagadougou; 10 vil-
lection confirmed that the dpnA gene has definitely been under se- lages in the Kaya district, 100 km northeast of Ouagadougou; and
lection in this population. Though the specific site under selection 10 villages in the Dandé district, 350 km west of Ouagadougou.
detected by FUBAR did not overlap with any of the sequence re- Oropharyngeal swabs were taken from healthy volunteers, and as-
gions identified as recombinant, testing the branches of the gene sociated metadata were collected from the individuals. A total of
phylogeny with the recombination present with aBSREL found 2848 meningococcal isolates were recovered from the 10 sam-
one of the lineages possessing the recombinant sequence to be un- plings (overall carriage rate 6.05%) and confirmed as N. meningiti-
der selection as well. This example of a high recombination gene dis at the Norwegian Institute of Public Health (NIPH), Oslo
under selection is an exception to the general pattern of recombi- (Kristiansen et al. 2011, 2013, 2014). The isolates were serogrouped
nation in the Burkina Faso population of N. meningitidis and sug- using commercial antisera (Remel), most of them were character-
gests that recombination may be acting here to speed adaptation ized by multilocus sequence typing (Maiden et al. 1998), and all
instead of simply preventing the accumulation of deleterious were stored frozen in Greaves medium (Craven et al. 1978) at
mutations. Though recombination acting in this manner has −70°C.
long been theorized to be true for all recombining organisms
under the Fisher-Muller model of recombination, and shown Whole-genome sequencing, quality control, assembly,
experimentally with plasmids in Escherichia coli (Cooper 2007), and annotation
we demonstrate this phenomenon here in a sample from a natural
DNA was extracted from 2839 of the 2848 collected isolates and
population. these were sent to be sequenced at the Wellcome Sanger
Evidence of adaptation speeded by recombination was seen Institute, using Illumina HiSeq 2000 sequencing technology.
in the dpnA gene in the cluster 1 lineage. Though it is uncharacter- Paired-end libraries were prepared with insert sizes of 500 base
ized in N. meningitidis, the dpnA gene, as part of the DpnII restric- pairs, for 125-base pair reads, sequenced at a read depth of 100×.
tion-modification system, has been studied in Streptococcus The quality of the raw sequencing reads was assessed using an in-
pneumoniae, another bacterial pathogen that primarily colonizes ternal quality control (QC) pipeline as well as a local implementa-
the nasopharynx of healthy humans. In S. pneumoniae, dpnA is spe- tion of Kraken (Wood and Salzberg 2014), the metagenomic
cifically produced during natural competence for promoting re- sequence classifier, to check for contamination. Raw reads from
combination by methylating incoming DNA to protect it from 2838 isolates passed this QC and were then used to produce de
the rest of the DpnII system (Johnston et al. 2013). Though we can- novo genome assemblies (Supplemental Table S3) using the bacte-
not assume that dpnA has an identical function in N. meningitidis, rial assembly pipeline at the Sanger Institute (Page et al. 2016). The
given the important consequences that DNA methylation is resulting genome assemblies were annotated using Prokka
known to have for recombination in N. meningitidis (Seib et al. (Seemann 2014), the prokaryotic annotation pipeline, to infer
2017; Kim et al. 2019) and the on-average higher rate of recombi- gene content. To identify the ST of all isolates from the sequence
nation in cluster 1 isolates with this dpnA recombination (0.159 vs. data, we used SRST2 (Inouye et al. 2014), the Neisseria PubMLST se-
quence typing database, and the raw reads for each isolate. Finally,
0.105), it seems that dpnA recombination may have affected the
in order to determine serogroups for each isolate in silico, we
overall recombination phenotype in the cluster 1 lineage.
adapted seroBA (Epping et al. 2018) using the published capsule
The effects of recombination on the evolution of various
reference sequences (Harrison et al. 2013). In addition to the col-
genes in the N. meningitidis genome have been the subject of ex-
lected isolates from Burkina Faso, to give global genetic context,
tensive research. This research has largely been focused on the ef-
genomes of an additional 427 publicly available N. meningitidis iso-
fects of recombination in a specific set of genes and over a long lates from five continents and maximizing serogroup diversity, as
period of time (Vigué and Eyre-Walker 2019). However, our under- well as the FA1090 Neisseria gonorrhoeae reference as an outgroup,
standing cannot be complete without also investigating how were downloaded from the European Nucleotide Archive (ENA;
recombination affects the evolution of a population of N. meningi- https://www.ebi.ac.uk/ena/browser/home) and processed using
tidis in the short to medium term. Without this, it would be diffi- the same quality control, assembly, annotation pipeline, and fur-
cult to predict how different populations will respond to vaccines, ther analyses as above where applicable (Supplemental Table S4).
anticipate changes in virulence between different lineages, or Selected isolates from five of the clusters in the collection
know if a population has a high risk of developing antimicrobial were resequenced with Oxford Nanopore MinION at the NIPH,
8 Genome Research
www.genome.orgDownloaded from genome.cshlp.org on October 17, 2021 - Published by Cold Spring Harbor Laboratory Press
Recombination and evolution: N. meningitidis
with R9.4 (FLO-MIN106) flowcells and the SQK-RBK001 rapid bar- aligned using MAFFT (Katoh and Standley 2013), using the whole-
coding kit for 1D reads, in order to produce reference genomes for genome clustering inferred by PopPUNK (Lees et al. 2019).
those clusters. De-multiplexing and base-calling was performed us- fastGEAR proceeds base pair-by-base pair in a multiple sequence
ing Albacore version 2.1.2 (Sahoo 2017), and then porechop ver- alignment to identify recombinant regions by identifying the
sion 0.2.3 (Wick et al. 2017a) was used to remove chimeric reads most likely lineage of origin for each base pair and, as such, iden-
and adapters from the nanopore reads. The reference genomes tifies contiguous sequence regions whose origin is more likely to
were then assembled by hybrid assembly using both the original be from a different lineage that a given isolate’s own and hence
Illumina sequence and the nanopore reads, with Unicycler is recombinant. Although this approach does lead to some uncer-
(Wick et al. 2017b) before being annotated with Prokka (Seemann tainty with regard to how the number of these regions correspond
2014) like the rest of the sequenced isolates. to the number of physical events, this is not a confounding bias.
The further advantage of fastGEAR as a method for detecting re-
combination is in how it infers recombination explicitly with
Clustering and phylogeny inference directionality, allowing the flow of recombination events between
To assess the population structure of the collection of carrier iso- clusters to be visualized as a network. This was done using Circos
lates, we clustered the sequence assemblies using PopPUNK (Lees Table Viewer and Circos (Krzywinski et al. 2009). To assess the ef-
et al. 2019). For four clusters among the nine largest carried for- fect of selection on the pan-genome, dN/dS ratios were also inferred
ward for further analysis, an Oxford Nanopore-sequenced refer- for each gene using the same alignments as input into fastGEAR
ence was not available. Therefore, the assembly with the lowest and the implementation of the Nei-Gojobori method (Nei
number of contigs was selected for further scaffolding, using the and Gojobori 1986) of calculating dN/dS as implemented in
MeDuSa multidraft assembly scaffolder (Bosi et al. 2015) and the SNPGenie (Nelson et al. 2015). These dN/dS results were then corre-
rest of the isolate assemblies from that cluster. The resulting scaf- lated with the number of recombination events per gene using a
folds for each cluster were then joined with gaps of 1000 blank nu- nonparametric Spearman’s rank correlation (Spearman 1904).
cleotides. The resulting sequences, or the Oxford Nanopore- Genes with an elevated SNPGenie dN/dS estimate and a high num-
sequenced references, were then used as reference genomes in pro- ber of recombinations were further analyzed with the HyPhy pack-
ducing whole-genome pseudoalignments for each cluster. We did age (Pond and Muse 2005), in particular, the BUSTED (Murrell
this using a custom mapping, variant calling, and local realign- et al. 2015) method for detecting gene-wide episodic selection,
ment around indels pipeline using BWA-MEM (Li 2013), the FUBAR (Murrell et al. 2013) method for finding codons under
SAMtools mpileup (Li 2011), and MUSCLE (Edgar 2004), and selection, and the aBSREL (Smith et al. 2015) method to find se-
then used the resulting whole-genome pseudoalignments to infer lected branches in a phylogeny.
phylogenies for each cluster, using Gubbins (Croucher et al. 2015), The SciPy (Virtanen et al. 2020), pandas (McKinney 2010),
and RAxML, its underlying dependency (Stamatakis 2014). and Matplotlib v. 2.2.3 (Hunter 2007) Python libraries were used
In order to construct a phylogeny for the entire collection and throughout this study for statistics, data manipulation, and data
also the collection combined with global isolates, we used the visualization, respectively. The R (R Core Team 2019) package
recently published Panaroo pan-genome pipeline (Tonkin-Hill ggtree (Yu et al. 2017) was used to draw phylogenies.
et al. 2020) to infer a set of core genes for the entire collection.
We concatenated alignments of all the core genes and then used
IQ-TREE (Nguyen et al. 2015), with the substitution model, GTR Data access
+ F+I + G4, inferred by ModelFinder (Kalyaanamoorthy et al. All raw sequencing data generated in this study have been submit-
2017), to infer phylogenies for both the entire Burkina Faso collec- ted to the European Nucleotide Archive (ENA; https://www.ebi.ac
tion and the Burkina Faso collection plus global isolates. .uk/ena) under the study accession number PRJEB12668.
Metadata, assemblies, and sequence types for all the isolates in
Recombination, selection, and pan-genome analyses the Burkina Faso collection are available on Neisseria PubMLST
(https://pubmlst.org/neisseria/), as per Kristiansen et al. (2013).
Recombination was first analyzed cluster-by-cluster, using whole- Whole-genome sequenced isolates are tagged with their ENA run
genome pseudoalignments of each cluster, generated as described accessions. Interactive notebooks for recreating analyses are includ-
above, and Gubbins (Croucher et al. 2015). Gubbins outputs an es- ed as Supplemental Code.
timate of ρ/θ, the number of recombination events per mutation
event, for each branch of the phylogeny (Supplemental Table
S1). To test if any of the differences in recombination rates between Competing interest statement
clusters were statistically significant, we used a Kruskal–Wallis
nonparametric analysis of variance (Kruskal and Wallis 1952) on The authors declare no competing interests.
all of the estimated per-branch rates for each cluster, followed by
Dunn’s test for post hoc statistical testing (Dunn 1964) for differ-
ences between groups and the conservative Holm-Bonferroni
Acknowledgments
correction for multiple testing (Holm 1979). Candidate recombi- The authors thank Ingerid Kirkeleite at NIPH for DNA extraction
nation hotspot regions in the reference genome of each cluster from all the samples for Illumina and Oxford Nanopore sequenc-
were found by producing Manhattan plots of the number of re- ing, DNA pipelines at Wellcome Sanger Institute (WSI) for library
combination events per 1000-base pair discrete window across preparation and sequencing, Pathogen informatics at WSI for sys-
the genome, manually looking for peaks in these plots, and com- tems administration support, and members of teams 81 and 284 at
paring them to a Prokka annotation of the genome to establish the WSI for helpful comments and advice. This research was fund-
which genes, if any, are within these windows. ed by the Wellcome Trust (206194 to S.D.B.), the European
To then analyze the recombinations between clusters in the Research Council (742158 to J.C.), and the Research Council of
entire Burkina Faso collection, we ran fastGEAR (Mostowy et al. Norway (220829 to D.A.C.).
2017) on alignments of each gene of the Burkina Faso collection’s Author contributions: N.M. and M.P. carried out the computa-
pan-genome, as inferred by Panaroo (Tonkin-Hill et al. 2020) and tional analyses. N.M., M.P., O.B., V.E., J.C., D.A.C., and S.D.B.
Genome Research 9
www.genome.orgDownloaded from genome.cshlp.org on October 17, 2021 - Published by Cold Spring Harbor Laboratory Press
MacAlasdair et al.
critically interpreted the results. N.M. wrote the first draft of the Harrison OB, Claus H, Jiang Y, Bennett JS, Bratcher HB, Jolley KA, Corton C,
manuscript with contributions from O.B., D.A.C., and S.D.B. Care R, Poolman JT, Zollinger WD, et al. 2013. Description and nomen-
clature of Neisseria meningitidis capsule locus. Emerg Infect Dis 19: 566–
N.M., M.P., O.B., V.E., J.C., D.A.C., and S.D.B. reviewed and edited 573. doi:10.3201/eid1904.111799
the manuscript. The study was designed by O.B., P.A.K., J.C., Holm S. 1979. A simple sequentially rejective multiple test procedure. Scand
D.A.C., and S.D.B. Samples were collected by P.A.K. and D.A.C., J Stat 6: 65–70.
as well as others cited in Kristiansen et al. (2013). Hunter JD. 2007. Matplotlib: a 2D graphics environment. Comput Sci Eng 9:
90–95. doi:10.1109/MCSE.2007.55
Inouye M, Dashnow H, Raven LA, Schultz MB, Pope BJ, Tomita T, Zobel J,
Holt KE. 2014. SRST2: rapid genomic surveillance for public health
and hospital microbiology labs. Genome Med 6: 90. doi:10.1186/
References s13073-014-0090-6
Acevedo RNV, Ronpirin C, Kandler JL, Shafer WM, Cornelissen CN. 2014. Johnston C, Polard P, Claverys JP. 2013. The DpnI/DpnII pneumococcal sys-
Identification of regulatory elements that control expression of the tem, defense against foreign attack without compromising genetic ex-
tbpba operon in Neisseria gonorrhoeae. J Bacteriol 196: 2762–2774. change. Mobile Genet Elem 3: e25582. doi:10.4161/mge.25582
doi:10.1128/JB.01693-14 Joseph B, Schwarz RF, Linke B, Blom J, Becker A, Claus H, Goesmann A,
Aho EL, Urwin R, Batcheller AE, Holmgren AM, Havig K, Kulakoski AM, Frosch M, Müller T, Vogel U, et al. 2011. Virulence evolution of the hu-
Vomhof EE, Longfors NS, Erickson CB, Anderson ZK, et al. 2005. man pathogen Neisseria meningitidis by recombination in the core and
Neisserial pilin genes display extensive interspecies diversity. FEMS accessory genome. PLoS One 6: e18441. doi:10.1371/journal.pone
Microbiol Lett 249: 327–334. doi:10.1016/j.femsle.2005.06.035 .0018441
Arnold B, Sohail M, Wadsworth C, Corander J, Hanage WP, Sunyaev S, Grad Kalyaanamoorthy S, Minh BQ, Wong TK, von Haeseler A, Jermiin LS. 2017.
YH. 2020. Fine-scale haplotype structure reveals strong signatures of ModelFinder: fast model selection for accurate phylogenetic estimates.
positive selection in a recombining bacterial pathogen. Mol Biol Evol Nat Methods 14: 587–589. doi:10.1038/nmeth.4285
37: 417–428. doi:10.1093/molbev/msz225 Katoh K, Standley DM. 2013. MAFFT multiple sequence alignment software
Bårnes GK, Brynildsrud OB, Børud B, Workalemahu B, Kristiansen PA, version 7: improvements in performance and usability. Mol Biol Evol 30:
Beyene D, Aseffa A, Caugant DA. 2017. Whole genome sequencing re- 772–780. doi:10.1093/molbev/mst010
veals within-host genetic changes in paired meningococcal carriage iso- Kim WJ, Higashi D, Goytia M, Rendón MA, Pilligua-Lucas M, Bronnimann
lates from Ethiopia. BMC Genomics 18: 407. doi:10.1186/s12864-017- M, McLean JA, Duncan J, Trees D, Jerse AE, et al. 2019. Commensal
3806-3 Neisseria kill Neisseria gonorrhoeae through a DNA-dependent
Bosi E, Donati B, Galardini M, Brunetti S, Sagot MF, Lió P, Crescenzi P, Fani mechanism. Cell Host Microbe 26: 228–239.e8. doi:10.1016/j.chom
R, Fondi M. 2015. MeDuSa: a multi-draft based scaffolder. Bioinformatics .2019.07.003
31: 2443–2451. doi:10.1093/bioinformatics/btv171 Koumaré B, Ouedraogo-Traoré R, Sanou I, Yada A, Sow I, Lusamba P, Traoré
Brynildsrud OB, Eldholm V, Rakhimova A, Kristiansen PA, Caugant DA. E, Dabal M, Santamaria M, Hacen MM, et al. 2007. The first large epi-
2019. Gauging the epidemic potential of a widely circulating non-inva- demic of meningococcal disease caused by serogroup W135, Burkina
sive meningococcal strain in Africa. Microb Genom 5: e000290. doi:10 Faso, 2002. Vaccine 25: A37–A41. doi:10.1016/j.vaccine.2007.04.038
.1099/mgen.0.000290 Kristiansen PA, Diomandé F, Wei SC, Ouédraogo R, Sangaré L, Sanou I,
Castillo-Ramírez S, Corander J, Marttinen P, Aldeljawi M, Hanage WP, Kandolo D, Kaboré P, Clark TA, Ouédraogo AS, et al. 2011. Baseline me-
Westh H, Boye K, Gulay Z, Bentley SD, Parkhill J, et al. 2012. ningococcal carriage in Burkina Faso before the introduction of a me-
Phylogeographic variation in recombination rates within a global clone ningococcal serogroup A conjugate vaccine. Clin Vaccine Immunol 18:
of methicillin-resistant Staphylococcus aureus. Genome Biol 13: R126. 435–443. doi:10.1128/CVI.00479-10
doi:10.1186/gb-2012-13-12-r126 Kristiansen PA, Ba AK, Sanou I, Ouédraogo AS, Ouédraogo R, Sangaré L,
Christensen H, May M, Bowen L, Hickman M, Trotter CL. 2010. Diomandé F, Kandolo D, Thomas JD, Clark TA, et al. 2013.
Meningococcal carriage by age: a systematic review and meta-analysis. Phenotypic and genotypic characterization of meningococcal carriage
Lancet Infect Dis 10: 853–861. doi:10.1016/S1473-3099(10)70251-6 and disease isolates in Burkina Faso after mass vaccination with a
Cooper TF. 2007. Recombination speeds adaptation by reducing competi- serogroup A conjugate vaccine. BMC Infect Dis 13: 363. doi:10.1186/
tion between beneficial mutations in populations of Escherichia coli. 1471-2334-13-363
PLoS Biol 5: e225. doi:10.1371/journal.pbio.0050225 Kristiansen PA, Ba AK, Ouédraogo AS, Sanou I, Ouédraogo R, Sangaré L,
Craven DE, Frasch CE, Robbins JB, Feldman HA. 1978. Serogroup identifica- Diomandé F, Kandolo D, Saga IM, Misegades L, et al. 2014. Persistent
tion of Neisseria meningitidis: comparison of an antiserum agar method low carriage of serogroup A Neisseria meningitidis two years after mass
with bacterial slide agglutination. J Clin Microbiol 7: 410–414. doi:10 vaccination with the meningococcal conjugate vaccine, MenAfriVac.
.1128/jcm.7.5.410-414.1978 BMC Infect Dis 14: 663. doi:10.1186/s12879-014-0663-4
Croucher NJ, Page AJ, Connor TR, Delaney AJ, Keane JA, Bentley SD, Parkhill Kruskal WH, Wallis WA. 1952. Use of ranks in one-criterion variance anal-
J, Harris SR. 2015. Rapid phylogenetic analysis of large samples of re- ysis. J Am Stat Assoc 47: 583–621. doi:10.1080/01621459.1952
combinant bacterial whole genome sequences using Gubbins. Nucleic .10483441
Acids Res 43: e15. doi:10.1093/nar/gku1196 Krzywinski M, Schein J, Birol I, Connors J, Gascoyne R, Horsman D, Jones SJ,
Diallo AO, Soeters HM, Yameogo I, Sawadogo G, Aké F, Lingani C, Wang X, Marra MA. 2009. Circos: an information aesthetic for comparative geno-
Bita A, Fall A, Sangaré L, et al. 2017. Bacterial meningitis epidemiology mics. Genome Res 19: 1639–1645. doi:10.1101/gr.092759.109
and return of Neisseria meningitidis serogroup A cases in Burkina Faso in Lees JA, Harris SR, Tonkin-Hill G, Gladstone RA, Lo SW, Weiser JN, Corander
the five years following MenAfriVac mass vaccination campaign. PLoS J, Bentley SD, Croucher NJ. 2019. Fast and flexible bacterial genomic ep-
One 12: e0187466. doi:10.1371/journal.pone.0187466 idemiology with PopPUNK. Genome Res 29: 304–316. doi:10.1101/gr
Diomandé FV, Djingarey MH, Daugla DM, Novak RT, Kristiansen PA, .241455.118
Collard JM, Gamougam K, Kandolo D, Mbakuliyemo N, Mayer L, Li H. 2011. A statistical framework for SNP calling, mutation discovery, as-
et al. 2015. Public health impact after the introduction of PsA-TT: the sociation mapping and population genetical parameter estimation from
first 4 years. Clin Infect Dis 61: S467–S472. doi:10.1093/cid/civ499 sequencing data. Bioinformatics 27: 2987–2993. doi:10.1093/bioinfor
Dunn O. 1964. Multiple comparisons using rank sums. Technometrics 6: matics/btr509
241–252. doi:10.1080/00401706.1964.10490181 Li H. 2013. Aligning sequence reads, clone sequences and assembly contigs
Edgar RC. 2004. MUSCLE: multiple sequence alignment with high accuracy with BWA-MEM. arXiv:1303.3997 [q-bio.GN]. doi:10.6084/M9
and high throughput. Nucleic Acids Res 32: 1792–1797. doi:10.1093/ .FIGSHARE.963153.V1
nar/gkh340 Linz B, Schenker M, Zhu P, Achtman M. 2000. Frequent interspecific genetic
Epping L, Van Tonder AJ, Gladstone RA, The Global Pneumococcal exchange between commensal Neisseriae and Neisseria meningitidis. Mol
Sequencing Consortium, Bentley SD, Page AJ, Keane JA. 2018. SeroBA: Microbiol 36: 1049–1058. doi:10.1046/j.1365-2958.2000.01932.x
rapid high-throughput serotyping of Streptococcus pneumoniae from Maiden MC, Bygraves JA, Feil E, Morelli G, Russell JE, Urwin R, Zhang Q,
whole genome sequence data. Microb Genom 4: e000186. doi:10.1099/ Zhou J, Zurth K, Caugant DA, et al. 1998. Multilocus sequence typing:
mgen.0.000186 a portable approach to the identification of clones within populations
Ezewudo MN, Joseph SJ, Castillo-Ramirez S, Dean D, Del Rio C, Didelot X, of pathogenic microorganisms. Proc Natl Acad Sci 95: 3140–3145.
Dillon JA, Selden RF, Shafer WM, Turingan RS, et al. 2015. Population doi:10.1073/pnas.95.6.3140
structure of Neisseria gonorrhoeae based on whole genome data and its re- Marri PR, Paniscus M, Weyand NJ, Rendón MA, Calton CM, Hernández DR,
lationship with antibiotic resistance. PeerJ 3: e806. doi:10.7717/peerj Higashi DL, Sodergren E, Weinstock GM, Rounsley SD, et al. 2010.
.806 Genome sequencing reveals widespread virulence gene exchange
Felsenstein J. 1974. The evolutionary advantage of recombination. Genetics among human Neisseria species. PLoS One 5: e11835. doi:10.1371/jour
78: 737–756. doi:10.1093/genetics/78.2.737 nal.pone.0011835
10 Genome Research
www.genome.orgYou can also read


