High-resolution imaging of skin deformation shows that afferents from human fingertips signal slip onset - eLife
←
→
Page content transcription
If your browser does not render page correctly, please read the page content below
RESEARCH ARTICLE

                                   High-resolution imaging of skin
                                   deformation shows that afferents from
                                   human fingertips signal slip onset
                                   Benoit P Delhaye1,2*, Ewa Jarocka3, Allan Barrea1,2, Jean-Louis Thonnard1,2,
                                   Benoni Edin3, Philippe Lefèvre1,2
                                   1
                                     Institute of Information and Communication Technologies, Electronics and Applied
                                   Mathematics, Université catholique de Louvain, Louvain-la-Neuve, Belgium;
                                   2
                                     Institute of Neuroscience, Université catholique de Louvain, Brussels, Belgium;
                                   3
                                     Department of Integrative Medical Biology, Umeå University, Umeå, Sweden

                                   Abstract Human tactile afferents provide essential feedback for grasp stability during dexterous
                                   object manipulation. Interacting forces between an object and the fingers induce slip events that
                                   are thought to provide information about grasp stability. To gain insight into this phenomenon, we
                                   made a transparent surface slip against a fixed fingerpad while monitoring skin deformation at the
                                   contact. Using microneurography, we simultaneously recorded the activity of single tactile afferents
                                   innervating the fingertips. This unique combination allowed us to describe how afferents respond
                                   to slip events and to relate their responses to surface deformations taking place inside their
                                   receptive fields. We found that all afferents were sensitive to slip events, but fast-adapting type I
                                   (FA-I) afferents in particular faithfully encoded compressive strain rates resulting from those slips.
                                   Given the high density of FA-I afferents in fingerpads, they are well suited to detect incipient slips
                                   and to provide essential information for the control of grip force during manipulation.

                                   Introduction
*For correspondence:               The most fundamental requirement for dexterous manipulation is the ability to handle objects with-
delhayeben@gmail.com               out slippage and dropping of the object. To ensure that an object is held safely in the hand, one
                                   must apply a sufficient amount of force to the object’s surface to counteract the forces tending to
Competing interests: The
                                   make it slip, for example, the object’s weight and inertia (Johansson and Flanagan, 2009). Exerting
authors declare that no
                                   an excessive grip is inefficient and can result in crushing the object. Inversely, a minimal amount of
competing interests exist.
                                   force is required to avoid slip and is dictated by friction: a stronger grip is required for slippery surfa-
Funding: See page 18               ces and a looser grip is sufficient for sticky surfaces. A good strategy is then to adjust the grip to fric-
Received: 06 November 2020         tion with an amount of force slightly above the minimum. Previous work has suggested that humans
Accepted: 13 April 2021            can quickly and accurately adapt to changes in friction (Westling and Johansson, 1984;
Published: 22 April 2021           Cadoret and Smith, 1996). Importantly, tactile feedback is necessary for grip adjustments to take
Reviewing editor: Cornelius
                                   place as disruption of this feedback abolishes the normal, fine-tuned grasp control and results in fre-
Schwarz,                           quent object dropping despite excessive compensatory grip forces (Westling and Johansson,
                                   1987; Augurelle et al., 2003; Witney et al., 2004). However, how information about friction is
   Copyright Delhaye et al. This
                                   encoded by tactile afferents is largely unknown.
article is distributed under the
                                      Friction information might be partly available at the initial contact. Anecdotal evidence suggests
terms of the Creative Commons
Attribution License, which         that when contacting surfaces of different frictions the strength of the initial burst of activity of the
permits unrestricted use and       afferents varies as the surface is changed (Johansson and Westling, 1987). In these experiments,
redistribution provided that the   however, different frictional conditions were associated with different surface textures and thus do
original author and source are     not necessarily imply that the afferent responses specifically represented friction between the finger-
credited.                          pads and contact surface. Friction might not be encoded per se, but instead, tactile afferents might

Delhaye et al. eLife 2021;10:e64679. DOI: https://doi.org/10.7554/eLife.64679                                                           1 of 21
Research article                                                                                                          Neuroscience

                                   eLife digest Each fingertip hosts thousands of nerve fibers that allow us to handle objects with
                                   great dexterity. These fibers relay the amount of friction between the skin and the item, and the
                                   brain uses this sensory feedback to adjust the grip as necessary. Yet, exactly how tactile nerve fibers
                                   encode information about friction remains largely unknown.
                                       Previous research has suggested that friction might not be recorded per se in nerve signals to the
                                   brain. Instead, fibers in the finger pad might be responding to localized ‘partial slips’ that indicate
                                   an impending loss of grip. Indeed, when lifting an object, fingertips are loaded with a tangential
                                   force that puts strain on the skin, resulting in subtle local deformations. Nerve fibers might be able
                                   to detect these skin changes, prompting the brain to adjust an insecure grip before entirely losing
                                   grasp of an object.
                                       However, technical challenges have made studying the way tactile nerve fibers respond to
                                   slippage and skin strain difficult. For the first time, Delhaye et al. have now investigated how these
                                   fibers respond to and encode information about the strain placed on fingertips as they are loaded
                                   tangentially. A custom-made imaging apparatus was paired with standard electrodes to record the
                                   activity of four different kinds of tactile nerve fibers in participants who had a fingertip placed
                                   against a plate of glass. The imaging focused on revealing changes in skin surface as tangential force
                                   was applied; the electrodes measured impulses from individual nerve fibers from the fingertip. While
                                   all the fibers responded during partial slips, fast-adapting type 1 nerves generated strong responses
                                   that signal a local loss of grip. Recordings showed that these fibers consistently encoded changes in
                                   the skin strain patterns, and were more sensitive to skin compressions related to slippage than to
                                   stretch.
                                       These results show how tactile nerve fibers encode the subtle skin compressions created when
                                   fingers handle objects. The methods developed by Delhaye et al. could further be used to explore
                                   the response properties of tactile nerve fibers, sensory feedback and grip.

                                   respond to short and localized slip events that imply impending slip. There is indeed evidence that
                                   small, short-lasting slips occur during manipulation (Johansson and Westling, 1984). Those slips
                                   trigger strong afferent responses and elicit grip force adjustments (Johansson and Westling, 1987).
                                   In addition to the context of object manipulation, it has also been suggested that tactile slip detec-
                                   tion plays an important role in a range of tactile tasks involving movements of surfaces relative to
                                   the skin (Gueorguiev et al., 2016; Schwarz, 2016).
                                       Tactile slip is not instantaneous but develops progressively (Levesque and Hayward, 2003;
                                   Tada et al., 2006; André et al., 2011; Terekhov and Hayward, 2011; Delhaye et al., 2014;
                                   Barrea et al., 2018). As the surface-tangential force, that is, traction, of the fingerpad increases,
                                   ‘local’ slips begin at the periphery of the contact and progress toward the center until the last cen-
                                   tral ‘stuck’ point finally slips, that is, the instant of a ‘full slip’ or a global slip. We refer to the period
                                   between the beginning of the tangential loading and the instant of a full slip as the partial slip
                                   phase. Such a phenomenon gives rise to substantial local strain patterns in the slipping regions, near
                                   the boundary between the stuck and the slipping points (Delhaye et al., 2016). We hypothesized
                                   that information about these local deformations is carried by tactile afferents that inform the central
                                   nervous system about the contact state.
                                       Single-unit recordings of primary tactile afferents, both in humans and monkeys, have shown that
                                   type I afferents respond strongly to local skin deformation (Johansson et al., 1982; Sripati et al.,
                                   2006; Saal et al., 2017). Those responses contain information about local geometric features such
                                   as edge orientation (Pruszynski and Johansson, 2014; Suresh et al., 2016; Delhaye et al., 2019).
                                   The most common stimuli used to evoke deformation of the skin are indentations and scanning with
                                   embossed geometric patterns or textures. Applying such stimuli makes it possible to relate the
                                   strength or the timing of the response to the topography or the statistics of the stimulus itself, but
                                   does not provide a mechanistic understanding of the nature of the response with respect to the local
                                   skin deformation at the mechanoreceptors themselves. Moreover, it is mostly unknown how tactile
                                   afferents respond to surface strains, that is, strains acting tangentially to the surface (as opposed to
                                   features indented perpendicularly to the skin surface). Afferent recordings in the hairy skin of the

Delhaye et al. eLife 2021;10:e64679. DOI: https://doi.org/10.7554/eLife.64679                                                               2 of 21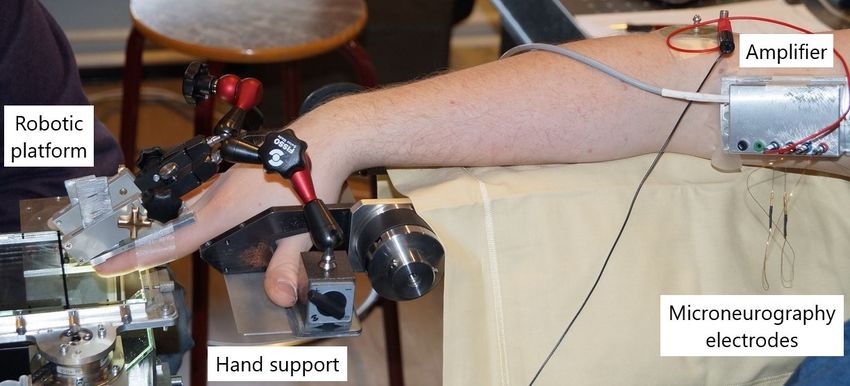
Research article                                                                                                              Neuroscience

                                   human hand have shown that afferents of all types strongly respond to local skin stretch and that the
                                   fast-adapting type I (FA-I) afferents also strongly respond when the stretch is released (Edin, 1992;
                                   Edin, 2004). Slowly-adapting type II (SA-II) afferents are also known to be sensitive to skin stretch,
                                   but relating their response to the exact local stretch pattern is complex given the large size of their
                                   receptive fields. How glabrous skin afferents, that is, those engaged in the contact with objects dur-
                                   ing manipulation, respond to local skin strain has, to our knowledge, never been studied. This is
                                   mainly due to the difficulties of applying well-controlled mechanical stimuli and measuring the strain
                                   at the same time.
                                       To address this, we took advantage of a recently developed imaging system that can measure fin-
                                   gertip skin strain through a transparent material during tangential loading of the fingertip until slip
                                   occurs (Delhaye et al., 2014; Delhaye et al., 2016). While recording local strains with this system,
                                   we simultaneously recorded the activity of human tactile afferents innervating the fingertip
                                   (Figure 1A). This way we were able to relate local strains to responses of afferents with receptive
                                   fields inside the fingerpad contact area. We found that all tactile afferents in the fingertip responded
                                   to slip events, but that FA-I afferents in particular faithfully signaled local skin compressions related
                                   to the progression of slips. We suggest that FA-I afferents are primarily responsible for detecting
                                   changes in surface strains and that their discharges are a primary source of information for the cen-
                                   tral nervous system to, for instance, quickly adjust fingertip forces to different levels of friction.

                                       A

                                       B global                    C                local

                                                                                             exx eyy exy

                                   Figure 1. Experimental setup. (A) A robotic platform (left) was used to move a transparent plate of glass in
                                   contact with the fingerpad while the responses of single tactile afferents were recorded from the median nerve
                                   using microneurography (right). (B) The plate exerted a servo-controlled normal force of 4 N and was moved
                                   tangentially in one of four directions (U: ulnar; D: distal; R: radial; P: proximal). At the same time, a camera was
                                   used to image the contact area. All fingerprint images and strain heatmaps are shown using the same view, with
                                   the ulnar on the right. (C) From the fingerpad images, features (red dots) were sampled and tracked from frame to
                                   frame (the orange arrows show the features motion to the next frame). Features were then triangulated and the
                                   triangle strains were computed, leading to two axial strain components (exx and eyy ) and a shear strain component
                                   (exy ). Lower-right pictograms show how an initial triangle (in yellow) is deformed when experiencing positive
                                   (tensile, in blue) or negative (compressive, in red) strain.

Delhaye et al. eLife 2021;10:e64679. DOI: https://doi.org/10.7554/eLife.64679                                                                   3 of 21
Research article Neuroscience
Results
Slips were applied to the fingerpad using a robotic platform holding a transparent plate of glass
that was either plain, yielding high friction, or covered with a hydrophobic coating yielding a lower
friction. The plate first made contact with the fingerpad (’contact’ in Figure 2A, C) and then moved
tangentially at constant velocity until full slip in one of four different directions: ulnar, distal, radial,
and proximal, and then moved back in the opposite direction until full slip occurred again (forward
and backward, respectively, Figure 1B, Figure 2A, C). The normal component of the force was
servo-controlled to be kept at 4 N, and the tangential component was developed as a consequence
of the tangential movement of the plate. At the same time, we imaged the fingerpad contact and
tracked numerous features on fingertip ridges as the slip progressed (Figure 1C). Finally, the plate
was moved down (’release’ in Figure 2A, C). We were able to precisely monitor skin strains from
frame to frame (i.e., change in strain or strain rates) in the contact area during the transition from a
fully stuck contact to a fully slipping contact (see also Delhaye et al., 2016). The skin strains were
measured in the contact plane and expressed in terms of three independent components: two axial
components aligned to the plate movements (exx and eyy ) and one shear component (exy , Figure 1C).
Importantly noted, the presence of local strains also indicates that the skin is locally slipping. That is,
the limit between the stuck and slipping region is just preceding the front of the strain waves.
Figure 2. Experimental procedures and typical traces. (A) Evolution of the global variables, the plate position (vertical in gray and horizontal in black)
and the contact force (normal in gray and tangential in black), together with the afferent instantaneous firing rate (and the spikes) as a function of time
for a typical fast-adapting type I (FA-I) unit in the high friction condition. The plate was pressed against the fingerpad (‘contact’), moved tangentially
forward until the occurrence of a full slip, then moved backward, and finally retracted (‘release’). The partial slip phase is highlighted by the gray vertical
boxes. Five repetitions are overlaid. The tangential movement was split into three phases: onset (lasting 100 ms), partial slip, and plateau. (B) Heatmaps
of the evolution of the local surface strain rates in the contact area as a function of time during the tangential loading, for one of the five repetitions.
The three strain components, axial along x and y, and shearing, are shown (colored triangles depict the deformation axes). Compression (negative
strain) is in red. The location of the unit receptive field center is shown with a blue circle on the raw fingerpad image on the bottom left. (C, D) Same as
in (A, B) for a typical slowly-adapting type I (SA-I) unit. For both units, insets show recorded, superimposed action potentials and their average shape
represented by a dark line.
The online version of this article includes the following figure supplement(s) for figure 2:
Figure supplement 1. Instantaneous firing rate as a function of time for all units recorded and all conditions.
Figure supplement 2. Correlation of firing rates with contact forces.
Delhaye et al. eLife 2021;10:e64679. DOI: https://doi.org/10.7554/eLife.64679 4 of 21Research article Neuroscience
We focused the analyses on tangential loading movements, from the moment when the plate
started to move tangentially and until it completed a forward or a backward movement. Each tan-
gential loading movement was split into three sequential phases defined as follows: (1) the move-
ment onset phase arbitrarily defined as the initial 100 ms; (2) the partial slip phase that lasted until
the tangential force reached a plateau and the finger fully slipped; and (3) the plateau phase during
which the finger was fully slipping against the glass surface and that lasted until the end of the tan-
gential movement (Figure 2A, C). Strain changes were observed in the contact area during the par-
tial slip phase in the form of two waves of opposite signs (Figure 2B, D). Remember that the strain
wavefront is where the slip starts to occur. Those waves started moving at the onset of movement
from opposite sides and from the periphery of the contact toward the center and disappeared at
the point of full slip (Delhaye et al., 2016). Once the full slip was reached, the changes in strain
faded away. The components of the strain changes corresponding to the direction of the plate
movement were the largest in amplitude (Figure 2B, D, circled by a black box). Different movement
directions elicited different patterns (i.e., compression, stretch, or shear) at all points in the contact
area. For instance, the receptive field of a given afferent could be stretched along the proximal-dis-
tal axis for movements in the distal direction but compressed along the same axis for movements in
the opposite (i.e., proximal) direction (Figure 2B, eyy ).
Tactile afferents strongly respond during partial slip
We used microneurography (Vallbo and Hagbarth, 1968) to record the activity of single units whose
receptive fields were located at the fingertip (Figure 1A). We focused on FA-I and SA-I afferents,
which respond to local deformation events and have small, well-defined receptive fields
(Johansson and Vallbo, 1983). We also recorded from a few type II afferents (FA-II and SA-II). Suffi-
cient recordings for data analysis (three out of five repetitions of each plate move direction) were
obtained from 22 afferents (13 FA-I, 6 SA-I, 2 SA-II, and 1 FA-II). The locations of the receptive fields
of all afferents are depicted in Figure 2—figure supplement 1. As expected, the afferents
responded vigorously to contact (Figure 2, ‘contact’), but also responded in a variety of ways to the
tangential loading (Figure 2, ‘forward’ and ‘backward’). First, we looked at the overall discharge pat-
tern of the afferents. FA-I units showed a phasic response, with a burst of activity at the instant of
contact, and another one during the tangential loading (e.g., Figure 2A). However, a majority of
FA-I afferents responded mostly only during the partial slip phase, showing no or almost no
response during the start (‘onset’ phase) and the end (‘plateau’ phase) of the tangential movement
(for U115-04 in Figure 2A, there was one spike
at the onset phase during one repeat). SA-I units
instead presented a rather tonic response begin-
ning at the initial contact that changed during
the tangential loading phase by increasing or
decreasing their firing rates (e.g., Figure 2C).
The discharge patterns of all recorded afferents
for all directions and frictions are reported in
Figure 2—figure supplement 1. Video 1 and
Video 2 show image recordings of the fingerpad
during one trial, together with spike sound asso-
ciated with the afferent responses, for the two
example units shown in Figure 2.
Note that the tangential movement of the
plate led to slight fluctuations in the normal
force that could not be suppressed by the force
controller (see Materials and methods). Those
fluctuations did not evoke strong afferent
responses. Indeed, the discharge rates were nei-
ther correlated to the normal force nor to its
derivative (Figure 2—figure supplement 2). In Video 1. Image recordings of the fingerpad during one
fact, we considered a causal relationship untena- trial (distal, high friction), together with spike sound
ble observing in Figure 2A that the afferent dis- associated with the afferent responses (unit 115-04).
charge seemed to follow the normal force https://elifesciences.org/articles/64679#video1
Delhaye et al. eLife 2021;10:e64679. DOI: https://doi.org/10.7554/eLife.64679 5 of 21Research article Neuroscience
fluctuation by ~100 ms in the distal direction but
preceded it by ~200 ms in the proximal
direction.
First, we describe how the tactile afferent
responded with respect to ‘global’ stimulus
parameters such as the movement phase or
direction. Afferents were more active during the
partial slip phase than during the two other tan-
gential loading phases (i.e., onset and plateau),
suggesting that this period is key to the afferent
responses (Figure 3A). Indeed, for all four affer-
ent types, the fraction of trials during which the
afferent responded with at least one spike was
higher for the partial slip phase than for the two
others (one-way ANOVA with repeated meas-
ures, F(2,24) = 47.05, pResearch article Neuroscience
1
A FA-I SA-I SA-II FA-II
n=13 n=6 n=2 n=1
Fraction trials
0.8
0.6
plateau
plateau
plateau
plateau
0.4
partial
partial
partial
partial
onset
onset
onset
onset
0.2
0
B
mean FR [Hz]
20 40 20 0.8
0.6
10 20 10 0.4
0.2
0 0 0 0
N E S W N E S W N E S W N E S W
Direction w.r.t. preferred (=North)
C D E
40 40
# neurons
10
Bwd [Hz]
Low [Hz]
P
5 P 20 20
R
U D P
0 U D R 0 0
SAII
FAI
FAII
SAI
0 20 40 0 20 40
Fwd [Hz] High [Hz]
Figure 3. Properties of afferents’ responses during tangential loading. (A) The afferents were mostly active during
the partial slip phase. The fraction of trials during which the afferents were active for each phase of the tangential
loading (onset, partial, and plateau) for the forward and backward movements. Bars show the average across units,
and the lines show individual afferents (n = 13, 6, 2, and 1 for fast-adapting type I [FA-I], slowly-adapting type
I [SA-I], slowly-adapting type II [SA-II], and fast-adapting type II [FA-II], respectively). (B) Afferents discharge more
in a given direction. Mean firing rates elicited by partial slip as a function of angle with respect to the preferred
direction (‘North’) for each unit. Each line shows a different afferent, and the mean firing rate was averaged across
repetitions, movements (‘fwd’ or ‘bwd’), and frictions. (C) Distribution of the afferent preferred global direction for
each afferent type. (D) Mean firing rate for backward versus forward movements. One data point is shown for each
afferent (n = 22) and each condition (8 = 4 direction 2 friction) and averaged across repetition. The dashed gray
line is the slope = 1. (E) Mean firing rate for low versus high friction. One data point is shown for each afferent
(n = 22) and each condition (8 = 4 directions 2 forward-backward) and averaged across repetition. The black line
is the least square regression, and the dashed gray line is the slope = 1.
took place earlier, coinciding with the strain changes. This is even easier to observe for the backward
movement (Figure 4B, right). In this case, due to the previous loading, the movement of the com-
pressive wave came even earlier when the low friction condition was used and the discharge burst of
the afferent coincided. Finally, we observed that the response evoked by a stretch wave, generated
by a distal movement (Figure 4A, right, and B, left), was much weaker than its compressive counter-
part. Still, the timing of the response was perfectly synchronized with the occurrence of the stretch
in the receptive field. Note that a short burst was elicited at the onset of the movement in the distal
direction in the backward case (Figure 4A, right). Such transient burst cannot be explained by our
strain measurements and occurred in a small fraction of the trials and only in a few afferents
(Figure 3A). Also note that part of the unit receptive field lost contact during the partial slip phase
in the high friction case.
To test the hypothesis that the responses of the tactile afferents are caused by specific ‘local’
strain patterns taking place inside the contact area, we took two different approaches. In the first
model-free approach, we looked at the strain pattern observed at the time of each spike across all
stimulus directions and frictions and computed a ‘spike-triggered average’ (STA, see
Delhaye et al. eLife 2021;10:e64679. DOI: https://doi.org/10.7554/eLife.64679 7 of 21Research article Neuroscience
Figure 4. Fast-adapting type I (FA-I) responses during partial slip are related to local strain rates. (A) Evolution of
tangential force, afferent instantaneous firing rate (together with the spikes), and strain rates as a function of time
during tangential loading in the proximal direction (forward) followed by a distal movement (backward). Data are
shown for two different frictions, high in black and low in gray, and are aligned on the onset of movement. Five
repetitions are shown, except for the strains for which one trial is shown. The compressive strain (negative) is in
red. The color of the contact area contour indicates the friction condition, and the gray circle shows the location of
the afferent receptive field. The horizontal lines between the heatmaps depict the partial slip phase as shown in
Figure 2. (B) Same as in (A) but for distal movement (forward) followed by a proximal movement (backward). Inset
shows recorded, superimposed action potentials and their average shape represented by a dark line.
Materials and methods) for all recorded FA-I and SA-I units. If the afferents with a receptive field in
the contact area responded to local strains, we expected to observe a clear strain pattern associated
with these units’ discharges. In contrast, for afferents with a receptive field outside the contact area,
we expected no clear strain pattern at all. First, we used the strain rate norm (||e||) as a variable to
estimate the STA. We found that, indeed, the average strains causing spikes in all recorded FA-I
afferents had a clear, more or less annular (ring-like) pattern (Figure 5A). Such an annular pattern is
expected from the stimulus, which is a strain wave in the form of an annulus and does not reflect the
shape of the afferent receptive field but rather the correlations present in the strain patterns
(Materials and methods). Importantly, however, the pattern overlapped the afferent’s receptive field
and often peaked inside it. Furthermore, as expected, we did not observe such a clear pattern for
the afferents having their receptive field outside the contact area (Figure 5, middle). Strikingly, clear
patterns did not emerge for the SA-I afferents, suggesting that those afferents are less sensitive to
the local surface strain changes (Figure 5A, bottom). Note that we repeated the same analysis using
the total (cumulative) strain instead of the strain changes, and that again, we did not observe any
clear pattern. The peak values of the STA are shown in Figure 5B in orange and show strong values
Delhaye et al. eLife 2021;10:e64679. DOI: https://doi.org/10.7554/eLife.64679 8 of 21Research article Neuroscience
A FA-I inside 1 C U104-02
STA of ||e|| [-]
FA-I
exx
0.5
50 %/s
eyy
U104-02 U105-03 U107-05 U109-03 U110-03 U115-04 0
FA-I border FA-I outside
exy
High friction Low friction
U101-01 U109-04 U112-04 U107-04 U113-01 U115-01 U115-02
SA-I inside SA-I border SA-I out
Actual
50 Hz
U103-03 U111-01 U103-02 U110-06 U116-02 U116-06
1s
B 150 0.6
STA of ||e|| [%/s]
cross-val R 2 [-]
100 0.4 Predicted
50 Hz
50 0.2
0 0 fwd bwd fwd bwd fwd bwd fwd bwd
in border out in border out ulnar distal radial proximal
FA-I SA-I
Figure 5. Afferent responses to surface skin strains. (A) Heatmaps of the spike-triggered average (STA, in orange) for the fast-adapting type I (FA-I)
units inside the contact area (top row), the other FA-I units (middle row), and the slowly-adapting type I (SA-I) units (bottom row). The STA matrices
were obtained from the norm of the strain (kek) and normalized to the maximal value (reported in B). The gray contour shows the initial contact area,
and the pink contour depicts the parts of the contact area that remained in contact for at least 50% of the partial slip phase. The black circle is the unit
receptive field. (B) STA peak value (red) and linear regression model performance (green). For units in or on the border of the contact area, the
maximum was taken inside the receptive field. For units outside the contact area, the maximum was taken anywhere inside the contact area. The STA of
some units were undefined over the whole contact area (see Materials and methods); those units are not shown. The unit shown in (C) is highlighted
with a black circle. (C) Time evolution of the strain rates inside the receptive field, the actual firing rate (represented as spike events convolved with a
Gaussian kernel, see Materials and methods), and the predicted firing rate of an example unit during partial slip for each direction and each friction
(black is high friction, gray is low friction).
The online version of this article includes the following figure supplement(s) for figure 5:
Figure supplement 1. The same heatmaps as in Figure 5A but showing the spike-triggered average (STA) for the two principal strain rates (e1,
compressive, and e2, tensile).
Figure supplement 2. The same heatmaps as in Figure 5A but showing R2 for friction, direction, and forward/backward cross-validation methods.
for FA-I units inside the contact and much weaker values for other afferents, confirming the previous
observations. The same STA analysis was repeated using the two principal strain components, one
compressive and one tensile, separately to build two STA maps (see Materials and method). The
results obtained are consistent with the STA obtained with strain rate norm, that is, that a clear pat-
tern emerges only for FA-I afferents and that the STA peaks in the afferent receptive field (Figure 5—
figure supplement 1). Moreover, we found that the compressive STA peaks were generally larger
and more often found in the afferent receptive field than their tensile counterpart, suggesting that
FA-I afferents are more sensitive to compression. This finding will be further supported in the next
section.
In the second, model-based approach, we aimed to predict the afferent discharge rate from the
skin strain measured in the contact area. Inspection of the data led us to assume that, first, strains of
Delhaye et al. eLife 2021;10:e64679. DOI: https://doi.org/10.7554/eLife.64679 9 of 21Research article Neuroscience
opposite signs might not contribute in the same manner to the discharge as skin stretch seemed to
evoke weaker responses than skin compression (Figure 4). Second, multiple components might be
needed to explain responses in all directions. Therefore, we first set out to test if the afferents’ firing
patterns could be reliably predicted for the skin strains using a model with six distinct predictors,
that is, the three strain components each half-wave rectified, using both the positive (stretch) and
negative part (compression). The simplest model possible, a multiple linear regression including an
intercept, was used. Our method was cross-validated, such that the regression models were fit on
one friction condition and tested on the other (Materials and methods). In the subsequent valida-
tions, we used data from different directions and forward vs. backward movements and observed
quantitatively similar results (see Figure 5—figure supplement 2). The results obtained using the
model-based approach revealed similar trends as the first model-free method. The linear model
could predict the discharge pattern of the FA-I afferents, but not the SA-I afferents. Heatmaps built
from the cross-validated R2 (Figure 5—figure supplement 2) were qualitatively similar to those built
from the STA. An example unit is shown in Figure 5C for an afferent with a substantial R2 (0.66). This
unit maximally responded in the proximal direction, when a compressive wave was observed in its
receptive field. The maximal values of the R2 found within the receptive field (or anywhere for the
afferents outside the contact area) are shown in Figure 5B in green. As with the model-free
approach, only the firing rates of FA-I inside the contact area could be predicted from the strain.
The high R2 value for the SA-I afferent outside the contact area is because this particular afferent
was either active at a constant firing rate or silent, generating two separate clouds of data points
and thus driving up the R2 (Figure 2—figure supplement 1).
In summary, we observed that FA-I afferents respond to local strain patterns generated during
partial slips.
Aspects of the skin strain rates encoded by the FA-I afferents
Having demonstrated that the recorded FA-I afferents respond to local strain patterns, we then
sought to uncover what aspects of the strains were responsible for these responses. To that end, we
aimed to predict FA-I afferent discharge rates with a subset of strain predictors and to compare their
performance to the full model with six predictors. The analysis was performed only on the FA-I affer-
ents for which we had optical measurements of the strains, that is, those having their receptive fields
inside the contact area (n = 6, all shown in the top line of Figure 5A). Since all models are cross-vali-
dated, they can be compared irrespective of the number of predictors. First, we selected three sin-
gle predictors that were invariant to the choice of a particular reference frame. The strain norm,
informative about the intensity but neither the orientation nor the sign of the deformation, and the
two principal strain components separately, the compressive (e1 ) and the tensile (e2 ), obtained from
single-value decomposition of the strain tensor (Materials and methods), informative about the inten-
sity and the sign of the deformation, irrespective of the orientation of the deformation. All those
three single predictor models performed worse than the full model, as could be expected
(Figure 6A, left). However, we found that the compressive principal component always outper-
formed the tensile one, suggesting that the afferents are more sensitive to compression than to
stretch.
Next, we used each of the predictors of the full model separately. That is, the half-wave rectified
positive and negative value of the three strain tensor components (exx , eyy , and exy ). Given that those
components are dependent on the choice of a particular reference frame orientation, we repeated
the fitting procedure for multiple rotations of the reference frame equally spaced from 0 to 90˚
(Materials and methods). The results are shown in Figure 6B for an exemplar afferent, with the shear
component ignored. In this figure, the performance of the prediction (R2) based on a single strain
component (compressive in red and tensile in blue) is shown as a function of the reference frame
rotation. This afferent seemed to have a preferred strain orientation close to 90˚ with respect to the
radial-ulnar axis (i.e., along the proximal-distal axis), where the compressive component peaks. That
is, the afferent seemed to encode preferentially ’local’ compressive strain rate along a particular ori-
entation. Indeed, as already described in Figure 4, this unit was responding strongly in the proximal
condition, where a compressive strain wave along the proximal-distal orientation passed through its
receptive field. Perpendicular to that orientation, the tensile component peaked as well but with a
lower R2. This is expected since compression in one orientation generates stretch in the other at the
same time because the volume is mostly conserved. The same plot as in Figure 6B is provided for
Delhaye et al. eLife 2021;10:e64679. DOI: https://doi.org/10.7554/eLife.64679 10 of 21Research article Neuroscience
A orientation along best B
invariants orientation
cross-val R 2 w.r.t. full model [-]
0
Dist-Prox compression
90 stretch
120 60
-0.2
150 30
-0.4
180 0 - Rad-Uln
-0.6 0 0.2 0.42 0.6
cross-val R
U104-02 FAI
||
st pr
e1
e2
h
||e
tc
m
re
co
Figure 6. Aspect of the skin strain encoded by the fast-adapting type I (FA-I) afferents inside the contact area. (A)
Firing rate prediction performance (cross-validated R2) for different models with respect to the full model
comprising six predictors (0 on the y-axis corresponds to the full model performance, lower is worse). The three
first models (kek, e1 , and e2 ) are single predictors and rotation invariant. The two last models (compression and
stretch) have one component, and the performance obtained with the best orientation is shown. The unit shown in
(B) is highlighted with a black line. (B) Polar plot showing the performance of the prediction (cross-validated R2) of
linear models based on single strain components (red for compression and blue for stretch) as a function of the
rotation angle of the reference frame (from 0 to 90˚) with respect to the radial-ulnar axis (0˚). Data from an example
afferent U104-02. The black lines show the frame rotation that yields the best performance (maximizing the sum of
the R2 of the compressive and tensile models).
The online version of this article includes the following figure supplement(s) for figure 6:
Figure supplement 1. The same polar plots as Figure 6B but for all units and all cross-validation methods.
Figure supplement 2. Relation between preferred strain rate orientation and fingerprint ridges orientation.
all FA-I afferents and the three cross-validation methods in Figure 6—figure supplement 1. It is
important to avoid the confusion between the units’ preferred direction described in Figure 3, which
relates to the robot movement direction and the maximal firing rate of the afferent, and the strain
orientation preference described here, which is related to the orientation of the local deformation in
the afferent receptive field.
From these analyses, we draw two important conclusions. First, compressive strain change is a
more effective stimulus than tensile strain change (Figure 6A, right), confirming the observation in
the principal component analyses, namely, that the FA-I responses are mostly driven by compres-
sion. Second, FA-I afferents did not respond to compression in any orientation but rather to com-
pression along a certain preferred strain orientation. The argument for this is twofold: (1) the
performance of a single compressive component in a particular orientation was always higher than
the performance of the compressive principal component e1 (Figure 6A) and (2) models with one
single component along its preferred strain orientation performed as well as the full model compris-
ing all the components, suggesting that this component is mainly responsible for driving the afferent
response. Note that the FA-I afferents’ preferred strain orientation seemed to coincide with the local
fingerprint orientation, but more data is needed to confirm this trend (Figure 2—figure supplement
2, correlation r = 0.74, p=0.10, n = 6).
In sum, our analyses strongly suggest that the FA-I are sensitive to local skin strains, more so to
changes in compressive strain than tensile strain and that they respond maximally along a preferred
strain orientation.
SA-I and SA-II responses are related to external forces
Finally, we asked how much the response of all types of afferents was related to the ‘global’ external
3D force vector. We computed the correlation between the afferent firing rates and each force
Delhaye et al. eLife 2021;10:e64679. DOI: https://doi.org/10.7554/eLife.64679 11 of 21Research article Neuroscience
components during the tangential loading (all three phases). We also computed the same correla-
tions with the force rates. We found low correlation values for both force and force rates for the
fast-adapting afferents (FA-I and FA-II). However, the correlations with tangential (horizontal) forces
were high for slowly-adapting afferents (SA-I and SA-II), especially for those not inside the contact
area (Figure 2—figure supplement 2). Their firing rates were however not related to the small verti-
cal (normal) force fluctuations.
Discussion
This is, to our knowledge, the first study that investigates the relationship between the responses of
tactile afferents to slippage and the detailed surface strain patterns in glabrous skin. Specifically, the
results from our analyses imply that the local compression induced by partial slip generates strong
responses from FA-I but not SA-I units. Given that the FA-I from the fingertip are mostly silent when
the fingerpad is stuck to the object and even at the onset and offset of the plate movement, their
vigorous responses to the changes in compressive strain provide a particularly salient signal that ena-
bles contact stability. It is reasonable to suspect that FA-I afferents play a crucial role in maintaining
grasp stability since they constitute more than 50% of all afferents in the glabrous skin of a human
fingertips (Johansson and Vallbo, 1979). Our results show that while partial slips give rise to strong
responses, the friction per se is poorly encoded by FA-I. Finally, given that cortical somatosensory
neurons are strong edge detectors (DiCarlo et al., 1998; Delhaye et al., 2018), the particularly
salient signal from the FA-I afferents will likely be amplified downstream.
A previous study showed that information about grip safety, that is, the increment of tangential
force needed to reach full slip, is present in the response of local tactile afferents at the level of a
population of afferents, irrespective of the level of friction (Khamis et al., 2014). Given that all affer-
ents respond to progressing slips, and that the timing of each FA-I afferent’s burst is dependent on
how far from the center of contact the afferent is, it is not surprising that a linear combination of
multiple FA-I units can provide a good estimate of the grip safety. While this previous study demon-
strated that the information is present in the response of the population, our approach provides a
mechanistic explanation and underlines the saliency of the grip safety signal.
An essential component of this work was the use of two different frictions. By using the same pro-
tocol with two different frictions, we were able to disambiguate the relative contribution of the
external force and the local strain measurements to the afferent response. Indeed, until an instant
very close to full slip in the low friction condition, the low and high friction materials lead to very sim-
ilar normal and tangential force profiles, whereas the surface strain patterns inside the contact area
have different timing and their progressions differ very early on. Thanks to this contrast, uniquely
provided by the difference in friction, the earlier afferent response in the case of the low friction can-
not be attributed to the change in tangential force itself. The fact that the afferent responses, partic-
ularly the FA-I units, are related to local slip and are therefore poor predictors of friction per se
suggests that humans could be exquisitely sensitive to detect slip while being poor at estimating
friction. That is, estimating friction would require the occurrence of partial slips, and the absence of
slips would make such estimates impossible.
The FA-I afferent responses were best predicted by compressive strain, rather than tensile strain.
Moreover, the afferents were mostly sensitive to a particular strain orientation. This property might
be explained by the shape of the afferent receptive fields, which is elongated (rather than circular)
and contains numerous zones of high sensitivity (‘hot spots’, Johansson, 1978; Phillips et al., 1990;
Jarocka et al., 2021). A particular arrangement of those hot spots might lead to increased sensitivity
to a particular strain orientation. Indeed, it has been demonstrated that particular arrangements
enable each afferent to differentiate the orientation of edges moving across the receptive fields
from the strength or the fine timing of their response (Pruszynski and Johansson, 2014;
Suresh et al., 2016). In fact, the moving strain wave related to partial slip observed in this study can
be seen as an edge moving across the contact area.
Limitations
Our methods generate high-resolution representations of the distribution of surface strain in the
contact area of the fingertip (i.e., 2D, x and y axes) but do not allow measurements of the distribu-
tion of the deformations perpendicular to the fingertip surface inside the contact area (i.e., along
Delhaye et al. eLife 2021;10:e64679. DOI: https://doi.org/10.7554/eLife.64679 12 of 21Research article Neuroscience
the z-axis), nor outside the contact area. Given that the SA-I afferents did not respond to the surface
deformation measured in this study, they could be sensitive to two other non-measured aspects of
the local deformations. First, since SA-I afferents are known to be exquisitely sensitive to contact
and contact pressure (Goodwin and Wheat, 1999; Wheat et al., 2010; Khamis et al., 2015), they
may be more sensitive to the strains perpendicular to the surface, rather than the tangential (i.e., pla-
nar) strains. Indeed, the tangential loading can cause a progressive redistribution of the pressure
inside the contact area (even if the global normal force is maintained constant) that will consequently
generate ‘local’ vertical strains (not measured, which would be denoted ‘ezz’). The SA-I shows slow
firing rate variations that might be well attributed to a relatively slow movement of the center of
pressure during tangential loading that results in local pressure change. Another possibility is that
the SA-I afferents are sensitive to local shear (which would be denoted ‘exz’ and ‘eyz’). The fact that
their firing rates correlate with the tangential forces supports this idea, and more measurements are
needed to disentangle the two possibilities. Importantly, these two other aspects of skin deforma-
tions are likely much less informative about the partial slip state of the finger; therefore, SA-I affer-
ents are less likely to contribute to the detection of the slip events. When considering the subdermal
location of SA-II and FA-II afferent terminals, it is not surprising to observe a poor coupling between
their responses and the measured surface strains.
The tangential speed chosen for practical reasons in our experiments is certainly lower than
that during normal manipulation actions, during which much higher strain rates are probably gener-
ated. In fact, it is unknown what the typical amplitudes of surface skin strain during manipulation are.
Moreover, during active manipulation, humans typically also vary the amount of grip (normal) force
according to the tangential force, while our experiment kept the normal force constant. The devel-
opment of a manipulandum equipped with embedded imaging of skin deformation in the contact
area will make it possible to quantify deformation in an ideal environment with both normal and tan-
gential force fluctuations (Barrea et al., 2017). Nevertheless, it is reasonable to expect that FA-I
afferents respond even more vigorously during actual manipulation. It remains also to be demon-
strated that in a typical manipulation task the timing of this signal enables online control of grip,
that is, that there is enough time to react. In this study, the partial slip phase lasts several hundreds
of milliseconds, which would definitely leave enough time for cutaneous signals to contribute to
online control.
Most surfaces encountered during natural object manipulation have frictional properties that
cause stick-and-slip when the tangential load is sufficiently large, that is, local breaking of the bond
between the surface and even a single fingerprint ridge. However, stick-and-slip events were largely
absent in our experiment because we had to use a flat and transparent material to be able to mea-
sure skin surface deformations. With natural material, partial slip might therefore occur in a stepwise
manner and result in readily measurable accelerations (Johansson and Westling, 1984;
Johansson and Westling, 1987), as opposed to a very smooth progressive wave observed in our
experiments. Nevertheless, while the timing might be affected, the patterns of deformation
observed in their purest form in this study will generalize in some form to other surfaces and there-
fore the observations made in our study are likely to hold with natural materials.
There are several reasons why the models’ R2 are relatively low. First, the models are linear,
whereas the response of tactile afferents to skin deformations is known to be far more complex than
accounted for by simple linear relationships (Dong et al., 2013; Saal et al., 2017). Second, the
inputs of the model were obtained from a single point inside the receptive field of the afferent. Yet,
we know that human tactile afferents have complex receptive fields with multiple zones of sensitivity
that they owe to the branching of the afferent terminals in the skin (Johansson, 1976; Phillips et al.,
1992; Pruszynski and Johansson, 2014). A richer stimulus using more stimulation conditions (tan-
gential speeds, normal forces, more orientations) to reduce the effect of the correlations inherently
present in the strain pattern might provide sufficient data to identify multiple zones of sensitivity,
using the STA approach developed in this study. However, combining our stimulus with another one
dedicated to identifying such receptive field topography (Jarocka et al., 2021) would be needed to
establish a causal relationship between the two. Finally, our setup does not provide the ability to
measure all aspects of local skin deformation as discussed above; we were unable to measure defor-
mations along the axis normal to the glass surface. Analyses of strain normal to the contact surface
and deformations outside the contact area would require other approaches, for example, finite ele-
ment analysis.
Delhaye et al. eLife 2021;10:e64679. DOI: https://doi.org/10.7554/eLife.64679 13 of 21Research article Neuroscience
Conclusion
Our sense of touch enables us to grasp and manipulate objects with great dexterity. The ability to
capture and extract very subtle mechanical phenomena arising continuously during fine manipulation
is probably a key to its success. We have demonstrated in this study that subtle skin compressions
taking place in the contact area with the object’s surface before the slippage provide essential feed-
back for grasp stability. Given that estimating friction is a complex problem influenced by many fac-
tors of the object itself (texture, adhesion, hydrophilic or hydrophobic properties) and by properties
of the skin (for instance, stiffness), some of which are constantly changing (e.g., humidity), the nature
of this feedback and its independence from friction makes it particularly well suited for grasp
stability.
Materials and methods
Participants
Sixteen healthy human subjects (seven females; ages 19–24 years) participated in the experiment.
Each subject provided written informed consent to the procedures, and the study was approved by
the local ethics committee at the host institution (Université catholique de Louvain, Brussels, Bel-
gium). Subjects were seated in a comfortable dentist chair with the forearm slightly pronated and
abducted. The forearm was resting on a horizontal cushioned support. The right hand, with the volar
side facing the ground, was fixed to a custom-made support (Figure 1A), which enabled to lock one
finger while keeping the rest of the fingers away in a safe position. The participant’s fingers were sta-
bilized by gluing the nail of digit II and III to aluminum bars using cyanoacrylate and connecting the
bars rigidly with the custom-made support. Such fixation hindered finger movement during the stim-
ulation but allowed fingertip deformation due to the compliance of the fingerpad.
Apparatus
The stimulations were applied by a robotic platform based on an industrial robot, as already
described in previous studies (Delhaye et al., 2014; Delhaye et al., 2016; Barrea et al., 2018).
Briefly, a transparent plate was mounted horizontally on the end effector of an industrial robot
(Denso Robotics, Japan) and its movement in three orthogonal directions could be controlled pre-
cisely. Two force transducers were mounted, one on each side of the plate, and measured the forces
applied to the subject’s fingertip (ATI force sensors, ATI Industrial Automation, USA). The measured
RMS error of the force measurement was low (ranging 0.01–0.02 N along the tangential axes and
0.03–0.06 N along the vertical axis). The stimulus was applied to the finger where the receptive field
of the recorded afferent was located. The relative angle between the stimulus and the finger was
around 30˚. The transparent plate consisted of smooth glass and was either plain or covered with a
hydrophobic coating, RainOff (Arexons, Italy) reducing friction. The robot followed a programmed
tangential (horizontal) trajectory with the help of the manufactory position controller. A custom PID
controller was developed to servo-control the normal (vertical) force applied to the fingerpad by
feeding back the force measurements (average RMS error is 5% during the whole tangential loading,
and average peak error is 12% or 0.5 N).
The robot was combined with a custom-made fingerprint imaging apparatus composed of a high-
speed (50 fps) and high-resolution (1200 dpi) camera (Mikrotron MC1362, 1280 1024 pixels, Mik-
rotron GmbH, Germany) and a coaxial light source (White LED Backlight, Phlox, France). This optical
apparatus enabled imaging of fingerprints in contact with the transparent stimuli to compute strains
in the fingertip contact, as described in Delhaye et al., 2016.
Experimental procedures
We used the microneurographic technique (Vallbo and Hagbarth, 1968) to record single skin affer-
ent activity (‘unit’). An insulated tungsten needle electrode was percutaneously inserted into the
right median nerve ~10 cm proximal to the elbow joint (Figure 1A). Once the recording electrode
was in an intraneural position, it was manipulated in minute steps until single-unit activity clearly
stood up from the background noise. To evoke the responses of the afferents, the relevant skin
areas of the fingertips were stimulated. Once a single afferent activity was identified and a corre-
sponding receptive field located, the threshold force for the receptor was determined using von
Delhaye et al. eLife 2021;10:e64679. DOI: https://doi.org/10.7554/eLife.64679 14 of 21Research article Neuroscience
Frey hairs. According to well-known criteria (Vallbo and Johansson, 1984), receptors were identified
as slowly-adapting (SA) if the discharge was sustained while pressing with a glass probe for at least 2
s; otherwise, they were considered fast-adapting (FA). The type I units have small, easily located
receptive fields, whereas type II units are characterized by large and poorly defined receptive fields.
Furthermore, SA-II could be distinguished from SA-I by the regularity of their inter-spike intervals,
and FA-II units from FA-I by their response to remote light taps. Once the spot with the highest sen-
sitivity within the receptive field had been marked with a permanent marker, the experimental pro-
cedure was initiated. The afferent search was voluntarily biased toward type I afferents because of
their relatively small receptive field, which makes them more likely to respond precisely to the local
strain patterns recorded within the fingertip contact.
While recording impulses from single tactile afferents innervating the right index or middle finger
of subjects, the stimulus was moved vertically toward the fingerpad in single trials, made contact,
and reached a preset normal force of 4 N (‘contact’ phase). That normal force was kept constant dur-
ing the entire trial. After a delay of 1.2 s, which was necessary to induce occlusion and make the con-
tact visible on the camera (Dzidek et al., 2017), the surface was moved tangentially (horizontally)
with a constant speed (5.5 mm/s) first in one direction (ulnar, radial, distal, or proximal) for 8 mm
(‘forward’ movement) and then in the opposite direction for 12 mm (‘backward’ movement)
(Figure 1B). The relatively slow tangential speed is explained by two reasons. First, since our optical
system has a limited frame rate (50 Hz), we wanted to have a relatively slow stick-to-slip transition
such that it was accurately measured by the imaging system. Second, the normal force servo-control
was more effective at low speed. The movement amplitudes were thus large enough to ensure even-
tually full sliding between the fingertip and the surface in both directions. The surface was then
retracted from the finger, and the trial was ended. The procedure was the same for all trials. Each
protocol consisted of five repetitions of the four stimulation directions for each of the two friction
conditions, totalizing 40 trials (2 frictions 4 directions 5 repetitions). For practical reasons, the
same sequential order was used for all protocols: all high friction trials (on plain glass) were run first,
followed by all low friction trials (on coated glass). Moreover, the direction sequence was always the
following: ulnar, distal, radial, and proximal, with all five repetitions made in a row.
Plate position and forces exerted on the finger were sampled at 1 kHz along the three axes
(PCIe-1433, National Instruments, and LabVIEW). Fingerprint deformations were monitored through
the transparent plate during the tangential movement of the platform, allowing the derivation of sur-
face strains at the fingertip contact. The neural signals were sampled at 12.8 kHz after amplification
close to the recording site. The identification of single action potentials was made semiautomatically
under visual control (Edin et al., 1988). WINSC/WINZOOM software (Umeå University, Sweden) was
used for recording and analyzing the neural data. The instantaneous firing rate (as shown in Figures 2
and 4) was defined as the inverse of the time interval between two consecutive spikes for the interval
duration. This rate was resampled at 1 kHz to obtain convenient time series for data analysis.
Image processing
For each trial, strains in the contact area were computed from the images as described in
Delhaye et al., 2016 (Figure 1C). Briefly, the contact region was first extracted semiautomatically
from each image of the sequence. Second, equally spaced features were sampled in the contact
area of the initial frame and then tracked from frame to frame to measure the displacement field in
the contact using the optical flow technique (Lucas and Kanade, 1981) implemented in the OpenCV
online computer vision toolbox (Bradski, 2008). Third, the tracked features were triangulated
(Delaunay triangulation), and Green-Lagrange strains were computed for each triangle by calculating
the gradient of the displacement field. This operation yielded a 2-by-2 symmetric strain matrix for
each triangle and each pair of consecutive frames. Axial strains, that is, the diagonal elements of the
strain matrix, were denoted exx and eyy and shear strain (off-diagonal) was denoted exy . The x-axis
was aligned to the radial-ulnar orientation (Figure 1B). Strains were filtered, first spatially (using
Smooth Triangulated mesh from Matlab FEX, https://mathworks.com/matlabcentral/fileexchange/
26710-smooth-triangulated-mesh), and then temporally (median filtering over three strain values). By
using the term ’strain’ throughout the article, we refer to the elements of the strain tensor computed
between two consecutive images and expressed in percent per second, that is, strain rates.
The principal strain components denoted e1 and e2 were then obtained by an eigenvalue/eigen-
vector decomposition of the strain matrix. The principal strains e1 and e2 correspond to the maximum
Delhaye et al. eLife 2021;10:e64679. DOI: https://doi.org/10.7554/eLife.64679 15 of 21You can also read