In vivo stabilization of OPA1 in hepatocytes potentiates mitochondrial respiration and gluconeogenesis in a prohibitin-dependent way
←
→
Page content transcription
If your browser does not render page correctly, please read the page content below
JBC Papers in Press. Published on July 8, 2019 as Manuscript RA119.007601
            The latest version is at http://www.jbc.org/cgi/doi/10.1074/jbc.RA119.007601
                                                            Mitochondrial dynamics and liver gluconeogenesis

In vivo stabilization of OPA1 in hepatocytes potentiates mitochondrial respiration
and gluconeogenesis in a prohibitin-dependent way

Lingzi Li1,2,#, Juliette Martin-Levilain1,2,#, Cecilia Jiménez-Sánchez1,2, Melis Karaca1,2, Michelangelo
Foti1,2, Jean-Claude Martinou3, Pierre Maechler1,2*
1
Department of Cell Physiology and Metabolism & 2Faculty Diabetes Centre, University of Geneva
Medical Centre, Geneva, Switzerland; 3Cell Biology Department, Faculty of Sciences, University of
Geneva, Geneva, Switzerland

Running title: mitochondrial dynamics and liver gluconeogenesis
#
    These authors contributed equally to this work

*Correspondence to: Pierre Maechler, Department of Cell Physiology and Metabolism, CMU, rue
Michel-Servet 1, 1211 Geneva 4, Switzerland; Pierre.Maechler@unige.ch; Tel: +41 22 379 55 54

Keywords: liver; gluconeogenesis; mitochondria; prohibitins; OPA1

                                                                                                               Downloaded from http://www.jbc.org/ by guest on July 18, 2019
_______________________________________________________________________________

ABSTRACT                                                participates in the control of hepatic glucose
                                                        production.
Patients with fatty liver diseases present altered
mitochondrial morphology and impaired metabolic         _________________________________________
function. Mitochondrial dynamics and related cell
function require the uncleaved form of the              The liver is essential for both glucose and fatty
dynamin-like GTPase OPA1. Stabilization of              acid metabolisms, producing glucose in the fasting
OPA1 might then confer protective mechanism             state via glycogenolysis and gluconeogenesis (1).
against stress-induced tissue damages. In order to      Hepatic lipid accumulation characterizes non-
study the putative role of hepatic mitochondrial        alcoholic fatty liver disease (NAFLD) that has
morphology in a sick liver, we expressed a              become the most common chronic liver disease
cleavage-resistant long form of OPA1 (L-OPA1Δ)          (2,3). Mitochondria play an important role in liver
in the liver of a mouse model with mitochondrial        metabolism as they are major contributors to both
liver dysfunction, i.e. the hepatocyte-specific         gluconeogenesis and ß-oxidation (4,5). In humans
prohibitin-2 knockout (Hep-Phb2-/-) mice. Liver         with NAFLD, mitochondrial failure has been
prohibitin-2 deficiency caused excessive                reported (6) as well as excessive mitochondrial
proteolytic cleavage of L-OPA1, mitochondrial           oxidative capacity and gluconeogenesis (7),
fragmentation, and increased apoptosis. These           leaving the role of mitochondria in these
molecular alterations were associated with lipid        pathologies unclear.
accumulation, abolished gluconeogenesis and
extensive liver damages. Such liver dysfunction        Prohibitins are a family of proteins that consist of
was associated with severe hypoglycaemia. In           two members: prohibitin-1 (Phb1) and prohibitin-2
prohibitin-2 knockout mice, expression of L-           (Phb2) (8,9). Prohibitins are predominately located
OPA1Δ by in vivo adenovirus delivery restored the      in the mitochondrial inner membrane, where Phb1
morphology but not the function of mitochondria        and Phb2 form large interdependent ring-shaped
in hepatocytes. In prohibitin-competent mice,          heteromeric complexes (8,10). Mitochondrial
elongation of liver mitochondria by expression of      prohibitins have diverse roles in cellular
L-OPA1Δ resulted in excessive glucose production       regulations including mitochondrial dynamics, cell
associated with increased mitochondrial                proliferation, and apoptosis (11-14). Prohibitin-
respiration. In conclusion, mitochondrial dynamics     deficient mouse embryonic fibroblasts (MEFs)
                                                                                                          1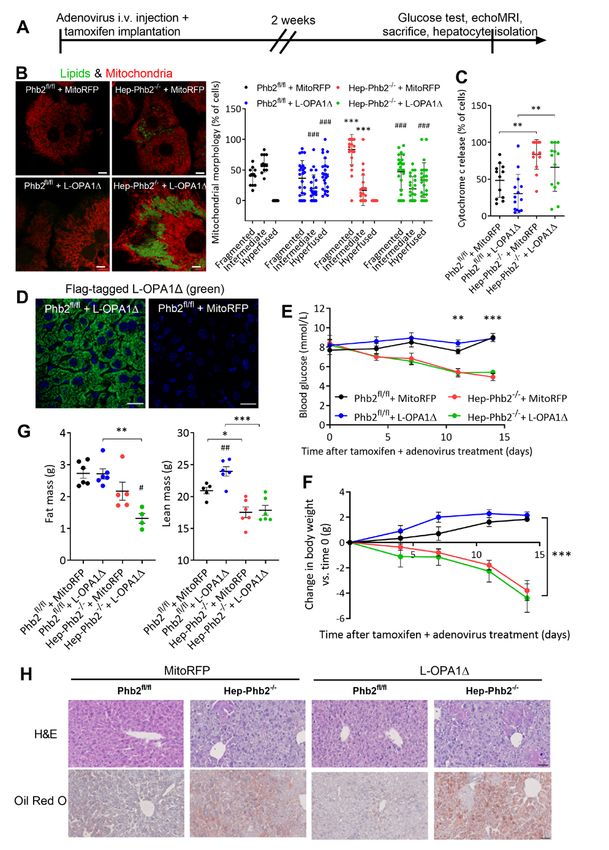
Mitochondrial dynamics and liver gluconeogenesis

show fragmented mitochondria, defective cristae       with mice expressing a tamoxifen-inducible Cre
and excessive proteolytic cleavage of the dynamin-    recombinase under the control of the albumin
like GTPase OPA1 (11). The long form of OPA1          promoter (Alb-Cre-ERT2) (24). Non-recombined
(L-OPA1) is essential for fusion, whereas the short   Phb2fl/fl;Alb-Cre-ERT2 mice were bred at the
form of OPA1 (S-OPA1) is associated with fission      expected Mendelian ratio with normal gross
(15-17). In mice, in vivo knockout of prohibitins     anatomy and fertility. We used floxed littermates
specifically in neurons or ß-cells alter cellular     without the Cre transgene (Phb2fl/fl) as controls for
functions with severe specific phenotypes,            experiments in order to homogenize the genetic
respectively neurodegeneration or diabetes (18,19).   background between the groups. Tamoxifen
Stabilization of OPA1 protects against apoptosis      treatment was initiated at the age of 8 weeks on
and tissue damage, leading to the amelioration of     both Phb2fl/fl controls and Phb2fl/fl;Alb-Cre-ERT2
the mitochondrial function (20,21). However, to       mice by one-time subcutaneous implantation of a
which extent OPA1 contributes to the phenotypic       tamoxifen pellet, the latter producing hepatocyte-
outcomes of mitochondrial dysfunction is unclear.     specific Phb2 knockout (Hep-Phb2-/-) mice. Two
Furthermore, it remains controversial whether         weeks        after   tamoxifen       administration,
altered mitochondrial morphology is the cause or      immunoblotting on extracts of isolated hepatocytes
the consequence of mitochondrial dysfunction and      revealed close to complete deletion of Phb2 in
metabolic stress. In other words, whether or not      Hep-Phb2-/- mice (Figure 1A). Consistent with
morphological adaptation serves the mitochondrial     previous findings in mice and cell lines
function is an ongoing debate.                        (11,18,19,25), loss of Phb2 was accompanied by

                                                                                                              Downloaded from http://www.jbc.org/ by guest on July 18, 2019
                                                      depletion of Phb1. This observation indicates that,
In order to assess the role of prohibitins and        as for other tissues, Phb1 and Phb2 are
related mitochondrial integrity in the liver, we      functionally interdependent in hepatocytes.
generated      conditional    tamoxifen-inducible     Immunoblotting of liver lysates from Hep-Phb2-/-
hepatocyte-specific knockout mice. The loss of        mice showed residual Phb2, which is presumably
Phb2 in hepatocytes abolished gluconeogenesis         explained by expression of the gene in non-
and increased cell death. These effects were          parenchymal liver cells and the persistence of
associated with mitochondrial fragmentation and       some hepatocytes that eventually escaped
loss of L-OPA1. To further define the role of         recombination. No recombination was observed in
OPA1-dependent fusion in the mitochondrial liver      the pancreas, skeletal muscles, the kidney and the
disease, we expressed an isoform of cleavage-         brain of Hep-Phb2-/- mice (Figure 1A and Suppl.
resistant OPA1 (L-OPA1Δ) by intravenous               Figure S1A).
injection of recombinant adenovirus. Stabilization
of L-OPA1 led to elongated mitochondria with          About     1    week after      tamoxifen-induced
higher respiration in control hepatocytes and to      recombination was initiated, Hep-Phb2-/- mice
only the normalization of mitochondrial               showed a progressive decline of random plasma
morphology in the absence of Phb2. Surprisingly,      glucose levels and of their body weights (Figure
OPA1 stabilization in the control mice potentiated    1B-C). At 2 weeks post-recombination, food
gluconeogenesis, pointing to mitochondrial            consumption (Suppl. Figure S1B) was lower (-
oxidative capacity as a master regulator of hepatic   25%) in knockout animals and by 3 weeks they
glucose production.                                   were severely sick and consumed approximately
                                                      63% less food than their controls. The pro-
                                                      inflammatory cytokines interleukin-6 (IL-6) and
                                                      tumor necrosis factor (TNF)-α were not
Results                                               significantly different in Hep-Phb2-/- mice at 2-
                                                      weeks post-recombination despite of a trend for
Generation and phenotype of hepatocyte-specific       elevated plasma levels (Suppl. Figure S1C-D),
                                                      while at 3-weeks IL-6 and TNF-α levels were
Phb2 knockout mice
                                                      dramatically higher compared to controls (TNF-α
                                                      concentrations were out of range). Hep-Phb2-/-
Global deletion of prohibitins is embryonically
                                                      mice died at around 3-4 weeks after tamoxifen-
lethal in mice (22,23). To achieve post-natal gene
                                                      induced deletion of prohibitins. Liver weights of
ablation specifically in mouse hepatocytes,
                                                      Hep-Phb2-/- mice were reduced by 15% after 3
conditional Phb2 mice (Phb2fl/fl) (11) were bred
                                                                                                         2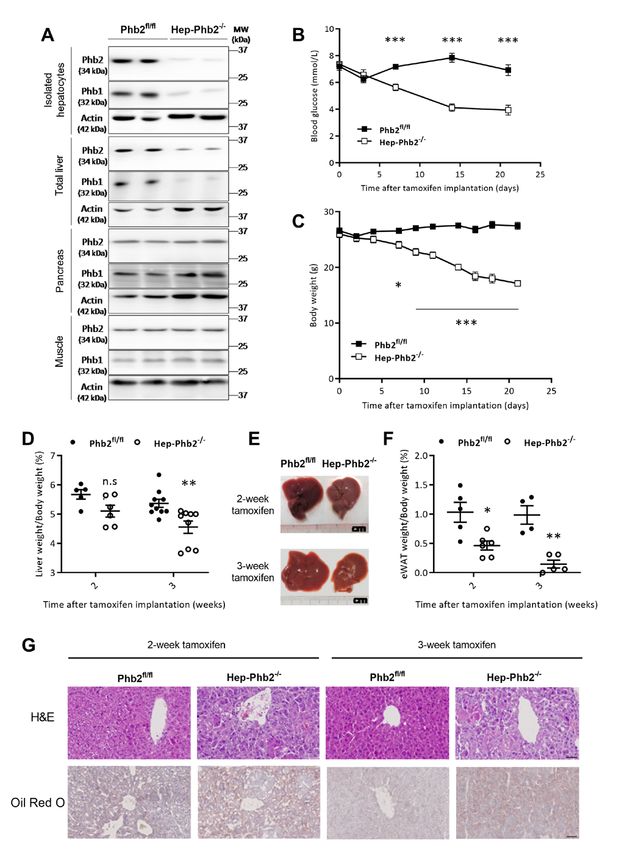
Mitochondrial dynamics and liver gluconeogenesis

weeks of recombination versus controls (Figure          microsomal triglyceride transfer protein (MTP)
1D-E). There was a marked reduction of the              activity as a rate-limiting factor (28). Under fed
epididymal white adipose tissue (eWAT) in Hep-          condition, Hep-Phb2-/- mice had 1.5-fold higher
Phb2-/- mice, being 55% and 85% lower compared          MTP activity than the control mice, probably
to control mice 2 and 3 weeks after recombination,      driven by over-sufficient supply of hepatic
respectively (Figure 1F). Histology on liver            triglycerides (Figure 2G). Considering the marked
sections (Figure 1G) of Hep-Phb2-/- mice revealed       reduction of eWAT (a sign of increased lipolysis)
disorganized hepatic structures and small lipid         and potential higher hepatic VLDL formation, one
droplets, reminiscent of NAFLD. On the other            would expect plasma lipid levels to be increased in
hand, steatotic liver of ob/ob mice did not exhibit     Hep-Phb2-/- mice. On the contrary, Hep-Phb2-/-
changes in Phb2 (Suppl. Figure S1E), while others       mice     exhibited    hypolipidemia,     suggesting
reported reduced levels of prohibitin complex in        increased clearance by peripheral tissues such as
liver mitochondria of ob/ob mice (26). Oil Red O        the skeletal muscles. Although the liver normally
staining further confirmed the accumulation of          increases the production of ketone bodies from
lipids in the livers of Hep-Phb2-/- mice. It has been   fatty acids under low blood glucose conditions,
reported that high dose of tamoxifen induces            plasma levels of ß-hydroxybutyrate were similar
hepatotoxicity (27). However, we observed no            between the knockout and control mice (Figure
change in liver histology 3 weeks after tamoxifen       2H). Overall, loss of prohibitins induced liver
administration on the Cre-negative control floxed       failure and a dramatic imbalance of lipid storage
mice, which disqualifies tamoxifen as a                 from adipose tissue to the liver.

                                                                                                                Downloaded from http://www.jbc.org/ by guest on July 18, 2019
confounding factor for the observed phenotype.
This set of data shows that the loss of hepatic         Loss of liver prohibitins altered glucose
prohibitins resulted in hypoglycaemia, reduction of     metabolism and whole-body energy homeostasis
body weight as well as altered liver mass and
histology.                                              Consistent with their low glycemia, Hep-Phb2-/-
                                                        mice displayed 70% reduction of hepatic glycogen
Loss of prohibitins induced liver injury and            content (fed condition) compared with the control
altered lipid metabolism                                mice (Figure 2I). In parallel, plasma insulin levels
                                                        were reduced by 58% in Hep-Phb2-/- mice, along
Due to the severity of the phenotype observed in        with a trend for increased glucagon levels (Figure
Hep-Phb2-/- mice at about 3-4 weeks after               2J-K). As insulin and glucagon are produced by
recombination, we then centred the study when the       pancreatic islets, we examined the islets by
disease was less severe, i.e. 2 weeks after             immunohistochemistry.        We     observed       no
recombination. Potential hepatic damages due to         significant changes in the knockout mice regarding
Phb2 deficiency were evaluated by the analysis of       neither the pancreatic distribution of islets nor the
liver enzymes and bilirubin in plasma, which were       density of endocrine cells within the islets with the
markedly increased in Hep-Phb2-/- mice versus           expected organisation of α-cells at the periphery
controls (Figure 2A, B). These data indicate            and ß-cells predominately in the centre (Suppl.
significant liver damages in Hep-Phb2-/- mice           Figure S2).
before the induction of cytokines (Suppl. Figure
S1), illness appearing already 2 weeks after the        Despite of the low plasma glucose and insulin
loss of hepatic Phb2.                                   levels, Hep-Phb2-/- mice showed similar glucose
                                                        tolerance in response to an intraperitoneal glucose
We next analysed plasma and hepatic lipid profiles.     tolerance test (ipGTT) and robust insulin
The plasma concentrations of free fatty acid (FFA),     sensitivity upon intraperitoneal insulin tolerance
total cholesterol and triglycerides (Figure 2C-E)       test (ipITT), compared with the control mice
were lower in Hep-Phb2-/- mice compared to              (Figure 3A-B). Remarkably, starting from 1-week
controls. Conversely, liver triglyceride contents       post     recombination,    gluconeogenesis      was
(Figure 2F) were markedly increased in Hep-Phb2-        completely abolished in Hep-Phb2-/- mice as
/-
    mice versus controls, confirming the lipid          indicated by in vivo pyruvate challenges (Figure
accumulation revealed by histology. Hepatic             3C-E), concomitant with the appearance of
triglycerides are released into the bloodstream via     hypoglycaemia (Figure 1B). Of note, the in vivo
packaging with apolipoprotein B into VLDL, with         pyruvate challenge may be influenced by the

                                                                                                           3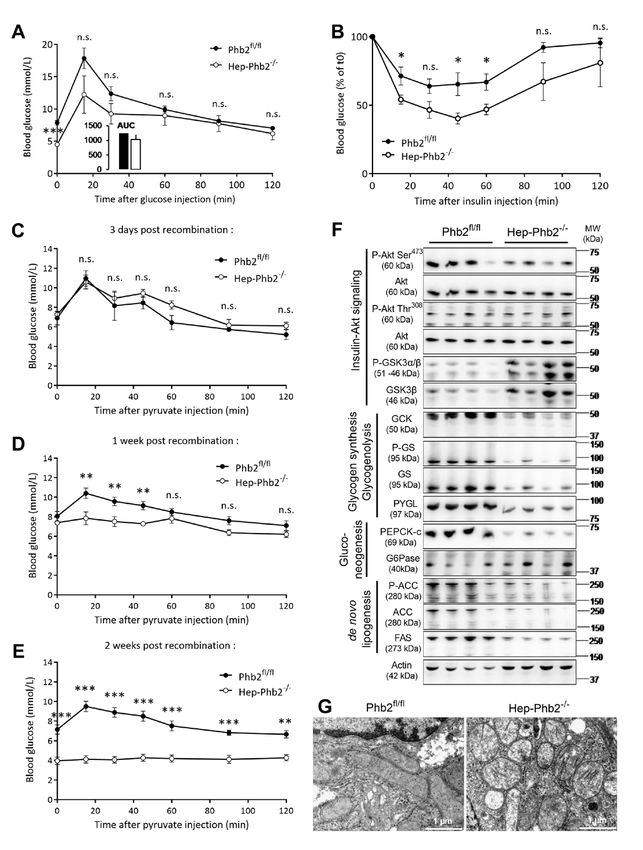
Mitochondrial dynamics and liver gluconeogenesis
uptake of lactate/pyruvate by peripheral tissues Next, we examined the protein levels of lipogenic
competing for the substrate (29). However, the enzymes in the liver. Both acetyl-CoA carboxylase
impaired gluconeogenesis was also observed in (ACC) and fatty acid synthase (FAS) were
vitro on hepatocytes isolated from Hep-Phb2-/- markedly reduced in the liver of Hep-Phb2-/- mice
mice (see later). (Figure 3F). This shows defective capacity for de
novo lipogenesis in Phb2-deficient liver despite the
We next analysed the proteins implicated in observed lipid accumulation, pointing to a non-
glucose and lipid metabolisms in liver extracts by hepatic source contributing to increased
immunoblotting (Figure 3F). Insulin signalling triglyceride storage. Given that Hep-Phb2-/- mice
pathway was first investigated for its role in eat less (Suppl. Figure S1B), the few dietary lipids
hepatic steatosis (30). Binding of insulin to its from their chow diet hardly account for increased
receptor initiates a signalling cascade that diverges hepatic lipid content. As insulin inhibits lipase in
at protein kinase Akt. The absence of Phb2 caused white adipose tissue, the low plasma insulin levels
a 50% reduction of phospho-Akt Ser473, while (Figure 2J) might have contributed to promote
phospho-Akt Thr308 was unchanged. Downstream lipolysis in adipose tissue (Figure 1F), resulting in
of insulin-Akt signalling, glycogen synthase kinase elevated supply of hepatic lipids in Hep-Phb2-/-
3 (GSK3) inhibits glycogen synthase (GS) activity liver (Figure 2F).
by phosphorylation, whereas Akt promotes GS
activity by inhibitory phosphorylation of GSK3. PEPCK and ACC directly rely on mitochondrial
Expression of GSK3ß in Hep-Phb2-/- liver was activity for the supply of their respective substrates
Downloaded from http://www.jbc.org/ by guest on July 18, 2019
markedly increased, associated with higher and GCK is associated with liver mitochondria,
phosphorylated GSK3. Glucokinase (GCK) is integrating glucose metabolism and apoptosis (33).
induced by insulin and converts glucose to Since these proteins were markedly downregulated
glucose-6-phosphate (G6P) used for both in prohibitin-deficient liver, we investigated the
glycolysis and glycogen synthesis. In the liver of integrity of mitochondria normally contributed by
Hep-Phb2-/- mice, GCK protein levels were prohibitins. Electron microscopy showed the loss
decreased, possibly as a consequence of low of an elongated ultrastructure resulting in a
insulin levels. In Phb2-deficient livers, GS was globular pattern in Hep-Phb2-/- liver (Figure 3G).
markedly downregulated and the remaining GS This might indicate a link between the structure of
was phosphorylated to levels similar to those of mitochondria and the levels of proteins associated
control liver, further reducing its overall activity. with this organelle.
Regarding glycogenolysis, expression of glycogen
phosphorylase was also markedly reduced. Overall, L-OPA1 restored mitochondrial morphology and
while the signalling pathway for glycogen improved resistance to spontaneous apoptosis in
production was upregulated, the enzymatic Phb2-deficient hepatocytes
machinery was markedly downregulated in Phb2-
deficient liver. Moreover, the scarce availability of Deletion of Phb2 in MEFs, neurons and pancreatic
the necessary substrates rendered glycogen storage ß-cells leads to excessive proteolytic cleavage of
inoperative (31). L-OPA1, which is accompanied by mitochondrial
fragmentation (11,18,19) associated with the
Although not rate-limiting (32), observed globular pattern (Figure 3G). Re-
phosphoenolpyruvate carboxykinase (PEPCK) introducing L-OPA1 into Phb2 null cells promotes
significantly contributes to hepatic fusion and therefore recovery of the mitochondrial
gluconeogenesis and is localized mainly in the morphology (11). To understand whether loss of
cytosol (PEPCK-c) and partly in mitochondria L-OPA1 and the associated disrupted
(PEPCK-m) according to its two isoforms. mitochondrial dynamics were responsible for the
Expression of PEPCK-c is stimulated by glucagon functional defect of Phb2-deficient hepatocytes,
and repressed by insulin, whereas PEPCK-m is we used a cleavage-resistant L-OPA1 isoform (L-
constitutively expressed. Phb2-deficient liver had OPA1Δ). Flag-tagged isoform of L-OPA1Δ was
almost complete suppression of PEPCK-c protein introduced by adenoviral gene transfer into
(Figure 3F), while glucose-6-phosphatase (G6Pase) isolated hepatocytes and its expression was
was similarly expressed in the knockout and detected by immunoblotting (Figure 4A). As
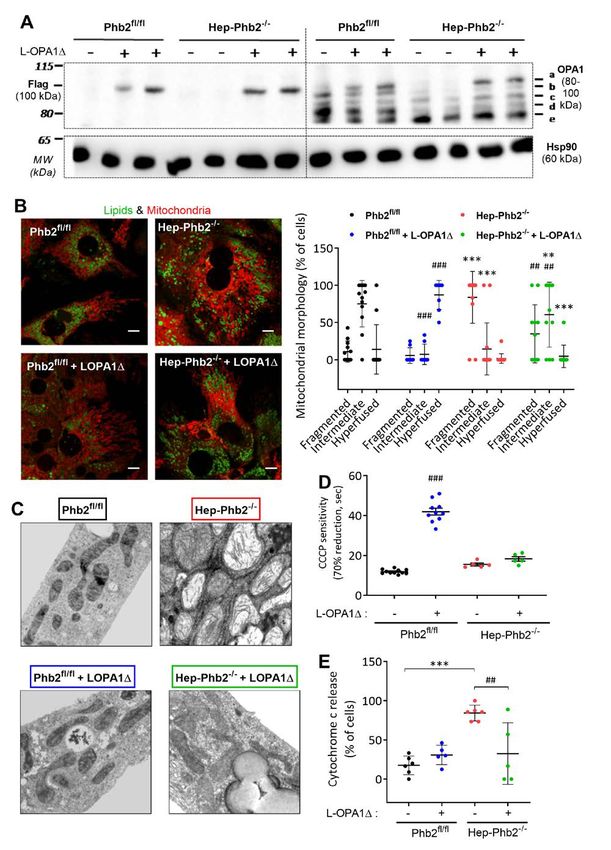
control livers. expected, we detected 5 different OPA1 cleavage
4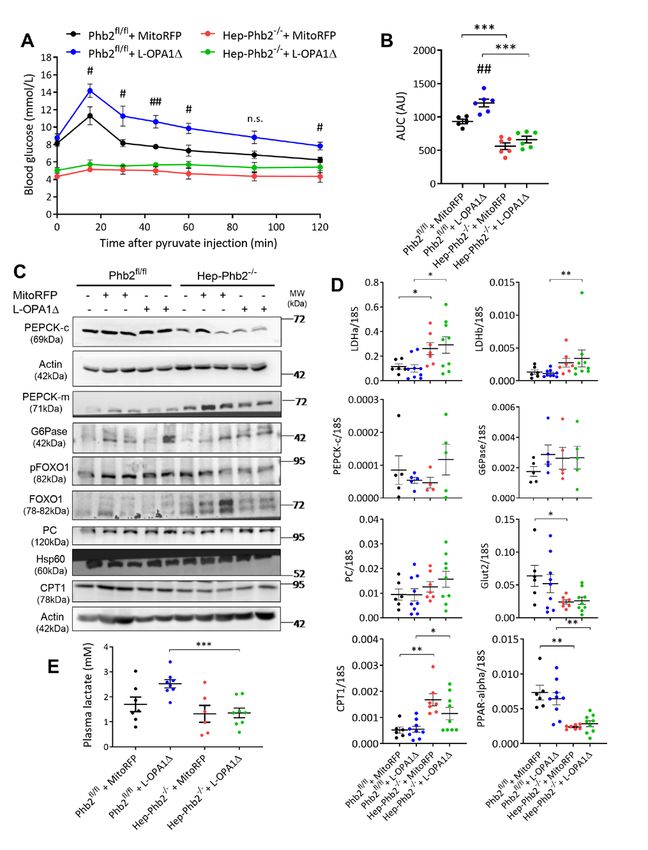
Mitochondrial dynamics and liver gluconeogenesis

forms in mouse hepatocytes: long (L) forms a and        which was prevented by the expression of L-
b derived from splice variants 7 and 1, respectively,   OPA1Δ (Figure 4E). We also examined the
and short forms c, d and e produced by proteolytic      production of reactive oxygen species (ROS) by
cleavage at S1 and S2 sites. Following L-OPA1Δ          measurement of lipid peroxidation derived 4-
transduction of isolated hepatocytes, we observed       hydroxynonenal (4-HNE) and found no difference
the restoration of the L-OPA1 a isoform that was        between Phb2-deficient livers and controls (Suppl.
absent in Phb2 null hepatocytes. In the control         Figure S5). Overall, L-OPA1Δ restored
hepatocytes, protein levels of L-OPA1 a isoform         mitochondrial morphology in Phb2-deficient
was further elevated. Imaging of hepatocytes            hepatocytes and conferred protection against
showed that the loss of prohibitins led to a high       apoptosis induced by the deletion of prohibitins.
percentage of fragmented and ring-shaped
mitochondria (Figure 4B, Suppl. Figure S3), in          In vivo expression of L-OPA1Δ in the liver was
agreement with the globular pattern revealed by         not sufficient to rescue metabolic defects in Hep-
electron microscopy (Figure 3G). Expression of L-       Phb2-/- mice
OPA1Δ restored an elongated mitochondrial
morphology in most of the Phb2 null hepatocytes         Diet-induced obesity and steatosis can be
and promoted hyperfused mitochondria in control         prevented by hepatic deletion or dominant
hepatocytes (Figure 4B). Electron microscopy            negative mutation of dynamin-related protein 1
performed on isolated hepatocytes (Figure 4C)           (Drp1), a mitochondrial fission machinery (39).
confirmed the globular pattern of mitochondria          Since L-OPA1Δ was able to enhance

                                                                                                               Downloaded from http://www.jbc.org/ by guest on July 18, 2019
observed in Hep-Phb2-/- liver (Figure 3G) and           mitochondrial fusion in isolated hepatocytes, we
showed rescued mitochondrial morphology                 tested its potential effects in vivo in Hep-Phb2-/-
following L-OPA1Δ transduction.                         mice. Adenovirus expressing L-OPA1Δ was
                                                        injected in the tail of knockout and control mice on
Phb2-deficient cells are prone to apoptosis, while      the same day of tamoxifen implantation for
L-OPA1 is able to promote cell survival upon            simultaneous induction of liver Phb2 deletion
Phb2 depletion (11,19,34). Given that apoptosis is      (Figure       5A).        Adenovirus      expressing
a key pathological feature of NAFLD (35), we            mitochondrion-targeted dsRED (mitoRFP) was
tested in vitro expression of L-OPA1Δ in isolated       used as control adenovirus. Additionally, we tested
hepatocytes and checked dissipation of the              if delivery of L-OPA1Δ postponed 1 week after
mitochondrial membrane potential (Δψm) as an            tamoxifen-induced deletion of Phb2 could prevent
early event of apoptosis (36); analysed by the          the severe metabolic defects of Hep-Phb2-/- mice
sensitivity to the mitochondrial uncoupler CCCP         (Suppl. Figure S6).
(carbonyl cyanide m-chlorophenyl hydrazone)
(Suppl. Figure S4A). Consistent with Phb2-              Two weeks after the simultaneous deletion of liver
deficient MEFs (11), Phb2-null hepatocytes              Phb2 and induction of L-OPA1Δ expression, we
exhibited a similar degree of vulnerability to          isolated hepatocytes and analysed their
CCCP-induced          mitochondrial       membrane      mitochondrial morphology (Figure 5B). In
depolarization as the control hepatocytes (Figure       agreement with the in vitro results (Figure 4B),
4D). L-OPA1Δ expression delayed the dissipation         hepatocytes isolated from Hep-Phb2-/- mice and
of Δψm in control hepatocytes, while it did not in      expressing L-OPA1Δ showed less fragmented
Phb2-deficient         hepatocytes,       indicating    mitochondria and increased elongated ones.
morphology-independent        underlying     defects    Hepatocytes from control mice expressing L-
caused by Phb2 deletion. Associated with the            OPA1Δ also exhibited a marked increase in
dissipation of Δψm, the intrinsic pathway of            elongated mitochondria. However, hepatocytes
apoptosis is triggered via the release of               isolated from Hep-Phb2-/- mice following in vivo
cytochrome c from mitochondria to activate              L-OPA1Δ expression were not protected from
caspases in the cytosol (37). We monitored the          spontaneous apoptosis (Figure 5C, Suppl. Figure
release of cytochrome c in isolated hepatocytes         S7). Of note, compared to the in vitro experiments
treated with the general caspase inhibitor z-VAD-       performed 48h post-transduction (Figure 4E), we
fmk to prevent cell detachment (38) (Suppl. Figure      observed higher cytochrome c release in the
S4B). Loss of prohibitins in hepatocytes caused a       hepatocytes of the control mice 2 weeks after
substantial release of cytochrome c into the cytosol,   adenoviral       injection      (Figure       5C).

                                                                                                          5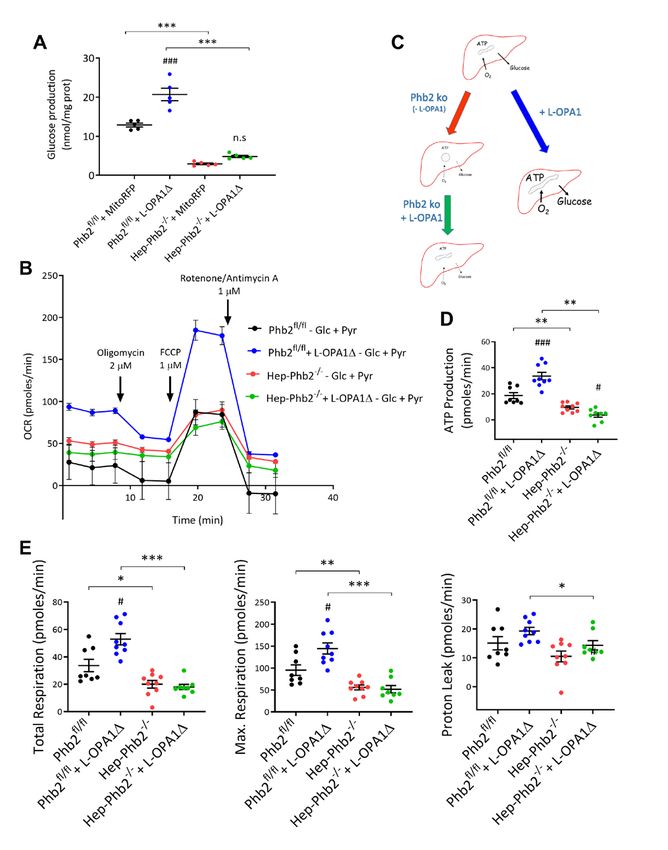
Mitochondrial dynamics and liver gluconeogenesis

Immunofluorescence on the Flag tag of L-OPA1Δ        make sure that the availability of circulating
construct revealed more than 90% of transduction     lactate was not rate limiting in knockout animals,
efficiency in hepatocytes (Figure 5D). Some          we measured the lactatemia that was in the
control hepatocytes displayed abnormal nuclei as a   physiological range for all of the groups (Figure
sign of apoptosis (40), possibly contributed by      6E). Other enzymes involved in gluconeogenesis,
sporadic adenovirus-induced inflammation (41).       such as G6Pase and pyruvate carboxylase (PC),
                                                     were similarly expressed regardless of the
Regarding the phenotype of the animals, L-           experimental conditions (Figure 6C).
OPA1Δ expression failed to rescue the glycaemia
and body weight of Hep-Phb2-/- mice (Figure 5E-      Insulin signalling results in the phosphorylation of
F). Intriguingly, in control mice, after 1-week of   the transcription factor FOXO1 and its exclusion
L-OPA1Δ expression there was a significant           from the nucleus, thereby reducing the expression
increase of blood glucose levels (Suppl. Figure      of PEPCK-c and G6Pase. In Phb2-deficient liver,
S6B). Neither the fat nor the lean masses were       we observed an increase in the protein level of
corrected in Hep-Phb2-/- mice following L-OPA1Δ      FOXO1, not of its phosphorylated form, consistent
expression in the liver (Figure 5G, Suppl. Figure    with the inhibition of Akt phosphorylation on
S6C), while the lean mass was increased by 14.4%     Ser473 (Figure 3F). This led us to investigate the
in control mice expressing L-OPA1Δ (Figure 5G).      key gluconeogenic enzymes at the transcript level
L-OPA1Δ expression normalized neither liver          (Figure 6D). There was no change between the
architecture nor hepatic lipid contents in Hep-      knockout and control mice for PEPCK-c, G6Pase

                                                                                                            Downloaded from http://www.jbc.org/ by guest on July 18, 2019
Phb2-/- mice (Figure 5H, Suppl. Figure S7B). In      and PC, while glucose transporter Glut2
summary, in vivo restoration of mitochondrial        expression was reduced in Phb2-deficient liver. In
morphology by L-OPA1Δ expression failed to           control mice, the expression of L-OPA1Δ did not
protect mice from illness induced by loss of         modify the expression of these gluconeogenic
hepatic prohibitins.                                 genes. This indicates that these enzymes were not
                                                     rate-limiting, pointing to alternative effectors
In vivo expression of L-OPA1Δ in liver               mediating L-OPA1-induced gluconeogenesis.
potentiated gluconeogenesis                          Regarding fatty acid metabolism, carnitine
                                                     palmitoyltransferase (CPT) in Phb2-dificient liver
Consistent with the persistence of hypoglycaemia     was upregulated at the mRNA level (Figure 6D),
in Phb2 knockout animals expressing L-OPA1Δ, a       while slightly reduced at the protein level (Figure
pyruvate challenge (Figure 6A) on 6h-fasted Hep-     6C). A discrepancy between the levels of mRNA
Phb2-/- mice transduced with L-OPA1Δ showed no       and protein has already been reported by us and
restoration of gluconeogenesis. In line with the     others regarding CPT1, in particular higher mRNA
unexpected increase in blood glucose (Suppl.         not translated at the protein level in mouse liver
Figure S6B), L-OPA1Δ expression in control mice      (43,44). Expression of the key transcription factor
enhanced endogenous glucose production as            for liver ß-oxidation, namely peroxisome
observed 2 weeks after in vivo adenoviral delivery   proliferator-activated receptor α (PPARα), was
(Figure 6B). The same effect was observed when       markedly downregulated in the absence of Phb2,
L-OPA1Δ was administered only 1 week before          not rescued by the introduction of L-OPA1Δ. This
the challenge (Suppl. Figure S6E).                   points to repressed ß-oxidation in knockout
                                                     hepatocytes and substantiates the observed lipid
Because PEPCK-c was downregulated in Phb2-           accumulation. Overall, the absence of prohibitins
deficient liver (Figure 3F), we checked if L-        supressed gluconeogenesis independently of the
OPA1Δ would increase the gluconeogenic               presence of L-OPA1 and in vivo expression of L-
PEPCK-c, which was not the case (Figure 6C).         OPA1Δ in the liver of prohibitin-competent
However, PEPCK-m was upregulated in Phb2-null        control mice enhanced endogenous glucose
liver, potentially as a compensatory mechanism       production.
(Figure    6C).     Alike   PEPCK-m,       lactate
dehydrogenase (LDH), that provides the               In isolated hepatocytes, L-OPA1Δ enhances
gluconeogenic substrate pyruvate, was upregulated    mitochondrial respiration and glucose production
in Phb2-deficient liver but unchanged by the
expression L-OPA1Δ (Figure 6D). In order to
                                                                                                       6
Mitochondrial dynamics and liver gluconeogenesis
In order to substantiate the in vivo observation below). With the chronicity of hypoglycaemia,
(Figure 6A-B), we assessed gluconeogenesis in hepatic glycogen contents were substantially
vitro on hepatocytes isolated from control and lowered. Thus, Hep-Phb2-/- mice were severely ill
Hep-Phb2-/- mice transduced either with control and experienced continuous hypoglycaemia even
(MitoRFP) or L-OPA1Δ expressing adenoviruses, under the fed conditions, ultimately leading to
then stimulated with pyruvate and lactate. Hep- severe weight loss and death. The aetiology of the
Phb2-/- hepatocytes were unable to produce disease, induced by the knockout of liver Phb2,
glucose, with or without the introduction of L- indicates that the abrogation of hepatic glucose
OPA1Δ. However, consistent with the in vivo production was an early defect caused by the loss
situation, expression of L-OPA1Δ conferred of hepatic prohibitins, in turn driving the
hyperresponsiveness to control hepatocytes secondary peripheral dysregulations. Our group
(Figure 7A). recently reported that the selective disruption of
amino acid-derived gluconeogenesis in the
As gluconeogenesis is an energy-consuming hepatocytes (48) is not sufficient to induce such a
process relying on mitochondrial oxidative severe phenotype as the one observed in Hep-
capacity (7), we finally tested mitochondrial Phb2-/- mice, pointing to additional liver failures
respiration in isolated hepatocytes (Figure 7B). such as impaired mitochondrial oxidative activity.
Loss of Phb2 in hepatocytes reduced oxygen Lipid stores rerouted to the liver of Hep-Phb2-/-
consumption and ATP production (Figure 7C-E). mice lacking efficient ß-oxidation contributed to
Conversely, expression of L-OPA1Δ enhanced the accumulation of hepatic triglycerides (50).
Downloaded from http://www.jbc.org/ by guest on July 18, 2019
both respiration and ATP generation in control
hepatocytes. Such functions were not restored in Ablation of Phb2 in hepatocytes led to excessive
hepatocytes lacking prohibitins. These results not proteolytic cleavage of L-OPA1, increasing the
only suggest that a hyperfused pattern of ratio of short to long isoforms. This was associated
mitochondria could increase their energetic with mitochondrial fragmentation and a dramatic
efficiency, pending integrity of prohibitins, but increase in spontaneous cytochrome c release.
that gluconeogenesis tightly relies on Loss of L-OPA1 has been accounted for the
mitochondrial respiration. defects in Phb2 null cells (11). Our results show
that the regulation of OPA1 cleavage is a central
function of prohibitins in primary hepatocytes,
linking mitochondrial morphology to liver
Discussion function. In the liver of leptin-deficient ob/ob mice,
leptin treatment reduces both lipid content and the
The present study demonstrates that in vivo OPA1 ratio of short to long isoforms, restoring
deletion of Phb2 in hepatocytes rapidly leads to such ratio to untreated lean control levels (51).
hypoglycaemia and loss of body weight,
accompanied by liver lipid accumulation and The in vivo stabilization of L-OPA1 did not
hypolipidemia. Although Hep-Phb2-/- mice had improve of the metabolic phenotype of Hep-Phb2-/-
preserved glucose tolerance and insulin sensitivity, mice despite efficient restoration of the
glycogen stores were depleted and mitochondrial morphology. Besides maintaining
gluconeogenesis was inefficient with long-form OPA1 integrity, prohibitins protect
downregulation of hepatic PEPCK-c. mitochondrial respiratory chain complexes from
degradation (12,13) and facilitate mitophagy to
During the first phase of fasting, half of the hepatic remove dysfunctional mitochondria (14). L-OPA1
glucose production is contributed by the expression in Phb2-deficient neurons does not
breakdown of glycogen and the other half by restore impaired respiratory supercomplexes (20).
gluconeogenesis (45). Upon prolonged fasting and Because the liver has a prominent metabolic
exhaustion of hepatic glycogen, gluconeogenesis activity largely relying on mitochondria, any
contributes to nearly all of the glucose production dysfunction of this organelle may lead to
(46,47). Soon after deletion of liver Phb2 (1 week), metabolic alterations (52). Our data emphasize the
Hep-Phb2-/- mice were unable to produce hepatic specific pathways by which prohibitins and OPA1
glucose and subsequently they rapidly became regulate mitochondrial integrity and cellular
continuously hypoglycaemic (about 4 mM or metabolism.
7Mitochondrial dynamics and liver gluconeogenesis
One intriguing observation made here was that In conclusion, our results establish an essential
upregulation of long-form OPA1, and the role for prohibitins in regulating hepatic
associated hyperfused mitochondrial pattern, metabolism and whole-body energy homeostasis.
resulted in enhanced hepatic glucose production in In the absence of prohibitins, L-OPA1 is sufficient
prohibitin-competent mice. Such an anabolic boost to restore the morphology but not the function of
was associated with an increase of the lean mass. liver mitochondria. In the presence of prohibitins,
In prohibitin null mice, the metabolic defects were L-OPA1 promotes excessive mitochondrial
not restored, pointing to other liver alterations not respiration and glucose production, pointing to
restored by L-OPA1. The usual view is that mitochondrial dynamics in the control of
mitochondrial morphology is an adaptive response gluconeogenesis.
to cellular metabolic demands (53) and
mitochondrial dynamics are associated with
oxidative phosphorylation (54,55). Starvation
promotes an elongated pattern of mitochondria, Experimental Procedures
presumably to maximize ATP production (56),
whereas high glucose condition results in massive Generation of hepatocyte-specific prohibitin-2
mitochondrial fragmentation (57). However, as knockout (Hep-Phb2-/-) mice
most of the morphology-related studies were
conducted on nutrient-consuming cell lines, there
Phb2 floxed (Phb2fl/fl) mice (11) were crossed with
is no preceding report on the effects of hyperfused
Downloaded from http://www.jbc.org/ by guest on July 18, 2019
Alb-Cre-ERT2 mice carrying the tamoxifen-
mitochondria in glucose production by hepatocytes.
dependent Cre-ERT2 recombinase coding sequence
Mitochondria serve as a hub for metabolic
preceded by an internal ribosomal entry site
enzymes such as GCK (33) and PEPCK-m (58).
inserted in the 3 untranslated region of the serum
Interaction of GCK with mitochondria has been
albumin gene (MGI:3052812) (24). The in vivo
implicated in the control of glycolysis and
deletion of Phb2 in hepatocytes was induced at 8
apoptosis in hepatocytes (33). Thus, the level of
weeks of age by subcutaneous implantation of
expression per se of those enzymes is most likely
tamoxifen pellets (Tamoxifen free base, 25
not the key element for metabolic regulation. The
mg/pellet, 21 day release, E-361; Innovative
interaction between metabolic enzymes and
Research of America) in male Hep-Phb2-/- mice.
mitochondria seems to play a central role in the
Animals were maintained on a mixed (C57BL/6J x
control of these pathways.
129/Sv) genetic background to avoid inbred strain-
specific phenotypes. As control mice, we used
Increased hepatic glucose production is the male Phb2fl/fl littermates, which were implanted
primary contributor to fasting hyperglycaemia with tamoxifen pellets at the same time as Hep-
(59,60), which is a hallmark in the natural history Phb2-/- mice, in order to optimize standardization
of type 2 diabetes. However, neither PEPCK nor of the genetic background between the two groups.
G6Pase are upregulated in the liver of type 2 Mice were maintained in our certified animal
diabetic patients (61), indicating that alternative facility on 12-h dark-light cycle and were fed ad
molecular mechanisms account for excessive libitum with standard chow diet (RM3-E-SQC
glucose production. The present data indicates that #811181, SDS Diets, Essex, UK) and water
mitochondrial dynamics participate to hepatic according to procedures that were approved by the
glucose production. In particular, L-OPA1 not animal care and experimentation authorities of the
only elongated mitochondria but also rendered Canton of Geneva (GE/128/15, #27139).
hepatocytes hyperresponsive in terms of
mitochondrial respiration and glucose production
Adenovirus construction
(Figure 7C). This is reminiscent of the excessive
mitochondrial oxidative capacity and
gluconeogenesis observed in NAFLD humans Recombinant adenovirus encoding for Flag tagged
(6,7). However, an elongated pattern of cleavage-resistant isoform of rat OPA1 splice
mitochondria is not sufficient for an over- variant 7 (L-OPA1∆) (62) or mitochondrial
production of glucose, as shown in Phb2 null targeted dsRED (mitoRFP) under the
hepatocytes expressing L-OPA1. cytomegalovirus (CMV) promoter were generated
using the Adeno-X Expression system (Clontech,
CA, USA) according to the manufacturer’s
8Mitochondrial dynamics and liver gluconeogenesis
protocol and as described previously (63). A clonal centrifuged at 2,000 rpm at 4°C to separate plasma.
stock was amplified and purified for its in vivo use Liver and epididymal adipose tissue were collected,
by Vector BioLabs (Malvern, PA, USA). weighed, snap-frozen in liquid nitrogen. Tissues
Adenovirus was administered in vivo by tail vein and plasma were stored at -80°C. Pancreas was
injection of 4 x 10¹⁰ plaque-forming units (pfu)/kg collected for fixation and further
for L-OPA1∆ expression, or 3.2 x 10¹⁰ plaque- immunohistochemistry.
forming units (pfu)/kg for mitoRFP expression.
For in vitro transduction, hepatocytes were treated Determination of metabolic parameters
with adenoviruses expressing either control
MitoRFP or L-OPA1∆ at 5 MOI right after Alanine aminotransferase (ALT) and aspartate
isolation and used 48h later. aminotransferase (AST), bilirubin and cholesterol
plasma levels were measured at Geneva University
Isolation of primary mouse hepatocytes Hospitals. Plasma free fatty acids, plasma ß-
hydroxybutyrate, plasma and liver triglycerides,
Mice were anesthetized by intraperitoneal and liver glycogen content were measured by
injection of Pentothal (50 μg/ml, 50μl/25g of colorimetric assay using adequate quantification
mouse body weight). Liver was perfused and kits (Biovision, Mountain View, CA) following
hepatocytes were isolated as previously described manufacturer’s instructions. Under fed conditions,
(48). Collected cells were re-suspended with 10 ml the activity of the microsomal triglyceride transfer
protein (MTP) was measured in liver lysates by
Downloaded from http://www.jbc.org/ by guest on July 18, 2019
of culture medium (Williams E medium, 5% FCS,
10-9 M insulin, 10-6 M dexamethasone, Pen/Strep fluorimetric assay using MTP Activity Assay Kit
and 1% Glutamax). Hepatocytes were seeded at (Sigma). Insulin, glucagon, IL-6 and TNF-α were
50,000 cells/cm2 on collagen-coated plates and measured using Luminex xMAPTM technology and
incubated at 37°C, 5% CO2 until further commercially available kits (Bio-Plex Pro
experiments. Diabetes Assays and Bio-Plex Pro Mouse
Cytokine, Biorad).
In vivo experiments
Glucose production by isolated hepatocytes
From the time of tamoxifen implantation, mice
were separated from their cage mates and housed Glucose production was assessed as previously
individually. Blood glucose levels were measured described (48). In brief, isolated hepatocytes were
using Accu-Check Aviva glucometer (Roche fasted for 6h in DMEM (without glucose, pyruvate
Diagnostics, Switzerland) from the tail vein or phenol red) for glycogen depletion. The
between 7:30 to 8:30 a.m. with body weight and medium was replaced by Krebs-Ringer-
food intake monitored at the same time. Body Bicarbonate-Hepes (KRBH) buffer (140 mM NaCl,
composition was assessed by an EchoMRI-700™ 3.6 mM KCl, 0.5 mM NaH2PO4, 0.5 mM MgSO4,
quantitative nuclear magnetic resonance analyser 2 mM NaHCO3, 1.5 mM CaCl2, and 10 mM
(Echo Medical Systems, Houston, TX). For HEPES) alone for basal condition, or KRBH
glucose and pyruvate tolerance test, mice were buffer containing 10 mM lactate and 10 mM
fasted for 6 h. D-Glucose (2 g/kg body weight) or pyruvate for stimulatory condition. Cells were
sodium pyruvate (2 g/kg body weight) were stimulated for 60 min at 37°C. Supernatant was
injected intraperitoneally. Glucose concentrations taken for glucose quantification with glucose assay
were measured from blood samples taken from the kit (Biovision) and later normalized by protein
tail vein at time 0, 15, 30, 60, 90 and 120 min after content.
injection using Accu-Check Aviva glucometer.
The total area under the curve (AUC) of glycaemia Immunoblotting
was calculated using GraphPad Prism 6 software.
For insulin tolerance test, mice under the fed Frozen liver tissues (30 mg) were lysed in 300 μl
condition were injection with insulin (0.75 U/kg RIPA buffer in presence of 1x protease inhibitor
body weight, Actrapid HM, 100 U/ml, Novo mix (Complete mini tablets, Roche) and 1x
Nordisk) intraperitoneally. Upon sacrifice, blood phosphatase inhibitor (PhosStop, Roche).
was collected into EDTA-coated tubes (Sarstedt Homogenate was collected after homogenization
#20.1341) via retro-orbital bleeding and performed using Tissue Lyser (Qiagen) and
9Mitochondrial dynamics and liver gluconeogenesis
centrifugation at 14,000rpm for 10 min at 4°C. cryostat sections were stained with DYKDDDDK
Proteins from liver extracts (20 mg) were resolved tag monoclonal antibody with Alexa Fluor 488
by gel electrophoresis, transferred on conjugate (Invitrogen MA1-142-A488) overnight
nitrocellulose membranes and probed with specific at 4 °C. Images were captured by Zeiss LSM 800
antibodies (Suppl. Table S1). Band signals were microscope.
detected by horseradish peroxidase peroxidase
system and quantifications were performed using Transmission electron microscopy (TEM)
the PXi gel imaging system (Syngene).
The livers from control and Hep-Phb2-/- mice 2
Histology weeks after tamoxifen-induced recombination
were excised, cut in small pieces of 1 mm2 and
For morphology analyses, livers were fixed in 4% processed for electron microscopy. The tissue was
paraformaldehyde (PFA), dehydrated and fixed in 0.1M sodium cacodylate buffer containing
embedded in paraffin. Sections (5 μm) were 2.5% glutaraldehyde at room temperature for 4h.
stained with hematoxylin and eosin (H&E). For Samples were then washed three times with 0.1M
Oil Red O staining, frozen cryostat sections (5 μm) sodium cacodylate buffer and post-fixed with 1%
were fixed in ice cold 10% formalin for 10 min, osmium tetraoxide and 1.5% potassium
dried, washed and incubated in propylene glycol ferrocynide in 0.1M cacodylate buffer for 1h at
for 5 min. The sections were then incubated with room temperature. Samples were then dehydrated,
Oil Red O solution (Sigma #O1516) for 10 min at embedded in epon resin and processed for electron
Downloaded from http://www.jbc.org/ by guest on July 18, 2019
60°C and in 85% propylene glycol for 5 min. The microscopy as previously described (64). Ultrathin
sections were counterstained with haematoxylin. sections were finally contrasted with uranyl acetate
Sections were scanned by widefield slide scanner and lead citrate and observed with a Technai 20
(Axio Scan.Z1, Zeiss) at 20 x magnification. electron microscope (FEI Company, Eindhoven,
Images were visualized by software ZEN (Zeiss). Netherlands). The same procedure was applied on
isolated primary hepatocytes for EM analysis.
Immunofluorescence
Mitochondrial membrane potential analysis
For live imaging of primary hepatocytes, cells
were cultured on collagen (Sigma C7661) coated Cells were incubated at room temperature for
35 mm diameter tissue culture dishes with cover 20 min with 20 nM TMRM, washed, and kept at
glass bottom (WPI) and incubated with 37°C on the microscope until signal reached
MitoTracker Orange CMTMRos (100 nM, stability. CCCP (10 μM, carbonyl cyanide m-
Molecular Probes) and Bodipy dye (1 μg/mL, chlorophenyl hydrazone) was added and sequential
D3922, Molecular Probes). The preparation was images of TMRM fluorescence were acquired
put inside a temperature-controlled chamber every 3s with an inverted Nikon A1r microscope.
(37 °C) during imaging, and images were acquired Analysis of TMRM fluorescence over
with an inverted Nikon A1r microscope. For mitochondrial regions of interest was performed
quantification of mitochondrial morphology, using ImageJ software.
hepatocytes were classified according three
patterns of mitochondrial morphology: i.e. Cytochrome c release analysis
fragmented, intermediate, and hyperfused (see
Suppl. Figure S8). For insulin/glucagon staining Hepatocytes were treated with adenovirus
on pancreas sections, pancreas was fixed for 2 h in expressing L-OPA1∆ at 5 MOI right after isolation.
4% PFA, and finally embedded in paraffin. After 48h incubation at 37°C, 5% CO2, general
Sections of 5 µm were incubated with guinea pig caspase inhibitor z-VAD-fmk (50 μM, BD
anti-swine insulin (Dako 564) and mouse anti- Biosciences 550377) was added to culture medium.
glucagon (Sigma G2654) overnight at 4 °C. After 3h, cells were fixed and permeabilized. After
Secondary goat anti-guinea pig Alexa Fluor 488 blocking on the coverslips, cytochrome c was
antibody (Invitrogen A-11073) and goat anti-rabbit stained using mouse anti-cytochrome c antibody
Alexa Fluor 546 antibody (Invitrogen A-11035) (BD Biosciences 556432) and mitochondria were
were added for 1h. To monitor the in vivo stained using rabbit anti-Tom20 mAb (Cell
transduction efficiency of adenovirus, frozen Signaling 42406) overnight at 4 °C. Secondary
10Mitochondrial dynamics and liver gluconeogenesis
goat anti-mouse Alexa Fluor 546 antibody Plasma samples were added to an assay buffer
(Invitrogen A-11030) and goat anti-rabbit Alexa containing 37 mM glycine, 10 mM EDTA, 0.02%
Fluor 488 antibody (Invitrogen A-11034) were hydrazine hydrate and 0.9 mM NAD+, and then
added for 1h. The nucleus was stained with DAPI stimulated with 2.75 U/ml L-Lactate
(Vector Laboratories H-1500). Images were Dehydrogenase (Roche 000000010127230001).
acquired by Nikon A1r microscope or Zeiss LSM Lactate was measured as NADH fluorescence with
800 microscope. The number of cells releasing a Fluostar Optima using excitation wavelength of
cytochrome c was determined using ImageJ. 340 nm and recording wavelength at 460 nm.
Mitochondrial respiration measurement Gene expression analysis
The mitochondrial respiration on isolated Total RNA from frozen liver was isolated using
hepatocytes was tested in XF96 Seahorse TRIzol reagent (Invitrogen) and purified with
apparatus (Agilent). Hepatocytes were plated at Nucleospin RNA II kit (Macherey-Nagel, Duren,
10,000 cells/well in a Seahorse XF96 cell culture Germany). The primers were designed using the
microplate. One h prior to the measurement, cells Primer Express Software (Applera Europe), see
were washed and pre-incubated in PBS containing Suppl. Table S2. Real time PCR was performed
2 mM CaCl2, 2 mM MgCl2, 5 mM glucose and 5 using an ABI 7000 sequence detection system
mM sodium pyruvate in a non-CO2 37°C incubator. (Applera Europe), and PCR products were
Basal measurement was run for 3 cycles followed quantified fluorometrically using the SYBR Green
Downloaded from http://www.jbc.org/ by guest on July 18, 2019
by the sequential addition of 2 μM oligomycin core reagent kit (Life Technologies). The values
(run for 2 cycles), 1 μM FCCP (2 cycles) and 1 obtained were normalized to values of the
μM rotenone/antimycin A (2 cycles). The housekeeping genes 18S rRNA.
calculation of various mitochondrial parameters
was done as follows: ATP production = OCR Statistical analysis
(basal) - OCR (oligomycin stimulated); Total
respiration = OCR (basal) - OCR Statistical analyses were performed using
(rotenone/antimycin A stimulated); Proton leak = GraphPad Prism 6 software, with one-way
OCR (total respiration) - OCR (ATP production); ANOVA when more than two groups of data were
Max. respiration = OCR (FCCP) - OCR compared and with non-parametric Mann-Whitney
(rotenone/antimycin A stimulated). U test when only two groups of data were
concerned. A p value < 0.05 was considered
Plasma lactate measurement significant.
Acknowledgements: We are grateful to Dr. P. Chambon and Dr. D. Metzger (IGBMC, Strasbourg) for
sharing the SA-Cre-ERT2 mice and to Dr. T. Langer and Dr. C. Merkwirth (University of Cologne) for the
Phb2fl/fl mice. We thank Christian Vesin and Florian Visentin for expert animal surgery and sample collections,
Clarissa Bartley for analyses and technical help, Dr. Manon Rosselin for support with TMRM experiments, Dr.
Yalin Emre for help with cytokine measurements, Dr. Sachin Supale for preliminary investigations, Dr. Cyril
Sobolewski for ob/ob samples, and Dr. Thierry Brun for helpful discussions (University of Geneva). We are
grateful to Dr. G. Mithieux’s laboratory (Inserm U855, Lyon) for sharing G6Pase antibody. We thank the
members of bioimaging and histology core facilities (University of Geneva) for technical support.
Conflict of interest: The authors have declared that no conflict of interest exists.
Author contribution: Conceived and designed the experiments: LL, JM-L, MF, J-CM, and PM; performed
the experiments: LL, MK, CJS, MF and JM-L; performed data analysis: LL, JM-L, CJS, MK, MF and PM;
wrote the paper: LL, JM-L and PM.
11Mitochondrial dynamics and liver gluconeogenesis
REFERENCES
1. Petersen, M. C., Vatner, D. F., and Shulman, G. I. (2017) Regulation of hepatic glucose metabolism in
health and disease. Nat Rev Endocrinol 13, 572-587
2. Bellentani, S., Scaglioni, F., Marino, M., and Bedogni, G. (2010) Epidemiology of non-alcoholic fatty
liver disease. Dig Dis 28, 155-161
3. Loomba, R., and Sanyal, A. J. (2013) The global NAFLD epidemic. Nat Rev Gastroenterol Hepatol
10, 686-690
4. Fromenty, B., and Pessayre, D. (1995) Inhibition of mitochondrial beta-oxidation as a mechanism of
hepatotoxicity. Pharmacol Ther 67, 101-154
5. Exton, J. H. (1972) Gluconeogenesis. Metabolism: clinical and experimental 21, 945-990
6. Lane, M., Boczonadi, V., Bachtari, S., Gomez-Duran, A., Langer, T., Griffiths, A., Kleinle, S.,
Dineiger, C., Abicht, A., Holinski-Feder, E., Schara, U., Gerner, P., and Horvath, R. (2016)
Mitochondrial dysfunction in liver failure requiring transplantation. Journal of inherited metabolic
disease 39, 427-436
7. Sunny, N. E., Parks, E. J., Browning, J. D., and Burgess, S. C. (2011) Excessive hepatic mitochondrial
TCA cycle and gluconeogenesis in humans with nonalcoholic fatty liver disease. Cell Metab 14, 804-
810
8. Back, J. W., Sanz, M. A., De Jong, L., De Koning, L. J., Nijtmans, L. G., De Koster, C. G., Grivell, L.
A., Van Der Spek, H., and Muijsers, A. O. (2002) A structure for the yeast prohibitin complex:
Downloaded from http://www.jbc.org/ by guest on July 18, 2019
Structure prediction and evidence from chemical crosslinking and mass spectrometry. Protein Sci 11,
2471-2478
9. McClung, J. K., Jupe, E. R., Liu, X. T., and Dell'Orco, R. T. (1995) Prohibitin: potential role in
senescence, development, and tumor suppression. Exp Gerontol 30, 99-124
10. Tatsuta, T., Model, K., and Langer, T. (2005) Formation of membrane-bound ring complexes by
prohibitins in mitochondria. Mol Biol Cell 16, 248-259
11. Merkwirth, C., Dargazanli, S., Tatsuta, T., Geimer, S., Lower, B., Wunderlich, F. T., von Kleist-
Retzow, J. C., Waisman, A., Westermann, B., and Langer, T. (2008) Prohibitins control cell
proliferation and apoptosis by regulating OPA1-dependent cristae morphogenesis in mitochondria.
Genes Dev 22, 476-488
12. Nijtmans, L. G., de Jong, L., Artal Sanz, M., Coates, P. J., Berden, J. A., Back, J. W., Muijsers, A. O.,
van der Spek, H., and Grivell, L. A. (2000) Prohibitins act as a membrane-bound chaperone for the
stabilization of mitochondrial proteins. EMBO J 19, 2444-2451
13. Steglich, G., Neupert, W., and Langer, T. (1999) Prohibitins regulate membrane protein degradation
by the m-AAA protease in mitochondria. Mol Cell Biol 19, 3435-3442
14. Wei, Y., Chiang, W. C., Sumpter, R., Jr., Mishra, P., and Levine, B. (2017) Prohibitin 2 Is an Inner
Mitochondrial Membrane Mitophagy Receptor. Cell 168, 224-238 e210
15. Ehses, S., Raschke, I., Mancuso, G., Bernacchia, A., Geimer, S., Tondera, D., Martinou, J. C.,
Westermann, B., Rugarli, E. I., and Langer, T. (2009) Regulation of OPA1 processing and
mitochondrial fusion by m-AAA protease isoenzymes and OMA1. J Cell Biol 187, 1023-1036
16. Head, B., Griparic, L., Amiri, M., Gandre-Babbe, S., and van der Bliek, A. M. (2009) Inducible
proteolytic inactivation of OPA1 mediated by the OMA1 protease in mammalian cells. J Cell Biol
187, 959-966
17. Anand, R., Wai, T., Baker, M. J., Kladt, N., Schauss, A. C., Rugarli, E., and Langer, T. (2014) The i-
AAA protease YME1L and OMA1 cleave OPA1 to balance mitochondrial fusion and fission. J Cell
Biol 204, 919-929
18. Supale, S., Thorel, F., Merkwirth, C., Gjinovci, A., Herrera, P. L., Scorrano, L., Meda, P., Langer, T.,
and Maechler, P. (2013) Loss of prohibitin induces mitochondrial damages altering beta-cell function
and survival and is responsible for gradual diabetes development. Diabetes 62, 3488-3499
19. Merkwirth, C., Martinelli, P., Korwitz, A., Morbin, M., Bronneke, H. S., Jordan, S. D., Rugarli, E. I.,
and Langer, T. (2012) Loss of prohibitin membrane scaffolds impairs mitochondrial architecture and
leads to tau hyperphosphorylation and neurodegeneration. PLoS Genet 8, e1003021
2Mitochondrial dynamics and liver gluconeogenesis
20. Korwitz, A., Merkwirth, C., Richter-Dennerlein, R., Troder, S. E., Sprenger, H. G., Quiros, P. M.,
Lopez-Otin, C., Rugarli, E. I., and Langer, T. (2016) Loss of OMA1 delays neurodegeneration by
preventing stress-induced OPA1 processing in mitochondria. J Cell Biol 212, 157-166
21. Civiletto, G., Varanita, T., Cerutti, R., Gorletta, T., Barbaro, S., Marchet, S., Lamperti, C., Viscomi,
C., Scorrano, L., and Zeviani, M. (2015) Opa1 overexpression ameliorates the phenotype of two
mitochondrial disease mouse models. Cell Metab 21, 845-854
22. He, B., Feng, Q., Mukherjee, A., Lonard, D. M., DeMayo, F. J., Katzenellenbogen, B. S., Lydon, J. P.,
and O'Malley, B. W. (2008) A repressive role for prohibitin in estrogen signaling. Mol Endocrinol 22,
344-360
23. Park, S. E., Xu, J., Frolova, A., Liao, L., O'Malley, B. W., and Katzenellenbogen, B. S. (2005)
Genetic deletion of the repressor of estrogen receptor activity (REA) enhances the response to
estrogen in target tissues in vivo. Mol Cell Biol 25, 1989-1999
24. Schuler, M., Dierich, A., Chambon, P., and Metzger, D. (2004) Efficient temporally controlled
targeted somatic mutagenesis in hepatocytes of the mouse. Genesis 39, 167-172
25. Ross, J. A., Nagy, Z. S., and Kirken, R. A. (2008) The PHB1/2 phosphocomplex is required for
mitochondrial homeostasis and survival of human T cells. J Biol Chem 283, 4699-4713
26. Garcia-Ruiz, I., Fernandez-Moreira, D., Solis-Munoz, P., Rodriguez-Juan, C., Diaz-Sanjuan, T.,
Munoz-Yague, T., and Solis-Herruzo, J. A. (2010) Mitochondrial complex I subunits are decreased in
murine nonalcoholic fatty liver disease: implication of peroxynitrite. J Proteome Res 9, 2450-2459
27. Parvez, S., Tabassum, H., Rehman, H., Banerjee, B. D., Athar, M., and Raisuddin, S. (2006) Catechin
Downloaded from http://www.jbc.org/ by guest on July 18, 2019
prevents tamoxifen-induced oxidative stress and biochemical perturbations in mice. Toxicology 225,
109-118
28. Tietge, U. J., Bakillah, A., Maugeais, C., Tsukamoto, K., Hussain, M., and Rader, D. J. (1999)
Hepatic overexpression of microsomal triglyceride transfer protein (MTP) results in increased in vivo
secretion of VLDL triglycerides and apolipoprotein B. J Lipid Res 40, 2134-2139
29. Hui, S., Ghergurovich, J. M., Morscher, R. J., Jang, C., Teng, X., Lu, W., Esparza, L. A., Reya, T., Le,
Z., Yanxiang Guo, J., White, E., and Rabinowitz, J. D. (2017) Glucose feeds the TCA cycle via
circulating lactate. Nature 551, 115-118
30. Farese, R. V., Sajan, M. P., and Standaert, M. L. (2005) Insulin-sensitive protein kinases (atypical
protein kinase C and protein kinase B/Akt): actions and defects in obesity and type II diabetes. Exp
Biol Med (Maywood) 230, 593-605
31. von Wilamowitz-Moellendorff, A., Hunter, R. W., Garcia-Rocha, M., Kang, L., Lopez-Soldado, I.,
Lantier, L., Patel, K., Peggie, M. W., Martinez-Pons, C., Voss, M., Calbo, J., Cohen, P. T.,
Wasserman, D. H., Guinovart, J. J., and Sakamoto, K. (2013) Glucose-6-phosphate-mediated
activation of liver glycogen synthase plays a key role in hepatic glycogen synthesis. Diabetes 62,
4070-4082
32. Burgess, S. C., He, T., Yan, Z., Lindner, J., Sherry, A. D., Malloy, C. R., Browning, J. D., and
Magnuson, M. A. (2007) Cytosolic phosphoenolpyruvate carboxykinase does not solely control the
rate of hepatic gluconeogenesis in the intact mouse liver. Cell Metab 5, 313-320
33. Danial, N. N., Gramm, C. F., Scorrano, L., Zhang, C. Y., Krauss, S., Ranger, A. M., Datta, S. R.,
Greenberg, M. E., Licklider, L. J., Lowell, B. B., Gygi, S. P., and Korsmeyer, S. J. (2003) BAD and
glucokinase reside in a mitochondrial complex that integrates glycolysis and apoptosis. Nature 424,
952-956
34. Ross, J. A., Robles-Escajeda, E., Oaxaca, D. M., Padilla, D. L., and Kirken, R. A. (2017) The
prohibitin protein complex promotes mitochondrial stabilization and cell survival in hematologic
malignancies. Oncotarget 8, 65445-65456
35. Wieckowska, A., Zein, N. N., Yerian, L. M., Lopez, A. R., McCullough, A. J., and Feldstein, A. E.
(2006) In vivo assessment of liver cell apoptosis as a novel biomarker of disease severity in
nonalcoholic fatty liver disease. Hepatology 44, 27-33
36. Ly, J. D., Grubb, D. R., and Lawen, A. (2003) The mitochondrial membrane potential (deltapsi(m)) in
apoptosis; an update. Apoptosis : an international journal on programmed cell death 8, 115-128
37. Desagher, S., and Martinou, J. C. (2000) Mitochondria as the central control point of apoptosis.
Trends Cell Biol 10, 369-377
3You can also read