Hotspot policing for murder and robbery - A Cape Town case study Ian Edelstein, Robert Arnott and Andrew Faull - Amazon AWS
←
→
Page content transcription
If your browser does not render page correctly, please read the page content below
Hotspot policing for murder
and robbery
A Cape Town case study
Ian Edelstein, Robert Arnott and Andrew Faull

  Accurate, point-level crime analysis and targeted hotspot policing can help reduce murder
  and robbery in South African cities. Using Durbanville and Nyanga, an analysis of SAPS point-
  level murder and aggravated robbery data from 2006 to 2018 by place and time reveals crime
  hotspots and time patterns. The report shows that crime and harm cluster together, and
  outlines examples of evidence-based police interventions that may have a positive impact in
  such areas.

                                                                 SOUTHERN AFRICA REPORT 34 | FEBRUARY 2020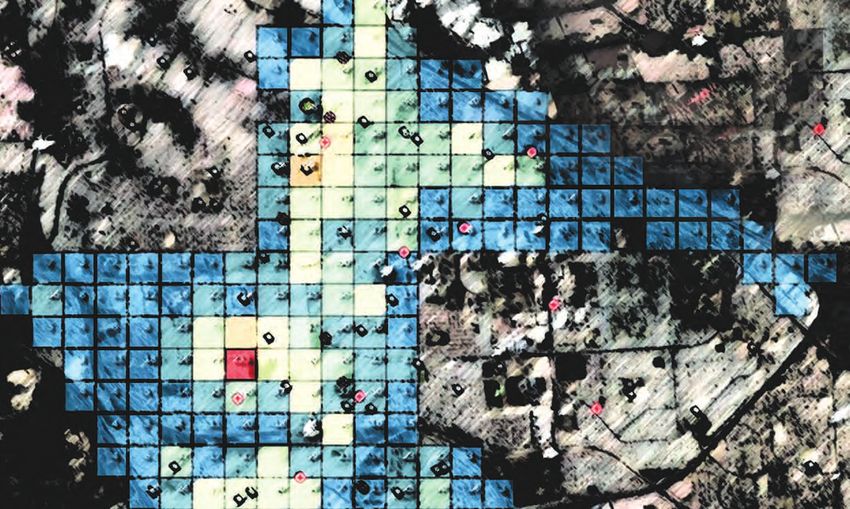
Key findings

           	A large portion of murder and aggravated                 other next to the Fisantekraal train station
             robbery occurs in predictable places 		                  and township.
             and times.                                           	Murders in Durbanville mostly occur on
           	Focused policing, guided by accurate                   weekend nights. Aggravated robberies occur
             crime data, can reduce harm where it is                throughout the day and week.
             most common.                                         	Violent crimes in Nyanga are more numerous
           	Police may be able to reduce crime by visiting         and dispersed. Five murder hotspots were
             hotspots for just 15 minutes per hour.                 detected; four in residential areas and one at the
                                                                    taxi rank. Distinct aggravated robbery hotspots
           	Police may be able to reduce crime by                  were detected along several roadways.
             focusing on problems, people and behaviour
                                                                  	Murders in Nyanga peak between 7 pm on
             in hotspots.
                                                                    Saturdays and 3 am on Sundays. Aggravated
           	Significantly fewer murders and robberies              robberies peak at 5–7 am every day of the
             occur in Durbanville (an affluent area) than           week, and 7–9 pm over weekends.
             Nyanga (a poorer area).
                                                                  	One murder hotspot of 2 496 m2, or equivalent
           	Murder and aggravated robbery in Durbanville           to a circle 56 m in diameter, has seen 71
             are highly concentrated in two clusters, one           murders since 2007; the highest concentration
             in the CBD and near the police station, the            in the Nyanga police precinct.

         Recommendations

          	Police and their partners must accept that                informed policing and violence prevention
            accurate crime data, in terms of precise location,        interventions should be able to disrupt.
            precise time and nature of the event, is critically
                                                                  	Police should focus attention and resources
            important and crucial for any effective crime
            reduction policing intervention. It precludes all         where, when and with whom murder and
            findings and further recommendations.                     robbery are most predictable.

          	Police leaders should promote an                      	Formulating station-level hotspots for each
            organisational culture in which creating and              day of the week and across various times of
            sharing empirical knowledge (evidence-based               the day should inform policing operations and
            policing) is encouraged.                                  impact evaluations in ways that test hypotheses,
          	To the extent that the SAPS’s crime data can              generate evidence about ‘what works’ and
            be accepted as accurate, there are hotspots               ‘how’ it works to tackle specific problems and
            and peak days and times that careful, evidence-           improve police efficiency and impact.

2   HOTSPOT POLICING FOR MURDER AND ROBBERY: A CAPE TOWN CASE STUDY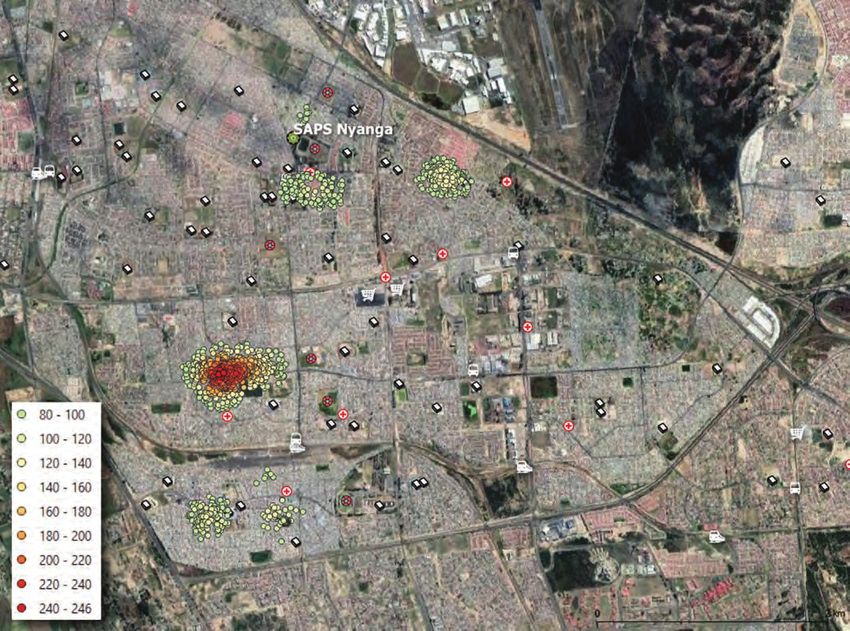
Introduction                                                  A lot of robbery is carried out by a relatively small number
Accurate, detailed information about where and when           of repeat offenders and organised groups, and follows
specific crime types have occurred is crucial if the police   predictable patterns. This is true of many other types of
are to have any chance at measurably improving public         crime, too.8 This means that with adequate information
safety. In particular, point-level1 crime information and     and analysis, the police should be able to prevent and
analysis can enable targeted hotspot policing that will       reduce such crimes where they are most common.
reduce murder and robbery in South Africa.                    In 2018/19, 20% of all reported aggravated robberies in
This report shows why accurate crime information and          South Africa and 21% of murders occurred in fewer than
analysis must underpin all police resource deployment         3% (n=30) of police precincts. Within these areas, many
and operations in South Africa’s most violent areas, and      murders and robberies occur in small geographic areas
why related deployment must be based on interventions         and at predictable times. Research shows that when
that research shows are likely to work.                       police use accurate crime data to target their resources
                                                              and activities in particular ways, they can effectively
South Africa records high and increasing rates of murder      reduce crime.9
and aggravated robbery.2 Between 2011 and 2019,
                                                              This report illustrates how accurate, point-level crime
police-recorded murder increased by 35% to 21 022
                                                              analysis and targeted hotspot policing can reduce
in 2018/19, or a rate of 36.4 per 100 000 residents.
                                                              murder and robbery. It begins by introducing evidence-
Similarly, from 2004 to 2019, reported aggravated
                                                              based policing as a concept, and how it can improve
robbery – robbery with a dangerous weapon or causing
                                                              police effectiveness. It then presents an analysis of
serious harm – increased by 39% to 140 032 counts.3
                                                              crime in two Cape Town precincts – Durbanville and
In 2018/19, 57% of reported aggravated robberies              Nyanga – to illustrate how crime analysis should inform
occurred in the street, where they are most likely to         targeted police interventions across South Africa. It ends
affect the poor. House robberies accounted for 16% of         by highlighting concerns about the way in which some
the category, 14% were business robberies and 12%             SAPS data is captured.
hijackings. Survey data suggests that street robberies
surged in 2018/19, but that 65% of victims did not report     Evidence-based policing
the crime to police.4                                         Policing should be based on the best existing
                                                              demonstrable knowledge, or evidence, about what
   Accurate, point-level crime analysis                       works to achieve intended goals. If police want to
                                                              reduce burglaries in a particular area, then efforts
   and targeted hotspot policing can                          should be based not on common sense but on lessons
   reduce murder and robbery                                  learned from previous attempts to reduce burglary.
                                                              The same applies to reducing violence, building trust,
                                                              or tackling street robbery. This logic underscores
Reducing murder and robbery should be a priority for
                                                              evidence-based policing.10
South Africa’s police and government. In a country where
murder is as common as it is, homicide can be thought         In evidence-based policing, police do not simply learn
of as a proxy for broader violence. To bring down murder,     from their own experiences – though these are important.
police must address the times, places, people and             Instead, they work with others to understand the
behaviours in which murder-related violence occurs.5          outcomes of their work, and feed this knowledge into
                                                              their training curricula, policies and operations.11
Similarly, the threat of aggravated robbery leaves millions
of people feeling unsafe in the street, in a car, at work,    For example, does stop-and-search prevent robbery,
and at home.6 Such fears promote distrust between             build public trust and/or alienate young men? How do
strangers, suppress economic growth, and generally            we know? To have confidence in the answer, it needs to
prevent the kinds of social cohesion required to build        have been tested, evaluated, documented and shared,
prosperous, peaceful communities.7                            preferably in a range of settings and by different groups.

                                                                              SOUTHERN AFRICA REPORT 34 | FEBRUARY 2020      3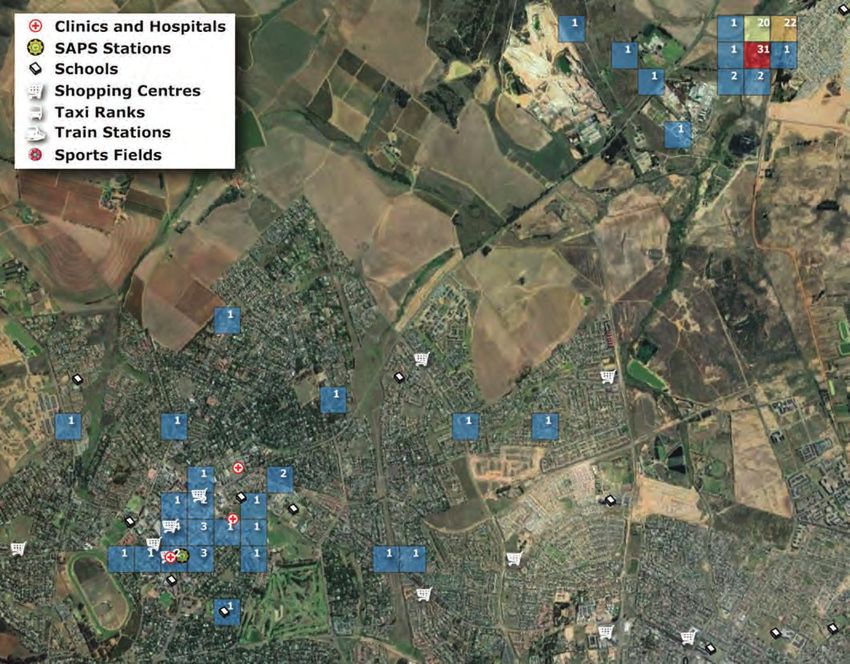
When we have a reliable answer, it can be used to            decade as a result of police officer abuse and negligence.15
    guide policing.                                              Similarly, it has been argued that criminal courts should
                                                                 expect the same knowledge expertise from police that they
    Evidence-based policing is often compared to medicine.
                                                                 expect from other non-police expert witnesses.16
    Each day, doctors try to solve their patients’ health
    problems. Doctors know that medicine is most effective       In other words, it could be said that police have an
    when based on the latest knowledge about what                ethical obligation to use police practices that are most
    works to address particular problems. As a result, they      likely to work and least likely to cause harm. This is
    constantly research, monitor and learn from how their        particularly true in areas with high rates of murder and
    patients respond to treatments. Doctors do not assume        robbery. Police cannot do everything or be everywhere,
    that what they learnt in medical school will forever and     but they can do what is mostly likely to work, where it
    always be the best way to do something.                      is needed most.17 They should be supported and held
                                                                 accountable for doing this.
    Similarly, our understanding about what works and
    what does not in policing and crime prevention is            What does the evidence tell us?
    developing.12 When police understand the causes of
                                                                 Reviews of the most rigorous studies on policing have
    the problems they face in their work, and when they are
                                                                 produced a number of important lessons. Firstly, what
    familiar with the tools that will most effectively address
                                                                 is often thought of as the standard model of policing –
    these, they are more likely to be effective.
                                                                 random patrols, rapid response and mandatory follow-up
    There is a strong and growing body of evidence about         investigations – does not reduce general crime.18 Such
    what works in policing and crime prevention.13 While         practices should be avoided.
    some South African police officers and researchers
                                                                 Proactive and focused policing is much more effective.
    are aware of it, most are not, and these lessons and
                                                                 Here, police focus on the places, people and behaviours
    practices may not inform daily police work or research
                                                                 most commonly associated with criminality.19 These can
    in the country. This needs to change, especially when
                                                                 be identified through crime analysis and intelligence.20
    existing evidence suggests that South African police
    should be able to significantly reduce murder                Similarly, policing that targets particular crime problems,
    and robbery.14                                               and that seeks to understand and address their
                                                                 underlying causes, is effective. This is called problem-
                                                                 oriented policing, and is very similar to sector policing in
       Police cannot be everywhere, but they                     South Africa (though sector policing has never really been
       can do what is most likely to work,                       implemented effectively).21

       where it is needed most                                   The approach should be systematic, beginning with
                                                                 analysis, tailoring a response plan, implementing the
                                                                 plan, and monitoring its impact to determine whether it
    Evidence-based policing is not a passing fad. Doctors
                                                                 works.22 Problem-oriented policing should be adopted
    can be sued or lose their medical licences if they cause
                                                                 wherever relevant.
    patients unnecessary harm, suffering or cost by applying
    practices or treatments other than those supported by        The final area in which existing evidence provides clear
    evidence. As police science advances, the same is likely     guidance to the policing of hotspots relates to the
    to occur in policing – where individuals, communities        way police engage with others. Research shows that
    and governments will hold police accountable when their      when police are fair, consistent and professional in their
    activities are not based on good evidence (or evidence-      interactions with victims, suspects and the general public,
    based logic), and end up causing harm.                       people are more likely to trust and cooperate with them,
                                                                 and to obey the law in their absence.23
    The South African Police Service (SAPS) already faces
    hundreds of millions of rands worth of civil claims, an      The above are broad lessons emerging from the existing
    amount that has increased substantially over the past        evidence. Some other strategies have also shown to be

4   HOTSPOT POLICING FOR MURDER AND ROBBERY: A CAPE TOWN CASE STUDY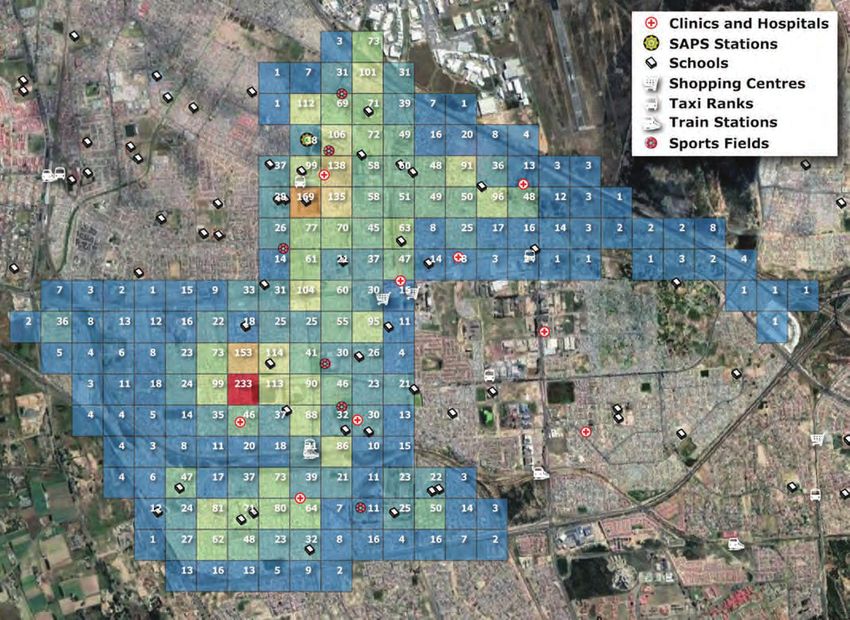
effective, while others have backfired (leading to more crime). One of the most
effective and easy to implement is hotspot policing, which will be returned
to shortly. In order to implement hotspot policing – or almost any evidence-
based intervention, for that matter – accurate crime data is essential.

Importance of crime analysis
It seems common sense that policing, like any problem-solving initiative,
be based on careful analysis. For this reason, the SAPS appoints Crime
Information Management and Analysis Centre (CIMAC) officials at the station
level to help guide a station’s work.24 In some precincts, officials will plot
daily crime on maps and present it to patrol officers for briefings, along with
recommended policing strategies.

Stations are also expected to maintain Crime Intelligence Profiles, which
should include precinct hotspots, crime priorities, and date and time analyses
of crimes.25 This is a rational and appropriate foundation from which to
systematically tackle crime problems.

   Police have an obligation to use practices that are most
   likely to work and least likely to cause harm

The quality of station-level crime data is a critical component in effective
policing. It should be integrated into daily operations and monitored, and
police activities should be adjusted based on changes in the data. This
requires significant investments and dedicated leadership so as to ensure
that an organisational culture is established that recognises and champions
the use of data in its work.

Unfortunately, research suggests that such a culture is lacking in the SAPS,
where officers may not accurately capture data or work in accordance with
their crime data.26

Policing has historically celebrated experience and professional knowledge
over research, and police organisations can be resistant to change.27 But when
police practices are found to be inadequate for improving public safety or
potentially harmful to the public, then police have an obligation to change and
adapt to new realities.

A 2019 study carried out by the Cambridgeshire Constabulary (UK) illustrates
the disjuncture between intuition and research. Using face-to-face surveys, it
explored how accurately a small sample of police officers (n=123) could identify
the highest crime street locations and offenders in their area, compared with
actual records.

It found that officers were 91% inaccurate in naming the most prolific suspected
                                                                                                EXPERIENCE SHOULD BE
offenders and 95% inaccurate in naming the most harmful suspected offenders.                     COMPLIMENTED WITH
They were 77% incorrect in naming the streets with the highest frequency of                          GOOD DATA
crimes, and 74% incorrect in identifying those streets generating the most harm.

                                                                                  SOUTHERN AFRICA REPORT 34 | FEBRUARY 2020   5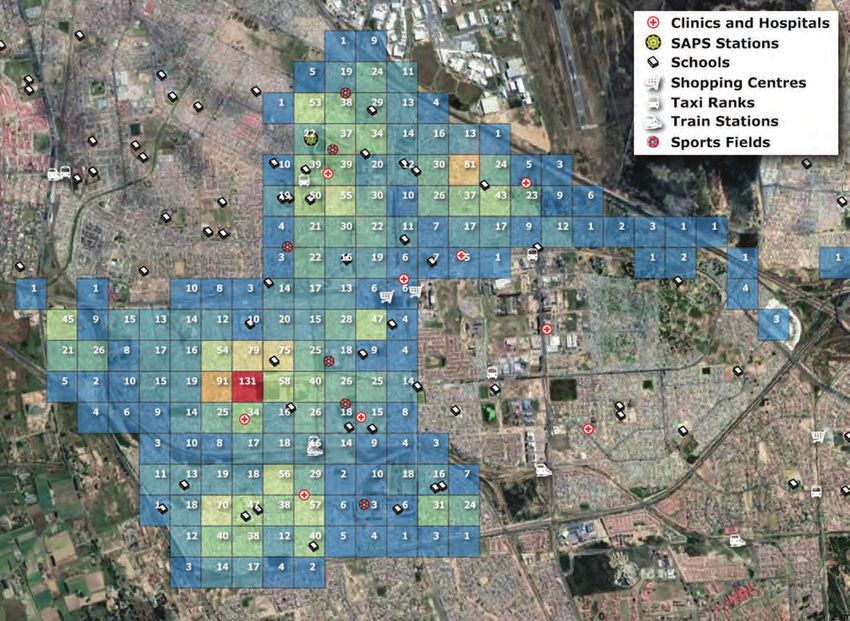
Although the study was small, it suggests that, despite        and passive surveillance, victim awareness initiatives,
    significant experience and professional knowledge, police      upgrades to infrastructure, or various types of police-
    officers’ knowledge of crime trends may not be nearly          specific focused enforcement acitvities.
    as accurate as that provided by data stored on well-
                                                                   Importantly, evidence suggests that hotspot policing does
    managed police systems.28
                                                                   not displace crime to surrounding areas. Instead, areas
    It is important, then, to approach operational planning        around targeted hotspots tend to experience a reduction in
    and problem solving without preconceived ideas or              crime as well.34
    convictions. Instead, information must be gathered and
                                                                   Hotspot policing is more effective in addressing violent
    analysed, ideas proposed and questions asked, and the
                                                                   crime than property offences. When hotspot policing is
    evidence consulted.
                                                                   combined with problem-oriented policing (i.e. a systematic
    The best sources of information that should inform             approach is taken to understanding and tackling problems
    police planning come from community sources, crime             in the area), it is twice as effective as hotspot policing that
    intelligence and crime analysis.29 Our focus here is the       merely uses traditional patrol strategies.35
    latter, but in all instances the data produced should be
                                                                   Focusing resources on hotspots also seems like common
    accurate, precise, consistent, complete and reliable.30
                                                                   sense. But South African police commanders may not feel
    It should also be used to guide activities – not simply
                                                                   they have the luxury of focused deployment when almost
    presented to officers for compliance reasons.
                                                                   everyone in their precinct feels unsafe and they face
                                                                   internal and external pressure to increase police visibility.
       Evidence suggests that the best                             Similarly, simply identifying an area as a ‘hotspot’ does
                                                                   not automatically mean it deserves additional resources.
       outcomes occur when police                                  Hotspots should be considered against other hotspots
       communicate effectively                                     and priorities.

                                                                   Assigning officers to too many hotspots can undermine
    While the SAPS has put systems in place to apply this          effectiveness, spreading resources too thinly or
    type of policing, it is not clear that its data is accurate,   demotivating officers through the monotony of a task. This
    precise, consistent, complete or reliable.31                   can be addressed with careful leadership, hotspot-related
                                                                   training, and systems that hold officers accountable for
    In the next section we summarise the evidence in support
                                                                   their assignments (e.g. reviewing a patrol car’s automatic
    of hotspot policing.
                                                                   vehicle location [AVL] data).
    Policing hotspots
                                                                   For example, officers can be encouraged to engage in
    Some of the most effective policing is that which targets      regular, purposeful conversations in hotspots, consult
    people, places and behaviours commonly associated              with people at risk of offending, or engage in respectful
    with crime. Associations between crime, place and time         stop-and-search routines, depending on appropriateness.
    can be identified through effective crime analysis and are     Activities pursued in hotspots should vary depending on
    called ‘hotspots’.                                             the category of crime or disorder being addressed.
    There is no set definition of a hotspot, though it usually     It is also important to consider how hotspot policing
    refers to a small area rather than an entire neighbourhood     activities may be perceived by the public. Some
    or precinct.32 Hotspots can be as pointed as a single          communities or individuals may perceive a focus on their
    building (e.g. block of flats) or business (e.g. a bar), or    area as a sign that the state mistrusts them, while others
    as large as a city block.33 Hotspot policing involves the      may welcome it. Either way, the evidence suggests that
    targeting of resources and activities in such places.          the best outcomes occur when police communicate
                                                                   effectively and treat all people fairly.36
    Exactly what police and their partners do in hotspots
    can vary depending on the problem being addressed.             While addressing the causes of crime or harm in
    Strategies may employ crime prevention through active          hotspots can involve a range of stakeholders, there are

6   HOTSPOT POLICING FOR MURDER AND ROBBERY: A CAPE TOWN CASE STUDY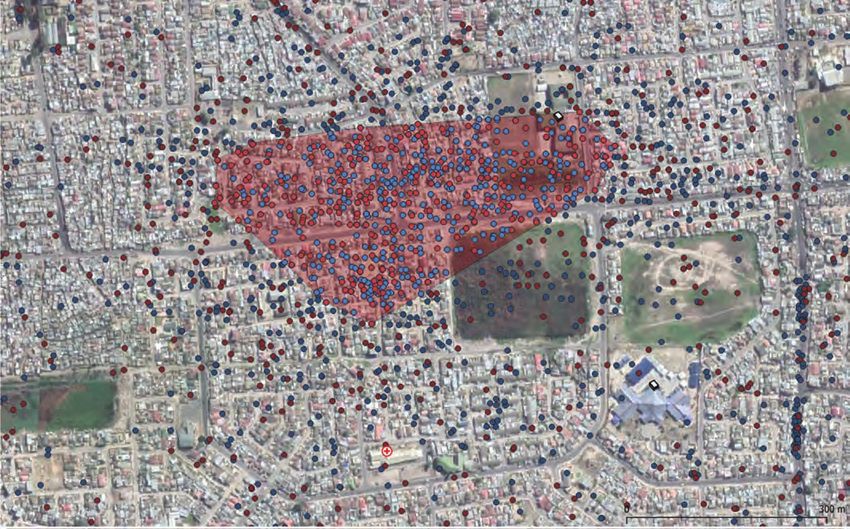
at least three evidence-informed strategies where police should take the
lead in implementation.
Strategy 1: General hotspot policing37

Providing a police presence in crime hotspots, and pursuing related
activities, is central to basic hotspot policing. However, where resources
are scant, evidence suggests that such policing need not detract from
other responsibilities.

• Police stations should use crime analysis to identify two to five problem
  areas or hotspots in their area.

• During each shift, when not responding to calls for service or attending to
  other tasks, officers should be present in the pre-selected areas for 10–15
  minutes at a time.

• Depending on the type of crime in the area, they should spend this time
  on foot patrol, speaking with the public, questioning suspicious people, or
  searching suspicious vehicles, among other strategies. They should always
  engage with the public respectfully and fairly, and respond clearly and
  politely to questions about what they are doing.

• Police should randomly repeat this process throughout their shifts,
  whenever time allows. In this way, hotspots can be policed without
  negatively impacting general police services.

   Evidence suggests that hotspot policing doesn’t
   displace crime but instead helps reduce it in areas
   around targeted hotspots

Strategy 2: Problem-oriented policing in hotspots38

Problem-orientated policing (POP) in hotspots involves trying to identify,
understand and address a specific problem in a hotspot. Responses are
tailored to each situation and are monitored to determine whether they are
effective or not. They can involve activities and interventions that are not
police-intensive, such as changes to the physical environment, but can still be
initiated or supported by police. POP generally includes the following steps:

• Identify and prioritise crime and disorder problems in their area (or in
  specific hotspots)

• Analyse problems to try to understand their underlying causes

• Develop a response that will address the underlying causes of the identified
  problem – this may require working with various partners, including the
  municipality, schools and community groups                                                    PROBLEM-SOLVING IN
                                                                                                 HOTSPOTS CAN BE
• Monitor the implementation of the response to assess whether it is having                       VERY EFFECTIVE
  the desired effect – if it is not, revise the plan and keep monitoring

                                                                                 SOUTHERN AFRICA REPORT 34 | FEBRUARY 2020   7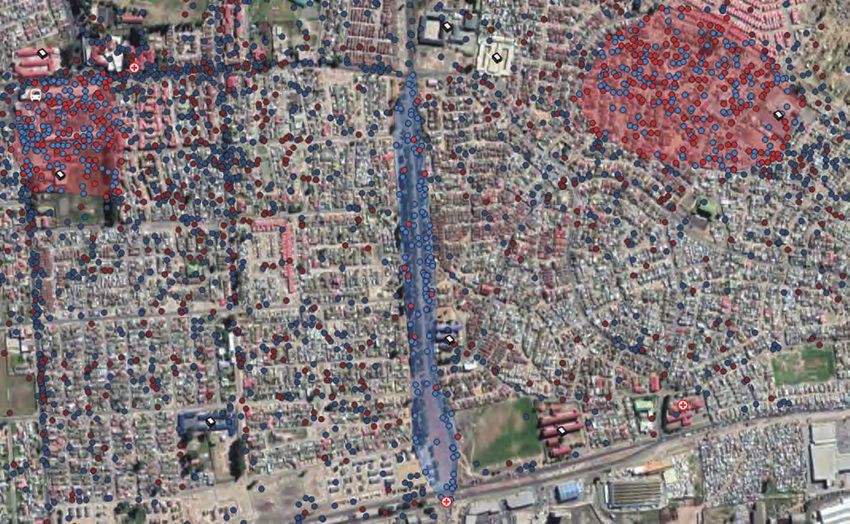
Strategy 3: Focused deterrence in hotspots39                  Mapping crime for evidence-based policing
    Most violence is committed by a small percentage of           In the remainder of this report we present an analysis
    people. In some instances, offenders reside or offend         of 12 years of murder and robbery data for two areas
    in a relatively small geographic area. This is often true     in Cape Town. Our aim is to demonstrate how such
                                                                  techniques can reveal crime hotspots, which in turn can
    for most types of robbery and gang-related violence.
                                                                  be used to guide and assess interventions, such as those
    Identifying, targeting and supporting such offenders can
                                                                  outlined above.
    reduce incidents of related crime and harm.
                                                                  Study sites
    • Use crime analysis and intelligence to identify high-risk
      offenders operating in local hotspots                       The Cape Town metropole is among the most violent in
                                                                  the world. In 2017/18 its murder rate was 69 per 100 000
    • Partner with other government stakeholders (teachers,
                                                                  residents, compared to a South African average of 3641
      prosecutors, social workers, etc.) and community
                                                                  and a global average of 6.42 Although crime and violence
      members to address the problem
                                                                  are pervasive in the city, a disproportionate number of
    • Create a crime intervention plan: assign roles to various   incidents and harm occur in just a few locations.
      members of the team, and make sure everyone agrees          This study compares a high-incident, high-harm police
      on the goal, and their task in reaching it                  precinct (Nyanga) with a relatively low-incident, low-
    • Contact identified individuals to tell them about the       harm precinct (Durbanville) to illustrate the clustering and
      team’s work in the area, and to let them know that          predictability of crime in hotspots.
      violence will not be tolerated

    • Offer them social and economic support where                   A disproportionate number of
      possible – complementing the threat of arrest with             incidents and harm occur in
      positive opportunities to change
                                                                     just a few locations
    • Respond swiftly when targeted individuals offend but
      also follow through on offers of support to those willing
                                                                  Durbanville is an affluent, spacious suburb in Cape
      to accept it
                                                                  Town’s northern suburbs. According to the last national
    These three strategies are not the only ways to address       census, in 2011 the Durbanville main place (the census
    crime in hotspots. However, they are supported by good        equivalent of a suburb) covered 21.78 km2 with a
    evidence and so should be among the first considered          population of 40 944 people and 15 258 households.43
    by police, as they are likely to work. Of course, there is
                                                                  The population was 81% white, 96% of 15–64-year-
    overlap between them, and they can be combined and
                                                                  old residents were employed, 14% of households
    adapted as needed.                                            had a monthly income of R3 200 or less, and 99%
    Problem solving in hotspots may require changes to            of households lived in formal dwellings. The effective
    the environment (e.g. introducing street lighting) or         population densities were 1 880 people per km² and
    public awareness campaigns (e.g. when street robbery          700.6 households per km2.
    is common near a taxi rank), for example.40 The key           In contrast, Nyanga is one of Cape Town’s oldest
    message, however, is that policing that is focused,           townships, originally established to house migrant
    guided by and evaluated through data, is likely to be         workers. The Nyanga main place covers 3.09 km²
    more effective than policing that is not. This logic is       and in 2011 had a population of 57 996 people and
    supported by a growing evidence base.                         15 993 households.44

    Considering the concentrated nature of murder and             The population was 99% black, 55% of 15–64-year-
    robbery in South Africa, police should be able to reduce it   olds were employed, 74% of households had a monthly
    where it is most common.                                      income of R3 200 or less, and 67% of households lived

8   HOTSPOT POLICING FOR MURDER AND ROBBERY: A CAPE TOWN CASE STUDY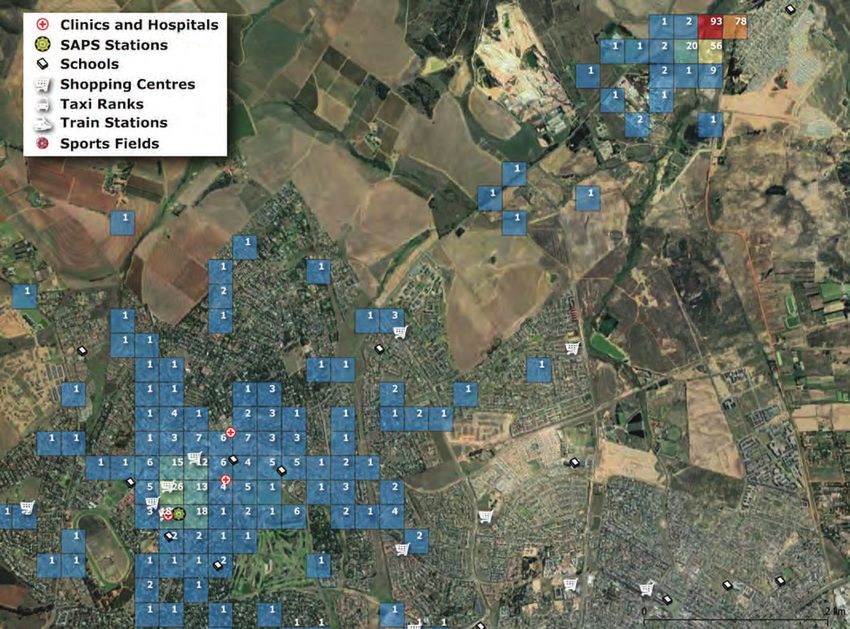
in formal dwellings. The effective population densities                                The analyses focus on murders and aggravated
for Nyanga were 18 775 people per km² and 5 177                                        robberies (robberies with a weapon: either a firearm or an
households per km², making it one of the most densley                                  instrument other than a firearm).
populated main places in the country.45
                                                                                       In total, over the 12-year period 3 236 murders were
In both Durbanville and Nyanga the police station                                      recorded in Nyanga, 145 murders in Durbanville, 6 136
boundaries do not correspond with the census main                                      aggravated robberies in Nyanga and 689 aggravated
place boundaries. For example, the Nyanga precinct                                     robberies in Durbanville.
covers roughly 14 km2 with an estimated population of
over 200 000 residents.46 This means that some crimes
within these communities are recorded at other police                                     Over 12 years, 3 236 murders
stations and vice versa.                                                                  were recorded in the
Durbanville and Nyanga are approximately 20 km apart.                                     Nyanga precinct
Although at extremes, they represent the contrast
between a low population-density, affluent suburb and a
                                                                                       Murder trends by year (Figure 1) show increases in both
disadvantaged, high population-density township with a
                                                                                       communities from 2011, reaching a peak in Nyanga in
mix of formal and informal areas.
                                                                                       2015–2016 (345 murders), and in Durbanville in 2017–
Data                                                                                   2018 (22 murders). Aggravated robberies (Figure 2)
                                                                                       increased significantly in both communities from 2011,
Geo-coded, point-level crime data for the Durbanville
                                                                                       reaching peaks in 2017–2018 (985 in Nyanga and 100
and Nyanga police stations was obtained through a
                                                                                       in Durbanville).
public information request to the SAPS. The datasets
list all reported contact crimes by police precinct, crime                             These totals represent threefold or greater increases in both
category, date and time, and geolocation from 1 April                                  communities since 2011. Notably, there is a ratio of 4.75:1
2006 to 31 March 2018, a 12-year period. No further                                    aggravated robberies to murders in Durbanville, compared
metadata or information has been provided by the SAPS                                  to 1.90:1 in Nyanga. This highlights the extremely violent
on the datasets.                                                                       nature of crime in the Nyanga police precinct.

Figure 1: Murders by year (1 April to 31 March) for Durbanville and Nyanga
                    350                                                                                                                  35

                    300                                                                                                                  30

                    250                                                                                                                  25
                                                                                                                                              Durbanville murders
   Nyanga murders

                    200                                                                                                                  20

                    150                                                                                                                  15

                    100                                                                                                                  10

                     50                                                                                                                  5

                     0                                                                                                                   0
                          2007   2008     2009       2010        2011       2012       2013     2014     2015       2016   2017   2018
                                                            Nyanga murders                    Durbanville murders

Note: Different scales are used for Nyanga (left axis) and Durbanville (right axis).

                                                                                                        SOUTHERN AFRICA REPORT 34 | FEBRUARY 2020                   9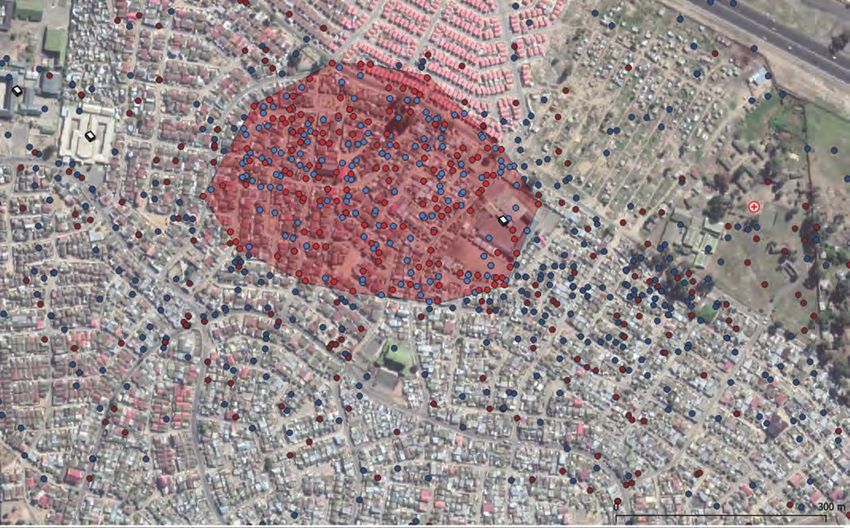
Figure 2: Aggravated robberies by year for Durbanville and Nyanga

                                    1 000                                                                                                       100

                                     900                                                                                                        90

                                     800                                                                                                        80

                                                                                                                                                      Durbanville aggravated robbery
        Nyanga aggravated robbery

                                     700                                                                                                        70

                                     600                                                                                                        60

                                     500                                                                                                        50

                                     400                                                                                                        40

                                     300                                                                                                        30

                                     200                                                                                                        20

                                     100                                                                                                        10

                                       0                                                                                                        0
                                            2007   2008   2009   2010   2011      2012      2013     2014     2015     2016    2017     2018
                                                           Nyanga aggravated robbery               Durbanville aggravated robbery

     Note: Different scales are used for Nyanga (left axis) and Durbanville (right axis).

     Analysis methods                                                                       The final threshold levels for hotspot identification are
                                                                                            set to 20, 30 and 80 murder incidents, respectively,
     We built on the methodology for spatial (space) data
                                                                                            in Nyanga, and two murders within 50 m radii of a
     presentation, visualisation and analysis developed
                                                                                            central point in Durbanville. Murder concentrations are
     and used in Edelstein and Arnott’s 2019 examination
                                                                                            given priority in initial hotspot identification. Additional
     of point-level crime data in Khayelitsha, Cape Town.47
                                                                                            aggravated robbery hotspots are manually identified
     This includes the binning (combining) of murder and
                                                                                            along several street corridors in Nyanga.
     aggravated robbery data into 267 m by 267 m square
     grids to plot the general location of crime concentrations.                            Detailed space and time analysis of the hotspots
                                                                                            follows.49 The space and time (time of day and day of
     Empirical hotspot identification is then separately
                                                                                            week) concentrations are depicted in a standardised
     conducted using the fuzzy mode analysis method
                                                                                            visual format. Ratcliffe refers to the spatial aspects of
     (F-mode),48 which involves totalling the number of
                                                                                            crime hotspots as dispersed, clustered or hot point, and
     incidents (murders or robberies) over the 12-year period
                                                                                            to the time aspects as diffused, focused or acute.50 We
     within 50 m, 100 m, and 200 m radii of a central point.
                                                                                            use this terminology, where appropriate, to describe the
                                                                                            space–time profiles for each identified hotspot.
           The data highlights the extremely                                                Hotspots for Durbanville and Nyanga, respectively, are
           violent nature of crime in the                                                   presented showing their location in the police precinct
           Nyanga precinct                                                                  and crime distribution with small graphs showing time
                                                                                            of day and day of week trends for visual comparison.
                                                                                            Detailed hotspot visualisations and graphs of murders
     Initially, a limit of five incidents is chosen, and all points
                                                                                            and aggravated robberies by time of day, day of the
     with fewer than this number of incidents (within the
                                                                                            week, are also presented.
     chosen radius) are removed, revealing areas with
     higher crime densities. The limits are then increased                                  Evidence of unnatural, gridded data, lying along an
     incrementally, revealing the most prominent hotspots.                                  evenly spaced geo-coordinate grid, was discovered in

10   HOTSPOT POLICING FOR MURDER AND ROBBERY: A CAPE TOWN CASE STUDY
previous analyses of Khayelitsha crime data.51 It must be data about when and where crime occurs, it will be
assumed that such data is at least partially inaccurate, unable to address it effectively.
as it is impossible for dozens of crime incidents to occur
Analysis and visualisations
at exactly the same distance from one another along a
perfectly spaced geometric grid. Time analyses: murder
In the Nyanga and Durbanville data, evidence of gridded Figure 3 shows that, over the 12-year period, murders
data is again found. Such errors make space analysis, most often occur between 6 pm and 6 am in both
hotspot identification and police planning difficult. If a Durbanville and Nyanga. Fewest murders occur in the late
police service or local authority does not have accurate morning to early afternoon, with increases from 4–7 pm
Figure 3: Murder by hour of the day, Durbanville and Nyanga, 2006–2018
9
8
Percentage of all murders (%)
7
6
5
4
3
2
1
0
:00 1:00 2:00 3:00 4:00 5:00 6:00 7:00 8:00 9:00 0:00 1:00 2:00 3:00 4:00 5:00 6:00 7:00 8:00 9:00 0:00 1:00 2:00 3:00
00 0 0 0 0 0 0 0 0 0 1 1 1 1 1 1 1 1 1 1 2 2 2 2
Nyanga (Total: 3 236) Durbanville (Total: 145)
Figure 4: Murder by day of week, Durbanville and Nyanga, 2006–2018
40
35
Percentage of all murders (%)
30
25
20
15
10
5
0
Monday Tuesday Wednesday Thursday Friday Saturday Sunday
Nyanga (Total: 3 236) Durbanville (Total: 145)
SOUTHERN AFRICA REPORT 34 | FEBRUARY 2020 11in Durbanville and 9 pm in Nyanga, followed by several In Nyanga, where there were far more incidents, murder
hours of decline (three hours in Durbanville; one hour increases gradually from 7 pm on Fridays to 1 am on
in Nyanga), with additional peaks between 11 pm and Saturdays, and again from 5 pm on Saturdays until
1 am and declines thereafter.52 2 am on Sundays (Figure 6). Incidents increase again
on Sundays from 5 pm, peaking around 8 pm and
The early evening spikes from 6–7 pm in Durbanville
declining gradually into Monday morning. Like Durban-
and 8–9 pm in Nyanga are notable and could inform
ville, most murders occur on weekends and at night.
problem-oriented responses.
Time analyses: aggravated robbery
In both areas, murder is least common from Tuesday
to Thursday, with increases on Fridays. Incidents Aggravated robberies are relatively dispersed by time
roughly triple on Saturday and Sunday, tapering into of day in Durbanville with two relative peaks seen
early Monday mornings. Murders occurring around around commuting hours, 5–8 in the mornings and
or after midnight may lead to some day-of-the-week 7–9 in the evenings. Aggravated robberies in Nyanga
coding inconsistencies (e.g. late Saturday night crimes see a spike during morning commuting hours, i.e.
listed as Sunday morning). Either way, the data clearly 5–7 am, and a second, more gradual peak during
suggests that most murder occurs on Saturdays and evening commuting hours, from 6–9 pm. It is least
Sundays, and mostly at night, as depicted in figures 5 common from 11 pm to 3 am.
and 6.
Aggravated robbery peaks on Fridays and Saturdays in
In Durbanville (Figure 5), murder peaks between 5 pm both communities, and is relatively consistent on other
and 11 pm on Saturdays and Sundays, and midnight days (Figure 8). Notably, robberies taper off on Sundays
and 5 am. While the numbers are relatively low, the (even lower than Mondays) compared to murders,
clustering of murder on weekend evenings and night- which remain high on both Saturdays and Sundays in
times/early mornings is clear. both communities (Figure 4).
Figure 5: Murder totals by hour of the day and day of the week, Durbanville, 2006–2018
Hour of the day
Day 0 1 2 3 4 5 6 7 8 9 10 11 12 13 14 15 16 17 18 19 20 21 22 23
Monday 0 1 1 1 2 0 0 0 1 0 0 0 0 2 1 1 0 0 1 0 0 2 0 0
Tuesday 0 1 0 0 0 1 0 1 1 0 0 2 0 1 1 0 0 0 1 0 0 0 0 2
Wednesday 0 1 2 0 2 0 0 0 0 0 0 0 0 0 0 0 2 0 1 1 0 0 0 1
Thursday 0 0 0 0 0 1 0 0 0 0 0 0 0 0 0 0 1 2 0 2 1 0 0 2
Friday 0 0 0 0 2 0 1 2 0 1 0 1 0 0 0 1 0 0 1 0 0 2 1 1
Saturday 2 6 4 5 2 3 0 2 2 1 0 0 1 0 1 1 1 0 3 5 5 1 5 4
Sunday 5 3 4 3 0 2 2 0 0 1 0 0 2 1 1 0 0 2 2 2 2 1 0 2
Note: Higher values are shaded in orange and red, lower values in yellow and blue.
Figure 6: Murder totals by hour of the day and day of the week for Nyanga, 2006–2018
Hour of the day
Day 0 1 2 3 4 5 6 7 8 9 10 11 12 13 14 15 16 17 18 19 20 21 22 23
Monday 36 27 17 20 17 7 9 17 13 14 6 7 7 5 5 10 8 17 11 15 20 22 20 19
Tuesday 9 11 8 5 2 7 14 13 3 5 4 8 10 9 2 13 10 8 8 15 22 28 13 17
Wednesday 5 5 10 6 13 5 13 4 3 4 7 11 10 1 9 11 6 7 13 20 23 20 17 7
Thursday 8 5 7 8 6 4 6 11 10 5 6 4 8 12 3 6 10 8 10 12 27 27 13 21
Friday 17 8 16 9 8 6 10 8 9 6 9 2 7 7 6 7 13 10 13 21 33 36 36 57
Saturday 60 51 33 29 36 32 36 25 25 13 20 12 11 7 10 22 16 31 30 46 62 85 65 102
Sunday 108 97 70 62 44 33 40 36 36 30 12 16 16 14 16 20 14 28 32 40 61 52 45 41
Note: Higher values are shaded in orange and red, lower values in yellow, grey and blue.
12 HOTSPOT POLICING FOR MURDER AND ROBBERY: A CAPE TOWN CASE STUDYFigure 7: Aggravated robbery by hour of the day, Durbanville and Nyanga, 2006–2018
10
9
Percentage of all aggravated robberies (%)
8
7
6
5
4
3
2
1
0
:00 1:00 2:00 3:00 4:00 5:00 6:00 7:00 8:00 9:00 0:00 1:00 2:00 3:00 4:00 5:00 6:00 7:00 8:00 9:00 0:00 1:00 2:00 3:00
00 0 0 0 0 0 0 0 0 0 1 1 1 1 1 1 1 1 1 1 2 2 2 2
Nyanga (Total: 6 136) Durbanville (Total: 689)
Figure 8: Aggravated robbery by day of week, Durbanville and Nyanga, 2006–2018
20
18
Percentage of all aggravated robberies (%)
16
14
12
10
8
6
4
2
0
Monday Tuesday Wednesday Thursday Friday Saturday Sunday
Nyanga (Total: 6 136) Durbanville (Total: 689)
SOUTHERN AFRICA REPORT 34 | FEBRUARY 2020 13Figure 9: Aggravated robbery totals by hour of day and day of week for Durbanville, 2006–2018
Hour of the day
Day 0 1 2 3 4 5 6 7 8 9 10 11 12 13 14 15 16 17 18 19 20 21 22 23
Monday 2 3 4 0 0 3 11 5 2 1 7 6 2 6 3 7 3 6 4 7 6 4 2 2
Tuesday 3 1 1 1 1 1 3 4 4 3 4 5 4 6 2 4 1 2 6 6 1 1 6 3
Wednesday 1 1 1 2 1 1 4 3 4 7 7 7 7 3 6 1 3 2 3 8 2 4 4 4
Thursday 1 1 1 1 2 3 5 7 6 2 5 5 2 6 3 5 7 3 5 3 4 7 5 2
Friday 1 2 2 4 1 8 3 7 6 5 1 1 7 7 5 12 8 8 5 9 14 7 7 4
Saturday 5 5 5 5 4 8 7 7 6 3 2 5 2 1 5 4 2 10 3 7 11 10 5 7
Sunday 3 5 1 0 7 2 5 4 4 2 2 1 2 0 3 2 5 2 4 3 6 6 7 4
Note: Higher values are shaded in orange and red, lower values in yellow, grey and blue.
Figure 10: Aggravated robbery totals by hour of day and day of the week for Nyanga, 2006–2018
Hour of the day
Day 0 1 2 3 4 5 6 7 8 9 10 11 12 13 14 15 16 17 18 19 20 21 22 23
Monday 14 12 12 10 46 93 114 62 30 27 32 28 33 27 29 37 37 32 37 55 46 21 22 11
Tuesday 8 6 7 6 33 84 73 51 22 27 31 29 34 30 44 36 35 45 51 43 39 31 16 15
Wednesday 11 7 7 9 31 64 63 37 32 33 34 34 33 41 35 47 28 41 53 47 41 37 19 19
Thursday 11 8 14 9 36 79 73 35 24 25 44 34 40 38 42 46 38 40 46 44 38 32 20 12
Friday 9 10 6 6 28 92 78 48 25 34 28 46 37 40 48 54 60 52 64 94 66 42 38 14
Saturday 18 9 16 10 37 78 58 44 35 24 24 32 48 25 38 49 44 55 48 72 100 80 48 26
Sunday 12 12 23 11 51 84 49 35 25 25 14 19 30 22 23 16 30 37 53 64 76 46 33 15
Note: Higher values are shaded in orange and red, lower values in yellow, grey and blue.
In Durbanville, aggravated robbery increases sharply 7 pm and 9 pm on Saturdays, and 7 pm and 8 pm
between 6 am and 8 am every day, particularly on on Sundays.
Mondays. It is elevated and consistent from Monday to A total of 17.6% (1 082 events) of all aggravated
Thursday, 10 am to 3 pm, and almost every day from robberies in Nyanga occur between 5 am and 6 am, with
6–9pm. Robberies peak at 3 pm and 8 pm on Fridays, another 13.5% (825 events) between 7 pm and 8 pm.
and 5 pm and 8–9 pm on Saturdays.
This analysis demonstrates how murder and robbery
Again, because there were relatively few robbery incidents patterns can be identified relatively simply, particularly in
across the 12-year period in Durbanville, identifying peak precincts such as Nyanga where the number of incidents
days and hours was potentially problematic. This was not is high. Interventions should target the periods and
the case in Nyanga (Figure 10).
spaces in which offences are most common.
Spatial (space) visualisations
Murders roughly triple on Saturday Figure 11 shows two concentrations of murder in
and Sunday, tapering into early Durbanville over the 12-year period. One general,
though geographically dispersed, concentration is in the
Monday mornings Durbanville CBD, near the police station. This area has
a concentration of restaurants, bars, shopping centres,
medical centres and other businesses. These may
There were significantly more aggravated robberies in
generate environments and targets, such as till points
Nyanga (Figure 10) than Durbanville. As a result, more
and intoxicated pedestrians, that are susceptible
consistent trends and peaks are evident. Incidents are
to victimisation.
most common between 5 am and 6 am every day,
with peaks on Mondays and Fridays. In the evenings, A second, much higher concentration is seen in the
incidents peak between 6 pm and 8 pm on Fridays, north-east of the precinct, immediately adjacent to
14 HOTSPOT POLICING FOR MURDER AND ROBBERY: A CAPE TOWN CASE STUDYFigure 11: Enlarged view: Durbanville murder incidents binned into 267 m by 267 m block grids, 2006–2018
0 2 km
Note: The number of incidents appears in each cell. Higher value cells are shaded in yellow, orange and red, lower values in blue.
the Fisantekraal township, train station and informal high-crime ‘border community’ in an otherwise affluent
settlement. Notably, Fisantekraal township itself lies within precinct, as well as interpreting community-level crime
the adjacent Kraaifontein police precinct – a relatively statistics without space data.
high-crime precinct that recorded 1 547 murders from
In the aggravated robbery grid for Durbanville (Figure 12),
2006–2018.53 The Fisantekraal sub-place also belongs to
the same two concentrations appear: in the Durbanville
the Kraaifontein census main place, not Durbanville.
CBD and next to Fisantekraal township in the upper
right portion of the map. Levels are much higher and
17.6% of all aggravated robberies more concentrated near Fisantekraal. Shopping centres
in Nyanga occur between 5 am in the Durbanville CBD may account for the robbery
and 6 am concentration, while the Fisantekraal train station and the
township itself appear to be high-crime areas. Other than
these two areas, incidents are very low, especially when
Thus, the location of this concentration suggests that a
compared to Nyanga.
portion of Fisantekraal’s crime is recorded by, or spills
over to, the SAPS Durbanville police. This highlights The Nyanga murder grid (Figure 13) reveals that
the complexity of policing a small, relatively poor and although murder has occurred in almost every part
SOUTHERN AFRICA REPORT 34 | FEBRUARY 2020 15Figure 12: Enlarged view: Durbanville 12-year aggravated robbery incidents binned into 267 m by 267 m block
grids, 2006–2018
Note: Higher value cells are shaded in yellow, orange and red, lower values in blue.
of the precinct, it is most concentrated in five areas. of Nyanga main place, near Sigcawu Primary School
Some of these are in individual blocks just 267 m in on Klipfontein Road. Apart from the primary school (of
length, and others in groups of three to six blocks which there are many in the precinct) there are again few
approximately 1 km in length. It is possible that indicators from the built environment that may explain
concentrations along roads, railways or paths may not elevated murder levels in just 267 m by 267 m square.
emerge clearly in this visualisation.
While many murders occur across the Nyanga police
The two highest concentrations (91 and 131 murders) precinct, two aspects become apparent at this level
are found in the Brown’s Farm section, adjacent to an of analysis: higher murder concentrations appear
undeveloped green space to the east, bordered by outside of the Nyanga main place boundaries (leading
Sheffield Road to the north and Msingizane Street to to popular confusion about the supposed ‘murder
the south. The area is predominantly residential and capital of South Africa’ and the potential for misplaced
includes an informal settlement to the west. Most formal interventions and resources), and violent crime hotspots
dwellings have multiple backyard shacks, so that the (if correctly geolocated) are not easily explained by the
area is densely populated. built environment.
The third-highest murder concentration (81 murders) A more detailed space and time analysis is required to
is in a formal residential section of Crossroads, east better understand where and when violent crime peaks in
16 HOTSPOT POLICING FOR MURDER AND ROBBERY: A CAPE TOWN CASE STUDYFigure 13: All Nyanga 12-year murder incidents binned into 267 m by 267 m block grids, 2006–2018
0 2 km
Note: Higher value cells are shaded in yellow, orange and red, lower values in green and blue.
Nyanga. Nevertheless, when murder is this concentrated Identification and analysis of hotspots
in space, police and other government officials should be
The figures discussed thus far hint at a number of
able to reduce it.
hotspots in need of more detailed analysis. In Durbanville
Like murder, aggravated robbery occurs throughout the there are two clear hotspots – in the CBD and adjacent
Nyanga precinct (Figure 14) but is most concentrated to Fisantekraal township (Figure 11). Due to the much
in particular areas, including the five where murder greater levels and dispersion of crime in Nyanga, we used
is most common. The 267-m block with the most a method known as f-mode analyses to identify hotspots,
robberies (233 robberies with five adjacent high-level with a focus on murders in that precinct.54 With this
blocks) is the same high-murder block in Brown’s Farm method, the number of murders within a particular radius
seen in Figure 5. This suggests extremely high levels of is added up. Any analysis points with fewer than a select
concentrated violence. number of murders are removed, revealing only those
areas with very high concentrations.
Another area of concentrated robberies is next to the
Nyanga police station and taxi rank. There is some In our analysis, we used radii of 50, 100 and 200 m
indication that adjacent high-robbery blocks may follow around each analysis point. The minimum number of
main roads, such as Emms Drive (heading south from murders was incrementally increased, with the most
the police station and taxi rank) and Sithandatu Avenue meaningful visualisations found at thresholds of 20, 30
(heading east from the taxi rank). and 80 incidents, respectively.
SOUTHERN AFRICA REPORT 34 | FEBRUARY 2020 17Figure 14: All Nyanga 12-year aggravated robbery incidents binned into 267 m by 267 m block grids,
2006–2018
0 2 km
Note: Higher value cells are shaded in yellow, orange and red, lower values in green and blue.
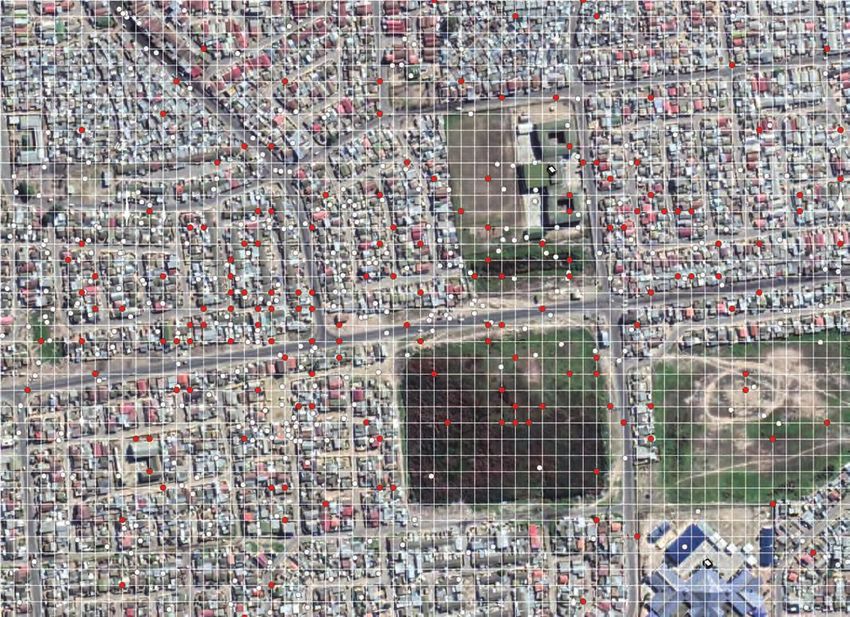
Figure 15 shows all murder crime points in Nyanga that understand crime patterns in each space. Figure 16
have 80 or more murder incidents occurring within shows the location of the two Durbanville hotspots.
a 200 m radius of those points. Five concentrations
Durbanville hotspot #2
are apparent.
Figure 16 is a detailed examination of the two Durbanville
From these hotspot concentrations, outline shapes were
hotspots. The CBD hotspot (#2, Figure 18) is quite
manually drawn to include all points with a frequency of
large – 0.61 km² – and accounts for 11% of all murders
80 or more incidents that were close enough together
in the precinct over the 12-year period and 19% of all
to be grouped as a single hotspot. We also identified
aggravated robberies.
three street corridors with high crime concentrations,
although these oblong shapes are not as easily identified Spatially, murders are dispersed throughout the hotspot.
through hotspot analyses based upon centre points. The Aggravated robberies are relatively dispersed but cluster
street hotspots were drawn by manually identifying and near shopping centres and commercial buildings.
enclosing incidents that were not separated from the Notably, Vrede Street/R302 to the east of the shopping
road by a barrier such as a fence or wall. centres accounts for much of the crime in the hotspot.
With hotspots identified in both Durbanville and Nyanga, Murders in the area occur throughout the day and
we combined place, day and time data to better are most common on Saturdays, followed by Fridays.
18 HOTSPOT POLICING FOR MURDER AND ROBBERY: A CAPE TOWN CASE STUDYFigure 15: F-mode hotspot identification for murders in Nyanga, set at 80 incidents within 200 m radii,
2006–2018
Aggravated robberies reveal no time-of-day or day-of- Examining the hotspot reveals an acute crime point
the-week trends, meaning there are no clear peaks at the very top, on the main roadway (R312) near
to target. the railway overpass. With no immediately apparent
features to explain this, it is possible that the location
The hotspot experienced steep increases in robberies
is used by police as a reference point for crimes
and murders from 2012 to 2018, suggesting a growing
happening along a broader stretch of roadway and/or
crime problem in the hotspot. In such instances, a more
near the train station, train tracks, or pedestrian paths
general crime awareness and prevention programme
over or under the road.
may help to improve vigilance and harden targets.
A second concentration is seen near the R312 off-
Durbanville hotspot #1
ramp to an agri-processing facility (the large buildings
The second Durbanville hotspot (#1 in Figure 16, in the lower half of the hotspot). While it is possible that
Figure 17), next to the Fisantekraal train station and this business is a crime generator, it seems unlikely to
township, accounts for 52% of all murders and 30% of produce high-value goods, store large amounts of cash,
all aggravated robberies in the precinct. At 0.087km², it or have a flow of ‘easy-target’ customers. Thus, it is likely
is only 14% the size of the first hotspot. This suggests that police use the business as the general reference
targeted intervention should work in the area. point for crimes in the greater area.
SOUTHERN AFRICA REPORT 34 | FEBRUARY 2020 19If this is the case, it renders the data less useful than with crimes not accurately recorded in space. This could
it should be to police and government authorities. hamper police intervention in the area.
Notably, no crimes are recorded along the train tracks
Murders in this hotspot are moderately focused by
or at the train station, though these would seem more
time of day, with peaks between 11 pm and 4 am, and
likely crime generators.
without any murders recorded between 9 am and 11 am
While the Fisantekraal train station and township fall under throughout the period. Murder is most common on
the Kraaifontein police jurisdiction, crime occurring along Saturdays and Sundays, followed by Mondays, suggesting
the tracks and attacks on victims using the paths across a weekend, night-time phenomenon, potentially related to
the tracks may fall into a jurisdictional ‘no-man’s land’, alcohol and open spaces with poor surveillance.
Figure 16: Composite hotspot visualisation for Durbanville with time of day/day of week crime signatures for
each hotspot, 2006–2018
Hotspot #2
Hotspot #1
Note: Blue dots and graphs denote aggravated robberies (R). Red dots and graphs denote murders (M).
20 HOTSPOT POLICING FOR MURDER AND ROBBERY: A CAPE TOWN CASE STUDYFigure 17: Durbanville-Fisantekraal hotspot #1
12
time of day (%)
Incidents by
10
8
6
4
2
0
0 1 2 3 4 5 6 7 8 9 10 11 12 13 14 15 16 17 18 19 20 21 22 23
Murder (Total: 75) Aggravated robbery (Total: 209)
50
Incidents by day
of the week (%)
40
30
20
10
0
Monday Tuesday Wednesday Thursday Friday Saturday Sunday
20 40
hotspot #1 aggravated robbery
18 36
Durbanville-Fisantekraal
Durbanville-Fisantekraal
16 32
hotspot #1 murder
14 28
12 24
10 20
8 16
6 12
4 8
2 4
0 0
2007 2008 2009 2010 2011 2012 2013 2014 2015 2016 2017 2018
Durbanville-Fisantekraal hotspot #1 murder Durbanville-Fisantekraal hotspot #1 aggravated robbery
SOUTHERN AFRICA REPORT 34 | FEBRUARY 2020 21Figure 18: Durbanville CBD hotspot #2
15
time of day (%)
Incidents by
10
5
0
0 1 2 3 4 5 6 7 8 9 10 11 12 13 14 15 16 17 18 19 20 21 22 23
Murder (Total: 16) Aggravated robbery (Total: 132)
60
Incidents by day
of the week (%)
50
40
30
20
10
0
Monday Tuesday Wednesday Thursday Friday Saturday Sunday
15 30
Durbanville CBD hotspot #2
Durbanville CBD hotspot #2
25
aggravated robbery
10 20
murder
15
5 10
5
0 0
2007 2008 2009 2010 2011 2012 2013 2014 2015 2016 2017 2018
Durbanville CBD hotspot #2 murder Durbanville CBD hotspot #2 aggravated robbery
22 HOTSPOT POLICING FOR MURDER AND ROBBERY: A CAPE TOWN CASE STUDYAggravated robberies are less predictable, with peaks Nyanga hotspot #1
from 6–8 am (potential commuting hours), 10–11 am and
Nyanga’s hotspot #1 (Figure 20) covers just 0.0025km²
7–9 pm. Robberies peak slightly on Saturdays.
but accounts for 71 murders (2.2% of all murders) and 60
This hotspot recorded relatively few crimes in 2007 but aggravated robberies (1% of the total). The hotspot is a
subsequently saw increases in both murders (peaking in dense residential area in Samora Machel, north of Samora
2016) and robberies (peaking in 2018). This suggests an Machel Primary School and encompassing a cul-de-sac off
increasing crime problem in need of police intervention. Jameson Mngomezulu Street.
Overall, this small area accounts for nearly half of all Incidents appear concentrated on just five or six dwellings
violent crime in the Durbanville precinct. Although lack of on the corner of the cul-de-sac, suggesting a highly
predictability can hamper police intervention, the fact that improbable hot point of murders and aggravated robberies.
violence appears so localised means police and other
authorities should be able to stem it in the area. With no obvious crime generators or attractors (unless
there are illegal alcohol outlets in one or more of the
We identified eight hotspots in Nyanga (Figure 19), five
dwellings), it is again unclear why so many violent crimes
of which were prominent in F-mode analysis (#1 to #5).
are geo-referenced to this precise location. The data is
Hotspots #6 to #8 are street corridors identified through
either incorrectly recorded or police have failed to address
visual inspection. The eight hotspots account for 20%
very localised and obvious generators of lethal violence
(n=638) of Nyanga’s murders and 19% (n=1 134) of
not visible through our analysis.
aggravated robberies. Considered in relation to their
geographic size, these figures are staggering. Each Analysed by time, murders in the hotspot are generally
hotspot is described in detail below. dispersed with peaks at 2–3 am, 7–9 am and 8–9 pm.
Figure 19: Composite hotspot visualisation for Nyanga with time of day/day of week crime signatures for
each hotspot
Hotspot #4 Hotspot #6
Hotspot #5
Hotspot #2
Hotspot #8
Hotspot #3 Hotspot #7
Hotspot #1
Note: Blue dots and graphs denote aggravated robberies (R). Red dots and graphs denote murders (M), 2006–2018.
SOUTHERN AFRICA REPORT 34 | FEBRUARY 2020 23Figure 20: Nyanga murder/robbery hotspot #1
20
time of day (%)
Incidents by
15
10
5
0
0 1 2 3 4 5 6 7 8 9 10 11 12 13 14 15 16 17 18 19 20 21 22 23
Murder (Total: 71) Aggravated robbery (Total: 60)
40
Incidents by day
of the week (%)
30
20
10
0
Monday Tuesday Wednesday Thursday Friday Saturday Sunday
20 40
18 36
16 32
aggravated robbery
Nyanga hotspot #1
Nyanga hotspot #1
14 28
12 24
murder
10 20
8 16
6 12
4 8
2 4
0 0
2007 2008 2009 2010 2011 2012 2013 2014 2015 2016 2017 2018
Nyanga hotspot #1 murder Nyanga hotspot #1 aggravated robbery
24 HOTSPOT POLICING FOR MURDER AND ROBBERY: A CAPE TOWN CASE STUDYThey are most common on Sundays, followed by the space data would need to be confirmed, alongside
Saturdays, Fridays and Mondays. Aggravated robberies an exploration of why adjacent informal areas appear to
in the area are most common from 4–6 am and 3–5 pm. record relatively little crime.
This hotspot recorded relatively few murders and Nyanga hotspot #3
robberies until 2010 and 2013 respectively. Both crimes Hotspot #3 (Figure 22) covers just 0.02km² and
surged again from 2015, forming an acute hotspot. accounts for 1.7% (n=56) of murders and 0.7% (n=40)
Again, if this crime data is correct, police should be able of aggravated robberies. It is situated in Samora
to address the violence relatively simply. Machel, just west of Weltevreden Valley Primary School
Nyanga hotspot #2 and south-west of Zisukhanyo Secondary School. Its
northern edge borders Oliver Tambo Drive.
Nyanga hotspot #2 (Figure 21) is one of the largest,
covering 0.12km². It accounts for 8.6% (n=278) of all Both murders and aggravated robberies are relatively
murders and 7.1% (n=434) of aggravated robberies. It is dispersed, with some concentrations along Oliver
residential, situated around the intersection of Sheffield Tambo Drive and the intersection of Moses Mabida
Crescent and Michael Mapongwana to the south.
Drive and Link Road in Brown’s Farm. It includes
Intsebensiswano High School to the east. Although the
school may generate some crime, one would expect
more incidents around the school than within its grounds, If this data is correct, police
where activities are more regulated. should be able to address
Although some crimes are recorded in the street, most extreme flashpoints
cover the entire hotspot. The area has a mixture of formal
houses, including what appear to be detached hostel
Like hotspot #2, the area is primarily residential with a
units, and backyard shacks. There are informal areas
combination of formal units and backyard shacks. The
to the east and north-east of the hotspot, and a large
north-eastern point of the hotspot is a traffic circle at the
informal area to the west – all of which appear to have
intersection of Oliver Tambo Drive and Robert Sobukwe.
much higher housing densities but far fewer crimes. This
This suggests another possible landmark to which police
suggests that police may use the school and/or the Link
geo-reference surrounding crime.
Road/Sheffield Drive intersection as the reference point
for crimes occurring in the general vicinity, significantly Both school grounds, although beyond the hotspot
reducing the value of the data. boundary, show murders and aggravated robberies at
school buildings and sports fields. It is possible that
Both murders and aggravated robberies in the hotspot
the schools generate some crime, but one would have
are relatively dispersed in time. Murders peak from expected that this could be stemmed – especially with
8 pm to 1 am, especially on Sundays and Saturdays. more than 10 murders.
Aggravated robberies occur throughout the week and
Given that the two schools are the most prominent
day but peak on Saturdays and from 5–6 am and
features in the built environment, further investigation
at 7 pm.
of the nature of the crimes, victims and perpetrators
Murder and robbery peaked in the hotspot in 2008, (problem-oriented policing) could provide the missing
followed by intermittent declines and increases. Data for information necessary to address the problem.
2015–2017 suggests it is increasing again.
Murders in the hotspot occur throughout the day, with
If data for this hotspot is accurate, police and city officials peaks at 9 pm, between 11 pm and 1 am, and on
should be able to do something about it. This could be Saturdays and Sundays. Aggravated robberies are more
achieved through the policing strategies outlined earlier, focused in time with peaks from 4–7 am, at 6 pm, and
as well as through active and passive surveillance, street from 8–9 pm. They occur throughout the week but peak
lighting and school security. However, the accuracy of on Fridays, Sundays and Thursdays.
SOUTHERN AFRICA REPORT 34 | FEBRUARY 2020 25You can also read