Sterol preservation in hypersaline microbial mats - Universität Göttingen

Page created by Regina Wood
 
CONTINUE READING
Sterol preservation in hypersaline microbial mats - Universität Göttingen
Biogeosciences, 17, 649–666, 2020
https://doi.org/10.5194/bg-17-649-2020
© Author(s) 2020. This work is distributed under
the Creative Commons Attribution 4.0 License.

Sterol preservation in hypersaline microbial mats
Yan Shen1 , Volker Thiel1 , Pablo Suarez-Gonzalez2 , Sebastiaan W. Rampen1 , and Joachim Reitner1,3
1 Department  of Geobiology, Geoscience Centre, Georg-August-Universität Göttingen, Göttingen, Germany
2 Área de Geología, Universidad Rey Juan Carlos, Madrid, Spain
3 “Origin of Life” working group, Göttingen Academy of Sciences and Humanities, Göttingen, Germany

Correspondence: Yan Shen (yshen@gwdg.de)

Received: 5 April 2019 – Discussion started: 6 May 2019
Revised: 21 November 2019 – Accepted: 13 December 2019 – Published: 7 February 2020

Abstract. Microbial mats are self-sustaining benthic ecosys-       affecting the distribution and preservation of steroids in the
tems composed of highly diverse microbial communities. It          mat studied. This result markedly differs from recent findings
has been proposed that microbial mats were widespread in           made for another microbial mat growing in the nearby hy-
Proterozoic marine environments, prior to the emergence of         persaline Lake 22 on the same island, where sterols showed
bioturbating organisms at the Precambrian–Cambrian tran-           no systematic decrease with depth. The observed discrepan-
sition. One characteristic feature of Precambrian biomarker        cies in the taphonomic pathways of sterols in microbial mats
records is that steranes are typically absent or occur in          from Kiritimati may be linked to multiple biotic and abiotic
very low concentrations. This has been explained by low            factors including salinity and periods of subaerial exposure,
eukaryotic source inputs, or degradation of primary pro-           implying that caution has to be exercised in the interpreta-
duced sterols in benthic microbial mats (“mat-seal ef-             tion of sterol distributions in modern and ancient microbial
fect”). To better understand the preservational pathways of        mat settings.
sterols in microbial mats, we analyzed freely extractable and
carbonate-bound lipid fractions as well as decalcified extrac-
tion residues in different layers of a recent calcifying mat
( ∼ 1500 years) from the hypersaline Lake 2 on the island          1   Introduction
of Kiritimati, central Pacific. A variety of C27 –C29 sterols
and distinctive C31 4α-methylsterols (4α-methylgorgosterol         Sterols are commonly used as biological markers for specific
and 4α-methylgorgostanol, biomarkers for dinoflagellates)          classes of organisms (Atwood et al., 2014; Brocks and Sum-
were detected in freely extractable and carbonate-bound lipid      mons, 2004; Rampen et al., 2009; Volkman, 1986, 2005).
pools. These sterols most likely originated from organisms         Sterols have been found in many different types of deposi-
living in the water column and the upper mat layers. This          tional environments such as soils (van Bergen et al., 1997;
autochthonous biomass experienced progressive microbial            Birk et al., 2012; Otto and Simpson, 2005), recent lacustrine
transformation and degradation in the microbial mat, as re-        and marine sediments (Brassell and Eglinton, 1983; Gaskell
flected by a significant drop in total sterol concentrations, up   and Eglinton, 1976; Robinson et al., 1984; Volkman, 1986),
to 98 %, in the deeper layers, and a concomitant decrease          and microbial mats from meso- to hypersaline conditions
in total organic carbon. Carbonate-bound sterols were gen-         (Grimalt et al., 1992; Scherf and Rullkötter, 2009). Further,
erally low in abundance compared to the freely extractable         the hydrocarbon skeleton of sterols is relatively stable, and
portion, suggesting that incorporation into the mineral matrix     thus can be preserved in the geological record (Brocks et al.,
does not play a major role in the preservation of eukaryotic       2017; Mattern et al., 1970).
sterols in this mat. Likewise, pyrolysis of extraction residues       Microbial mats are vertically laminated organo-
suggested that sequestration of steroid carbon skeletons into      sedimentary structures, which are primarily self-sustaining
insoluble organic matter was low compared to hopanoids.            ecosystems (Des Marais, 2003), ranging in thickness from
Taken together, our findings argue for a major mat-seal effect     millimeters to decimeters. The mineralized fossil product of
                                                                   microbial mats is microbialites, which have a long geologi-

Published by Copernicus Publications on behalf of the European Geosciences Union.
Sterol preservation in hypersaline microbial mats - Universität Göttingen
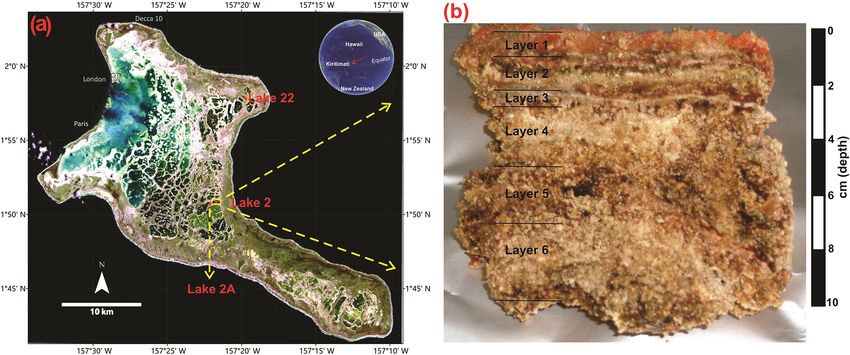
650                                                         Y. Shen et al.: Sterol preservation in hypersaline microbial mats

cal history of over 3 billion years, indicating that microbial     in the Phanerozoic, where OM from planktonic primary pro-
mats probably represented the earliest complex ecosystems          ducers (including algae and bacteria) is more rapidly trans-
on Earth (Reitner and Thiel, 2011). Microbial mats typically       ferred to the sediment through sinking aggregates (such as
consist of many different functional groups of microor-            crustacean faecal pellets), without being reworked in benthic
ganisms which control the organic matter (OM) turnover             microbial mats (Close et al., 2011; Fowler and Knauer, 1986;
in the microbial mat. Major groups include cyanobacteria,          Logan et al., 1995).
colorless sulfur bacteria, purple sulfur bacteria, and sulfate-       The Kiritimati atoll (Republic of Kiribati, central Pacific,
reducing bacteria, but also eukaryotic organisms (Schneider        Fig. 1) is an ideal study site for investigating the taphonomy
et al., 2013; van Gemerden, 1993). A large proportion of the       of sterols in microbial mats. The island is covered by ca. 500
OM consists of extracellular polymeric substances (EPSs),          brackish to hypersaline lakes, most of which are populated
secreted by the microorganisms, which are crucial for the          by thick and highly developed benthic mats that are clearly
support and the development of the microbial mat (Decho,           laminated and show ongoing mineral precipitation, i.e., mi-
2011; Reitner and Thiel, 2011; Wingender et al., 1999).            crobialite formation (Arp et al., 2012; Trichet et al., 2001;
EPSs are rich in acidic groups that bind cations such as           Valencia, 1977). Therefore, Kiritimati enables studies on the
Ca2+ , thereby inducing a strong inhibitory effect on the          behavior of sterols within various types of microbial mats
precipitation of common minerals formed within microbial           thriving under different environmental conditions and show-
mats, such as CaCO3 (Arp et al., 1999; Dupraz et al., 2009;        ing different degrees of mineralization.
Ionescu et al., 2015). Consequently, carbonate precipitation          A recent study conducted on a microbial mat from Lake 22
often occurs in deeper and older mat layers in which de-           on Kiritimati demonstrated that a range of sterols were abun-
composing EPSs gradually release previously bound Ca2+ ,           dantly present in all parts of that mat (Shen et al., 2018a). The
thus facilitating carbonate supersaturation (Arp et al., 1999;     lack of any systematic decrease with depth suggested that the
Dupraz et al., 2009; Ionescu et al., 2015). Previous studies       sterols in that particular mat had not been impacted by a ma-
indicate that early sequestration into a mineral matrix may        jor mat-seal effect. On the other hand, an earlier study on in-
promote the preservation of organic compounds (Summons             soluble OM obtained from a microbial mat from a different
et al., 2013; Smrzka et al., 2017; Thiel et al., 1999). Hence,     lake of the same island (Lake 2, located about 10 km south
microbial mats possibly provide an enhanced chance for             of Lake 22) reported an increasing trend of hopane / sterane
OM to survive in the geosphere if carbonate or other mineral       ratios with depth (Blumenberg et al., 2015). In conjunction
precipitation occurs therein.                                      with other findings, this was considered indicative of a “sup-
   Microbial mats have been proposed to be a predomi-              pression of biosignatures derived from the upper mat layers”
nant life-form in the Proterozoic marine environments. In          and thus a mat-seal effect (Blumenberg et al., 2015). Since
contrast, the Phanerozoic is characterized by prosperity of        that work had a different focus and did not report detailed
biota including fauna and flora and a low abundance of ben-        sterol data, it is not directly comparable with the results on
thic microbial mats (Grotzinger and Knoll, 1999; Riding,           the Lake 22 mat reported by Shen et al. (2018a). Therefore,
2011; Walter, 1976). One of the characteristic features of         we revisited the microbial mat from Lake 2 and performed
the Precambrian biomarker records is that eukaryotic ster-         a detailed analysis of sterol compounds, investigating both
anes are typically absent or occur in very low concentra-          freely extractable and carbonate-bound lipid fractions, and
tions. This may be explained by a limited ecological distri-       we also decalcified extraction residues. Our study was aimed
bution of eukaryotic algae and thus minor contributions of         at further examining general trends in the preservation of
sterols to sedimentary OM (Anbar and Knoll, 2002; Blumen-          sterols in hypersaline microbial mat systems by comparing
berg et al., 2012; Brocks et al., 2017; Knoll et al., 2007),       the results from different settings within the same geological
and/or by a thermal degradation of sterols during catagen-         and geographical context (i.e., Lakes 2 and 22).
esis, as observed for the 1640 Ma Barney Creek Formation
and 1430 Ma Velkerri Formation, Northern Territory, Aus-
tralia (Dutkiewicz et al., 2003; Summons et al., 1988). An         2     Materials and methods
alternative explanation would be that eukaryotic lipids have
been subject to a preservation bias due to the ubiquity of ben-    2.1    Location and samples
thic microbial mats. It has been hypothesized that these mats
would have formed a significant mechanical and chemical            The atoll of Kiritimati (Republic of Kiribati) is located in the
barrier against the preservation of lipids sourced from water      central part of the Pacific Ocean, close to the Equator (Fig. 1).
column and upper mat layers, a phenomenon termed “mat-             Its surface displays a complex reticular pattern encompassing
seal effect” (Pawlowska et al., 2013). Selective preservation      ca. 500 lakes with salinities that range from brackish to hy-
induced by the mat-seal effect would also impart a bias in fa-     persaline. Most of the lakes harbor thick microbial mats that
vor of lipids derived from heterotrophic microorganisms liv-       show ongoing mineralization processes (Figs. 1, 2) and gen-
ing in the deeper mat layers and cause a suppression of the        erally occur on top of older, more developed microbialites
primary production signal. This is different from the situation    (i.e., already fossilized microbial mats; Arp et al., 2012;

Biogeosciences, 17, 649–666, 2020                                                        www.biogeosciences.net/17/649/2020/
Sterol preservation in hypersaline microbial mats - Universität Göttingen
Y. Shen et al.: Sterol preservation in hypersaline microbial mats                                                                          651

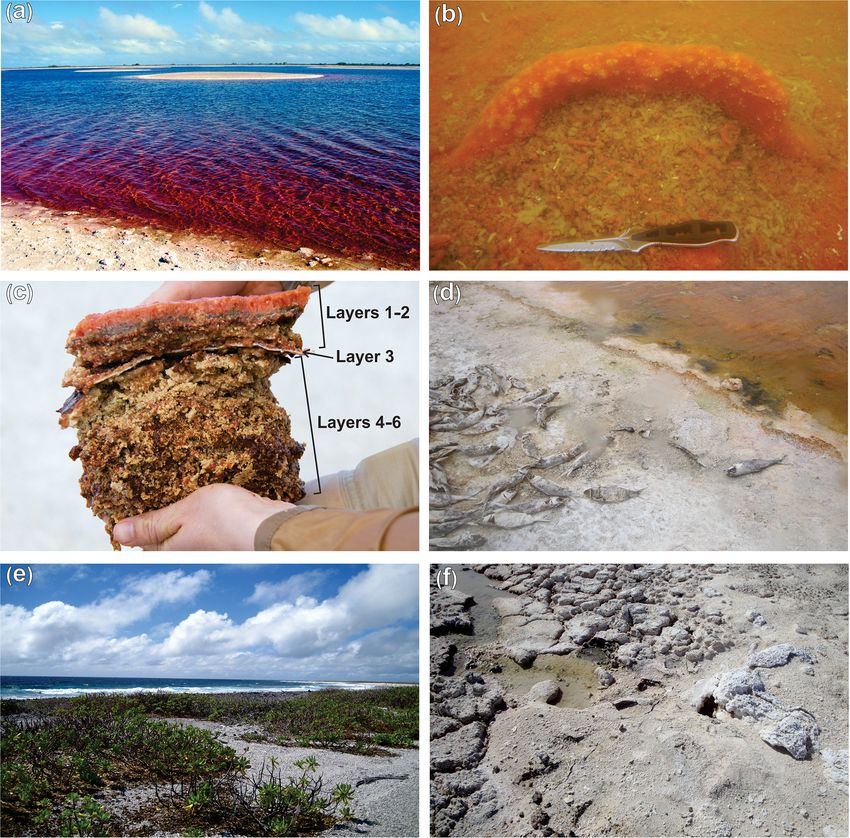
Figure 1. (a) Location of Kiritimati atoll in the Pacific Ocean and satellite view (Landsat 7 image, 1999) showing reticulate distribution
pattern of the lakes (red dots: Lake 2 studied in this work; Lake 2A and 22 previously studied by Bühring et al., 2009, and Shen et al., 2018a);
(b) the microbial mat sample from Lake 2 studied in this work.

Ionescu et al., 2015; Trichet et al., 2001; Valencia, 1977).              berg et al. (2015) divided the mat in five layers, the top-
Vegetation around the lake areas comprises the mangrove                   most layer corresponding to the photosynthetically active
Rhizophora mucronata, the parasitic climber Cassytha fili-                mat and layers 2–5 representing older mat generations be-
formis, the grass Lepturus repens, and the ironwood Pemphis               ing degraded by active anaerobic microorganisms (Figs. 1,
acidula (Fig. 2e; Saenger et al., 2006). The climate of Kiriti-           2). For this study, we used the same layer division as Blu-
mati is broadly controlled by the El Niño–Southern Oscilla-               menberg et al. (2015). However, a thin but distinctive mineral
tion (ENSO) atmospheric phenomenon. During El Niño wet                    crust occurring just below layer 2 (Fig. 2c) has not been ana-
events, heavy rains occur, decreasing lake salinities, whereas            lyzed in the previous study and is additionally included here
reduced precipitation during La Niña dry events triggers                  (corresponding to our layer 3, Figs. 1, 2). Therefore, six lay-
higher evaporation and increasing lake salinities (Arp et al.,            ers in total were analyzed in this work, each one ca. 1–2 cm
2012; Saenger et al., 2006; Trichet et al., 2001). Materials              thick (except layer 3, which is ∼ 0.15 cm thick).
studied in this work were sampled from Lake 2 (Fig. 1),
whose salinity was 97 ‰ in 2002 and 125 ‰ in 2011 (own                    2.2    Bulk analysis
data, unpublished). This high and variable salinity causes low
metazoan diversity within Lake 2. Faunal elements include                 Homogenized (mortar) aliquots of the freeze-dried samples
abundant Tilapia fish (Fig. 2d) and Artemia brine shrimp as               (both original mat layers and extraction residues) were sub-
well as a few land crabs and unicellular miliolid foraminifera            jected to C/N/S analysis, using a HEKAtech EA 3000 CNS
(Saenger et al., 2006; Shen et al., 2018a). Events of mass                analyzer and LECO RC612 multiphase carbon analyzer as
mortality of fish have been observed in some of the lakes, in-            described elsewhere (Shen et al., 2018a).
cluding Lake 2 (Fig. 2d), which may be linked to extreme hy-
persaline conditions probably due to strong evaporation dur-              2.3    Extraction and derivatization
ing La Niña dry periods. More detailed information about the
                                                                          Aliquots of the freeze-dried samples (5–20 g) were ho-
environmental setting of Kiritimati can be found elsewhere
                                                                          mogenized and extracted using 4 × 50 mL portions of
(Arp et al., 2012; Saenger et al., 2006; Shen et al., 2018a;
                                                                          dichloromethane / methanol (3 : 1; V /V ) (10 min ultrasoni-
Trichet et al., 2001).
                                                                          cation) to obtain the freely extractable lipids. The remaining
   In this work, a microbial mat from the hypersaline Lake 2
                                                                          extraction residues were decalcified using 37 % HCl (drop-
(Fig. 1), previously studied by Blumenberg et al. (2015), was
                                                                          wise until CO2 development ceased) and again extracted as
analyzed for steroids, hopanoids, and fatty acids. This mat
                                                                          described above to yield the carbonate-bound lipids. The
is 10 cm thick and was sampled from the center of the lake
                                                                          remaining extraction residues (after decalcification) were
(water depth ca. 4 m) during a field campaign in March 2011
                                                                          freeze-dried for the analysis of bulk Corg and pyrolysis.
(Figs. 1, 2). Samples were stored at −20 ◦ C until laboratory
                                                                             To make alcohols (including sterols and hopanols)
preparation. Based on the macroscopic appearance, Blumen-
                                                                          amenable to gas chromatography (GC), aliquots of the

www.biogeosciences.net/17/649/2020/                                                                    Biogeosciences, 17, 649–666, 2020
Sterol preservation in hypersaline microbial mats - Universität Göttingen
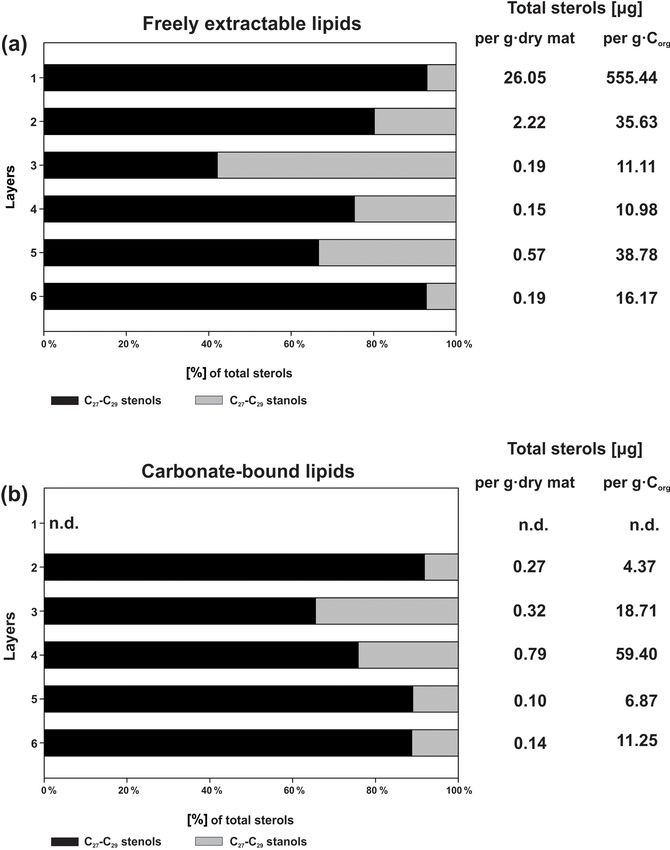
652                                                            Y. Shen et al.: Sterol preservation in hypersaline microbial mats

Figure 2. Field images. (a) General view of hypersaline Lake 2 in Kiritimati. (b) Underwater photograph showing an example of a currently
active, orange-colored microbial mat at the bottom of the lake. (c) The microbial mat sampled for this study, with clear color zonation;
note the whitish mineral crust (layer 3) separating the upper younger growth phase from the older, more mineralized layers. (d) Lakeshore
showing dead fish. (e) Vegetation around the lake area. (f) Sampling site for the hypersaline Lake 22 mat (Shen et al., 2018a).

lipid extracts (both freely extractable and carbonate-                 a gentle stream of N2 , redissolved in n-hexane, and analyzed
bound lipid fractions) were silylated using BSTFA (N,O-                by gas chromatography–mass spectrometry (GC–MS).
bis(trimethylsilyl)trifluoroacetamide) containing 5 % (V /V )
trimethylchlorosilane (TMCS) as a catalyzer (70 ◦ C, 60 min).          2.4   GC–MS
The resulting trimethylsilyl (TMS) derivatives were dried un-
der gentle N2 flow, redissolved in n-hexane, and analyzed by           GC–MS analyses were carried out using a Thermo Fisher
gas chromatography–mass spectrometry (GC–MS).                          Trace 1310 GC coupled to a Thermo Fisher Quantum XLS
   To make hopanoic acids and fatty acids GC-amenable, a               Ultra MS as described elsewhere (Shen et al., 2018a). Due to
mixture of TMCS / MeOH (1 : 9, V /V ) was added to all                 co-elutions and low sterol concentrations, particularly in the
aliquots of lipid extracts, and samples were heated at 80 ◦ C          deeper mat layers, sterols were not quantified via peak inte-
for 60 min (Poerschmann and Carlson, 2006). The resulting              gration in the total ion current (TIC). Instead, the summed
fatty acid methyl esters were extracted from the reaction mix-         ion traces of [m/z 129 + (M + − 90) + M + ] for the TMS
ture by vigorous shaking with 3 × 1 mL n-hexane. The ex-               derivatives of 15 - and 15,22 -stenols and [m/z 215 + (M + −
tracts were combined and evaporated to near dryness under              90) + M + ] for the TMS derivatives of stanols were used. Ap-
                                                                       propriate correction factors were applied according to the re-
                                                                       sponse of these ions to concentration in the mass spectra of

Biogeosciences, 17, 649–666, 2020                                                             www.biogeosciences.net/17/649/2020/
Sterol preservation in hypersaline microbial mats - Universität Göttingen
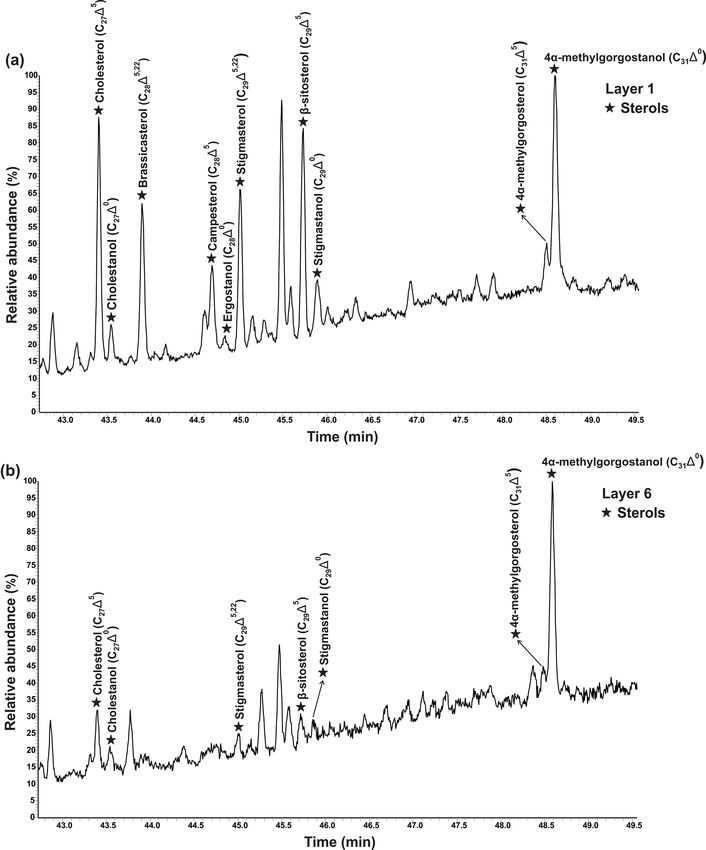
Y. Shen et al.: Sterol preservation in hypersaline microbial mats                                                               653

standard compounds. Average standard deviations of sterol           The upper, younger growth phase is represented by layer 1
concentrations were determined from repeated analyses of            (photosynthetically active mat) and layer 2 (each ca. 1 cm
sample material. Hopanoic acids and fatty acids were identi-        thick, Figs. 1, 2). These layers have a cohesive texture, stick-
fied based on the mass spectra and retention times.                 ing together when handled, due to abundant and relatively
                                                                    fresh organic material (i.e., EPS) of bright orange, green, and
2.5    Pyrolysis–gas chromatography–mass spectrometry               brown colors. Layer 1 includes small and scarce mineral pre-
       (Py–GC–MS)                                                   cipitates, whereas layer 2 shows more abundant whitish min-
                                                                    erals within its organic matrix (Fig. 2c). Layer 2 is underlain
Aliquots of the decalcified extraction residues were py-            by a thin but distinctive, laterally continuous mineral crust
rolyzed on a fast-heating Pt filament using a Pyrola 2000 py-       (layer 3), which separates the two growth phases of the mat.
rolysis device (Pyrol AB) coupled to a Varian CP3800 GC             Below the crust, the older growth phase is represented by lay-
and a Varian 1200L MS as described elsewhere (Shen et al.,          ers 4, 5, and 6 (ca. 7 cm thick in total, Figs. 1, 2). The lower
2018a). An internal standard (n-icosane D42, 120 ng) was            layers are more friable than layers 1–2. They mainly show
routinely added to check the performance of the chromato-           brown and beige colors and have a crumbly appearance, due
graphic system.                                                     to a higher abundance of mineral particles compared to EPSs
   Additionally, the Eocene Green River shale was used as           (Fig. 2c). The minerals observed within the mat layers are
a reference material (eastern Utah, White River Mine, BLM           mainly aragonite (CaCO3 ), with minor amounts of gypsum
Oil Shale Research, Development, and Demonstration Lease            (CaSO4 ) found only in the uppermost layer 1 (Shen et al.,
UTU-84087).                                                         2018b).
2.6    Compound-specific stable carbon isotope analysis             3.2   Bulk geochemical data
Compound-specific stable carbon isotope ratios were mea-            Bulk geochemical data for individual mat layers are shown in
sured for sterols and fatty acids in the freely extractable         Table 1a. In the original non-decalcified mat, relatively high
lipid fractions of the microbial mat. Analyses were con-            Corg contents were observed in layers 1 and 2 (4.7 % and
ducted using a Thermo Scientific TRACE gas chromatograph            6.2 %, respectively; Table 1a and Fig. 3a), consistent with
(GC) coupled to a Delta Plus isotope ratio mass spectrome-          a more fresh, cohesive appearance of the organic matrix in
ter (IRMS). The conventional CuO–NiO–Pt reactor was used            these layers. The earlier, deeper growth phase showed con-
and combusted at 940 ◦ C. The GC column used was an Ag-             stant Corg contents < 2 %, with the lowest value found for
ilent DB-5 coupled to an Agilent DB-1 (each with 30 m               layer 6 (1.2 %; see Table 1a). The CaCO3 content of the
length, 250 µm internal diameter, and 0.25 µm film thick-           mat increased significantly with depth (Fig. 3a; Table 1a).
ness). Lipid fractions were injected into a splitless injector      The lowest value was observed in the top layer 1 (27.1 %),
and transferred to the GC column at 290 ◦ C. The carrier gas        a strong enrichment occurred in layer 2 (73.1 %), and con-
was helium at a flow rate of 1.2 mL min−1 . The tempera-            stantly high contents (> 90 %) were found for all deeper mat
ture program for analyzing lipid fractions was ramped from          layers. This is consistent with the observation of more abun-
80 ◦ C, followed by heating to 325 ◦ C (at 5 ◦ C min−1 , held for   dant mineral precipitates downwards in the mat. The high-
60 min). Analyses of laboratory standards were carried out          est sulfur content was detected for layer 1 (9.8 %), due to
to control the reproducibility of measuring conditions, and         gypsum precipitates. Below, S decreased sharply (1.2 % in
measurements were calibrated by using CO2 gas of known              layer 2) and retained low values (< 1 %) in the earlier growth
isotopic composition.                                               phase of the mat (∼ 0.3 %–0.5 %). Nitrogen showed gener-
   n-Heneicosanoic acid and androstanol standards were an-          ally low contents (0.14 %–0.75 %) throughout the mat.
alyzed by GC–C–IRMS as non-derivatized lipids and af-                  In the decalcified extraction residues (Table 1b), Corg
ter derivatization as methyl esters (ME) and trimethylsilyl         showed a broad range but increased significantly with depth,
(TMS) ethers, respectively, to determine the carbon isotope         with the highest value observed in layer 6 (42.3 %; also see
values of the derivatizing groups. The δ 13 C values of deriva-     Fig. 3b). N was likewise enhanced in the deeper parts, with
tized lipids were corrected for the additional carbon accord-       the highest amount found in layer 5 (6.7 %). By contrast, a
ing to the equations provided in Goñi and Eglinton (1996).          decrease in S content was observed with depth, with the high-
                                                                    est values occurring in the topmost mat layer 1 (10.4 %).
3     Results

3.1    General characterization of the microbial mat

The microbial mat has a thickness of ca. 10 cm. Based on its
macroscopic appearance, and on data from Blumenberg et
al. (2015), the mat shows two major phases of development.

www.biogeosciences.net/17/649/2020/                                                           Biogeosciences, 17, 649–666, 2020
Sterol preservation in hypersaline microbial mats - Universität Göttingen
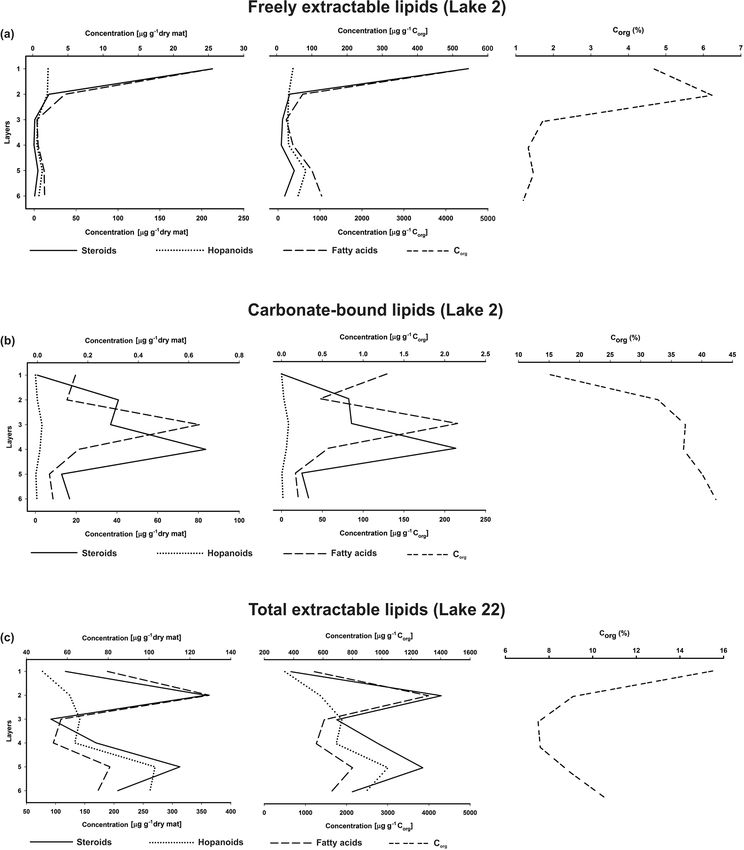
654                                                               Y. Shen et al.: Sterol preservation in hypersaline microbial mats

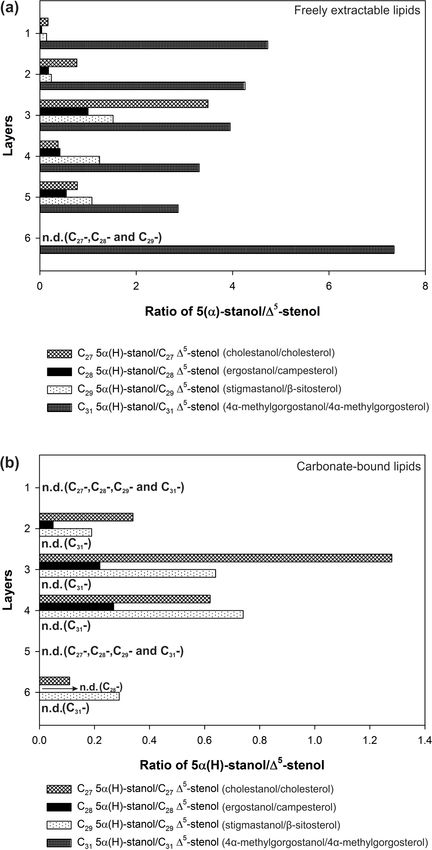
Figure 3. (a) Corg and CaCO3 contents of the bulk mat (% wt); (b) Corg content of the extraction residues after decalcification (% wt); (c) dis-
tribution of C27 vs. C28 vs. C29 vs. C31 sterols in the freely extractable lipids (µg g−1 dry mat); (d) distribution of C27 vs. C28 vs. C29 vs.
C31 sterols in the carbonate-bound lipids of the microbial mat (µg g−1 dry mat).

Table 1. (a) Bulk geochemical data for the microbial mat (original mat layers before decalcification). (b) Bulk geochemical data for the
microbial mat (extraction residues after decalcification; modified after Blumenberg et al., 2015).

                 (a)
                 Layers     Ctot (%)    Corg (%)     Ccarb (%)    CaCO3 (%)       Ntot (%)    Stot (%)    Corg / N    Corg / S
                 1              7.94         4.69         3.25           27.10        0.41        9.78       11.40        0.50
                 2             15.00         6.23         8.77           73.10        0.74        1.21        8.40        5.20
                 3             12.59         1.71        10.88           90.70        0.16        0.33       10.50        5.10
                 4             12.33         1.33        11.00           91.70        0.19        0.49        7.00        2.70
                 5             12.45         1.47        10.98           91.50        0.20        0.52        7.30        2.80
                 6             12.23         1.20        11.03           91.90        0.14        0.48        8.50        2.50
                 (b)
                 Layers    Corg (%)     Ntot (%)      Stot (%)        Corg / N    Corg / S
                 1              15.2          1.9         10.4             7.9         1.5
                 2              32.8          4.9          2.9             6.7        11.4
                 3              37.3          5.6          4.6             6.7         8.2
                 4              37.0          6.2          2.6             6.0        14.4
                 5              40.1          6.7          2.0             6.0        20.3
                 6              42.3          6.6          2.0             6.4        21.4

Biogeosciences, 17, 649–666, 2020                                                                  www.biogeosciences.net/17/649/2020/
Sterol preservation in hypersaline microbial mats - Universität Göttingen
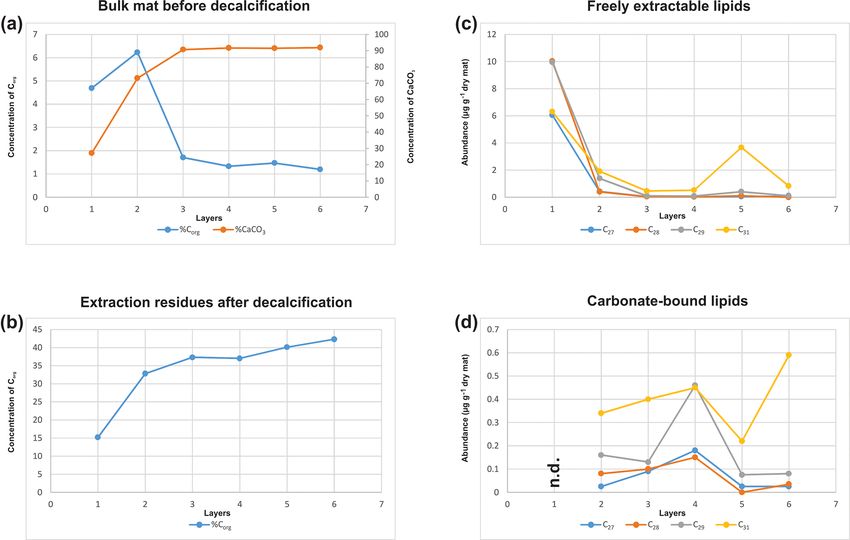
Y. Shen et al.: Sterol preservation in hypersaline microbial mats                                                                                                                                                                                                                                                                                           655

3.3     Freely extractable lipids

                                                                   Table 2. (a) Concentrations of sterols in the freely extractable lipids of the microbial mat layers. SD indicates the mean value of the standard deviation (µg g−1 dry mat; n.d. is not
                                                                   detected). (b) Concentrations of sterols in the carbonate-bound lipids of the microbial mat layers. SD indicates the mean value of the standard deviation (µg g−1 dry mat; n.d. is not
3.3.1    Freely extractable sterols

                                                                                                                                                                                                                                                             4α-Methylgorgostanol
                                                                                                                                                                                                                                                                                    22,23-methylene-4α,23,
                                                                                                                                                                                                                                                                                     24-trimethylcholestan-
                                                                                                                                                                                                                                                                                                     3β-ol

                                                                                                                                                                                                                                                                                                                    41.6 %
                                                                                                                                                                                                                                                                                                                             5.21
                                                                                                                                                                                                                                                                                                                             1.55
                                                                                                                                                                                                                                                                                                                             0.37
                                                                                                                                                                                                                                                                                                                             0.40
                                                                                                                                                                                                                                                                                                                             2.72
                                                                                                                                                                                                                                                                                                                             0.73

                                                                                                                                                                                                                                                                                                                                             –
                                                                                                                                                                                                                                                                                                                                                       n.d.
                                                                                                                                                                                                                                                                                                                                                      0.34
                                                                                                                                                                                                                                                                                                                                                      0.40
                                                                                                                                                                                                                                                                                                                                                      0.45
                                                                                                                                                                                                                                                                                                                                                      0.22
                                                                                                                                                                                                                                                                                                                                                      0.59
Various sterols were detected in the freely extractable lipid
fractions, grouped as saturated sterols (stanols; C27 10 ,
C28 10 , C29 10 ) and unsaturated sterols (stenols; C27 15 ,
C28 15,22 , C28 15 , C29 15,22 , C29 15 ; see Fig. 4; Table 2a).
Distinctive C31 sterols were also detected and identi-

                                                                                                                                                                                                                                                             4α-Methylgorgosterol
                                                                                                                                                                                                                                                                                    22,23-methylene-4α,23,
                                                                                                                                                                                                                                                                                     24-trimethylcholest-5-
                                                                                                                                                                                                                                                                                                  en-3β-ol

                                                                                                                                                                                                                                                                                                                    41.3 %
                                                                                                                                                                                                                                                                                                                             1.10
                                                                                                                                                                                                                                                                                                                             0.36
                                                                                                                                                                                                                                                                                                                             0.09
                                                                                                                                                                                                                                                                                                                             0.12
                                                                                                                                                                                                                                                                                                                             0.95
                                                                                                                                                                                                                                                                                                                             0.10

                                                                                                                                                                                                                                                                                                                                             –
                                                                                                                                                                                                                                                                                                                                                      n.d.
                                                                                                                                                                                                                                                                                                                                                      n.d.
                                                                                                                                                                                                                                                                                                                                                      n.d.
                                                                                                                                                                                                                                                                                                                                                      n.d.
                                                                                                                                                                                                                                                                                                                                                      n.d.
                                                                                                                                                                                                                                                                                                                                                      n.d.
fied as 22,23-methylene-4α,23,24-trimethylcholest-5-en-3β-
ol (4α-methylgorgosterol) and 22,23-methylene-4α,23,24-
trimethylcholestan-3β-ol (4α-methylgorgostanol) based on
the retention times and comparison with published mass
spectra (Fig. S1; Atwood et al., 2014; Houle et al., 2019).
   Figure 5a shows the variations in C27 –C29 stenols vs.

                                                                                                                                                                                                                                                             Stigmastanol
                                                                                                                                                                                                                                                                                    5α-24-ethylcholestan-
                                                                                                                                                                                                                                                                                                   3β-ol

                                                                                                                                                                                                                                                                                                                    27.7 %
                                                                                                                                                                                                                                                                                                                             0.77
                                                                                                                                                                                                                                                                                                                             0.19
                                                                                                                                                                                                                                                                                                                             0.05
                                                                                                                                                                                                                                                                                                                             0.02
                                                                                                                                                                                                                                                                                                                             0.13
                                                                                                                                                                                                                                                                                                                             0.01

                                                                                                                                                                                                                                                                                                                                             40.2 %
                                                                                                                                                                                                                                                                                                                                                         n.d.
                                                                                                                                                                                                                                                                                                                                                        0.01
                                                                                                                                                                                                                                                                                                                                                        0.04
                                                                                                                                                                                                                                                                                                                                                        0.09
                                                                                                                                                                                                                                                                                                                                                      < 0.01
                                                                                                                                                                                                                                                                                                                                                        0.01
stanols in the freely extractable lipid fractions through the
mat profile. The highest abundance of sterols occurred in the
topmost layer 1 (26.05 µg g−1 dry mat; see Fig. 5a). Concen-
trations decreased drastically below, and remained low from
layer 3 onwards. C28 and C29 sterols were the most dom-

                                                                                                                                                                                                                                                             β-Sitosterol
                                                                                                                                                                                                                                                                                    24-ethylcholest-5-
                                                                                                                                                                                                                                                                                             en-3β-ol

                                                                                                                                                                                                                                                                                                                    13.2 %
                                                                                                                                                                                                                                                                                                                             5.44
                                                                                                                                                                                                                                                                                                                             0.77
                                                                                                                                                                                                                                                                                                                             0.03
                                                                                                                                                                                                                                                                                                                             0.02
                                                                                                                                                                                                                                                                                                                             0.12
                                                                                                                                                                                                                                                                                                                             0.02

                                                                                                                                                                                                                                                                                                                                             24.8 %
                                                                                                                                                                                                                                                                                                                                                      n.d.
                                                                                                                                                                                                                                                                                                                                                      0.07
                                                                                                                                                                                                                                                                                                                                                      0.06
                                                                                                                                                                                                                                                                                                                                                      0.12
                                                                                                                                                                                                                                                                                                                                                      0.01
                                                                                                                                                                                                                                                                                                                                                      0.03
inant sterols in layer 1 while the C31 sterols dominated in
the deeper layers (Fig. S3). Unlike the other sterols, the C31
sterols showed enhanced concentrations in layer 5, being 3 to
10 times higher than in layers 3, 4, and 6 (Fig. 3c; Table 2a).
In general, stenols were about an order of magnitude more                                                                                                                                                                                                    Stigmasterol
                                                                                                                                                                                                                                                                                    24-ethylcholesta-5,
                                                                                                                                                                                                                                                                                         22-dien-3β-ol

                                                                                                                                                                                                                                                                                                                    20.0 %
                                                                                                                                                                                                                                                                                                                             3.74
                                                                                                                                                                                                                                                                                                                             0.43
                                                                                                                                                                                                                                                                                                                             0.02
                                                                                                                                                                                                                                                                                                                             0.05
                                                                                                                                                                                                                                                                                                                             0.16
                                                                                                                                                                                                                                                                                                                             0.08

                                                                                                                                                                                                                                                                                                                                             –
                                                                                                                                                                                                                                                                                                                                                       n.d.
                                                                                                                                                                                                                                                                                                                                                      0.08
                                                                                                                                                                                                                                                                                                                                                      0.03
                                                                                                                                                                                                                                                                                                                                                      0.25
                                                                                                                                                                                                                                                                                                                                                      0.06
                                                                                                                                                                                                                                                                                                                                                      0.04
abundant than stanols. Both groups showed the highest con-
centrations in layer 1 and a major decrease within the mat
(see Table 2a).
   In the freely extractable lipids, the ratios of 5α-stanols
to their corresponding 15 -stenols (stanol / stenol ratios)
                                                                                                                                                                                                                                                             Ergostanol
                                                                                                                                                                                                                                                                                    5α-24-methylcholestan-
                                                                                                                                                                                                                                                                                                    3β-ol

                                                                                                                                                                                                                                                                                                                    28.3 %
                                                                                                                                                                                                                                                                                                                             0.20
                                                                                                                                                                                                                                                                                                                             0.06
                                                                                                                                                                                                                                                                                                                             0.02
                                                                                                                                                                                                                                                                                                                             0.01
                                                                                                                                                                                                                                                                                                                             0.04
                                                                                                                                                                                                                                                                                                                             n.d.

                                                                                                                                                                                                                                                                                                                                             –
                                                                                                                                                                                                                                                                                                                                                        n.d.
                                                                                                                                                                                                                                                                                                                                                      < 0.01
                                                                                                                                                                                                                                                                                                                                                        0.02
                                                                                                                                                                                                                                                                                                                                                        0.03
                                                                                                                                                                                                                                                                                                                                                        n.d.
                                                                                                                                                                                                                                                                                                                                                      < 0.01
showed no consistent trend within the profile (Fig. 6a; Ta-
ble 3). The C27 , C28 , and C29 stanol / stenol ratios increased
in the upper, younger growth phase of the mat, with the high-
est value observed for layer 3, but they decreased again in
the deeper, older growth phase (Fig. 6; Table 3). In contrast,
stanol / stenol ratios for the C31 sterols declined from layer 1
                                                                                                                                                                                                                                                             Campesterol
                                                                                                                                                                                                                                                                                    24-methylcholest-5-
                                                                                                                                                                                                                                                                                              en-3β-ol

                                                                                                                                                                                                                                                                                                                    10.7 %
                                                                                                                                                                                                                                                                                                                             4.91
                                                                                                                                                                                                                                                                                                                             0.34
                                                                                                                                                                                                                                                                                                                             0.02
                                                                                                                                                                                                                                                                                                                             0.02
                                                                                                                                                                                                                                                                                                                             0.07
                                                                                                                                                                                                                                                                                                                             n.d.

                                                                                                                                                                                                                                                                                                                                             –
                                                                                                                                                                                                                                                                                                                                                      n.d.
                                                                                                                                                                                                                                                                                                                                                      0.08
                                                                                                                                                                                                                                                                                                                                                      0.08
                                                                                                                                                                                                                                                                                                                                                      0.12
                                                                                                                                                                                                                                                                                                                                                      n.d.
                                                                                                                                                                                                                                                                                                                                                      0.03
to layer 5, and showed a remarkable increase in layer 6.
   A reliable compound-specific δ 13 C value could be ob-
tained for the co-eluting C31 sterols from the freely ex-
tractable lipids in layer 1. These compounds showed strong
enrichments in 13 C (δ 13 C = −7.2 ‰). Fatty acids (includ-
                                                                                                                                                                                                                                                             Brassicasterol
                                                                                                                                                                                                                                                                                    24-methylcholesta-5,
                                                                                                                                                                                                                                                                                          22-dien-3β-ol

                                                                                                                                                                                                                                                                                                                    12.3 %
                                                                                                                                                                                                                                                                                                                             4.93
                                                                                                                                                                                                                                                                                                                              n.d.
                                                                                                                                                                                                                                                                                                                              n.d.
                                                                                                                                                                                                                                                                                                                              n.d.
                                                                                                                                                                                                                                                                                                                              n.d.
                                                                                                                                                                                                                                                                                                                              n.d.

                                                                                                                                                                                                                                                                                                                                             –
                                                                                                                                                                                                                                                                                                                                                      n.d.
                                                                                                                                                                                                                                                                                                                                                      n.d.
                                                                                                                                                                                                                                                                                                                                                      n.d.
                                                                                                                                                                                                                                                                                                                                                      n.d.
                                                                                                                                                                                                                                                                                                                                                      n.d.
                                                                                                                                                                                                                                                                                                                                                      n.d.
                                                                   detected; dashes indicate SDs are not applicable).

ing C14 –C19 homologues) showed similarly high δ 13 C values
ranging from −4.4 ‰ to −11.7 ‰.

3.3.2    Freely extractable hopanoids
                                                                                                                                                                                                                                                             Cholestanol
                                                                                                                                                                                                                                                                                    5α-cholestan-
                                                                                                                                                                                                                                                                                           3β-ol

                                                                                                                                                                                                                                                                                                                    41.7 %
                                                                                                                                                                                                                                                                                                                               0.86
                                                                                                                                                                                                                                                                                                                               0.19
                                                                                                                                                                                                                                                                                                                               0.04
                                                                                                                                                                                                                                                                                                                             < 0.01
                                                                                                                                                                                                                                                                                                                               0.02
                                                                                                                                                                                                                                                                                                                             < 0.01

                                                                                                                                                                                                                                                                                                                                             47.6 %
                                                                                                                                                                                                                                                                                                                                                         n.d.
                                                                                                                                                                                                                                                                                                                                                      < 0.01
                                                                                                                                                                                                                                                                                                                                                        0.05
                                                                                                                                                                                                                                                                                                                                                        0.07
                                                                                                                                                                                                                                                                                                                                                      < 0.01
                                                                                                                                                                                                                                                                                                                                                      < 0.01

Several GC-amenable hopanoids were detected in the
freely extractable lipids, with major compounds being hop-
22(29)-ene (diploptene), ββ-bishomohopanoic acid, and ββ-
                                                                                                                                                                                                                                                             Cholesterol
                                                                                                                                                                                                                                                                                    cholest-5-
                                                                                                                                                                                                                                                                                     en-3β-ol

                                                                                                                                                                                                                                                                                                                    28.4 %
                                                                                                                                                                                                                                                                                                                             5.20
                                                                                                                                                                                                                                                                                                                             0.24
                                                                                                                                                                                                                                                                                                                             0.01
                                                                                                                                                                                                                                                                                                                             0.02
                                                                                                                                                                                                                                                                                                                             0.03
                                                                                                                                                                                                                                                                                                                             0.08

                                                                                                                                                                                                                                                                                                                                             24.0 %
                                                                                                                                                                                                                                                                                                                                                       n.d.
                                                                                                                                                                                                                                                                                                                                                      0.02
                                                                                                                                                                                                                                                                                                                                                      0.04
                                                                                                                                                                                                                                                                                                                                                      0.11
                                                                                                                                                                                                                                                                                                                                                      0.02
                                                                                                                                                                                                                                                                                                                                                      0.02

bishomohopanol. The summed major hopanoids showed the
highest abundances in layers 1 and 2 (about 15 µg g−1 dry
mat). Below, hopanoid concentrations sharply decreased to
                                                                                                                                                                                                                                                             Trivial names

< 4 µg g−1 dry mat in layers 3 and 4, but returned to moder-
                                                                                                                                                                                                                                                                                    Compound

ate values in the deeper layers 5 and 6 (see Table S3 in the
                                                                                                                                                                                                                                                                                                                             Layer 1
                                                                                                                                                                                                                                                                                                                             Layer 2
                                                                                                                                                                                                                                                                                                                             Layer 3
                                                                                                                                                                                                                                                                                                                             Layer 4
                                                                                                                                                                                                                                                                                                                             Layer 5
                                                                                                                                                                                                                                                                                                                             Layer 6

                                                                                                                                                                                                                                                                                                                                                      Layer 1
                                                                                                                                                                                                                                                                                                                                                      Layer 2
                                                                                                                                                                                                                                                                                                                                                      Layer 3
                                                                                                                                                                                                                                                                                                                                                      Layer 4
                                                                                                                                                                                                                                                                                                                                                      Layer 5
                                                                                                                                                                                                                                                                                                                                                      Layer 6

Supplement, Fig. 7a).
                                                                                                                                                                                                                                                                                                                    SD

                                                                                                                                                                                                                                                                                                                                             SD
                                                                                                                                                                                                                                                                                                                                       (b)
                                                                                                                                                                                                                                                                                                              (a)

www.biogeosciences.net/17/649/2020/                                                                                                                                                                                                                                                                                 Biogeosciences, 17, 649–666, 2020
656                                                         Y. Shen et al.: Sterol preservation in hypersaline microbial mats

Figure 4. Partial GC–MS chromatograms (total ion current) show the distributions of freely extractable sterols (TMS derivatives) in
(a) layer 1 and (b) layer 6 of the microbial mat.

3.3.3   Freely extractable fatty acids (FAs)                        ative abundance of these long-chain FAs significantly in-
                                                                    creased in the deeper part of the mat, with ca. 40 % ob-
FAs in the freely extractable lipid pool show carbon num-           served for layer 5. Saturated and monounsaturated C16 and
bers ranging from 14 to 30 (Table S1). Short-chain FAs              C18 and a cyclopropyl-FA (tentatively identified as cis-9,10-
(C14 –C19 ) are predominant, making up > 90 % of the to-            methyleneoctadecanoic acid) were the dominant short-chain
tal in the upper layers and 50 %–60 % in the deeper layers.         FAs. In addition, terminally branched iso-/anteiso-C15 –C17
Further, medium-chain FAs (C20 –C23 ) occur in low abun-            FAs were detected, showing a decreasing trend with depth
dances (< 10 %) throughout the mat profile. Long-chain FAs          (Table S1). With respect to the total FAs, the highest concen-
(C24 –C30 ) made up only a few percent of the freely ex-            trations were found in layer 1 (212.72 µg g−1 dry mat) and
tractable lipids in the upper three layers. However, the rel-       the lowest in layer 3 (3.34 µg g−1 dry mat). Below layer 3,

Biogeosciences, 17, 649–666, 2020                                                         www.biogeosciences.net/17/649/2020/
Y. Shen et al.: Sterol preservation in hypersaline microbial mats                                                                       657

Figure 5. Distributions and concentrations of C27 –C29 sterols in the microbial mat layers, (a) freely extractable lipids, and (b) carbonate-
bound lipids.

FA concentrations slightly increased again with depth (see               relatively low organic carbon throughout the mat (1.20 %–
Table S3).                                                               6.23 %, Table 1a, Fig. 7a).

3.3.4   Depth distributions of freely extractable                        3.4     Carbonate-bound lipids
        compounds
                                                                         3.4.1    Carbonate-bound sterols
Depth distributions of summed GC-amenable hopanoids,
FAs, and steroids in the free lipids are presented in Fig. 7a.           Carbonate-bound sterols include C27 –C29 conventional
In all layers, FAs were an order of magnitude more abun-                 sterols as well as C31 sterols. When compared to the freely
dant than hopanoids and steroids, but the relative distribu-             extractable lipids, their concentrations are low, particularly in
tions of the three compound classes resembled each other                 the surface layers (Fig. 5b; Table 2b). In the topmost layer 1,
(high amounts in layer 1, low amounts in layers 3 and 4; Ta-             carbonate-bound sterols were virtually absent. In layer 2,
ble S3). Quite similar distributions were observed when the              carbonate-bound sterols occurred but were still much less
compound concentrations were plotted against Corg , due to               abundant than freely extractable sterols. In the deeper mat

www.biogeosciences.net/17/649/2020/                                                                  Biogeosciences, 17, 649–666, 2020
658                                                         Y. Shen et al.: Sterol preservation in hypersaline microbial mats

                                                                   Table 3. Stanol / stenol ratios in the freely extractable lipids and
                                                                   carbonate-bound lipids for the microbial mat layers (n.d. is not de-
                                                                   termined, due to a very low concentration of sterols).

                                                                    Layer     Stanol / stenol (10 /15 )       Stanol / stenol (10 /15 )
                                                                                   in free lipids            in carbonate-bound lipids
                                                                             C27     C28      C29     C31    C27    C28     C29    C31
                                                                    1        0.17    0.04     0.14    4.73   n.d.   n.d.    n.d.   n.d.
                                                                    2        0.77    0.18     0.24    4.26   0.34   0.05    0.19   n.d.
                                                                    3        3.49    1.00     1.52    3.95   1.28   0.22    0.64   n.d.
                                                                    4        0.38    0.42     1.24    3.31   0.62   0.27    0.74   n.d.
                                                                    5        0.78    0.55     1.08    2.87   n.d.   n.d.    n.d.   n.d.
                                                                    6         n.d.    n.d.     n.d.   7.35   0.11    n.d.   0.29   n.d.

                                                                   lipids increased for the C27 –C29 pairs between layers 1 and
                                                                   3 and again decreased further downwards, thus being sim-
                                                                   ilar to the freely extractable lipids (see Fig. 6b; Table 3).
                                                                   No stanol / stenol ratios could be obtained for the carbonate-
                                                                   bound C31 sterols, as carbonate-bound C31 stenols were vir-
                                                                   tually absent throughout the mat.

                                                                   3.4.2    Carbonate-bound hopanoids

                                                                   Small amounts of carbonate-bound hopanoids (mainly hop-
                                                                   17(21)-ene and ββ-bishomohopanoic acid) were observed in
                                                                   all mat layers except layer 1 (Table S2). The concentrations
                                                                   showed no consistent trend with mat depth. In layers 2, 5, and
                                                                   6, the summed hopanoids were an order of magnitude lower
                                                                   than in the free lipids (< 1 µg g−1 dry mat; see Table S4).
                                                                   In contrast, the amount of carbonate-bound hopanoids was
                                                                   markedly enhanced in layer 3 (3.22 µg g−1 dry mat), thus be-
                                                                   ing similar to the freely extractable lipids (Table S3).

                                                                   3.4.3    Carbonate-bound fatty acids (FAs)

                                                                   Carbonate-bound FAs range in chain length from C14 to C28 ,
                                                                   with short-chain saturated and monounsaturated homologues
                                                                   predominating (C16 –C19 ). Apart from the straight-chain (n-)
                                                                   FAs, iso-/anteiso-branched C15 –C17 FAs, and a cyclopropyl
                                                                   FA (tentatively identified as cis-9,10-methyleneoctadecanoic
Figure 6. Stanol / stenol ratios for the microbial mat layers,
                                                                   acid) were observed (Table S2). The summed concentrations
(a) freely extractable lipids, and (b) carbonate-bound lipids.
                                                                   of carbonate-bound FAs were of the same order as in the
                                                                   freely extractable lipid fraction (100 ∼ 101 µg g−1 dry mat
                                                                   range). An exception was found for layer 1, where carbonate-
layers (3–6), however, the carbonate-bound and freely ex-          bound FAs were an order of magnitude less abundant than
tractable sterols were of the same order (∼ 10−2 µg g−1 dry        free lipids (Table S3 and S4). The depth distribution of
mat range). C27 –C29 sterenes were also detected in both lipid     the summed carbonate-bound FAs showed an increase un-
pools, but only at trace abundances.                               til layer 3 (highest concentration: 80.45 µg g−1 dry mat), fol-
   C31 sterols were the most abundant sterols in both frac-        lowed by a sharp decrease in the deeper parts, with the lowest
tions, except for layer 1 (ranging up to ca. 85 % in the deeper    values observed for layer 5 (6.87 µg g−1 dry mat; Table S4).
part of the mat), followed by C29 sterols (Fig. S3). The con-          A unique feature of the carbonate-bound FA fractions
centration of carbonate-bound C31 sterols increased in the         is the occurrence of saturated α,ω-dicarboxylic acids (α,ω-
bottom layer 6, which is distinguished from the other sterols      diacids) ranging in carbon numbers from 21 to 28. These
(Fig. 3d). The stanol / stenol ratios in the carbonate-bound       diacids were detected in low concentrations (< 1 µg g−1 dry

Biogeosciences, 17, 649–666, 2020                                                            www.biogeosciences.net/17/649/2020/
Y. Shen et al.: Sterol preservation in hypersaline microbial mats                                                                        659

Figure 7. Depth distributions of steroids, hopanoids, and fatty acids (µg g−1 dry mat; µg g−1 Corg ), and Corg (wt %) in the microbial mat
layers, (a) freely extractable lipids of the Lake 2 mat, (b) carbonate-bound lipids of the Lake 2 mat, and (c) total extractable lipids of the
Lake 22 mat (Shen et al., 2018a) (upper x axes are applied to steroid concentrations and Corg , while lower x axes are applied to hopanoids
and fatty acids).

www.biogeosciences.net/17/649/2020/                                                                  Biogeosciences, 17, 649–666, 2020
660                                                          Y. Shen et al.: Sterol preservation in hypersaline microbial mats

mat) only in layers 3 and 4, where they make up < 10 % of           was autochthonous and derived from the hypersaline, CO2 -
the carbonate-bound FAs.                                            limited ecosystem of Lake 2 (see Schouten et al., 2001). Pre-
                                                                    vious work on carbon isotope compositions of sterols in a
3.4.4    Depth distributions of carbonate-bound                     mat from the adjacent Kiritimati Lake 2A showed δ 13 C val-
         compounds                                                  ues from −19 ‰ to −23 ‰ (Bühring et al., 2009). In addi-
                                                                    tion, Trichet et al. (2001) reported δ 13 C values for sedimen-
The depth distributions of the summed carbonate-bound               tary bulk OM from −14 ‰ to −17 ‰ in Kiritimati Lake 30.
compounds (Fig. 7b) revealed much (by an order) higher              Thus, both studies showed more depleted values than those
concentrations of FAs compared to steroids and hopanoids.           observed for Lake 2. An explanation could be a better CO2
Whereas carbonate-bound steroids displayed no significant           exchange in those lakes, due to their shallow water layer (a
changes throughout the profile, summed carbonate-bound              maximum depth of 0.2 m in Lake 2A, Bühring et al., 2009;
FAs and hopanoids showed a decreasing trend with depth, in-         depth of 0.9 m in Lake 30, Trichet et al., 2001), leading
terrupted by a remarkable enrichment in layer 3 (Table S4).         to the relatively light δ 13 C signatures. Another explanation
Largely identical distributions were observed when these            could be that shrinking lake water bodies caused by La Niña
compound classes were plotted against Corg (Fig. 7b).               dry events are often associated with massive increases in
                                                                    lake salinities (Trichet et al., 2001). For instance, Lake 2A
3.5     Decalcified extraction residues                             (Bühring et al., 2009) was observed to be nearly dried out
                                                                    during our sampling campaign in 2011. The increasing salin-
Ion chromatograms representing steroids and hopanoids re-
                                                                    ities may result in a CO2 -limited ecosystem, leading to en-
leased by pyrolysis of the decalcified extraction residues are
                                                                    richment in 13 C. For Lake 2, such reinforced CO2 limitation
shown in Fig. S2. Throughout the mat, steroids were not
                                                                    is not only supported by the high δ 13 C values of individual
observed in the pyrolysates, indicating that kerogen-bound
                                                                    biomarkers, but also by δ 13 C values of carbonates that were
steroids released from the macromolecular fraction were be-
                                                                    reported to be as high as +6 ‰ (Arp et al., 2012).
low our Py–GC–MS detection limit (∼ 1 ng per analyte; see
Fig. S4). On the other hand, hopanoid moieties were py-
                                                                    4.2     Taphonomy of lipids
rolyzed from the insoluble matter of each mat layer. Whereas
only traces were detected in the pyrolysates of layer 1, their
                                                                    4.2.1    Freely extractable lipids
abundances showed a clearly increasing trend with mat depth
(Fig. S2).
                                                                    The sterols in the studied mat are probably sourced from
                                                                    plankton or organisms thriving at the mat surface, because
4     Discussion                                                    eukaryotes generally depend on an oxygenated environment
                                                                    and would not thrive in deeper, anoxic parts of the mat. The
4.1     Origin of sterols                                           abundance of total extractable sterols was high in the top mat
                                                                    but significantly decreased (up to > 90 %) immediately below
The studied mat contained a broad variety of C27 –C29 sterols       the topmost layer 1 and stayed at trace amounts (10−1 µg g−1
as well as two C31 sterols, indicating potential sources like       dry mat, Fig. 5a) in the deeper part of the mat. Whereas the
animals, fungi, algae, and terrestrial plants (Atwood et al.,       possibility of a change in microbial vs. eukaryotic input over
2014; Houle et al., 2019; Volkman, 1986, 2003). The concen-         the time of mat deposition has to be considered, there are
trations of freely extractable sterols in the topmost layer 1 in    no major changes in the texture of the carbonate phases of
the studied Lake 2 mat are similar to Lake 2A and Lake 22           the mat (except the thin mineral crust representing layer 3),
(∼ 102 –103 µg g−1 Corg ; Bühring et al., 2009; Shen et al.,        which would suggest major environmental changes leading
2018a; see Fig. 5a). However, sterols in the deeper layers are      to an exclusion of eukaryotes. We therefore interpret this
much less abundant in the Lake 2 mat compared to other mats         substantial decrease to result from major sterol degradation
in Kiritimati lakes.                                                caused by heterotrophic microorganisms, thus suggesting the
   Figure S3 shows the relative distribution of summed C27          existence of a major mat-seal effect in the mat studied.
vs. C28 vs. C29 vs. C31 sterols in the microbial mat layers. In        It can furthermore be expected that most sterols were ini-
both lipid fractions, the C31 sterols are predominant, suggest-     tially introduced as stenols. Subsequent alteration by early
ing inputs from dinoflagellates (Atwood et al., 2014; Houle         diagenetic processes within the mat would have resulted in
et al., 2019). C29 sterols make up the next most abundant           a variety of sterol transformation products. Reduction of
group of sterols, potentially indicating contributions from ei-     15 -stenols to 5α-stanols (hydrogenation) is a known re-
ther algae (including diatoms; Rampen et al., 2010; Volkman,        sult of anaerobic microbial degradation (Rosenfeld and Hell-
2003) or terrestrial plants (Volkman, 1986).                        man, 1971; Wakeham, 1989). Consequently, stanol / stenol
   The high δ 13 C value of −7.2 ‰ for the C31 sterols, as          ratios may reflect the extent of microbial alteration under
well as similarly high values measured for fatty acids from         anoxic conditions (i.e., under low redox potential; Gaskell
layer 1, imply that the carbon source of these compounds            and Eglinton, 1975; Nishimura, 1977; Wakeham, 1989). Sev-

Biogeosciences, 17, 649–666, 2020                                                         www.biogeosciences.net/17/649/2020/
Y. Shen et al.: Sterol preservation in hypersaline microbial mats                                                             661

eral investigations have reported such conversion in micro-       dation of both steroids and hopanoids at depth. However,
bial mats (Grimalt et al., 1992; Scherf and Rullkötter, 2009;     it should be considered that different input and degradation
Słowakiewicz et al., 2016), including some mats from other        patterns of C31 sterols (see above) may have influenced the
lakes on Kiritimati (Bühring et al., 2009; Shen et al., 2018a).   steroid / hopanoid ratios observed.
   Stanol / stenol ratios for C27 –C29 pairs in the free lipids      To further check for the sources and additional input of
initially increased with depth as expected and showed the         lipids, we observed the FA distributions in the mat profile
highest values in layer 3, indicating low redox potentials and    (Tables S1 and S3). The predominance of saturated and mo-
a pronounced anaerobic microbial transformation of stenols        nounsaturated C16 and C18 FAs along with a cyclopropyl-
therein (Fig. 6a). In the deeper layers (4–6), however, ra-       C19 FA reveals major contributions from bacteria (Kates,
tios decreased again. We interpret this to result from a more     1964; Kaneda, 1991; Taylor and Parkes, 1985), whereas
efficient microbial OM degradation under higher redox po-         low amounts of homologues > C20 indicate only minor al-
tentials prevailing during the more rapid accretion of the        lochthonous inputs derived from higher plant lipids (Bras-
earlier growth phase of the mat (Blumenberg et al., 2015).        sell et al., 1980; Cranwell, 1982). Fairly constant steroid / FA
This idea is supported by constantly lower Corg contents in       ratios in layers 1 to 4 (Fig. 7a and Table S3) suggest that
the earlier growth phase (Table 1a). As an exception, the         both compound classes experienced similar preservation and
C31 stanol / stenol ratios showed a different trend with depth    degradation pathways. Again, there is little evidence for ad-
and sharply increased again in the bottom layer 6. Possi-         ditional production of microbial lipids in deeper parts of the
bly, primary input variations played a role for the distribu-     mat. Rather, and unexpectedly, steroid / FA ratios even in-
tions of these compounds. 4α-Methylgorgostanol has been           creased in the deepest part of the mat (see Table S3), which
reported in a few dinoflagellate species belonging to the gen-    is likely due to additional inputs of resistant C31 sterols de-
era Peridinium, Alexandrium, and Pyrodinium, (Atwood et           rived from dinoflagellate lipids, as discussed above.
al., 2014; Houle et al., 2019, and references therein). The
partly co-eluting stenol has been tentatively identified as 4α-   4.2.2   Carbonate-bound lipids
methylgorgosterol which has been reported in resting cysts
but not in the motile cells of the dinoflagellate Peridinium      Unlike freely extractable sterols, carbonate-bound sterols
umbonatum var. inaequale (Amo et al., 2010). Conse-               were virtually absent at the top of the mat and likewise
quently, the C31 sterols observed may partly derive from sed-     showed constantly low abundances below (Fig. 5b). These
imentary resting cysts and may have been less affected by mi-     observations suggest that the carbonate matrix played no im-
crobial recycling than conventional C27 –C29 sterols. It may      portant role in encasing (i.e., preserving) sterols in this mat
also be speculated that the unusual side-chain structure and      and may be taken as indicative of a minor role of eukaryotic
methylation pattern of 4α-methylgorgosterols hamper enzy-         organisms, and their OM, in carbonate formation. In con-
matic microbial degradation (e.g., Giner et al., 2003, and ref-   trast, studies revealed that distinctive microbial lipids pre-
erences therein). The steadily increasing relative abundances     served in the carbonate matrix reflect a constructive role of
of C31 vs. C27 –C29 sterols in the mat profile (Fig. S3) sug-     their source organisms in carbonate formation and/or their
gest that C31 sterols experienced different degradation pat-      continuous incorporation during the precipitation processes
terns compared to conventional sterols.                           (Peckmann and Thiel, 2004; Summons et al., 2013; O’Reilly
   The GC-amenable hopanoids observed may have largely            et al., 2017).
formed as the earliest (eogenetic) products of bacterio-             Stanol / stenol ratios for the carbonate-bound C27 –C29
hopanepolyols (BHPs; Rohmer et al., 1984) via progres-            sterols were similar to the free lipids, with the highest value
sive, microbially driven defunctionalization. In the top lay-     observed in layer 3, which is comprised of a dense min-
ers 1 and 2, these hopanoids showed the highest concen-           eral crust (Fig. 6b; see Sect. 4.2.1). At the same time, both
trations within the mat (Fig. 7a). Below, they significantly      carbonate-bound hopanoids and microbial FAs were remark-
decreased, suggesting major anaerobic degradation or, al-         ably enriched in layer 3, indicating intensive microbial activ-
ternatively, binding to macromolecules. In the deeper lay-        ity and, seemingly, an enhanced preservation of prokaryotic
ers 5 and 6, however, concentrations of hopanoids increased       lipids in the carbonate matrix of this layer.
again to moderate values. It can be assumed that part of             Steroid / hopanoid ratios in the carbonate-bound fraction
the initially produced BHPs have been transformed into            showed no consistent trend through the depth profile (Ta-
the GC-amenable hopanoids observed. Another part have             ble S4). After a major drop in layer 3, due to the above-
evidently been incorporated into macromolecular organic           mentioned increase in hopanoids, steroid / hopanoid ratios
matter, as revealed by the release of hopanoids from the          increased again in the lower layers 5 and 6. This may re-
decalcified extraction residues by Py–GC–MS (Fig. S2).            sult from a higher abundance of carbonate-bound C31 sterols
Steroid / hopanoid ratios show a significant drop in the up-      in the bottom layers (as it was also observed in the freely
per two layers (Table S3), possibly due to a major biodegra-      extractable sterol fraction; see above). Steroid / FA ratios in
dation of steroids therein, whereas the ratios keep fairly con-   the carbonate-bound lipids showed very low values through
stant in the deeper mat layers, suggesting a similar degra-       the mat profile. Again, the lowest values were observed for

www.biogeosciences.net/17/649/2020/                                                         Biogeosciences, 17, 649–666, 2020
662                                                         Y. Shen et al.: Sterol preservation in hypersaline microbial mats

layer 3, due to the highest concentration of FAs observed          4.3   Comparison with sterol taphonomy in other
therein.                                                                 microbial mats
   A unique feature in the carbonate-bound lipids is the oc-
currence of α,ω-diacids. Previous work showed that these           Major differences are evident between the depth distributions
lipids may have multiple biological sources, e.g., higher          of steroids in the Lake 2 mat studied here and those reported
plants (Kolattukudy, 1980) and seagrass (Volkman et al.,           previously from a Lake 22 mat (Shen et al., 2018a). Whereas
1980). Given the presence of our findings of terrestrial           the sterol concentrations in the topmost layers are similar in
biomarkers (albeit in low abundance) in the studied mat,           both mats (102 µg g−1 Corg range), the Lake 22 mat showed
these α,ω-diacids could be sourced from higher plant waxes.        no systematic decrease in sterols with depth. Such entirely
On the other hand, α,ω-diacids may also be forming in situ,        different behavior of sterols in the mats from the two adjacent
for instance via terminal oxidation of monoacids or other          lakes raises questions about potential mechanisms causing
aliphatic moieties such as n-alkanes (Ishiwatari and Hanya,        the observed variation.
1975; Johns and Onder, 1975). Interestingly, α,ω-diacids              One explanation for the differences observed could be dif-
were also reported in a recent study on Cretaceous hydrocar-       ferences in salinity. In 2011, the salinity of Lake 22 (Shen
bon seep limestones, where they were only detected after the       et al., 2018a) was 250 ‰, whereas Lake 2 showed only
dissolution of the authigenic carbonate minerals (Smrzka et        125 ‰. High salinity may reduce microbial cell growth and
al., 2017). Likewise, α,ω-diacids were reported to be remark-      reproduction and limit the metabolism of microorganisms.
ably more abundant in carbonate concretions than in their          The resulting decrease in bacterial activity would affect the
clastic host rocks (Thiel and Hoppert, 2018). Taken together,      biodegradation rates of organic compounds (Abed et al.,
these results indicate that the formation of α,ω-diacids is di-    2006). Several studies reported that the degradation rates
rectly associated with carbonate precipitation, or that these      of hydrocarbons significantly decrease as salinity increases
compounds are better preserved in carbonate matrices.              (Abed et al., 2006; Ward and Brock, 1978). In turn, lower
                                                                   salinity supports the proliferation of a more diverse micro-
4.2.3   Decalcified extraction residues                            bial community (Bolhuis et al., 2014), thus possibly enhanc-
                                                                   ing OM biodegradation. As a consequence, conditions for
Steranes have previously been detected in the insoluble            heterotrophic microorganisms could be more favorable in
macromolecular OM of benthic mats using catalytic hy-              Lake 2 compared to the extremely hypersaline Lake 22, thus
dropyrolysis (HyPy) (Blumenberg et al., 2015; Lee et al.,          accelerating the biodegradation rates of organic molecules,
2019). In hydropyrolysates of microbial mats from Guerrero         including sterols.
Negro in Mexico, concentrations of steranes and hopanes               A second plausible explanation for the differences be-
were in the same range (Lee et al., 2019). Likewise, previ-        tween the Lake 2 and 22 mats might be associated with the
ously reported HyPy data for our mat from Lake 2 (Blumen-          environmental properties of both lakes, particularly water
berg et al., 2015) also showed the presence of both hopanoids      depth. A major drought period prevailed in Kiritimati from
and steroids, but the latter were more than 20 times less          2002 to 2011, as a result of a very strong La Niña dry event.
abundant. This finding of predominant hopanoids in the             Due to reduced rainfall, the water level of the lakes in Kir-
Lake 2 mat is concordant with our Py–GC–MS data; how-              itimati generally dropped, so that, in some areas, parts of the
ever, steroid moieties were even below the detection limit in      lake bottoms became subaerially exposed (this has been ob-
our analyses (Fig. 2S). The non-detection of steroids here         served for Lake 2A; see Sect. 4.1). The Lake 22 microbial
could be due to a lower detection limit in our Py–GC–MS            mat was collected at the margin of the lake (Fig. 2f; water
setup, where an absolute amount of > 1 ng of the target ana-       depth ca. 0.2 m; Shen et al., 2018a). Therefore, mats from
lyte is required to obtain an interpretable mass spectrum (ac-     this shallow sampling site may have suffered from heavy
cording to analyses of reference compounds). Further, unlike       evaporation due to such major drought events. Indeed, the
in HyPy, there is no possibility in Py–GC–MS for a down-           Lake 22 mat studied by Shen et al. (2018a) showed an irreg-
stream chromatographic separation and concentration of the         ular top layer of V-shaped fractures, which are characteris-
analytes.                                                          tic features of subaerial exposure in evaporitic settings. On
   Taken together, the strong decline in freely extractable        the other hand, the Lake 2 mat studied here was collected
sterols below the uppermost mat layer along with only minor        in the lake center at the water depth of 4 m and would have
incorporation into carbonate and macromolecular OM sug-            been clearly less prone to subaerial exposure. These inter-
gest that major degradation of steroids occurred during eoge-      pretations are further supported by other studies highlighting
nesis and the earliest diagenesis in the Lake 2 mat studied.       the influence of water depth and salinity on the microbial
                                                                   and biomarker composition of microbial mats (Pagès et al.,
                                                                   2014).
                                                                      Likewise, much higher stanol / stenol ratios in the Lake 22
                                                                   mat (Shen et al., 2018a) indicate a more intense anaero-
                                                                   bic microbial transformation (yet no degradation) compared

Biogeosciences, 17, 649–666, 2020                                                        www.biogeosciences.net/17/649/2020/
Y. Shen et al.: Sterol preservation in hypersaline microbial mats                                                                  663

to the Lake 2 mat studied here (Fig. 6). Whereas sterols          Code and data availability. Data can be found in the Supplement
in the Lake 22 mat experienced major microbial transfor-          or can be requested from Yan Shen (yshen@gwdg.de).
mation (stenols = > stanols = > sterenes), sterols in Lake 2
seemingly suffered from major degradation that largely elim-
inated the primary eukaryotic signal. The contrasting distri-     Supplement. The supplement related to this article is available on-
butions observed suggest that sterols have a higher preser-       line at: https://doi.org/10.5194/bg-17-649-2020-supplement.
vation potential in microbial mats under stronger salinities
and/or more desiccated conditions, such as those of Lake 22.
Our finding of such significant differences in two adjacent       Author contributions. YS had the main responsibility for analyzing
                                                                  the data and writing the manuscript. JR and VT designed the project.
mat settings on the same island should be considered when
                                                                  JR conducted the fieldwork, collected all the sample materials and
making generalizations for the fossil record from studies         participated in the writing process. VT participated in interpretation
of sterols in modern microbialites or microbial mats. Sterol      of the data and the writing process. PSG had the main responsibil-
preservation within microbial mats appears to be a complex        ity for the bulk data measurements and participated in the writing
process that may be strongly influenced by environmental pa-      process. SWR participated in the interpretation of the data and the
rameters. Therefore, paleoenvironments must be thoroughly         writing process. All the co-authors contributed to this work.
constrained if the presence, or absence, of these compounds
is interpreted in the study of ancient deposits.
                                                                  Competing interests. The authors declare that they have no conflict
                                                                  of interest.
5   Conclusions

The preservation of primary eukaryotic sterols and their pro-     Acknowledgements. We gratefully acknowledge thoughtful com-
gressive alteration were studied in a ca. 1500-year-old micro-    ments provided by the journal reviewers Gordon Love and Rienk
bial mat from the hypersaline Lake 2 on Kiritimati. Conven-       Smittenberg and the editor Marcel van der Meer. We thank Ger-
tional C27 –C29 sterols decreased severely with depth, sug-       not Arp and Martin Blumenberg for helpful information and con-
gesting a progressive biodegradation of these compounds           structive comments. We also thank Danny Ionescu for his ex-
within the mat. A different pattern was observed for un-          cellent help during the fieldwork in Kiritimati. Andreas Reimer
usual, isotopically heavy C31 sterols (4α-methylgorgosterol       is acknowledged for hydrochemical measurements. We also
and 4α-methylgorgostanol; δ 13 C = −7.2 ‰), which showed          thank Jens Dyckmans for performing the compound-specific car-
increasing abundances in the deeper mat layers. This may be       bon isotope measurements. Wolfgang Dröse, Birgit Röring, and
                                                                  Dorothea Hause-Reitner are kindly acknowledged for laboratory as-
explained by an enhanced resistance of these sterols against
                                                                  sistance. Pablo Suarez-Gonzalez acknowledges funding by a post-
degradation, possibly due to their unusual side chain and/or      doctoral research fellowship of the Alexander von Humboldt Foun-
an origin from highly resistant dinoflagellate resting cysts.     dation.
Separate analysis of decalcified samples revealed that no
significant “trapping” of sterols into the mineral matrix oc-
curred in this mat. Further, Py–GC–MS of decalcified ex-          Financial support. This research has received funding from the
traction residues showed steroids to be below detection limit,    German Research Foundation (DFG, Project Re 665/18-2 and
in contrast to hopanoids which occurred abundantly in the         Research Unit 571 “Geobiology of Organo- and Biofilms”).
pyrolysates throughout the mat profile. Our combined data
suggest that the studied mat might have formed an effec-          The open-access of this publication was funded
tive filter against the preservation of sterols in the sedimen-   by the University of Göttingen.
tary record. For the studied mat, the results thus support
the hypothesis of a mat-seal effect describing the degrada-
tion of eukaryote-derived lipids in benthic microbial mats.       Review statement. This paper was edited by Marcel van der Meer
Our results are markedly different from those recently re-        and reviewed by Gordon Love and Rienk Smittenberg.
ported from another microbial mat from close-by Lake 22
where sterols showed no systematic decrease with depth. In
that mat, higher salinity or temporal subaerial exposure have     References
probably hampered microbial metabolism and promoted the
preservation of steroids over degradation. The data combined      Abed, R. M. M., Al-Thukair, A., and de Beer, D.: Bacterial di-
in this study show that sterol taphonomy may strongly vary          versity of a cyanobacterial mat degrading petroleum compounds
between different mat systems, and even contrasting sterol          at elevated salinities and temperatures, FEMS Microbiol. Ecol.,
degradation patterns may be expected in response to envi-           57, 290–301, https://doi.org/10.1111/j.1574-6941.2006.00113.x,
ronmental conditions.                                               2006.
                                                                  Amo, M., Suzuki, N., Kawamura, H., Yamaguchi, A., Takano,
                                                                    Y., and Horiguchi, T.: Sterol composition of dinoflagel-

www.biogeosciences.net/17/649/2020/                                                           Biogeosciences, 17, 649–666, 2020
You can also read