Fish ecology of the Alto Madre de Dios River Basin (Peru): notes on electrofishing surveys, elevation, palm swamp and headwater fishes - Preprints ...
←
→
Page content transcription
If your browser does not render page correctly, please read the page content below
Preprints (www.preprints.org) | NOT PEER-REVIEWED | Posted: 9 February 2021

          Article

          Fish ecology of the Alto Madre de Dios River Basin (Peru):
          notes on electrofishing surveys, elevation, palm swamp and
          headwater fishes
          Ibon Tobes 1, 2*, Adrián Ramos-Merchante 3, Julio Araujo-Flores 4, Andrea Pino-del-Carpio 2, Hernán Ortega 5,
          Rafael Miranda 2

                                       1 Centro de Investigación en Biodiversidad y Cambio Climático (BioCamb), Facultad de Ciencias del Medio
                                         Ambiente, Universidad Tecnológica Indoamérica, EC170103, Quito, Ecuador; ibontobes@uti.edu.ec (I.T.)
                                       2 Department of Environmental Biology, University of Navarra, 31009, Iruñea-Pamplona, Spain;

                                         apino@alumni.unav.es (A.P.C); rmiranda@unav.es (R.M.)
                                       3 Department of Integrative Science, University of Huelva, Campus Universitario El Carmen, Avda. Andalucí

                                         s/n, 21071 Huelva, Spain; ramosadrian24@gmail.com (A.R.M)
                                       4 Centro de Innovación Científica Amazónica (CINCIA), 27106, Winston-Salem, North Carolina, EEUU; arau-

                                         jojm@wfu.edu (J.A.F.)
                                       4 Departamento de Ictiología, Museo de Historia Natural de la Universidad Nacional Mayor de San Marcos,

                                         Lima, Peru; hortega.musm@gmail.com (H.O.)
                                       * Correspondence: ibontobes@uti.edu.ec

                                       Abstract: Our study analyzes the ecology and distribution of fish communities related to the envi-
                                       ronmental variables of the Alto Madre de Dios River, an Andean-Amazon watershed of southern
                                       Peru, between 300 and 2811 m a.s.l. within the Manu Biosphere Reserve. We provide new ecological
                                       and diversity data for these highly unknown rivers and new data for palm swamp habitats. With
                                       electric fishing techniques, we collected a total of 1934 fish specimens belonging to 78 species, 42
                                       genera and 15 families. To assess main patterns of diversity we combined SIMPER and ANOSIM
                                       with canonical correspondence analysis to obtain an overview of the community structure of fish
                                       and their distribution related to aquatic habitats. Our results show an important shift on fish diver-
                                       sity at 700 m a.s.l. separating headwater and middle-lowland communities. Electrofishing was a
                                       hindrance due to the depth, flow and low conductivity of the rivers, but also allowed us to capture
                                       fish not observed with other techniques. We also compared the use of elevation with slope as an
                                       alternative variable for statistical analysis. Our results show that slope offers a solid and equivalent
                                       explanation for fish distribution variability, avoids redundance, and instead of giving geographical
                                       data offers ecologically solid information.

                                       Keywords: Tropical Andes; Manu Biosphere Reserve; Astroblepus; Trichomycterus; Mauritia flexuosa.

                                       1. Introduction
                                            Freshwater ecosystems are often referenced among those that are most altered and
                                       threatened by anthropogenic impacts [1] and their fauna is at greater risk than any other
                                       animal and plant groups [2]. The decline in freshwater biodiversity is alarming and far
                                       greater than in the most affected terrestrial ecosystems, positioning it as the over-riding
                                       conservation priority worldwide [3]. In this respect, precise knowledge of ecological as-
                                       pects like species distribution and requirements are a key point for conservation strate-
                                       gies, especially when the focal species are threatened or endangered [4]. Unfortunately,
                                       our limited taxonomic knowledge and incomplete information on species distributions
                                       for broad territories is very high and represents an insurmountable obstacle for documen-
                                       tation of imperilment and extinction of freshwater biodiversity [5]. In particular, fish as-
                                       semblage variations in mountain streams of the Andes are yet poorly understood [6,7].

            © 2021 by the author(s). Distributed under a Creative Commons CC BY license.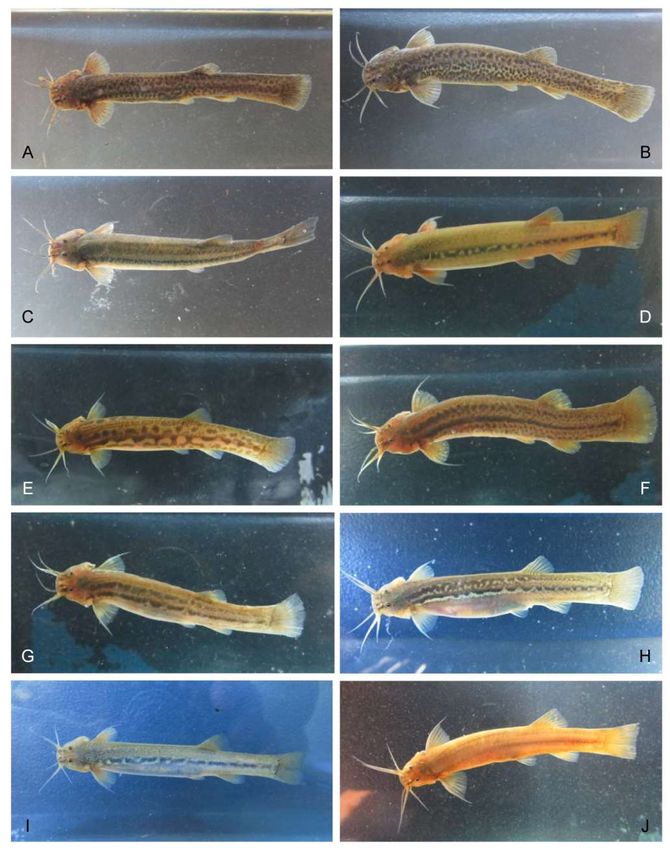
Preprints (www.preprints.org) | NOT PEER-REVIEWED | Posted: 9 February 2021

                                                                                                                          2 of 20

                                          The tropical Andes is regarded as the richest of the 25 recognized global biodiversity
                                    “hotspots”. Includes Andean ecosystems up from 500 m a.s.l., extending from Chile and
                                    Argentina, through Bolivia, Peru, Ecuador, to Colombia and Venezuela. This hotspot sup-
                                    ports an estimated 45,000 plant and 3400 vertebrate species (excluding fishes), which rep-
                                    resents about 15% and 12% of all globally known species, respectively, being nearly half
                                    of them endemic to the area [8]. Although fish diversity for the hotspot is unclear yet,
                                    some papers estimate fish richness for the Andean region more than 600 species [9], with
                                    more species found at low elevations compared to higher reaches [6]. Around 2700 species
                                    have been recognized for the hotspot inside the Amazon Basin territory [10]. In contrast
                                    to richness, endemism tends to increase at higher elevations and particularly concentrates
                                    in isolated patches of habitat such as valleys and mountain tops [8]. An IUCN report eval-
                                    uated fish fauna conservation status for the Tropical Andes [11] considering 666 endemic
                                    species: 13 spp. critically endangered; 33 spp. vulnerable; 36 spp. near threatened; 341 spp.
                                    least concern; 215 spp. data deficient. One of the main conclusions points out the signifi-
                                    cant information gap: 32% of the evaluated fish were poorly known.
                                          However, Peru is home to 1,010 fish species [12], more than the 7% of all the globally
                                    known freshwater species. Most of them (more than 800) are found in the Amazonian
                                    Basin. Only during the first decade of the XXI century 155 new species were named in
                                    Peru and the experts estimate the total number of Peruvian freshwater fishes at approxi-
                                    mately 1,200 spp [12]. But as seen before, there have been few ecological surveys focusing
                                    on fish and the majority point out the uneven level of knowledge for this group of verte-
                                    brates [13,14], with some taxa itemized at the species level, whereas others routinely are
                                    catalogued at family level, order or even phylum [5].
                                          If we focus on research efforts on the Department of Madre de Dios where our study
                                    was carried out, Pitman et al. [15] reviewed all the scientific studies generated for the de-
                                    partment on and found that only 2.8% of the analyzed manuscripts focus on fish or hy-
                                    drobiology. Just lichens received less attention than fish. Other research works regarding
                                    plants or mammals comprise 21.3% and 16.6% of the total scientific literature, respectively.
                                          Streams of the Tropical Andes are also ecologically important as the headwaters of
                                    the megadiverse lowland river systems in South America [16]. They are responsible of
                                    delivering major loads of inorganic sediment and organic carbon to lowlands [17] and
                                    play a key role in the ecological processes along the Andes-to-Amazon fluvial continuum
                                    [18]. Furthermore, the Andean flank of the Amazon hosts the highest biodiversity rates
                                    and has been least affected by historical climate variability and land use [19].
                                          However, the Andean-Amazonian piedmont is a rapidly changing landscape, part of
                                    the “arc of deforestation” [20], caused foremost by the expansion of cattle and soybean
                                    production [21]. The recent growth of human populations and the exploitation of natural
                                    resources are leading to extensive reductions in habitats and subsequent impacts on rivers
                                    [22,23]. Additionally, the proliferation of hydroelectric dams in the Andean Amazon val-
                                    leys represents a major threat for the integrity of these ecosystems and may lead to irre-
                                    versible and unpredictable changes both in the headwaters and specially for the lowland
                                    areas in the Amazon [24]. Fortunately, many opportunities for protecting these habitats
                                    yet exist, particularly in Peru, where entire river systems are still relatively intact and
                                    where there are few large dams and other major structural changes to river channels [25].
                                          Our study area, the Alto Madre de Dios River Basin, in the south west of Peru, is an
                                    almost pristine basin. It’s located in the Andean-Amazonian piedmont, in the transition
                                    zone of the Manu Biosphere Reserve, bordered on the northwest by the Manu National
                                    Park, and on the southeast by the Amarakaeri Communal Reserve, two important pro-
                                    tected areas of the Peruvian Amazon. This region has long been known to tropical biolo-
                                    gists as a region high in species diversity, as well as some of the world’s largest expanses
                                    of pristine tropical forest [26].
                                          Given the pessimistic predictions for the sustainability and conservation of the An-
                                    dean biodiversity due to environmental alterations [27,28] studies on the biotic and abiotic
                                    factors conditioning the abundance and distribution of Andean fish are critical to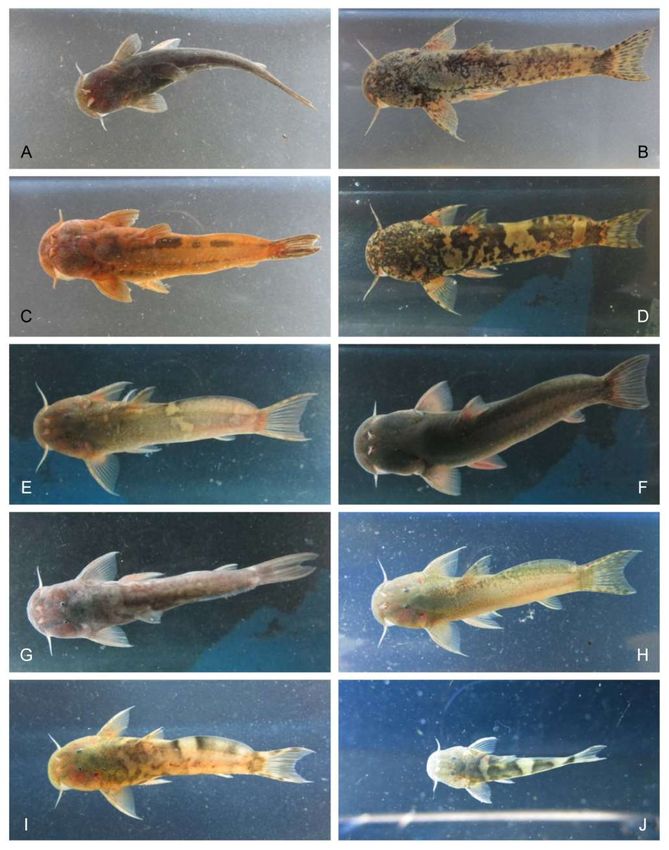
Preprints (www.preprints.org) | NOT PEER-REVIEWED | Posted: 9 February 2021

                                                                                                                          3 of 20

                                    document the primary characteristics of the original communities and thereby contribute
                                    to the delimitation of appropriate conservation areas and/or to recovery strategies. Fur-
                                    thermore, Andean rivers are ecologically relevant as the upstream branches of the mega-
                                    diverse wetlands in the Amazon plain, and freshwater fish should be considered as fun-
                                    damental indicators of ecological conditions in these critical regions [28]. To that end, bi-
                                    ological knowledge is essential for understanding fish distribution along the basins and
                                    to relate it to different natural and anthropogenic variables.
                                         One of the most frequent variables used for studying ecology and biodiversity distri-
                                    bution patterns is elevation. Ecologist all around the globe have demonstrated the strong
                                    correlation between altitude and changes in community composition, for plants [29], in-
                                    sects [30], amphibians [31], birds [32], and other biodiversity. Elevation is also commonly
                                    used for studying freshwater biodiversity distribution patterns along the watersheds [33],
                                    and together with the distance to the mouth or the distance to the source, they are among
                                    the most repeated variables for analyzing fish distribution patterns [14,34]. Nevertheless,
                                    the use of those geographical variables can be problematic. We aspire to discuss it and
                                    evaluate the use of slope as an alternative environmental variable.
                                         In the present study we examine the freshwater ecology for the Alto Madre de Dios
                                    River focusing on its ichthyofauna and evaluate the environmental integrity of the studied
                                    ecosystems. Our specific objectives are to (1) describe spatial variation of fish assemblage
                                    of an unstudied Andean-Amazonian stream, (2) to identify patterns of association be-
                                    tween fish assemblages and habitat variables, and to (3) discuss the use of elevation for
                                    ecological and fish distribution analysis.

                                    2. Materials and Methods

                                    2.1. Study area

                                          The Manu National Park has been considered one of the world’s most important
                                    tropical protected areas since its creation in 1973 (Shepard et al., 2010). Located in the
                                    southern Peruvian Amazon rainforest constitutes the core of the Manu Biosphere Reserve
                                    and an IUCN World Heritage Site [35]. The southern buffer zone of Manu Biosphere Re-
                                    serve includes the Alto Madre de Dios basin (11°00’-13°30’S, 73°30’-68°30’W) (Fig. 1). The
                                    river flows, south to north, for 275 km through the rainforest of Cusco and Madre de Dios
                                    Departments, draining an area of approximately 1600 km2. The altitude in the basin varies
                                    from up to 3500 to 300 m a.s.l. in the Manu River junction, spanning five Andean vegeta-
                                    tion zones: puna (4500–3500 m), upper cloud forest (3500–2500 m), lower cloud forest
                                    (2500–1000 m), piedmont (1000–400 m) and lowlands (400–50 m) [36]. Our highest sam-
                                    pling site was located at 2411 m a.s.l. while to lowest was at 398 m a.s.l., 80 kms down-
                                    stream. Rivers flow through deep and narrow valleys and steep slopes from the source to
                                    around 700 m a.s.l., where the valleys open to wide and flat lowland floodplains. Flow
                                    regime is highly responsive to rainfall and presents the greatest discharge period from
                                    November to April, decreasing progressively in the dry season (from May to October).
                                    The rivers remain turbid through the year, with highest sediment loads during the rainy
                                    season.
                                          Population density in the Alto Madre de Dios valley is low, with scattered settle-
                                    ments which are under the administration of the village of Pilcopata in the District of
                                    Kosñipata, Department of Cusco (pop. 4790 in 2007, according to the Statistical National
                                    Institute of the Peruvian Government).
                                          Nowadays, most of the land is still covered by primary Amazonian forest, although
                                    some areas have been deforested and are used for cattle raising. Tourism facilities - lodges
                                    and a network of forest trails - are used by a relatively low number of tourists in compar-
                                    ison with other lodges in Madre de Dios area [26].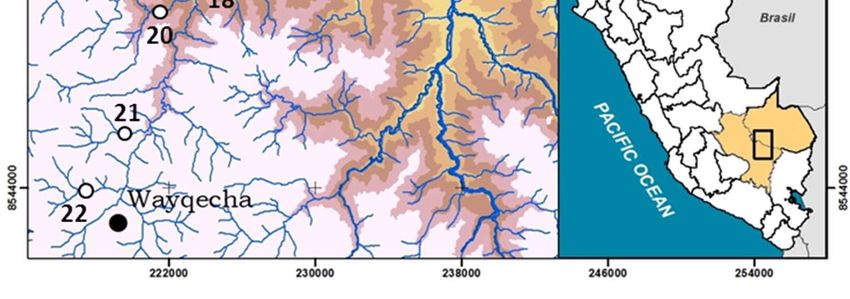
Preprints (www.preprints.org) | NOT PEER-REVIEWED | Posted: 9 February 2021

                                                                                                                      4 of 20

                                    Figure 1. Sampling sites in the Alto Madre de Dios River, Peru (white circles).

                                    2.2. Field sampling and analysis

                                         Our survey was conducted on twenty-two sampling sites in June 2012 (Fig. 1). The
                                    following environmental variables were recorded at each site using a multiparametric
                                    probe (Hanna Instrument, HI 98129 Combo Waterproof): conductivity (µS/cm), water
                                    temperature (°C), and pH. Characterization of habitat structure was done using transects
                                    according to Armantrout (1998), and included depth (m), width (m), water velocity (m·s-
                                    1), percent tree canopy shading and dominant substrate categorized as fines (256 mm), or bedrock and concrete.
                                    Additionally, two habitat quality indices were measured: Qualitative Habitat Evaluation
                                    Index QHEI (Rankin, 1989), and Andean adapted version of the riparian forest quality
Preprints (www.preprints.org) | NOT PEER-REVIEWED | Posted: 9 February 2021
5 of 20
index QBR (Acosta et al., 2009) (Table 1). QHEI jointly considers different habitat param-
eters, such as bottom substrate and embeddedness, instream structure, velocity and depth
regime, canopy cover, channel alteration and pool/riffle or run/bend ratios. QBR index
includes aspects of the riparian forest such as total riparian vegetation cover, cover struc-
ture, cover quality and channel alterations.
Table 1. Sampling sites and environmental variables in Alto Madre de Dios River, Peru.
Code River Place Date Geographic coord. Alt pH Ta Tw Cd Wh Dh Vc QBR QHEI
01R Aguas Calientes 13/06/2012 12°40'18"S 71°16'02"W 398 7.95 24.3 21.7 105 18.2 25.1 0.51 100 72
02R Shintuya 12/06/2012 12°40'17"S 71°18'18"W 424 8.07 24.4 24.4 99 11.2 13.7 0.23 90 72
03A Anaconda 13/06/2012 12°40'54"S 71°17'50"W 428 7.37 26.4 21.4 119 3.45 16.8 0.05 95 61
04Q Mascuitania 14/06/2012 12°47'24"S 71°23'09"W 459 6.82 29.0 25.4 44 7.86 25.6 0.25 85 67
05Q Puente a km 2,5 14/06/2012 12°41'18"S 71°20'54"W 462 8.03 26.1 22.4 169 5.54 18.7 0.15 100 74
06R Carbón 11/06/2012 12°53'33"S 71°20'56"W 499 8.78 26.3 25.3 102 14.4 34.5 0.41 100 85
07R Pilcopata 10/06/2012 12°53'44"S 71°23'59"W 511 6.94 24.8 25.0 119 15.7 15.6 0.04 100 74
08R Piñi-Piñi 07/06/2012 12°53'19"S 71°24'21"W 518 6.86 22.3 22.0 131 6.86 44.1 0.19 100 88
09Q Villa Carmen 07/06/2012 12°53'19"S 71°24'21"W 518 7.20 22.3 20.6 126 4.51 5.11 0.13 100 62
10R Hospital 08/06/2012 12°55'14"S 71°25'21"W 547 7.63 23.1 19.9 26 28.3 36.6 0.74 100 84
11R Tono 08/06/2012 12°55'01"S 71°25'44"W 551 7.70 19.1 18.5 50 6.94 22.1 0.30 100 68
12R Salvación 11/06/2012 12°50'23"S 71°21'09"W 558 7.26 24.0 23.2 33 4.42 30.1 0.39 100 66
13R Queros 09/06/2012 12°58'07"S 71°20'28"W 587 8.00 20.0 18.3 61 10.4 39.5 0.31 80 82
14R Sabaloyacu 09/06/2012 12°57'27"S 71°20'09"W 593 7.70 19.7 21.2 44 22.9 31.0 0.43 100 87
15A Aguajal 17/06/2012 12°56'33"S 71°24'46"W 622 5.77 23.9 22.0 26 2.49 57.4 0.04 50 63
16R Asunción 10/06/2012 13°00'36"S 71°25'50"W 720 7.40 26.4 19.3 65 5.16 19.9 0.32 100 78
17Q Quitacalzon 16/06/2012 13°01'34"S 71°29'59"W 1064 7.83 20.9 18.7 52 4.07 31.4 0.45 100 88
18R Kosñipata 16/06/2012 13°03'23"S 71°32'36"W 1347 7.53 22.2 16.0 89 6.42 24.4 0.15 95 70
19R San Pedro 16/06/2012 13°03'19"S 71°32'48"W 1394 7.81 20.1 18.5 43 7.74 49.4 0.48 95 88
20R Unión 17/06/2012 13°04'17"S 71°34'11"W 1673 7.72 20.2 15.3 64 8.41 32.0 0.72 75 66
21Q Wayquecha 18/06/2012 13°07'46"S 71°34'41"W 2218 7.40 17.3 11.4 51 3.99 30.2 0.83 100 84
22Q Pacchayoc 18/06/2012 13°09'30"S 71°35'51"W 2411 4.41 16.1 11.7 188 6.11 23.9 0.89 100 82
Alt: Altitude (m), Ta: Air temperature (ºC), Tw: Water temperature (ºC), Cd: Conductivity (µS•cm-
1), pH, Wh: Mean width (m), Dh: Mean depth (cm), Vc: Water velocity, QBR: riparian forest qual-
ity index and QHEI: qualitative habitat evaluation index.
Fish sampling was carried out by electrofishing surveys, using a backpack electro-
fishing gear (Hans Grassl model IG200/2D, 300-600V, 0.2-2A) following a single-run de-
pletion methodology and estimating fish abundance based on catch per unit effort (CPUE)
(Meador, McIntyre & Pollock, 2003). Collected fish were anesthetized and subsequently
counted, measured to the nearest 0.1 cm total length (TL), weighed with a digital scale to
an accuracy of 0.05 g and released after the survey, except for some voucher specimens
kept for posterior identification.
Voucher specimens were deposited in the fish collection of the Natural History Mu-
seum of National University of San Marcos (Lima, Peru). In the laboratory, fish were pre-
served in alcohol (75%) and identified by Ana María Cortijo, Jessica Espino and Hernán
Ortega, members of the Department of Ichthyology of Museum. Scientific names were
validated according to W. N. Eschmeyer’s Catalog of Fishes [37].
2.2. Data analysis
From fish community compositional data, richness (Margalef’s index R = (S-1)/ln N),
diversity (Shannon–Wiener index H’ = -∑pi log2pi) and dominance (Simpson’s index D =
∑pi2) measures were calculated, where pi is the proportion of species «i» at a given site
and S is the number of species [38].Preprints (www.preprints.org) | NOT PEER-REVIEWED | Posted: 9 February 2021
6 of 20
First, simple regressions were set between the mentioned indices and elevation, dis-
tance to the mouth or slope. We wanted to describe and compare patterns of diversity
considering these three variables related to location along the basin.
Second, several multiparametric statistical approaches were used to establish the
main spatial patterns in the fish community composition [39]. To detect patterns between
fish communities we used a permutation-based test with a nonparametric one-way anal-
ysis of similarity (ANOSIM) using a Bray-Curtis similarity index based on abundance data
[40,41]. The R outputs of ANOSIM analysis increased from 0 (lower) to 1 (higher). Post-
hoc tests with Bonferroni correction in p-values (which are multiplied by the number of
comparisons) are done. If ANOSIM revealed a statistically significant result, the relative
contribution of each species to group dissimilarities was quantified using a similarity per-
centage analysis (SIMPER), with a cut-off criterion of 90% (Bray-Curtis similarity index),
to identify subsets of the most important species [40]. SIMPER calculates the average Bray-
Curtis dissimilarity between all pairs of inter-group samples, expressed in terms of the
average contribution from each species. Previously, different environmental categorical
variables were developed to compare among them. Type of mass of water (river vs
stream); elevation (upstream-downstream 700 m) and stream order were used.
For the choice of linear or unimodal analysis a preliminary DCA (Detrended Corre-
spondence Analysis) was performed [42]. This analysis evaluates the species turnover (the
length of gradients) through the first DCA axis. The criterion for choosing linear vs. uni-
modal ordinations models is to obtain a SD 3 because
of the large number of species and their frequency of occurrence. For examine relation-
ships between community composition and several environmental variables a Canonical
Correspondence Analysis (CCA, Unimodal response; length of gradient SD >3) was used
through the program CANOCO 4.5 [43,44] based on DCA results. To reduce the number
of graphics and considering the similar patterns shown, altitude was selected over dis-
tance to mouth as representant of the geographical variables, to compare it with slope.
Two parallel CCA were carried out with altitude or slope as key variables related to loca-
tion along the headwater-downstream gradient. This direct gradient analysis technique
provides ordination axes linearly related to the explanatory variables. The main result is
a scatterplot ordination diagram displaying the pattern of fish assemblage variation along
the environmental variables shown as vectors. Vector direction and length indicate the
relative magnitude and influence of a particular variable on fish assemblages. The signif-
icance of the analyses was assessed by a permutation test with 100 random permutations.
To improve linearity, environmental variables were log transformed. Proportional data
and abundance fish data were transformed (arcsine and root transformed, respectively).
Peebles was removed to avoid a high variance inflation factor (VIF) [45].
All multiparametric analysis were done for species that were captured in more than
two sites (i.e. 10% occurrence) and were performed using the R project software version
3.2.3 [46] with the package `vegan´ version 2.3-3 [47] except in the case of CCA which had
been developed in CANOCO 4.56 [44].
3. Results
A total of 1934 specimens were collected and 78 fish taxa were identified belonging
to 43 genera and 14 families (Dataset S1). Twenty-seven species were undetermined, ten
were identified as species affinis, and 41 species were correctly identified. Characids were
the most abundant taxon with 43% of the species, followed by loricarids (14%), tricho-
mycterids (8%), astroblepids, cichlids and heptapterids (7% each one) and crenuchids
(3%). The remaining fish belonged to ten families with only one represented species.
Regarding diversity indices, values presented a marked altitudinal pattern. Shan-
non–Wiener and Margalef’s indices showed negative correlations with altitude, distance
to the mouth and slope, whereas Simpson’s index showed positive correlation (Fig. 2). Site
13 presented the highest diversity and hosted alone the 28% of the total fish species (22
spp). On the other hand, highest sites, 21 and 20, only had two species (Astroblepus sp. andPreprints (www.preprints.org) | NOT PEER-REVIEWED | Posted: 9 February 2021
7 of 20
Trichomycterus sp.). Site 15 significantly different from the rest of the sampling points. It
was a swamp ecosystem isolated from the main river and due to its unique environmental
characteristics, it was discarded for subsequent analysis.
1.4 0.8 0.6
R2 = 0.843*** 0.7 R2 = 0.686*** R2 = 0.777***
log S-Richness 1.2 0.4
0.6
log H-Shannon
D- Simposon
1.0 0.2
0.5
0.8 0.4 0.0
0.3
0.6 -0.2
0.2
0.4 -0.4
0.1
0.2 0.0 -0.6
2.4 2.6 2.8 3.0 3.2 3.4 2.4 2.6 2.8 3.0 3.2 3.4 2.4 2.6 2.8 3.0 3.2 3.4
logElevation logElevation log Elevation
1.4 0.8 0.6
0.7 R2 = 0.498***
log S-Richness
1.2 0.4
0.6
log H-Shannon
1.0 0.2
D-Simpson
0.5
0.8 0.4 0.0
0.3
0.6 -0.2
0.2
0.4 -0.4
R2 = 0.548*** 0.1
R2 = 0.512***
0.2 0.0 -0.6
60 80 100 120 140 160 180 60 80 100 120 140 160 180 60 80 100 120 140 160 180
Distance to the mouth Distance to the mouth Distance to the mouth
1.4 0.8 0.6
R2 = 0.737*** 0.7 R2 = 0.544*** R2 = 0.658***
log S_Richness
1.2 0.4
0.6
log H-Shannon
1.0 0.2
D-Simpson
0.5
0.8 0.4 0.0
0.3
0.6 -0.2
0.2
0.4 -0.4
0.1
0.2 0.0 -0.6
0 5 10 15 20 25 30 35 0 5 10 15 20 25 30 35 0 5 10 15 20 25 30 35
Slope Slope Slope
Figure 2. Estimates of the fish community diversity indices along the Alto Madre de Dios River,
regarding to elevation, distance to the mouth and slope of sampling points.
Pairwise comparison of ANOSIM between communities and pairwise dissimilarities
of communities by SIMPER are shown. Results of one-way ANOSIM showed significant
differences in community composition as indicated the high R values (global R: 0.786,
p0.05). The SIMPER pro-
cedure indicated that using three species was possible to explain more than 33% of varia-
tion between elevation categories. Astroblepus, Trichomycterus and Knodus were the most
important species explaining the variation in community composition (Table 2).
The relationship between fish and environmental variables are shown in Fig. 3 and
Table 3 and 4. The importance of environmental variables is indicated by the marginal
effect values (λA): for both analysis conductivity (0.22), boulders (0.25), water velocity
(0.25) and water temperature (0.38) were most significant. The variables with the highest
marginal effect were slope (0.44) for the first CCA (Table 3a) and elevation (0.59) for the
second CCA (Table 3b).
Outcomes were equivalent using slope and elevation as main variables, therefore,
only results for CCA with slope are described next. The inertia in the assemblage compo-
sition in the studied sites was 0.579 for axis 1, 0.264 for axis 2, 0.167 for axis 3 and 0.126 for
axis 4. The CCA ordination revealed strong relationships between species abundances and
measured environmental variables explaining 72.6 % of species distribution. The first ca-
nonical axis (axis 1) accounted for 38.4 % of the variation in the data set, the second axisPreprints (www.preprints.org) | NOT PEER-REVIEWED | Posted: 9 February 2021
8 of 20
(axis 2) accounted for 17.5 % of the variation in the data set. An unrestricted Monte Carlo
permutation test indicated that all canonical axes were significant (pPreprints (www.preprints.org) | NOT PEER-REVIEWED | Posted: 9 February 2021
9 of 20
First Canonical Correspondence Analysis CCA1 eigenvalue accounts 0.579 and it is
composed by slope, boulders and water velocity on the positive side and water tempera-
ture on the opposite side (Fig. 3a). First Canonical Correspondence Analysis was inter-
preted as a longitudinal gradient from high to lowlands with sites above 700 m a.s.l. being
distributed on the right area of the graph (except for site 12, slightly right from the axis)
and sites below that altitude spread in the left area. Second Canonical Correspondence
Analysis CCA2 (eigenvalue = 0.264) is dominated by conductivity on the positive side and
pH and water temperature on the negative side. Second Canonical Correspondence Anal-
ysis was interpreted as hydrochemical parameters (Table 3a; Fig. 3a).
Table 3. Results of canonical correspondence analyses (CCA) carried out with slope (a) or eleva-
tion (b) as key variables related to location along the headwater-downstream gradient, showing
canonical coefficients and weighted intraset correlation coefficients of explanatory variables with
the first two axes of the CCA. Importance of environmental variables using marginal effects are
shown λA.
Regression/canonical
(a) slope Marginal effects Intraset correlations
coefficients
Groups λA CCA1 CCA2 CCA1 CCA2
Slope 0.44 0.786 -0.261 0.755 -0.114
Water temperature 0.38 -0.715 -0.304 -0.418 -0.433
Water velocity 0.25 0.517 -0.370 0.047 0.002
Boulders 0.25 0.554 0.118 0.006 0.111
Conductivity 0.22 -0.374 0.472 0.007 0.987
Depth 0.19 0.382 -0.216 -0.076 0.377
Fines 0.15 -0.250 0.368 -0.149 0.282
Width 0.14 -0.291 -0.243 -0.132 0.064
pH 0.13 0.014 -0.415 -0.090 -0.662
Gravels 0.07 0.220 -0.252 0.018 0.236
Shade 0.07 0.041 -0.214 -0.266 -0.289
Regression/canonical
(b) elevation Marginal effects Intraset correlations
coefficients
Groups λA CCA1 CCA2 CCA1 CCA2
Elevation 0.59 0.963 0.081 1.069 0.077
Water temperature 0.38 -0.730 -0.213 0.189 -0.330
Water velocity 0.25 0.510 -0.427 0.074 -0.032
Boulders 0.25 0.563 0.051 0.091 -0.010
Conductivity 0.22 -0.354 0.526 -0.068 1.064
Depth 0.19 0.364 -0.259 -0.080 0.402
Fines 0.15 -0.236 0.400 0.045 0.287
Width 0.14 -0.289 -0.205 -0.084 0.184
pH 0.13 -0.018 -0.403 0.164 -0.787
Gravels 0.07 0.198 -0.276 -0.035 0.261
Shade 0.07 0.034 -0.199 -0.083 -0.250Preprints (www.preprints.org) | NOT PEER-REVIEWED | Posted: 9 February 2021
10 of 20
Table 4. Summary statistics table for CCA ordination presented, with slope (a) or elevation (b) as
key variables.
(a) slope CCA Axis 1 2 3 4
Eingenvalues 0.579 0.264 0.167 0.126
Species-environmental correlations 0.956 0.924 0.884 0.950
Cumulative percentage variance
of species data 27.9 40.6 48.7 54.7
of species-environmental relation 38.4 55.9 67.0 75.4
Significance of the axis by the Monte Carlo permutation test is given by F = 3.10 (pPreprints (www.preprints.org) | NOT PEER-REVIEWED | Posted: 9 February 2021
11 of 20
Figure 4. Species and morphotypes of genus Trichomycterus collected in the upperMadre de Dios
River. A) and B) Trichomycterus sp.3 collected on Américo stream (21Q), C) Trichomycterus sp.2
collected on Unión River (20R), D) Trichomycterus sp.2 collected on San Pedro River (19R), E)
Trichomycterus sp.3 collected on Quitacalzon stream (17Q), F) and G) Trichomycterus sp.5 collected
on Quitacalzon stream (17Q), H) Trichomycterus sp.4 collected on Salvación River (12R), I) Tricho-
mycterus sp.6 collected on Kosñipata River (16R), and J) Trichomycterus sp.1 collected on Queros
River (13R).
4. Discussion
According to some ecological studies and inventories carried out in this area [48,49],
more than 130 species of freshwater fishes have been reported for the Alto Madre de Dios
Basin. In the present study, only 78 species were collected, due to two main reasons: 1) the
highest biodiversity is found on the lowest reaches of the basin and our lowest sampling
was 398 m a.s.l.; 2) electrofishing technique has some limitations on these ecosystems.
Regarding electrofishing, only wadeable stretches were sampled, whereas bigger
courses or deep stretches were avoided. This limitation directed our sampling efforts to
smaller rivers and tributaries where the electrofisher gained efficiency [50]. Although this
represents a significant impediment for carrying out a complete biological survey, also
brings up new opportunities. Most of the ichthyofaunal studies undertaken in Amazonia
have focused on the large rivers and commercially valuable species, therefore small andPreprints (www.preprints.org) | NOT PEER-REVIEWED | Posted: 9 February 2021
12 of 20
noncommercial fishes and secondary streams have been usually overlooked [51]. Guided
by our limitations, part of our surveying efforts was concentrated on this poorly studied
ecosystems and species.
Figure 5. Species and morphotypes of genus Astroblepus collected in the upper Madre de Dios
River. A) Astroblepus sp.2 collected on Américo stream (21Q), B) Astroblepus sp.1 collected on
Unión River (20R), C) Reddish specimen of Astroblepus sp.1 collected on Unión River (20R), D)
Astroblepus sp.1 collected on San Pedro River (19R), E) Astroblepus mancoi collected on San Pedro
River (19R), F) Astroblepus sp.2 collected on San Pedro River (19R), G) Astroblepus sp.1 collected on
Quitacalzon stream (17Q), H) Astroblepus aff. longifilis collected on Kosñipata River (16R), I) Astro-
blepus mancoi collected on Queros River (13R), and J) Astroblepus aff. trifasciatus collected on
Salvación River (12R).
Besides the restrictions for choosing samplings sites, fish resistance to electrofishing
was significant. This resistance was favored by low water conductivity and temperature,
high velocities, shelter’s abundance or low visibility [52]. Furthermore, capture efficiency
depended on the mobility of species: little benthic fish were collected easily, in contrast to
bigger well-swimmer species that escaped the electrofishers range. However, according
to other authors [52,53] electrofishing is the best sampling method when your objectives
are to estimate and quantify freshwater fish populations in streams and wadable rivers
and to correlate these abundances with environmental features, habitat characteristics,Preprints (www.preprints.org) | NOT PEER-REVIEWED | Posted: 9 February 2021
13 of 20
hydrochemical parameters or other ecological measures. Besides, although electrofishing
surveys have been widely achieved on the world, they have been scarce in remote places
like the Alto Madre de Dios Basin due to the more complex logistics.
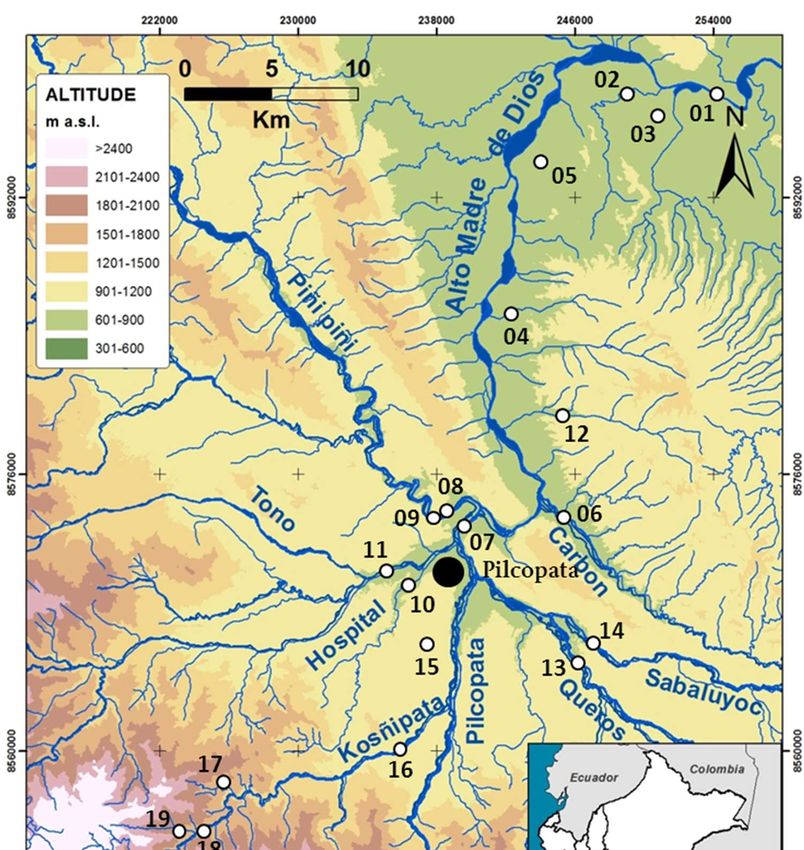
Figure 6. Elevational ranges and trophic specializations of fish species occurring at elevations >
400 m a.s.l. in tributary and main-channel sites within the Alto Madre de Dios watershed, south-
eastern Peru.
If we match our results with the survey carried out with seine nets by Araújo-Flores
in 2013 [48] we find remarkable differences. Comparing the total 44 spp. reported by
Araújo-Flores [48] with our 78 spp. only 17 of them were captured by both studies. Nev-
ertheless, survey of Araújo-Flores focused on two rivers and its tributaries (Pilcopata and
Piñi-Piñi Rivers), distributing ten sampling sites in a smaller area with a limited altitudinal
range (500-600 m a.s.l.). If we compare our data for the three sites coinciding with the
survey of Araújo-Flores (sites 7, 8 and 9), although our sampling effort was lower (3 vs 10
sites) and our captured diversity smaller (26 vs 44 spp.), we collected 15 spp. missing in
the survey of Araújo-Flores [48]. Therefore, although electrofishing is not as effective in
tropical streams as it is for temperate streams, it may be more effective for capturing some
species that seem to be underestimated by other techniques. Consequently, as we focused
on understudied small rivers and streams, catching poorly known small fish, using an
uncommon technique for tropical freshwaters, our study presents new and relevant taxo-
nomic and ecological information, providing data for some fish never captured before by
previous surveys in the area.
Concerning the diversity indices, a gradual increase in species richness and diversity
is expected along longitudinal gradients in lotic systems, associated with changes in re-
source availability, channel morphology, flow regime and substrate type [54,55]. Addition
of species is usually related to an increase of habitats motivated for the structural diversi-
fication of the environment downstream [56]. Our study confirms this pattern (Fig. 2),Preprints (www.preprints.org) | NOT PEER-REVIEWED | Posted: 9 February 2021
14 of 20
with the only exception of one sampling point 15, that does not fit the trend due to its low
diversity values, explained by its peculiar features as seen later.
All the studied environmental variables were correspondent with the values re-
ported by other works for natural and unaltered streams of this territory [7,34,57]. Quality
indices of riparian and fluvial habitat (QBR and QHEI) got very high scores in all the sam-
pling points, highlighting the good environmental quality, with some remarkable excep-
tions (Table 1). Riparian forest (and adjacent jungle) on the right bank of the sampling
point 13, in the Queros River, was inexistent due to deforestation for extensive cattle rais-
ing.
Besides, sampling point 15, located at 622 m a.s.l., showed significant differences both
in environmental and diversity features, as already mentioned. This site belongs to a spe-
cial type of aquatic ecosystem of Amazon forest known as aguajal. They are back swamp
forests, defined as forest on low-lying areas outside of streams courses, only connected to
them during high flood season. They are usually dominated by palms (Mauritia flexuosa),
although other tree species like figs (Ficus spp.) can be abundant as well [58]. They also
tend to be clear and acidic, in contrast to the higher turbidity and circumneutral pH of the
streams around [59,60]. This aguajal was confined by extensive cattle pastures surround-
ing it and was used as drinking reservoir for cattle, showing a remarkable eutrophication.
Sampling point 15 presented the described characteristics and showed low habitat quality
indices (Table 1) and low diversity of fishes (Fig. 2), with only three extant species:
Moenkhausia oligolepis (70 specimens), Crenicichla semicincta (three specimens) and Hoplias
malabaricus (one specimen). Because of its special and no-comparable characteristics, this
peculiar sampling point has been excluded for the general comparative analysis. Alt-
hough the importance of the aguajales has been widely recognized because of their ecolog-
ical and social relevance [61,62], no fish species records are available on the literature. Our
fish and ecological data throw some light on these poorly studied freshwater habitats.
When analyzing richness, diversity and dominance in relation with position from
headwaters-downstream indicated by elevation, distance to mouth and slope, results
were solid and similar for the three variables (Fig. 2). The Canonical Correspondence
Analyses through the marginal effect values (λA) highlighted principal role of elevation
(0.59) or slope (0.44) for explaining fish distribution along the basin (Table 3). The resulting
graphics were also analogous when using both variables (Fig 3). Elevation and distance
to mouth are widely used for multivariate analysis [63,64]. Nevertheless, they don’t give
environmental information, they are geographical variables and indicate spatial position.
Although they show strong correlation with ecologic changes, their use for ecological
analysis together with environmental variables may be problematic. Instead, slope is a
purely environmental variable that measures a geophysical characteristic of the site. Fur-
thermore, it is strongly related to position along the basin but is independent from other
variables, something that avoids “noise” on multivariate analyses. After validating its ro-
bustness for explaining fish distribution as well as elevation, why we recommend the use
of slope as alternative variable to elevation or distances to mouth/source.
Fish community composition along the basin presented two distinct groups with a
clear cut-off point occurring at 700 m a.s.l as indicated by the ANOSIM, separating moun-
tainous fish from piedmont communities. The boundary between both zones is marked
by geomorphological changes on the basin, when it shifts from the steep mountainous
streams flowing through narrow valleys, to flat and wide floodplains where river chan-
nels widen. As pointed out by SIMPER procedure Astroblepus and Trichomycterus are the
most distinctive species from the mountainous streams, while Knodus was the most im-
portant species from lowlands explaining the variation in community composition (Table
2).
Fish abundance and distribution in response to environmental variables was repre-
sented using the CCA analysis and showed similar results using slope or elevation (Fig.
3). The observed distribution of species along the longitudinal gradient of the basin was
comparable to other fish assemblages found in rivers with similar characteristics inPreprints (www.preprints.org) | NOT PEER-REVIEWED | Posted: 9 February 2021
15 of 20
adjacent areas [14,34,57]. This biotic zonation corresponds to discontinuities in river geo-
morphology or abiotic conditions, and are usually related to smooth transitions of abiotic
factors contributing to nested patterns of assemblage composition along the altitudinal
gradient [65]. The graph highlights this zonation, distributing headwater sites and their
fish assemblages on the right of the diagram, related to fast running waters, steep slope,
boulders and low water temperatures, opposed to middle and lowland streams on the left
of the graph related to higher water temperatures, wider streams, low velocities, higher
conductivity and fine substrates.
Genera Astroblepus and Trichomycterus co-occur in high reaches, being the unique
species present on the sites above 1400 m a.s.l. These genera are adapted to headwaters,
related to rocky substrates and cold, clean and well oxygenated water (Fig. 3). They are
benthonic species without scales and a powerful sucker mouth or opercular odontodes
[66]. Nevertheless, they occasionally occur in lower areas, although their distribution is
usually limited to elevations greater than 400 m.a.s.l. (Lujan et al., 2013). Bryconamericus,
a rheophile genus, is the next genus joining the headwater assemblage at 1400 m a.s.l. (Fig.
6). They prefer areas of moderate to strong current and present even in the torrential flows,
occupying intermediate places between mountain upstream and jungle downstream
[34,67]. We also found some Chaetostoma and Ancistrus fishes at these reaches, although
they appeared closely related with lower middle section streams (Fig. 3).
We found most of the species related to these middle-low reaches, distributed along
the left area of the CCA (Fig. 3): habitats with fine substrata, very slow water velocities,
mild slope and more conductivity, related with Serrapinus, Prodontocharax, Astyanan-
cistrus, Astyanas, Knodus and Moenkhausia, on the top-left area of the diagram (Fig. 3b) [68];
other lotic sites presenting the widest habitats with highest temperature and higher pH,
were distributed on the bottom left of the diagram, related with Aphyocharax and Hemi-
brycon genera characids and loricarids like Rineloricaria, Chaetostoma and Ancistrus
[55,67,69].
We also observed a remarkable zonation related to trophic niches (Fig. 6). Headwa-
ters were dominated exclusively by invertivorous Astroblepus (Fig. 5) and Trichomycterus
(Fig. 4) fishes due to the scarcity of other food resources in these clean waters [13,66]. Alt-
hough the first herbivore-detritivore Chaetostoma and Ancistrus individuals were found
starting at 1400 m a.s.l., they got more abundant below 1000 m a.s.l., once the river carries
enough organic matter coming from the surrounding forest offering a new trophic niche
[13,57]. The first piscivorous species, Hoplias malabaricus and Crenicichla semicincta, were
distributed around 600 m a.s.l. and below, first found at site 15, the aguajal, where the
Moenkhausia oligolepis community was very abundant providing enough biomass to feed
the predators. This distribution pattern perfectly fits with the observations of Lujan et al.
[7].
Although our results highlight the good conservation status of the Alto Madre de
Dios Basin, the territory endures severe threats: logging [26,35], gold mining [70], climate
change [19,27], fossil fuel extraction [71], and hydropower projects [24,27]. These threats
over the Alto Madre de Dios Basin and the predicted changes for river ecosystems high-
light the necessity of acting as soon as possible. The development and implementation of
management plans is crucial for anticipating and mitigating future impacts. Nevertheless,
the principal threat for this peculiar area, with high endemic biodiversity and very good
conservation status, is the lack of knowledge regarding its fauna and flora. Studies of the
fish fauna are critical to document the primary characteristics of the original communities
and thereby contribute to the delimitation of appropriate conservation areas and/or to
recovery strategies for degraded streams [9]. Therefore, Peruvian freshwater fish faunal
inventory (including the Alto Madre de Dios River Basin) is a priority [9,49]. There are
many remote areas, with poor accessibility, where knowledge of freshwater fish fauna is
negligible and for most fish taxa basic taxonomic work is still required, not only for this
area, but for all the Amazon and adjacent basins [49]. Besides, there is even less infor-
mation, in some cases null, on the ecology of many species. This knowledge gap highlightsPreprints (www.preprints.org) | NOT PEER-REVIEWED | Posted: 9 February 2021
16 of 20
the necessity of basic taxonomic works and the creation of field guides providing new
research projects an essential tool [72]. Fortunately, there are some remarkable guides for
the Madre de Dios Basin [60,69] and adjacent areas [73,74] that offer inestimable material
about freshwater fishes in this region, although, the information in these guides is incom-
plete for many species. Scientists working in these areas have felt this lack of knowledge
as an impediment that reduces their possibility to study community-level trends or events
[4,75].
Concerning this taxonomic constraint, freshwater fishes of high headwaters demand
special attention. All of them are Andean species and live on high altitudes, areas where
human settlements and their subsequent impact has a longer and more intense presence,
compared with Amazonian streams. We found five different species of Astroblepus (Fig.
5), two of them undetermined, five species of Bryconamericus, and six species of Tricho-
mycterus all undetermined (Fig. 4). Astroblepids and trichomycterids are typically re-
stricted in their geographical distribution and endemic to single or adjacent river systems
of the Andes, and its taxonomy is an especially confusing and in constant revision [76–
78]. Advances on the taxonomic and ecological knowledge of these high mountain species,
related to tropical montane cloud forests, are mandatory for the design of conservation
and management plans in the area.
According to Ortega et al. [49], there is not an official national Peruvian red list of
freshwater fishes because of this lack of knowledge (despite several attempts and pro-
posals). Although conservation lists have their limitations and critics, they represent an
essential tool required for protecting biodiversity [79]. Therefore, it is imperative to con-
tinue with the study of freshwater fish species in Peru with the aim of improving man-
agement actions and conservation plans.
In the light of this scenario where no Andean-Amazon Basin will remain untouched,
the Alto Madre de Dios River Basin still preserves healthy ecosystems, with mild human
impacts affecting some stretches, but showing a good environmental quality overall.
Therefore, this makes the basin a perfect candidate for being preserved and considered as
a reference basin for these seriously endangered ecosystems.
Author Contributions: Conceptualization, R.M. and I.T.; methodology, R.M., I.T. and A.R.M.; for-
mal analysis, A.R.M and I.T.; investigation, R.M., I.T., A.P.C. and J.A.F.; data curation, I.T. and R.M.;
writing—original draft preparation, I.T. and R.M.; writing—review and editing, R.M, I.T., A.P.C.,
A.R.M. J.A.F and H.O.; visualization, J.A.F. and I.T.; supervision, A.P.C. and R.M.; project admin-
istration, R.M. and A.P.C.; funding acquisition, R.M. All authors have read and agreed to the pub-
lished version of the manuscript.
Funding: This research was funded by Government of Spain, Ministry of Foreign Affairs and Co-
operation, AECID (Code A1/040396/11) and Asociación de Amigos Universidad de Navarra.
Acknowledgments: Invaluable field assistance and friendship was provided by Américo Quispe.
We are grateful for the unreserved cooperation of Hugo Pepper, who provided logistic and data
support. Robin Van Loon helps us on the English revision. We thank the members of the Depart-
ment of Ichthyology of MUSM for their help and assistance. The Asociación para la Conservación
de la Cuenca Amazónica (ACCA), kindly provided valuable information, collaboration and lodging
during our fieldwork. We also wish to thank Ronald Mendoza for helping preparing the map figure.
Conflicts of Interest: The authors declare no conflict of interest. The funders had no role in the
design of the study; in the collection, analyses, or interpretation of data; in the writing of the manu-
script, or in the decision to publish the results.
References
1. Gozlan, R.E.; Britton, J.R.; Cowx, I.G.; Copp, G.H. Current Knowledge on Non-Native Freshwater Fish Introductions. Journal
of Fish Biology 2010, 76, 751–786, doi:10.1111/j.1095-8649.2010.02566.x.
2. Ricciardi, A.; Rasmussen, J.B. Extinction Rates of North American Freshwater Fauna. Conservation Biology 1999, 13, 1220–1222,
doi:10.1046/j.1523-1739.1999.98380.x.Preprints (www.preprints.org) | NOT PEER-REVIEWED | Posted: 9 February 2021
17 of 20
3. Dudgeon, D. Multiple Threats Imperil Freshwater Biodiversity in the Anthropocene. Current Biology 2019, 29, R960–R967,
doi:10.1016/j.cub.2019.08.002.
4. Miqueleiz, I.; Böhm, M.; Ariño, A.H.; Miranda, R. Assessment Gaps and Biases in Knowledge of Conservation Status of Fishes.
Aquatic Conservation: Marine and Freshwater Ecosystems 2020, 30, 225–236, doi:10.1002/aqc.3282.
5. Allan, J.D.; Flecker, A.S. Biodiversity Conservation in Running Waters. BioScience 1993, 43, 32, doi:10.2307/1312104.
6. Oberdorff, T.; Dias, M.S.; Jézéquel, C.; Albert, J.S.; Arantes, C.C.; Bigorne, R.; Carvajal-Vallejos, F.M.; de Wever, A.; Frederico,
R.G.; Hidalgo, M.; et al. Unexpected Fish Diversity Gradients in the Amazon Basin. Science Advances 2019, 5, eaav8681,
doi:10.1126/sciadv.aav8681.
7. Lujan, N.K.; Roach, K.A.; Jacobsen, D.; Winemiller, K.O.; Vargas, V.M.; Ching, V.R.; Maestre, J.A. Aquatic Community
Structure across an Andes-to-Amazon Fluvial Gradient. Journal of Biogeography 2013, 40, 1715–1728, doi:10.1111/jbi.12131.
8. Bax, V.; Francesconi, W. Conservation Gaps and Priorities in the Tropical Andes Biodiversity Hotspot: Implications for the
Expansion of Protected Areas. Journal of Environmental Management 2019, 232, 387–396, doi:10.1016/j.jenvman.2018.11.086.
9. Tognelli, M.F.; Anderson, E.P.; Jiménez-Segura, L.F.; Chuctaya, J.; Chocano, L.; Maldonado-Ocampo, J.A.; Mesa-Salazar, L.;
Mojica, J.I.; Carvajal-Vallejos, F.M.; Correa, V.; et al. Assessing Conservation Priorities of Endemic Freshwater Fishes in the
Tropical Andes Region. Aquatic Conservation: Marine and Freshwater Ecosystems 2019, 29, 1123–1132, doi:10.1002/aqc.2971.
10. Jézéquel, C.; Tedesco, P.A.; Bigorne, R.; Maldonado-Ocampo, J.A.; Ortega, H.; Hidalgo, M.; Martens, K.; Torrente-Vilara, G.;
Zuanon, J.; Acosta, A.; et al. A Database of Freshwater Fish Species of the Amazon Basin. Scientific Data 2020, 7, 96,
doi:10.1038/s41597-020-0436-4.
11. Tognelli, M.F.; Lasso, C.A.; Bota-Sierra, C.A.; Jiménez-Segura, L.F.; Cox, N.A. Estado De Conservación Y Distribución De La
Biodiversidad De Agua Dulce En Los Andes Tropicales; 2016; ISBN 978-2-8317-1791-3.
12. Ortega, H.; Hidalgo, M.; Trevejo, G.; Correa, E.; Cortijo, A.M.; Meza, V.; Espino, J. Lista Anotada de Los Peces de Aguas
Continentales Del Perú; 2012; ISBN 9786124605321.
13. Benejam, L.; Tobes, I.; Brucet, S.; Miranda, R. Size Spectra and Other Size-Related Variables of River Fish Communities:
Systematic Changes along the Altitudinal Gradient on Pristine Andean Streams. Ecological Indicators 2018, 90, 366–378,
doi:10.1016/j.ecolind.2018.03.012.
14. Carvajal-Quintero, J.D.; Escobar, F.; Alvarado, F.; Villa-Navarro, F.A.; Jaramillo-Villa, Ú.; Maldonado-Ocampo, J.A. Variation
in Freshwater Fish Assemblages along a Regional Elevation Gradient in the Northern Andes, Colombia. Ecology and Evolution
2015, 5, 2608–2620, doi:10.1002/ece3.1539.
15. Pitman, N.C.A.; Salas, K.; Loyola Azáldegui, M. del C.; Vigo, G.; Lutz, D.A. Historia e Impacto de La Literatura Científica Del
Departamento de Madre de Dios, Perú. Revista Peruana de Biología 2008, 15, 15–22, doi:10.15381/rpb.v15i2.1696.
16. Albert, J.S.; Tagliacollo, V.A.; Dagosta, F. Diversification of Neotropical Freshwater Fishes. Annual Review of Ecology, Evolution,
and Systematics 2020, 51, doi:10.1146/annurev-ecolsys-011620-031032.
17. Townsend-Small, A.; McClain, M.E.; Hall, B.; Noguera, J.L.; Llerena, C.A.; Brandes, J.A. Suspended Sediments and Organic
Matter in Mountain Headwaters of the Amazon River: Results from a 1-Year Time Series Study in the Central Peruvian
Andes. Geochimica et Cosmochimica Acta 2008, 72, 732–740, doi:10.1016/j.gca.2007.11.020.
18. Laraque, A.; Bernal, C.; Bourrel, L.; Darrozes, J.; Christophoul, F.; Armijos, E.; Fraizy, P.; Pombosa, R.; Guyot, J.L. Sediment
Budget of the Napo River, Amazon Basin, Ecuador and Peru. Hydrological Processes 2009, 23, 3509–3524, doi:10.1002/hyp.7463.
19. Malhi, Y.; Roberts, J.T.; Betts, R.A.; Killeen, T.J.; Li, W.; Nobre, C.A. Climate Change, Deforestation, and the Fate of the
Amazon. Science 2008, 319, 169–172, doi:10.1126/science.1146961.
20. Aldrich, S.; Walker, R.; Simmons, C.; Caldas, M.; Perz, S. Contentious Land Change in the Amazon’s Arc of Deforestation.
Annals of the Association of American Geographers 2012, 102, 103–128, doi:10.1080/00045608.2011.620501.
21. S. Garcia, A.; Vívian, V.M.; Rizzo, R.; West, P.; Gerber, J.S.; Engstrom, P.M.; Maria, M.V. Assessing Land Use/Cover Dynamics
and Exploring Drivers in the Amazon’s Arc of Deforestation through a Hierarchical, Multi-Scale and Multi-Temporal
Classification Approach. Remote Sensing Applications: Society and Environment 2019, 15, 100233, doi:10.1016/j.rsase.2019.05.002.
22. Brooks, T.M.; Mittermeier, R.A.; Mittermeier, C.G.; da Fonseca, G.A.B.; Rylands, A.B.; Konstant, W.R.; Flick, P.; Pilgrim, J.D.;
Oldfield, S.; Magin, G.; et al. Habitat Loss and Extinction in the Hotspots of Biodiversity. Conservation Biology 2002, 16, 909–
923, doi:10.1046/j.1523-1739.2002.00530.x.
23. Restrepo, J.D.; Kettner, A.J.; Syvitski, J.P.M. Recent Deforestation Causes Rapid Increase in River Sediment Load in the
Colombian Andes. Anthropocene 2015, 10, 13–28, doi:10.1016/j.ancene.2015.09.001.
24. Almeida, R.M.; Shi, Q.; Gomes-Selman, J.M.; Wu, X.; Xue, Y.; Angarita, H.; Barros, N.; Forsberg, B.R.; García-Villacorta, R.;
Hamilton, S.K.; et al. Reducing Greenhouse Gas Emissions of Amazon Hydropower with Strategic Dam Planning. Nature
Communications 2019, 10, 4281, doi:10.1038/s41467-019-12179-5.
25. Anderson, E.P.; Jenkins, C.N.; Heilpern, S.; Maldonado-Ocampo, J.A.; Carvajal-Vallejos, F.M.; Encalada, A.C.; Rivadeneira,
J.F.; Hidalgo, M.; Cañas, C.M.; Ortega, H.; et al. Fragmentation of Andes-to-Amazon Connectivity by Hydropower Dams.
Science Advances 2018, 4, eaao1642, doi:10.1126/sciadv.aao1642.
26. Yu, D.W.; Hendrickson, T.; Castillo, A. Ecotourism and Conservation in Amazonian Peru: Short-Term and Long-Term
Challenges. Environmental Conservation 1997, 24, 130–138.Preprints (www.preprints.org) | NOT PEER-REVIEWED | Posted: 9 February 2021
18 of 20
27. Encalada, A.C.; Flecker, A.S.; Poff, N.L.; Suárez, E.; Herrera-R, G.A.; Ríos-Touma, B.; Jumani, S.; Larson, E.I.; Anderson, E.P.
A Global Perspective on Tropical Montane Rivers. Science 2019, 365, 1124–1129, doi:10.1126/science.aax1682.
28. Anderson, E.P.; Maldonado-Ocampo, J.A. A Regional Perspective on the Diversity and Conservation of Tropical Andean
Fishes. Conservation Biology 2011, 25, 30–39, doi:10.1111/j.1523-1739.2010.01568.x.
29. Gentry, A. Changes in Plant Community Diversity and Floristic Composition on Environmental and Geographical Gradients.
Annals of the Missouri Botanical Garden 1988, 75, 1–34.
30. McCoy, E.D. The Distribution of Insects along Elevational Gradients. Oikos 1990, 58, 313, doi:10.2307/3545222.
31. Fu, C.; Hua, X.; Li, J.; Chang, Z.; Pu, Z.; Chen, J. Elevational Patterns of Frog Species Richness and Endemic Richness in the
Hengduan Mountains, China: Geometric Constraints, Area and Climate Effects. Ecography 2006, 29, 919–927,
doi:10.1111/j.2006.0906-7590.04802.x.
32. Montaño-Centellas, F.A.; McCain, C.; Loiselle, B.A. Using Functional and Phylogenetic Diversity to Infer Avian Community
Assembly along Elevational Gradients. Global Ecology and Biogeography 2020, 29, 232–245, doi:10.1111/geb.13021.
33. Lessmann, J.; Guayasamin, J.M.; Casner, K.L.; Flecker, A.S.; Funk, W.C.; Ghalambor, C.K.; Gill, B.A.; Jácome-Negrete, I.;
Kondratieff, B.C.; Poff, L.N.; et al. Freshwater Vertebrate and Invertebrate Diversity Patterns in an Andean-Amazon Basin:
Implications for Conservation Efforts. Neotropical Biodiversity 2016, 2, 99–114, doi:10.1080/23766808.2016.1222189.
34. Jaramillo-Villa, Ú.; Maldonado-Ocampo, J.A.; Escobar, F. Altitudinal Variation in Fish Assemblage Diversity in Streams of
the Central Andes of Colombia. Journal of Fish Biology 2010, 76, 2401–17, doi:10.1111/j.1095-8649.2010.02629.x.
35. Salvador, S.; Clavero, M.; Leite Pitman, R. Large Mammal Species Richness and Habitat Use in an Upper Amazonian Forest
Used for Ecotourism. Mammalian Biology - Zeitschrift für Säugetierkunde 2011, 76, 115–123, doi:10.1016/j.mambio.2010.04.007.
36. Thieme, M.L.; Lehner, B.; Abell, R.; Hamilton, S.K.; Kellndorfer, J.; Powell, G.; Riveros, J.C. Freshwater Conservation Planning
in Data-Poor Areas: An Example from a Remote Amazonian Basin (Madre de Dios River, Peru and Bolivia). Biological
Conservation 2007, 135, 484–501, doi:10.1016/j.biocon.2006.10.054.
37. Fricke, R.; Eschmeyer, W.N.; van der Laan, R. Eschmeyer’s Catalog of Fishes: Genera, Species, References Available online:
http://researcharchive.calacademy.org/research/ichthyology/catalog/fishcatmain.asp (accessed on 5 May 2020).
38. Radinger, J.; Britton, J.R.; Carlson, S.M.; Magurran, A.E.; Alcaraz-Hernández, J.D.; Almodóvar, A.; Benejam, L.; Fernández-
Delgado, C.; Nicola, G.G.; Oliva-Paterna, F.J.; et al. Effective Monitoring of Freshwater Fish. Fish and Fisheries 2019, faf.12373,
doi:10.1111/faf.12373.
39. Godinho, F.N.; Ferreira, M.T.; Santos, J.M. Variation in Fish Community Composition along an Iberian River Basin from Low
to High Discharge: Relative Contributions of Environmental and Temporal Variables. Ecology of Freshwater Fish 2000, 9, 22–
29, doi:10.1034/j.1600-0633.2000.90104.x.
40. Clarke, K.R. Non-parametric Multivariate Analyses of Changes in Community Structure. Australian Journal of Ecology 1993,
18, 117–143, doi:10.1111/j.1442-9993.1993.tb00438.x.
41. Bray, J.R.; Curtis, J.T. An Ordination of the Upland Forest Communities of Southern Wisconsin. Ecological Monographs 1957,
27, 325–349, doi:10.2307/1942268.
42. Lepš, J.; Šmilauer, P. Multivariate Analysis of Ecological Data Using CANOCO; Cambridge University Press, 2003;
43. Braak, C.J.F.F.; Verdonschot, P.F.M.M. Canonical Correspondence Analysis and Related Multivariate Methods in Aquatic
Ecology. Aquatic Sciences 1995, 57, 255–289, doi:10.1007/BF00877430.
44. ter Braak J. F., C.; Šmilauer, P. Canoco Reference Manual and CanoDraw for Windows User´s Guide. 2002, 500.
45. Blanchet, F.G.; Legendre, P.; Borcard, D. Forward Selection of Explanatory Variables. Ecology 2008, 89, 2623–2632,
doi:10.1890/07-0986.1.
46. R Development Core Team R: A Language and Environment for Statistical Computing Available online: https://www.r-
project.org/.
47. Oksanen, J.; Kindt, R.; O’, B.; Maintainer, H. The Vegan Package Title Community Ecology Package; 2005;
48. Araujo Flores, J.M. Caracterización de La Biodiversidad Acuática En La Cuenca Andino-Amazónica de Madre de Dios - Perú,
2016.
49. Ortega, H.; Hidalgo, M.; Trevejo, G.; Correa, E.; Cortijo, A.M.; Meza, V.; Espino, J. Lista Anotada de Los Peces de Aguas
Continentales Del Perú; 2012; ISBN 9786124605321.
50. Allard, L.; Grenouillet, G.; Khazraie, K.; Tudesque, L.; Vigouroux, R.; Brosse, S. Electrofishing Efficiency in Low Conductivity
Neotropical Streams: Towards a Non-Destructive Fish Sampling Method. Fisheries Management and Ecology 2014, 21, 234–243,
doi:10.1111/fme.12071.
51. Mendonça, F.P.; Magnusson, W.E.; Zuanon, J. Relationships between Habitat Characteristics and Fish Assemblages in Small
Streams of Central Amazonia. Copeia 2005, 2005, 751–764, doi:10.1643/0045-8511(2005)005[0751:RBHCAF]2.0.CO;2.
52. Zalewski, M. The Estimate of Fish Density and Biomass in Rivers on the Basis of Relationships between Specimen Size and
Efficiency of Electrofishing. Fisheries Research 1985, 3, 147–155, doi:10.1016/0165-7836(85)90015-3.
53. Meador, M.R.; McIntyre, J.P.; Pollock, K.H. Assessing the Efficacy of Single-Pass Backpack Electrofishing to Characterize Fish
Community Structure. Transactions of the American Fisheries Society 2003, 132, 39–46, doi:10.1577/1548-
8659(2003)1322.0.CO;2.You can also read