Developing and characterization of catfish skin hydrolysates including antioxidant and antimicrobial properties
←
→
Page content transcription
If your browser does not render page correctly, please read the page content below
Louisiana State University
LSU Digital Commons
LSU Master's Theses                                                                                                              Graduate School

2016

Developing and characterization of catfish skin
hydrolysates including antioxidant and
antimicrobial properties
Cesar Augusto Galindo Perez
Louisiana State University and Agricultural and Mechanical College, cgalindo.yh@gmail.com

Follow this and additional works at: https://digitalcommons.lsu.edu/gradschool_theses
     Part of the Life Sciences Commons

Recommended Citation
Galindo Perez, Cesar Augusto, "Developing and characterization of catfish skin hydrolysates including antioxidant and antimicrobial
properties" (2016). LSU Master's Theses. 4529.
https://digitalcommons.lsu.edu/gradschool_theses/4529

This Thesis is brought to you for free and open access by the Graduate School at LSU Digital Commons. It has been accepted for inclusion in LSU
Master's Theses by an authorized graduate school editor of LSU Digital Commons. For more information, please contact gradetd@lsu.edu.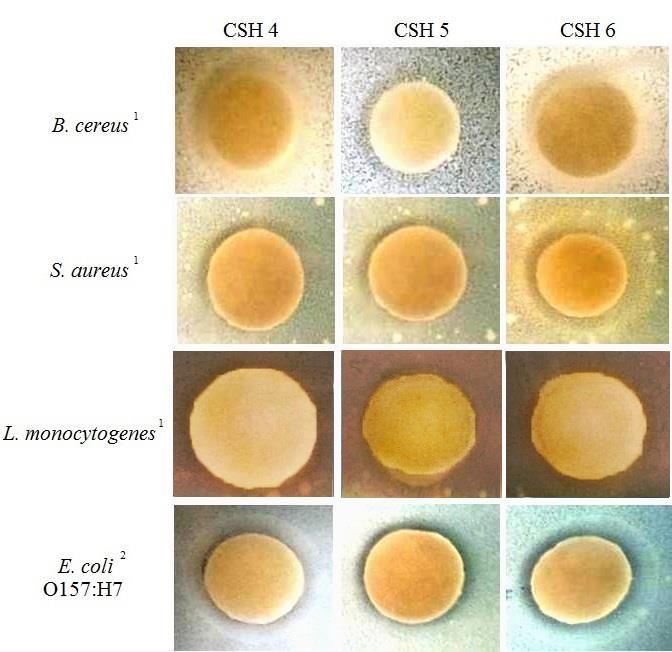
DEVELOPING AND CHARACTERIZATION OF CATFISH SKIN HYDROLYSATES
     INCLUDING ANTIOXIDANT AND ANTIMICROBIAL PROPERTIES

                               A Thesis

                Submitted to the Graduate Faculty of the
                    Louisiana State University and
                 Agricultural and Mechanical College
                      in partial fulfillment of the
                    requirements for the degree of
                           Master of Science

                                  In

               The School of Nutrition and Food Sciences

                                  By
                      Cesar Augusto Galindo Perez
               B.S., Zamorano University, Honduras, 2008
                            December 2016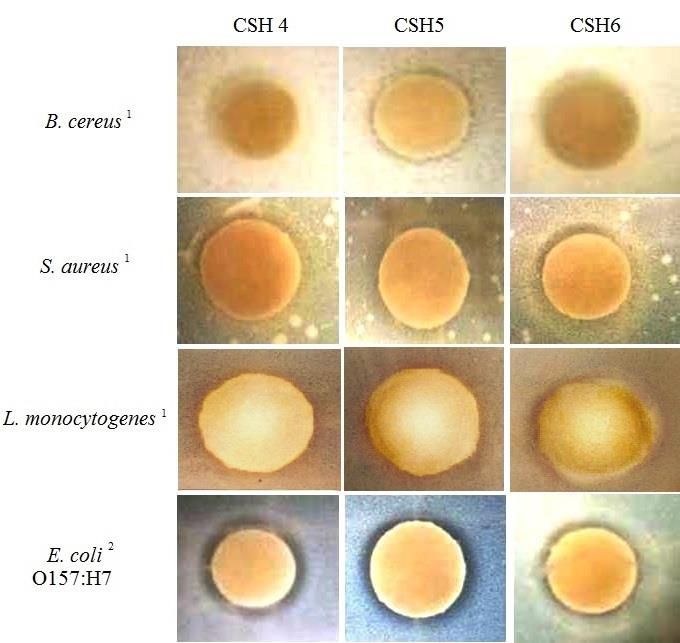
ACKNOWLEDGEMENTS

I want to thank God, because he put me at the correct place and time for showing me that without

Him, I’m able to do nothing. Thanks to my major advisor, Dr. Subramaniam Sathivel, for all his

guidance, support, friendship, advice, economic support, and patience. He was one of the key

factors for bringing me to an upper professional level. I want to extend my thanks to my

committee members: Dr. Peter Bechtel, Dr. Joan King, and Dr. David Bankston for all their help,

advice, and positive feedback for my professional improvement. Thanks to the USDA-ARS for

providing the necessary funding for the development of this project. Special thanks to the

scientists from the USDA-ARS: Dr. John Bland, Dr. Casey Grimm, and Mr. Steven Lloyd for all

their time, scientific knowledge, and effort put in for the peptides’ analysis of my samples.

Without their help it would not have been possible. Thanks to Dr. Marlene Janes, Ms. Katheryn

Parraga, Ms. Marta Escoto, and Mr. Jose Brandao for all their help and guidance for the

antimicrobial analysis. Thanks to Ms. Tamara Chouljenko for her friendship, support, and help

with the SDS-PAGE analysis, and for keeping H. D. Wilson Laboratories in order and excellent

conditions. To my lab-mates: Dr. Kevin Mis, Dr. Arranee Chotiko, Vondel Reyes, Luis Alfaro,

Emmanuel Kyereh, Alex Chouljenko, Ronson Scott, Chen Liu, Bennett Dzandu, Vashti

Campbell, and Franklin Bonilla for all their friendship, help, and support. Thanks to the

Zamorano Agricultural Society (ZAS) for all their support and friendship. Special thanks to my

dear wife, Yelby Hernandez, for being my motivation, inspiration, and support all this time. This

is an achievement of both. To my family in Guatemala and Nicaragua, thanks for all your

support and prayers. And thanks to all those people that work every day at LSU for providing us

a safe, clean, and comfortable environment to develop our activities.

                                                ii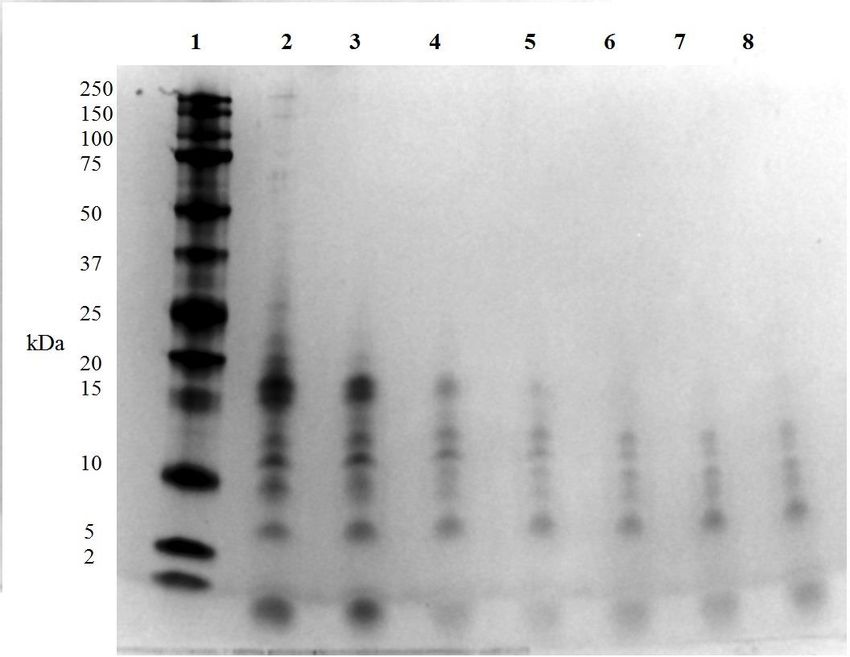
TABLE OF CONTENTS

ACKNOWLEDGEMENTS ............................................................................................................ ii
LIST OF TABLES .......................................................................................................................... v
LIST OF FIGURES ....................................................................................................................... vi
ABSTRACT .................................................................................................................................. vii
CHAPTER 1. INTRODUCTION ................................................................................................... 1
CHAPTER 2. LITERATURE REVIEW ........................................................................................ 3
   2.1 Catfish production and processing ........................................................................................ 3
   2.2 Catfish skin............................................................................................................................ 3
   2.3 Protein hydrolysis .................................................................................................................. 4
   2.4 Bioactive peptides ................................................................................................................. 6
   2.5 Hydrolysates as antioxidants ................................................................................................. 7
   2.6 Hydrolysates as Emulsifiers .................................................................................................. 9
   2.7 Hydrolysates and their oil holding capacity ........................................................................ 10
   2.8 Hydrolysates as antimicrobials............................................................................................ 11
CHAPTER 3. MATERIALS AND METHODS. ......................................................................... 14
   3.1 Materials .............................................................................................................................. 14
   3.2 Methods ............................................................................................................................... 14
      3.2.1 Hydrolysates production ............................................................................................... 14
      3.2.2 Degree of hydrolysis (DH), color, and pH of fresh CSH ............................................. 15
      3.2.3 Proximate composition ................................................................................................. 17
      3.2.4 Free Radical Scavenging activity (FRSA).................................................................... 18
      3.2.5 Emulsion stability (ES) ................................................................................................. 19
      3.2.6 Micro-structure of the stable phase .............................................................................. 20
      3.2.7 Oil holding capacity (OHC) ......................................................................................... 21
      3.2.8 Sodium dodecyl sulfate polyacrylamide gel electrophoresis (SDS-PAGE) ................. 21
      3.2.9 Disk inhibition antimicrobial assay .............................................................................. 22
      3.2.10 Peptide mass profile of CSH ...................................................................................... 24
      3.2.11 Peptide sequence and charge ...................................................................................... 25
      3.2.12 Statistical analysis....................................................................................................... 26
CHAPTER 4. RESULTS AND DISCUSSION ............................................................................ 26

                                                                       iii
4.1 DH, pH, and Color of CSH ................................................................................................. 26
4.2 Proximate analysis and color of Freeze-dried CSH ............................................................ 28
4.3 Free-Radical Scavenging Activity (FRSA) ......................................................................... 31
4.4 Emulsion stability (ES) and oil holding capacity (OHC).................................................... 34
4.5 Micro-structure of the emulsion’s stable phase................................................................... 36
4.6 SDS-PAGE .......................................................................................................................... 38
4.7 Agar-disk diffusion ............................................................................................................. 39
4.8 Peptides production during hydrolysis ................................................................................ 43
4.9 Peptide molecular weight (MW) distribution, charge profile, and partial sequencing ....... 44
CHAPTER 5. SUMMARY CONCLUSIONS .............................................................................. 45
CHAPTER 6. REFERENCES ...................................................................................................... 47
VITA ............................................................................................................................................. 59
ivLIST OF TABLES
Table 1. Degree of hydrolysis (DH), pH, and color of fresh CSH as a function of time of
hydrolysis with alkaline protease.1 ............................................................................................... 26
Table 2. Proximate composition of freeze-dried catfish skin and proximate composition and
color of freeze-dried CSH as a function of hydrolysis time.1 ...................................................... 30
Table 3. FRSA (mM Teq/L) of different concentrations of CSH as a function of hydrolysis time
(ToH).1.......................................................................................................................................... 32
Table 4. Emulsion stability (ES) and oil holding capacity (OHC) of catfish skin hydrolysates
influenced by the degree of hydrolysis. 1 ..................................................................................... 34
Table 5. Antimicrobial effect of sterilized and non-sterilized CSH obtained at different time of
hydrolysis over gram positive and gram negative bacteria.1 ........................................................ 39
Table 6. Molecular weight (MW) distribution of peptides detected in CSH5.1 ........................... 44
Table 7. Peptides as a function of their net charge in CSH5.1 ...................................................... 45
vLIST OF FIGURES
Fig. 1. Schematic representation of chemical and physical mechanisms of antioxidant peptides to
inhibit oxidative process. (1) Metal chelation; (2) radical scavenging; (3) physical hindrance
(shielding; repulsion). Source: (Nikoo and Benjakul 2015).1 ........................................................ 7
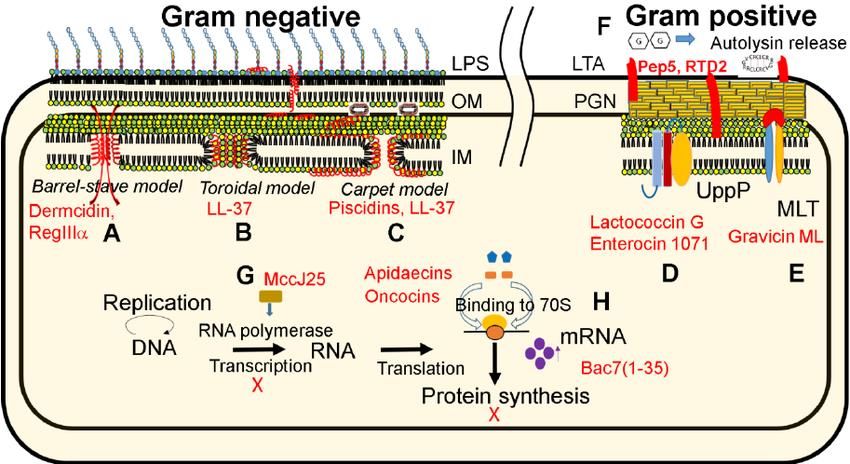
Fig. 2. Mechanism of antimicrobial peptides against gram positive and gram negative bacteria
Source: (Wang and others 2015).1................................................................................................ 12
Fig. 3. Disk inhibition assay for testing the antimicrobial capacity of CSH.1 ............................. 24
Fig. 4. Micro-structure of the stable phase of the emulsions with highest (a) and lowest (b)
emulsion stability obtained when using CSH 6 and CSH 0.5 as emulsifiers respectively. Control
emulsion using Tween ® 20 with no CSH addition (c).1 ............................................................. 37
Fig. 5. SDS-PAGE profile of catfish skin hydrolysates and SDS marker. Where column 1= SDS
marker; column 2 to 8= CSH after 0.5, 1, 2, 3, 4, 5, and 6 h enzymatic hydrolysis respectively.1
....................................................................................................................................................... 38
Fig. 6. Disk inhibition assay of filtered-non-sterilized CSH solutions (250 mg/mL) at 4, 5, and 6
h of hydrolysis as antimicrobials against Gram positive1 and Gram negative2 bacteria.1 ........... 41
Fig. 7. Disk inhibition assay of filtered-sterilized CSH solutions (250 mg/mL) at 4, 5, and 6 h of
hydrolysis as antimicrobials against Gram positive1 and Gram negative2 bacteria.1 ................... 42
Fig. 8. Peak area profile of the 10 peptides with largest area generated during CS hydrolysis.
Numbers in the bars represent the peak area for each peptide. The top gray bar represents the
second set of 10 peptides and the underlined number is the total peptide peak area for the top 20
peptides.1 ...................................................................................................................................... 43
viABSTRACT
Catfish skin (CS) contains considerable amount of protein that may be hydrolyzed enzymatically
to generate hydrolysates (CSH) which may have antioxidant and antimicrobial properties. The
generation of natural compounds with these properties is of special interest to the food industry.
The objective of this study was to develop and characterize CSH including antioxidant and
antimicrobial properties. CSH were produced from different enzymatic reaction periods using
alkaline protease, and their characterization, antioxidant, antimicrobial, and some functional
properties were evaluated. A selected CSH was analyzed for peptide composition and partial
amino acid sequences. The color analysis showed that darker, more yellow, and redder CSH
were generated throughout the time of hydrolysis. CSH at 4, 5, and 6 h of hydrolysis showed
considerable antioxidant activity and antimicrobial properties in-vitro, high emulsion stability,
and low oil holding capacity influenced by the time of hydrolysis. Low-molecular weight
peptides with positive charges were suggested as responsible for the antimicrobial activity. CSH
were developed and characterized. Further research is suggested, especially on identification,
isolation, and synthesis of specific peptides from CSH with both antioxidant and antimicrobial
activity.
viiCHAPTER 1. INTRODUCTION
Catfish is one of the most consumed fish in the United States. According to Hanson and Sites
(2015) the average catfish per capita consumption during the period 2000-2013 in the U.S. was
0.41 kg. At the end of that period, catfish was the 8th most consumed seafood in the country. The
National Marine Fisheries Services (NMFS) reports that in 2013, estimated freshwater U.S.
aquaculture production was 653 million pounds valued at $1.38 billion with catfish leading the
list with 358 million pounds (NMFS 2014). Two years later, 138,000 metric tons (MT) were
processed in U.S. facilities according to the National Agricultural Statistics Service (NASS
2016). The processing of catfish generates considerable amount of by-products from which skin
usually represents 6 % of fish’s alive weight (Yin and others 2010) meaning that approximately
8,300 MT of skin were generated as a by-product. Catfish skin protein content and quality are
similar to edible fish meat (Himaya and Kim 2014) which suggests that products made from
them may be suitable for consumption by humans and thus constitutes an opportunity for
producing valuable products through catfish skin processing.
Protein hydrolysates are mixture of peptides of different sizes produced by protein denaturation
by the action of acids, alkalis, fermentation, or enzymes (Sarmadi and Ismail 2010; Chalamaiah
and others 2012). On a lab scale, enzymatic hydrolysis has been widely reported as capable of
producing protein hydrolysates with functional properties (ex. antioxidant, emulsifying,
antimicrobial) from underutilized fish species (Amarowicz and Shahidi 1997; Klompong and
others 2007; Thiansilakul and others 2007; You and others 2009; Jemil and others 2014) and fish
by-products (Benjakul and Morrissey 1997; Šližytė and others 2005; Sathivel and others 2008;
Yin and others 2010; Ketnawa and others 2016). The findings reported by these authors suggest
1that protein hydrolysates may have the potential of being used as natural food preservatives
which could meet current demand in the food market for “all natural” and “clean label” products.
Food quality degradation may come from enzymatic autolysis, oxidation, and microbial growth
(Ghaly and others 2010). The short shelf life of fresh foods, in addition to the consumer demand
for reduction or complete elimination of chemically synthesized preservatives from foods, have
reactivated the interest for developing natural shelf life extensors (Roller 1995). Catfish skin
hydrolysates may contain peptides with considerable antioxidant and antimicrobial properties;
however, there is a lack of information about the catfish skin hydrolysates produced by the
alkaline protease and the antioxidant and antimicrobial properties of these hydrolysates in in-
vitro conditions.
The objective of this study was to develop and characterize CSH including antioxidant and
antimicrobial properties.
2CHAPTER 2. LITERATURE REVIEW
2.1 Catfish production and processing
Channel catfish (Ictalurus punctatus) is a fresh-water fish whose production and processing
started in Alabama around 1950s, and 40 years later, the production reached more than 200
metric tons only from Mississippi, Alabama, Arkansas, and Louisiana (Smitherman and Dunham
1993). Now, there are more than 69,910 acres of water intended for catfish production, and the
states with the highest number of acres are Alabama, Arkansas, and Mississippi (Hanson and
Sites 2015).
The National Agricultural Statistics Service (NASS) indicates that 2015 live catfish’s sales were
$361 million in the US with Mississippi, Alabama, Arkansas, and Texas accounting for 96 % of
the sales (NASS 2016). The US demand of catfish is covered by both imported and local raised
catfish, and from the latter 36% is commercialized as fresh, and 64% as frozen (NASS 2013).
Catfish processing is intended to produce whole dressed fish (19%), fillet (60%), and steaks,
nuggets and value added products (21 %) (Silva and Dean 2001). Whole dressed yield (fish
weight without head, viscera, and skin) is generally 60 % (Clement and Lovell 1994) This value
could change depending on fish age, sex, and genetics. Female fish tend to give both higher
whole dressed and fillet yields (58.4 and 43.6 % respectively) than male fish (57.9 and 43.0 %),
and hybrids can reach more than 60% and 45% for whole dressed and fillet yield respectively
(Argue and others 2003). However, even at the highest yields, processing generates a
considerable amount of by-products such as heads, frames, viscera, and skin.
2.2 Catfish skin
Fish skin contains collagen, a protein formed by a triple helix structure linked by hydrogen and
covalent bonds which may break if exposed to hot water (Himaya and Kim 2014). Every third
residue in the three parallel polypeptide strands is most of the time glycine (Gly) resulting in a
3repeating XYGly amino acid sequence, where X and Y can be any amino acid (Shoulders and
Raines 2009).
Collagen properties are associated with gelling and surface behavior (Gómez-Guillén and others
2011); however, research has shown more alternative uses. Collagen and gelatin have been
extracted from fish skin using alkali and acid methods generating considerable yields (Yang and
others 2008; Jamilah and others 2011). Edible films have been produced with extracted gelatin
(Zhang and others 2007) and by proteolysis producing protein hydrolysates with considerable
activity as emulsifiers and antioxidants (Yin and others 2010; Ketnawa and others 2016), and
able to reduce the negative effects of UVA-irradiation on 3-D human skin model (Kato and
others 2011). Due to the importance of these properties, the soluble and insoluble fractions of
hydrolyzed catfish skin have been studied and described by Yin and others (2010). The results
from these authors suggest that protein in catfish skin could be used as substrate for production
of hydrolysates with functional properties of interest in the food industry.
2.3 Protein hydrolysis
Protein hydrolysis has been widely applied for fish by-products’ processing. It involves the use
of acids, alkalis, or enzymes for breaking down parent proteins into protein fractions, peptides,
and free amino acids (Kristinsson and Rasco 2000b). The use of acids and alkalis may entail
important disadvantages. Acid hydrolysis utilizes strong acids (ex. hydrochloric, sulfuric) that
destroy tryptophan; moreover, after hydrolysis, sodium hydroxide is used for neutralizing the
solution. This addition of acid and base makes the hydrolysates unpalatable. On the other hand,
alkaline protein hydrolysis tends to produce D-amino acids making them indigestible for humans
(Anwar and Saleemuddin 1998); furthermore, this type of hydrolysis may generate toxic
compounds (ex. lysinoalanine) which are undesirable for human consumption (Himaya and Kim
42014; Kristinsson and Rasco 2000b). Therefore, enzymatic protein hydrolysis seems to be a good
alternative for catfish skin protein hydrolysis.
Proteolytic enzymes can cleave peptides bonds acting in two different ways which allows their
classification in two groups: exopeptidases and endopeptidases (Damodaran and others 2007).
Exopeptidases require amino or carboxyl termini to cleave peptide bonds removing one, two, or
three amino acid residues at a time from the N terminus, or one or two at a time from the C
terminus. In contrast, endopeptidases do not accept substrates with charged amino or carboxyl
termini cleaving peptide bonds deeper in the protein structure generating peptides of different
sizes (McDonald 1985; Panyam and Kilara 1996). Bringing out peptides from the native protein
structure allows them to exhibit their functionality as bioactive molecules (Di Bernardini and
others 2011; Korhonen and Pihlanto 2006) which makes selection of the enzyme a key step of
the process.
Alkalines are a sub-group of endopeptidases that have been widely used for producing fish skin
protein hydrolysates, and their utilization has also allowed high protein recovery hydrolysates
with low lipid content, high nutritional value, and considerable functional properties (Kristinsson
and Rasco 2000b). It has been used for the production of giant catfish skin hydrolysates
(Ketnawa and others 2016), channel catfish skin hydrolysates (Yin and others 2010), and Pollock
skin hydrolysates (Sathivel and others 2008) proving to be a suitable enzyme for hydrolysates
production. Furthermore, this group of enzymes has proven to produce hydrolysates with better
antioxidant activity at low degrees of hydrolysis compared to other enzymes (Klompong and
others 2007).
Degree of hydrolysis (DH) is defined as the percentage of cleaved peptide bonds, and calculated
by dividing number of hydrolyzed bonds by the total bonds times one hundred (Nielsen and
5others 2001). It is known that DH starts with a high rate that decreases rapidly over time and is
influenced by inhibition by hydrolysis products which could explain the curve shape (Valencia
and others 2014). This typical shape seems to play an important role in the development of
functional properties of protein hydrolysates. Enzymatic hydrolysis of proteins produces three
main effects: reduction of molecular weight (MW), increase in number of ionizable groups, and
the exposure of hydrophobic groups originally found at the interior of the native proteins
structure (Panyam and Kilara 1996). It has been reported that the higher the degree of hydrolysis,
the lower the MW of protein/peptides produced (Severin and Xia 2006). Change in MW affect
hydrolysates functional properties showing that high MW peptides (low DH) have better
emulsion capacity, emulsion stability, and fat absorption, and hydrolysates produced with further
hydrolysis (high DH) tend to have better solubility in water (Gbogouri and others 2004; Sathivel
and others 2008; Severin and Xia 2006; Klompong and others 2007). Hydrolysates with low
molecular size tend to diffuse and absorb rapidly to the interface in emulsions, but they cannot
unfold and reorient at that point like large peptides limiting the emulsion capacity and stability
(Gbogouri and others 2004).
2.4 Bioactive peptides
Bioactive compounds are defined by Biesalski and others (2009) as “essential and non-essential
compounds (e.g., vitamins or polyphenols) that occur in nature, are part of the food chain, and
can be shown to have an effect on human health”, and as mentioned in advance, some peptides
have shown potential as bioactive compounds especially the ones with low-molecular weight. In
fact, molecular weight is one of the most important factors determining peptides’
physicochemical and biological activities (Najafian and Babji 2012; Sarmadi and Ismail 2010).
Hydrolysates with large portions (>50%) of peptides under 3 kDa have been previously linked to
antimicrobial activity, and short peptides with MW less than 3 kDa were linked to high
6angiotensin-converting enzyme (ACE) inhibitory effect (Jang and others 2008; Jang and Lee
2005) and strong antioxidant activity (Ngo and others 2010; Je and others 2007; Je and others
2005; Rajapakse and others 2005; Wu and others 2003).
2.5 Hydrolysates as antioxidants
Antioxidant properties have been related to fish protein hydrolysates (Di Bernardini and others
2011; Valencia and others 2014). These properties are related to the interaction between the
functional groups of amino acids conforming the peptide sequence (-NH2, -SH, -OH, and –
COOH) with hydroperoxides or pro-oxidants during lipid oxidation (Zayas 1997) reducing the
oxidation reaction rate, especially during the propagation stage.
Peptides can act as antioxidants by three mechanisms: metal chelation, radical scavenging, and
physical hindrance (Nikoo and Benjakul 2015). These mechanisms are represented in Figure 1.
Fig. 1. Schematic representation of chemical and physical mechanisms of antioxidant peptides to
inhibit oxidative process. (1) Metal chelation; (2) radical scavenging; (3) physical hindrance
(shielding; repulsion). Source: (Nikoo and Benjakul 2015). 1
7Metal chelation and radical scavenging are both chemical mechanisms that involves the donation
of an electron from the peptide to a metal or to a radical respectively (Huang and others 2005).
On the other hand, the physical hindrance occurs by physical repulsion between positive amino
acids’ functional groups and positively charged metals. Lipid oxidation may be retarded by
neutralizing the radicals that cause oxidation itself or by chelating metal ions that accelerate lipid
oxidation (Damodaran and others 2007).
Hydrolysates with considerable antioxidant activity have been obtained from different protein
sources. These sources include hearing by-products (Sathivel and others 2003), pollock skin
(Sathivel and others 2008) and frame (Je and others 2005), giant catfish skin (Ketnawa and
others 2016), loach (You and others 2009), yellow stripe trevally (Klompong and others 2007)
and fresh water carp (Elavarasan and others 2014). Factors such as DH, the type of enzyme, and
the peptide amino acid composition influence protein hydrolysates’ antioxidant capacity. Results
reported by Klompong and others (2007) suggest an increase in the antioxidant capacity while
DH increases until a certain point; however, further hydrolyzation tends to produce large
quantity of short peptides and free amino acids that reduce antioxidant activity (Wu and others
2003; You and others 2009). Higher antioxidant activity at the same DH (5%) has been reported
for yellow stripe trevally hydrolysates that were hydrolyzed using Alcalase compare to
hydrolysates produced with Flavourzy. Nevertheless, the opposite enzyme effect was observed
on round scad hydrolysates at higher DH (20,40, and 60%) (Thiansilakul and others 2007)
suggesting that not only the type of enzyme affects antioxidant capacity, but also the substrate
used as the source of protein for hydrolysis.
Amino acid composition has been linked to the antioxidant capacity of hydrolysates too.
Tyrosine, glycine, aspartic acid, and glutamate have been reported as radical scavengers due to
8the capacity to serve as hydrogen donors (Di Bernardini and others 2011; Qian and others 2008).
Non-polar (alanine, valine, leucine, and proline) amino acids have high reactivity with
hydrophobic polyunsaturated fatty acids, and aromatic amino acids (tyrosine, histidine,
tryptophan, and phenylalanine) can stabilize reactive oxygen species (ROS) through direct
electron transfer (Qian and others 2008). The concentration of tyrosine, methionine, histidine,
lysine, and tryptophan residues on hydrolysates also has generated a positive antioxidant effect
which could be due to the chelating and lipid radical scavenging ability of imidazole ring on
histidine (Chen and others 1996) and proton donation to radicals by the aromatic amino acids
(You and others 2009). Glycine, histidine, and tryptophan have shown potential antioxidant
activity at pH between 6 to 7 in linoleic acid emulsions with phosphate addition (0.1 mol)
(Marcuse 1962). Free radical scavengers could inhibit lipid oxidation by reacting faster with free
radicals than unsaturated fatty acids do (Damodaran and others 2007).
2.6 Hydrolysates as Emulsifiers
Emulsions are systems involving two liquids that are by nature immiscible, one dispersed
(dispersed phase) into the other (continuous phase) generating oil in water (O/W) or water in oil
(W/O) emulsions. This system involves oil, water, an emulsifier, and energy where the oil or
water will form continuous or dispersed phase, the energy will deform and break up droplets
usually bigger than 2 µm, and the emulsifier will prevent coalescence of the dispersed droplets
(Damodaran and others 2007). According to Amarowicz (2010) evaluation of food protein
emulsifying properties may include any of the following parameters: emulsion activity
(maximum interfacial area per unit mass of protein in a stabilized solution), emulsion capacity
(maximum amount of oil emulsified under specified conditions by unit of mass of protein), and
9emulsion stability (capacity of a protein to form an emulsion that remains unchanged for a
certain time period at given temperature and gravitational field).
Protein hydrolysates’ emulsifying properties are influenced by different factors. Hydrolysates’
amphiphilic nature and water solubility promote the formation of O/W emulsions (Kristinsson
and Rasco 2000b). It is also known that higher protein effective hydrophobicity generates a
stronger affinity to the non-polar phase, causes a greater decrease in interfacial tensions, and
produces a better emulsifying activity (Kato and Nakai 1980). Furthermore, unfolded structures
improves emulsifying properties increasing the protein/hydrolysate capacity to form a protective
layer around fat globules in the emulsion system stabilizing it (Zayas 1997).
The degree of hydrolysis plays an important role in emulsifying properties. Proteins with low
DH have shown better EC and ES than those with larger DH (Šližytė and others 2005). Turgeon
and others (1991) suggested that for hydrolysates EC tends to decrease while DH increases due
to the fact that to small peptides cannot unfold and spread like proteins or higher MW
polypeptides at the interface reducing their efficiency in decreasing surface tension. In fact,
surface-active compounds need to adsorb rapidly to the interface, unfold, orientate its
hydrophobic groups toward the dispersed phase and its polar groups toward the continuous phase
for reducing free energy, and form strong and elastic films by the interaction with neighboring
molecules (Kato and Nakai 1980; Zayas 1997; Damodaran and others 2007).
2.7 Hydrolysates and their oil holding capacity
Knowing that fat is able to improve the quality of foods through texture, appearance, and flavor
enhancement (Damodaran and others 2007), the retention of it into the food product structure
requires special attention. For that reason, fat/oil holding capacity (OHC) of protein hydrolysates
may be of interest for the food industry. This ability of proteins to hold fat has been linked
10mainly to oil’s physical entrapment where protein-lipid interactions include electrostatic,
hydrophobic, non-covalent and hydrogen bonds (Zayas 1997).
Different factors may affect the OHC. Low dispersibility, controlled denaturation, and high
hydrophobicity seems to favor OHC in proteins (Li‐Chan and others 1985). Protein degradation
to oligopeptides by enzymes during fermentation also has improved this property (Yu and others
2007).
The capacity of protein hydrolysates for holding fat has been reported by other authors.
Sardinelle, zebra blenny, globy, and ray protein hydrolysates OHC were reported by Jemil and
others (2014). Li‐Chan and others (1985) reported OHC for beef top round and rockfish fillet
hydrolysates. Fat absorption values of herring by-products and capelin hydrolysates were
reported by Sathivel and others (2003) and Shahidi and others (1995) respectively. However,
there is limited available information about catfish skin hydrolysates oil holding capacity in the
literature.
2.8 Hydrolysates as antimicrobials
Antimicrobial activity of peptides from meat and byproducts’ hydrolysates (Di Bernardini and
others 2011) and fish sources (Najafian and Babji 2012) has been attributed to positively charged
peptides able to form an amphipathic secondary structure in a membrane environment (Dathe
and others 1997). These peptides bind to negatively charged molecules and substances in the cell
membrane of pathogens (Yeaman and Yount 2003).
The mode of action of antimicrobial peptide varies depending of the host nature. In gram
negative bacteria, the antimicrobial activity of peptides goes through three stages: binding of the
peptide to the bacteria’s surface, insertion, and destabilization of the cell membrane (Dathe and
others 2001). The binding stage seems to be due to electrostatic attractions (Yeaman and Yount
2003), and the penetration and the destabilization of the cell membrane seems to be caused by
11the interaction of the hydrophobic helix surface of the peptide with the phospholipid layer in the
cell membrane (Dathe and others 2001).
Different mechanisms have been proposed for explaining the mode of action of the antimicrobial
peptides. Brogden (2005) explains 3 models. The barrel-stave model (Fig. 2 A) suggests that
peptides orient perpendicularly to the cell membrane and insert into the bilayer phospholipid
membrane by the interaction between the hydrophobic areas of the peptides with the lipid region
of the cell membrane.
Fig. 2. Mechanism of antimicrobial peptides against gram positive and gram negative bacteria
Source: (Wang and others 2015). 1
The toroidal-pore model (Fig. 2 B) suggests the bending of the phospholipid’s polar region
toward the peptides’ polar region perpendicularly aligned to the cell membrane surface. The
carpet model (Fig. 2 C) suggests the parallel aggregation of peptides over the cell lipid bilayer
through the interaction of hydrophilic regions of both peptides and phospholipid by electrostatic
forces. In these 3 models, the peptides generate pores in the cell membrane and the bacteria will
die due to cell lysis. On the other hand, the gram positive bacteria are affected on different ways.
12The peptides bind to the cell surface by electrostatic interactions and affect the bacteria by
altering enzymes responsible for the cell membrane synthesis (Fig. 2 D), maltose ABC receptors
(Fig. 2 E), or causing an over-production of autolysin (Fig. 2 F) which deteriorates the cell
membrane. In addition, antimicrobial peptides can alter the DNA transcription (Fig. 2 G) or the
protein production (Fig. 2 H) in both gram positive and gram negative microorganisms causing
the cell death (Wang and others 2015).
Specificity of antimicrobial peptides toward pathogenic bacteria instead of human cells has been
related (in part) to cell membrane composition. Most pathogenic bacteria have highly
electronegative phospholipids (phosphatidylglycerol, cardiolipin, and phosphatidylserine) on the
cell membrane compared to mammalian cytoplasmic membranes that usually have more neutral
net charge phospholipids (phosphatidylcholine, phosphatidylethanolamine, and sphingomyelin)
(Yeaman and Yount 2003). This characteristic may promote higher electrostatic attraction
between bacteria’s cell membrane and cationic peptides.
The role of electrostatic attraction in the antimicrobial effect of peptides makes it logical to
hypothesize that the number of peptides’ net positive charges may influence the attraction. In
fact, most of the antimicrobial peptides reported on the literature have a net charge between +2 to
+9 (Yeaman and Yount 2003). Findings reported by Dathe and others (2001) suggest that
increasing the positive net charges of cationic peptides (from +3 to +5) can make some peptides
more active and selective against pathogenic bacteria rather than human cells as antimicrobials;
however, the addition of more positive charges may cause the opposite effect probably due to the
fixation of the peptide to the lipid head group of phospholipids inhibiting insertion and
disturbance of the cell membrane (Yeaman and Yount 2003). These findings suggest that
identification of peptide charges is highly important.
13CHAPTER 3. MATERIALS AND METHODS.
3.1 Materials
Fresh catfish skin (CS) was obtained from a local seafood plant in Baton Rouge, LA, and
transported to the pilot plant of the School of Nutrition and Food Sciences at LSU in an ice chest
with ice. The CS was immediately vacuum packaged (Koch UV-550, Kansas City, MO, USA),
frozen in an air-blast freezer at -20 °C, and kept at that temperature until used (no more than 2
weeks). Food grade enzyme alkaline protease 380 MG (380,000 DAPU/g) was obtained from
Enzyme Development Corporation (New York, NY). Unless otherwise specified, buffers, stains,
and equipment used for SDS-PAGE analysis were Bio-Rad products (Bio-Rad Laboratories,
Hercules, CA, USA). The media for bacteria growth was obtained from Neogen ® Corporation
(Lansing, MI, USA). Gram positive and gram negative bacteria were obtained from the LSU
AgCenter Food Safety and Microbiology lab (Baton Rouge, LA). Unless otherwise specified, all
other chemicals used for analysis were obtained from Sigma-Aldrich ® (St. Louis, MO, USA).
3.2 Methods
3.2.1 Hydrolysates production
Catfish skin hydrolysates were prepared according to the method described by Sathivel and
others (2003) with modification of the centrifuge g force. CS was thawed overnight at 5 °C,
cleaned, and ground using a Koch grinder (C/E6B0N, Kansas City, MO, USA) with a plate of 10
mm diameter and holes of 0.3 mm diameter. Seven independent samples were prepared by
homogenizing. For each sample, 100 g of ground CS were mixed with 100 mL distilled water
using a Waring commercial blender (model 51BL32 700, Waring Laboratory, Torrington, CO)
for 2 min. The homogenized sample was poured into an Erlenmeyer flask 500 mL capacity, and
the temperature was increased to 60 °C using a hot plate stirrer with constant agitation. At 60 °C,
alkaline protease enzyme (380,000 DAPU/g) was added at 0.5 % w/w protein of catfish skin
14(0.104 g enzyme/100 g CS). The sample was placed in a shaker at 60 °C with constant agitation
at 150 rpm. Each of the seven samples was removed from the shaker at different reaction times
(0.5, 1, 2, 3, 4, 5 and 6 h). The enzyme was inactivated by increasing and keeping the sample’s
temperature at 86 ± 0.5 °C for 20 min in a water bath. The degree of hydrolysis was measured as
described below. Then, the sample was centrifuged at 3110 x g (model J2-HC, Beckman
Instruments, Inc., Palo Alto, CA) for 15 min. The supernatant, that in fact constitutes the catfish
skin hydrolysate, was removed carefully and filtered through a double layer of cheese cloth. The
CSH production was replicated 3 times using 3 independent batches of catfish skin, and after the
filtering step the color and the pH of each CSH were measured by using the methods described
in the section 3.2.2. For the measurement of other properties, the CSH were frozen at -40 °C
using a cabinet-type cryogenic freezer with liquid nitrogen (Air Liquide, Houston, TX, USA) and
subsequently freeze-dried in a pilot lyophilizer (Genesis 35XL, VirTis, Gardiner, NY, USA).
Dried samples were kept into Whirl-pac ® bags in a desiccator until analyzed. The nomenclature
“CSH #” was used to describe “catfish skin hydrolysate generated at # h of hydrolysis time.”
3.2.2 Degree of hydrolysis (DH), color, and pH of fresh CSH
The DH was evaluated following the method described by Nielsen and others (2001). O-
phthaldialdehyde (OPA) reactant solution was prepared by diluting 7.62 g sodium tetraborate
decahydrate and 0.20 g of sodium-dodecyl-sulfate in 150 mL of distilled water in a 400 mL
flask. Four mL of ethanol (95%) was used to dilute 0.16 g of o-phthaldialdehyde, and it was
added to the previous mixture. The OPA-reactant solution was completed by adding 0.176 g
dithiothreitol (DTT) and distilled water to make 200 mL of solution. A serine standard solution
(0.9516 serine-NH2 meqv/L) was prepared by diluting 0.05 g of serine in 500 mL distilled water.
After enzyme inactivation, an aliquot of 0.1 to 1 g of the sample was diluted by adding distilled
15water up to make a total of 100 mL. Three mL of OPA-reactant solution were mixed with 400
µL of the diluted sample. After 2 min standing at room temperature, the absorbance (Abs) of the
OPA reactant–sample mixture was read using a Thermo Scientific Genesys® 20
spectrophotometer at 340 nm. Four hundred µL of the serine standard solution (standard) were
mixed with 3 mL OPA-reactant and analyzed in the same way as the sample. For the blank, 400
µL of distilled water were used for reacting with OPA-reactant solution and analyzed as
previously described. Equation 1 was used to calculate the serine-NH2 milliequivalents (meqv)
per gram of protein found in the hydrolyzed sample after enzyme inactivation.
( )
Where serine-NH2= meqv of serine per gram of protein; 0.1= total volume of the diluted
sample in liters; X= g of aliquot (range from 0.1 to 1 g); 0.9516 meqv/L= serine-NH2
concentration (milliequivalents per liter) in the serine standard solution; P= is the protein content
(%) of the sample. Thus, 100/(X*P) = grams of protein.
The serine-NH2 meqv/g protein result was used for calculating h (equivalent of cleaved
peptide bonds) (eq. 2). The values of α and β in equation 2 come from a linear equation reported
by Adler-Nissen (1986) that explains the relationship between h and serine-NH2 during fish
protein hydrolysis using alcalase protease. Serine-NH2 is a predictor of h. Constant values of
1.00 and 0.40 for α and β respectively assist to explain the linear relationship of Serine-NH2 and
h during the hydrolysis of fish protein using alcalase protease.
The DH (%) was calculated (Eq. 3) by dividing h by htot times 100. The denominator htot is the
total peptide bonds equivalents found in the native protein under evaluation. That value is based
16on the amino acid composition reported in the literature for the evaluated protein (Adler-Nissen
1986). The htot value for fish protein is 8.6.
The color of fresh and freeze-dried CSH was determined with a colorimeter (LabScan XE,
Hunter Associates Laboratory, Inc., Reston, VA, USA). White and black tiles were using to
standardize the colorimeter. Four mL (fresh) or 0.1 to 1 g (freeze-dried) of CSH obtained at the
different times of hydrolysis were poured into a plastic tray and placed under the colorimeter
lens for reading the color. The color was obtained in a Lab scale where L=0 is black, L=100 is
white, a= “+” value is redness or “-” value is greenness, and b= “+” value is yellowness or “-”
value is blueness.
The pH of the fresh CSH was measured by using a SympHony pH-meter (SB70P, VWR,
Radnor, PA, USA) by directly placing the electrode into a CSH solution (200 mg/mL) prepared
for each of the hydrolysates obtained after different times of hydrolysis with alkaline protease.
3.2.3 Proximate composition
Moisture determination of freeze-dried CSH was done by using a CEM moisture analyzer (Smart
System 5, CEM Corporation, Matthews, NC, USA). Protein content was estimated as 5.82 times
the nitrogen content (Sosulski and Imafidon 1990) determined by Dumas combustion in a
TruSpec nitrogen analyzer (Leco, MI, USA) at the Soil Testing and Plant Analysis Lab., LSU
AgCenter. Lipid content was determined by the Soxhlet extraction method AOAC 960.39
(AOAC 1995) using petroleum ether as the solvent. The ash content was determined using a
muffle furnace at 500 °C overnight. Carbohydrate content was estimated by difference between
total solids and the determinations of fat, protein, and ash.
173.2.4 Free Radical Scavenging activity (FRSA)
FRSA was analyzed using the 2,2-diphenyl-1-picrylhydrazyl (DPPH) method described by
Elavarasan and others (2014) with some modifications. DPPH is a free radical of purple color
whose intensity can be read with a spectrophotometer at 517 nm. When DPPH reacts with an
antioxidant, the DPPH is scavenged and the color intensity is reduced. The reaction between
DPPH and any antioxidant solution should take place in the dark because the color intensity of
DPPH is light sensitive. A DPPH solution was prepared by diluting 0.0039 g of DPPH in 100
mL ethanol (purity 95%) for a final DPPH concentration of 0.1 mM. Trolox stock solution was
made by diluting 0.020 g of trolox in 100 mL ethanol (purity 95 %) for a final trolox
concentration of 800 µM. Subsequently, 1.5 mL of this stock solution was diluted in 18.5 mL
ethanol (purity 95%) in order to prepare the working solution at 60 µM trolox concentration. A
stock solution for each CSH produced at the different hydrolysis times was made by diluting
1.25 g freeze-dried CSH in 5 mL distilled water for a final concentration of 250 mg CSH/mL.
Four solutions at different CSH concentrations (50, 100, 150, and 200 mg/mL) were made by
diluting the stock solution of each CSH with distilled water. The resultant solutions and the stock
solution of each CSH were diluted by a factor of 10. From each of the resultant diluted solutions,
1.5 mL was mixed in a test tube with 1.5 mL of DPPH solution using a vortex at 2200 rpm for 1
min and the resultant mixture’s reaction took place in the dark for 30 min at room temperature
(22 °C). Absorbance of the mixtures was measured at 517 nm using a Thermo Scientific
Genesys® 20 spectrophotometer. The trolox working solution was diluted in concentrations
ranging from 0 to 60 µM using distilled water. The resultant trolox solutions were mixed with
DPPH solution and analyzed following the same procedure as explained for the CSH samples. A
standard curve was prepared from the results of absorbance from the reaction between DPPH
18solution and the different concentrations of trolox working solution. A linear equation (Eq. 4)
was obtained (R2≥0.95) for the absorbance as a function of trolox concentration. This equation
was used for calculating the FRSA, expressed as millimol trolox equivalent per liter (mMol
Teq/L) from the absorbance obtained after the reaction between DPPH solution and each of the
CSH produced at different hydrolysis times (0.5, 1, 2, 3, 4, 5, and 6 h) at the different
concentrations (50, 100, 150, 200, and 250 mg CSH/mL). The result was multiplied by 10 to
account for the dilution made in advance.
R2=0.9661 (Eq. 4)
Where X= mMol Teq/L; Y= absorbance generated after 30 min of reaction between CSH and
DPPH in dark; -0.5026 and -0.0087= constants for the slope and intercept of the line.
3.2.5 Emulsion stability (ES)
The capacity of CSH to keep an emulsion stable was evaluated according to the method of
Kristinsson and Rasco (2000a). A sample of 0.500 g CSH was weighed and placed in a beaker
(50 mL capacity). Approximately 35 mL of a 0.1 M NaCl solution was added to the beaker, and
the CSH was diluted with constant agitation with a stirrer plate for 2 min. The resulting solution
was transferred to a volumetric flask and additional NaCl solution was added until a total volume
of 50 mL was obtained. The resulting CSH solution and an equal volume of soybean oil were
blended in a commercial blender (model 51BL32 700, Waring Laboratory, Torrington, CO) for 2
min to obtain 100 mL of oil in water (O/W) emulsion. Immediately, three 25 mL aliquots of the
resulting O/W emulsion were poured into graduated cylinders (25 mL capacity), and after 15 min
of rest at ambient temperature (22 °C) the aqueous volume was read on the cylinder scale (mL).
ES was calculated with equation 5.
(Eq. 5)
19Where Tv is total volume (mL) of the emulsion initially poured into the graduated
cylinder and Av is the aqueous volume observed after 15 min of rest. The difference
between Tv and Av represent the volume of emulsion that remained stable after 15 min of
rest.
3.2.6 Micro-structure of the stable phase
Transmission electron microscopy (TEM) was used in an endeavor to look at the interfacial
characteristics and micro-structure of the oil contained in the stable phase of the emulsions from
the ES analysis. Five mL were taken from an emulsion made following the procedure used for
ES analysis using CSH at 0.5 and 6 h of hydrolysis time (the ones that possessed the lowest and
highest ES respectively). No colorant was added to the oil. From the resulting sample, 5 µL were
placed over a glow discharge carbon filmed grid (CF300-Cu, Electron Microscopy Sciences,
Hatfield, PA, USA) followed by 2 min of stabilization. Excess sample was removed by carefully
placing the carbon grid on a filter paper (Whatman # 1). The grid containing the sample was
stained with a solution of 2% aqueous uranyl acetate (Electron Microscopy Sciences, Hatfield,
PA, USA) by placing the grid for 1 min over 50 µL of the staining solution previously poured on
a parafilm wax paper. After that, the carbon grid was removed from the surface of the staining
solution, and the excess of staining solution was removed by placing the carbon grid on a filter
paper (Whatman # 1). These carbon grids containing the stained sample were placed into a Jeol-
USA TEM (JEM-1400, Peabody, MA, USA). Pictures were obtained using a US1000XP 2
camera at 6000x magnification and beam energy of 120 kV. An emulsion of 10 mL soybean oil
and 90 mL 0.1 M NaCl was made by adding 1.125% of commercial Tween 20 emulsifier. A
TEM picture of this last emulsion was used as a control for microstructure comparison.
203.2.7 Oil holding capacity (OHC)
The effect of DH on OHC of CSH was evaluated according to the method of Šližytė and others
(2005) with some modifications. Ten mL of soybean oil were added to 0.500 g of freeze-dried
CSH in an Eppendorf tube (pre-weighed) at room temperature (22 °C). The mixture was kept at
room temperature for 30 min and stirred with a small spatula every 10 min during this period.
After that, the samples were centrifuged at 2,450 x g for 25 min while holding the temperature in
a range of 20 to 25 °C. After pouring off the supernatant (non-retained oil), the weight of the tube
containing the CSH plus the retained oil was measured. The amount of oil retained by 0.5 g CSH
was calculated by weight difference between the latter weight and the sum of the weight of the
empty tube plus the weight of the CSH sample. Because some oil attached to the Eppendorf tube
wall, a correction was determined by measuring the weight of the residual oil after adding and
pouring 10 mL of oil in an Eppendorf tube. This factor was subtracted from all the values of
retained oil/0.5 g CSH. OHC was calculated by multiplying the value of retained oil/ 0.5 g CSH
by 2, and the result was reported as g retained oil/g of CSH. The density of the oil was
determined by weighing 6 replicates of 10 mL soybean oil samples.
3.2.8 Sodium dodecyl sulfate polyacrylamide gel electrophoresis (SDS-PAGE)
MW profiles of the CSH samples produced at different hydrolysis reaction times were generated
through an SDS-PAGE analysis method according to Yin and others (2010) with some
modifications. A CSH solution (2 mg CSH/mL) was made using distilled water for each of the
CSH samples. From the resulting solutions and for each sample, ten µL were mixed with the
same volume of tricine sample buffer and boiled at 95 °C for 5 min in a dry bath (AccuBlock ™
digital dry bath, Labnet International, Inc., Edison, NJ). After 1 min of rest at room temperature
(22 °C), the samples were centrifuged for 10 s (Eppendorf Centrifuge 5415 D, Hamburg, DK). A
21precast polyacrylamide gel (10-20% Mini-protean tris-tricine gel) with wells for loading 10
individual samples was placed in a single sided vertical gel electrophoresis system filled with
10% running buffer solution (10x Tris/Tricine/SDS) until the gel was completely covered.
Subsequently, 5 µL of a pre-stained protein standard (Precision plus protein ™ Dual Xtra 2-250
kD) were loaded in the first well of the precast gel, and 10 µL of the centrifuged CSH samples (7
in total) were loaded in the subsequent wells (one sample per well) following an ascending order
based on the time of hydrolysis used for producing the CSH. PowerPac Basic ™ equipment was
used as a source of energy for the anode (- pole) and cathode (+ pole) in the electrophoresis
system. After 100 min of running, the gel was carefully removed and placed in a case with a
prepared buffer solution of distilled water, methanol, and acetic acid in a ratio at 5:4:1 for 30 min
over a bench rocker (S2025B, Labnet international, Inc., Edison, NJ) at 70 RPM. The fixing
buffer was removed and replaced with Coomassie stain (Bio-Safe™ Coomassie G-250 Stain).
After 2 h, the stain was replaced by distilled water and the gel was washed overnight. GelDoc ™
EZ Imager was used for taking a gel picture and visualizing sample and standard protein bands
using the Image Lab 4.0.1 program.
3.2.9 Disk inhibition antimicrobial assay
Based on the antioxidant activity, 3 CSH were selected (the ones generated at 4, 5, and 6 h of
hydrolysis) for testing their antimicrobial capacity against Gram positive Bacillus cereus,
Staphylococcus aureus, and Listeria monocytogenes and Gram negative Escherichia coli
O157:H7. The agar-disk diffusion method according to Jang and others (2008) with
modifications was used to determine the effectiveness of the CSH. Muller Hilton Broth (MHB,
21 g/L of distilled water), regular agar (21 g MHB and 16 g Agar per liter), and soft agar (21 g
BHI and 8 g agar per liter) were made. Each strain of the bacteria mentioned before was isolated
22and activated as explained below. A loop of pure bacteria culture was placed into an Eppendorf
tube (15 mL capacity) containing 10 mL of sterile MHB. After 10 seconds of mixing with a
vortex at 2200 RPM, MHB tubes containing B. cereus were incubated for 24 h at 30 °C, and the
tubes containing the other bacteria were incubated for 24 h at 37 °C. Two plates with selective
media for each bacterium under analysis were inoculated with a loop of incubated MHB using
the streak technique. These plates were incubated under the same time and conditions previously
described. Isolated colonies were obtained after the incubation period. One isolated colony of
each bacterium was placed in an Eppendorf tube containing 10 mL sterile MHB and incubated
for 7 h at temperatures previously described. The result was an activated culture (AC) for each
bacterium containing about 106 cells per mL.
After sterilization, approximately 10 mL of agar was poured into petri dishes and allowed to
solidify at room temperature. Tubes with 10 mL soft agar were sterilized, inoculated with 100 µL
of AC, and vortexed for 10 s. The content of each tube was poured into petri dishes with a first
layer of agar prepared in advance, and the tube contents were solidified at room temperature.
A solution (5 mL) of each of the 3 selected CSH were made diluting freeze-dried CSH into
distilled water for a final concentration of 200 mg/mL. Subsequently, the resulting solution was
filtered using 0.45 µm syringe filters. One set of filtered solutions from the 3 selected CSH was
sterilized by autoclave. A second set was just filtered using the syringe filter mentioned
previously.
TM
A blank sterile paper disk (BBL Becton, Dickinson and Company) 6 mm diameter was
saturated with 25 µL of a CSH solution (either filtered and autoclaved, or just filtered), and
immediately placed on the surface of the solidified soft agar. This was done for each of the CSH
solutions for each of the treatments (filtered and autoclaved or just filtered) and for each
23You can also read