CLEANER
SHIPPING
Focus on air pollution,
 technical solutions
   and regulation
←
→
Page content transcription
If your browser does not render page correctly, please read the page content below
CLEANER SHIPPING Focus on air pollution, technical solutions and regulation
CONTENT
                                                                        You can support our
                                                                   efforts to reduce air pollution
    03       Air pollution from shipping                          by joining the Danish Ecological
                                                                   Council as a private person or
    05       Adverse effects                                         a company. Read more on
                                                                   www.ecocouncil.dk or write to
     13      Technical solutions                                         info@ecocouncil.dk

     21      Regulation

    26       Enforcement

                                           This publication is available as a free download from www.
    29       Further regulation            ecocouncil.dk. Hard copy publications can be ordered from
                                           the Danish Ecological Council.
    35       Commercial Potentials
                                           Quotations, copying, and other uses of this publication are

    36       Recommendations
                                           welcome – please acknowledge the source.

                                           This publication is funded by the Danish Maritime Fund, Cli-
    37       More information              mate Works Foundation, the European Climate Foundation
                                           and the Danish Environment and Energy Foundation.
    38       Glossary
                                           Quality assurance of factual information in the chapters Air
                                           pollution from shipping and Adverse effects (page 9 except-
                                           ed), including figures: DCE – Danish Centre for Environment
                                           and Energy at Aarhus University. However, the authors are
                                           solely responsible for conclusions presented in the publication,
                                           which do not necessarily reflect the positions of DCE.

                                           Published by

Pictures: Danish shipping, Maersk Line
and Axel Friedrich
ISBN: 978-87-93630-02-4                    Danish Ecological Council
Text: Kaare Press-Kristensen               Kompagnistraede 22, 3rd floor
Editing: Tanja Willumsen                   1208 Copenhagen K
Layout: Koch&Falk · Print: KLS             Denmark
Edition: 2nd edition, 1st printing, 2018   Phone (+45) 33 15 09 77

2                                                                                THE DANISH ECOLOGICAL COUNCIL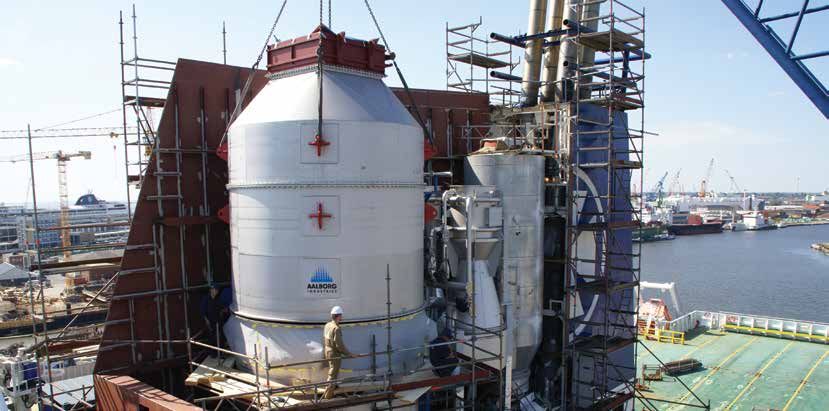
AIR POLLUTION
FROM SHIPPING
About 90% of global cargo is trans-      more sulphur than cars crossing            by significantly increase air pollution
ported by ships; shipping is thereby     the bridge between Denmark and             on land. However, ultrafine particles
the key platform of the still increas-   Sweden.                                    (PM0.1) from ships in ports can cause
ing global trade. However, the high                                                 work related heath problems for
transport share leads to around 6        Ideal combustion in ship engines           port workers and significant local
million barrels of oil being com-        oxidises all carbon and sulphur into       pollution. This is especially the case,
busted in ship engines every day         CO2 and sulphur oxides (mainly             when cruise ships use their engines
– corresponding to the oil export of     sulphur dioxide, SO₂). At the same         for energy generation during long
Kuwait – thereby contributing with       time, free nitrogen (N₂) in the com-       port calls.
2-2.5% of global anthropogenic CO2       bustion air is oxidised into nitrogen
emissions.                               oxides (NOX) inside the engine.            The use of fuel oil thereby emits the
                                         However, complete combustion               same air pollutants as traditionally
Most ships use heavy fuel oil (HFO)      does not occur. Hence, the flue gas        emitted by road vehicles, power
that can contain up to 3.5% sulphur.     contains carbon monoxide, polycy-          plants, etc. However, most road fuel
However, in the specific SECAs           clic aromatic hydrocarbons, volatile       is de-sulphurised today, and vehi-
(Sulphur Emission Control Areas),        organic compounds and particulate          cles and power plants have efficient
including seas around Denmark, a         matter. High sulphur contents in the       flue gas cleaning systems in most of
maximum of 0.1% sulphur is allowed,      fuel oil increase emissions of SO₂         the world. No comparable regula-
so lighter fuels are used. For com-      and particulate matter. The most           tions apply to shipping. However, in
parison, road diesel in the EU can       important pollutants in relation to        recent years the IMO (International
only contain 0.001% sulphur. Con-        health damage are SO₂, NOX and             Maritime Organization) has adopted
sequently, fuel used by ships in the     fine particles (PM2.5), as these pollut-   regulation that will reduce emissions
Baltic Sea can contain 100 times         ants have a long lifetime and there-       from shipping.

        Heavy fuel oil (HFO) is a waste
     product from refineries. When light
  hydrocarbons used for jet fuels, gasoline
 and diesel, etc. are distilled from crude oil,
the remaining parts are used as HFO for ships
        and asphalt. HFO is extremely
  viscous and has a high content of sulphur.
  HFO is heated under high pressure before
   being combusted in ship engines. Today,
       most fuel oil is combusted at sea
        without any flue gas cleaning.

CLEANER SHIPPING                                                                                                         3
by NOX emissions, and emissions
                                                                                   outside the North European SECA
                                                                                   also cause health damage in Den-
                                                                                   mark.

                                                                                   This publication focuses on air pol-
                                                                                   lution with CO2, SO₂, NOX and fine/
                                                                                   ultrafine particles from shipping,
                                                                                   technical solutions, existing regula-
                                                                                   tion, the need for further regulation
DCE (Danish Centre for Environ-           ships) every year. Large container       and enforcement. The purpose is to
ment and Energy) at Aarhus Uni-           ships only sail 5-10 meters per litre    inspire decision-makers and other
versity estimates that air pollution      of fuel. Consequently, huge amounts      key stakeholders to implement
from shipping causes about 50,000         of fuel are combusted in the seas        more ambitious regulation as well as
premature deaths in Europe every          around Denmark, resulting in serious     enforcement to reduce air pollu-
year. The associated health costs are     air pollution. Hence, NOX emissions      tion from shipping to the benefit of
above USD 80 billion (US dollars).        from shipping in the seas around         shipping as a business, the climate,
On top of this comes damage to            Denmark are much higher than             public health and nature. Finally, this
nature, crops, buildings, etc. In 2015,   pollution from all domestic sources      publication is intended for teaching
the sulphur limit in SECAs was fur-       in Denmark. DCE at Aarhus Univer-        in natural science classes.
ther reduced. This brought positive       sity estimates that air pollution from
effects in the SECAs, but has not         shipping causes about 450 pre-           Shipping leads to a number of other
reduced health damage significantly       mature deaths every year in Den-         serious environmental impacts, e.g.
on a global scale. However, in parts      mark along with socio-economic           fauna pollution with invasive spe-
of the SECA, ship emissions are still     health costs of around USD 670           cies, risk of oil pollution, environ-
responsible for eutrophication and        million. The tightening of the SECA      mental and social problems due to
acidification.                            regulation in 2015 has only reduced      uncontrolled ship dumping in third
                                          health damage caused by shipping         world countries, etc. However, these
The seas around Denmark have              by about 15% in Denmark: most            issues are not discussed in this pub-
around 100,000 passages (large            health damage incidents are caused       lication.

4                                                                                              THE DANISH ECOLOGICAL COUNCIL
ADVERSE
EFFECTS

Shipping is not regulated as strictly          as flag states have very different              not ambitious, but should be seen
as most other sectors, when it comes           perceptions of environmental chal-              as the best possible compromise
to air pollution. The main reasons             lenges and global warming, IMO                  between many conflicting interests
are that shipping is an international          decisions have traditionally been               in the IMO.
business and that ships often sail             slow and unambitious when trying
in international seas, thereby only            to regulate these issues. However,              Table 1 shows important types of air
being regulated by international law.          for the last couple of years there has          pollutants from shipping, adverse
The easy reflagging of ships allows            been softening on several accounts              effects connected to them as well
to freely choosing under which                 and decisions have been taken to                as costs of health damage in Europe
flag ships sail. If one nation tries to        further reduce emissions of CO2 and             due to emissions in and outside the
regulate shipping through national             health damaging air pollution from              North European SECA. It should be
legislation, its ships will just reflag to     shipping. At the same time, further             emphasised that as the value of lost
nations with less strict environmen-           CO2 reductions from shipping are                human lives is being significantly re-
tal legislation.                               discussed intensely, not least due to           valued these years, the values used
                                               pressure from the EU. From an envi-             in the table are conservative and
International regulation of shipping           ronmental perspective, however, the             probably significantly underestimate
is decided by the IMO. However,                adopted regulation (see page 21) is             the true costs.

Table 1: Damage and health costs due to air pollution from shipping (2018 prices)

                                                                     CO2                SO2               NOX             Particles

 Direct health damage                                                                    X                  X                 X

 Indirect health damage   1)
                                                                                         X                  X

 Global warming                                                        X                                                     X 2)

 Acidification of the oceans                                           X

 Acid rain on land                                                                       X                  X

 Eutrophication                                                                                             X

 Health damage outside the SECA (USD/kg) 3)                                             16.5               13.5              26.5

 Health damage outside the SECA (USD/tonne fuel oil)       3), 4)
                                                                                        830                935               185

 Health damage in the SECA (USD/kg)       3)
                                                                                        18.5               21.5               56

 Health damage in the SECA (USD/tonne fuel oil) 3), 4)                                  36.5               1515               56

1) When transformed into health damaging secondary particles in the atmosphere.
2) Black carbon contributes to global warming and accelerates melting of the icecaps – particularly in the Arctic.
3) A
    s the value of lost human lives is being reconsidered and tends to be increased considerably compared to the assumptions underly-
   ing the table, the values stated are conservative.
4) B
    y burning one tonne of HFO outside SECA about 50kg of SO₂, 70kg of NOX and 7kg of particles are emitted, while burning one
   tonne of low-sulphur fuel oil in SECA emits about 2kg of SO₂, 70kg of NOX and 1kg of particles.

Source: Calculated from data obtained from DCE at Aarhus University with regards to the North European SECA.

CLEANER SHIPPING                                                                                                                         5
Dry cargo
                                             Cargo (Ro-Ro)
                      Other   6%
                                                 13 %                             Health costs per kilogram of emitted
                       3%
                                                                                  pollutants in the northern hemi-
                                                                                  sphere are higher inside the North
                                                                                  European SECA than outside the
                                                                                  SECA (cf. table 1), as combustion
                                                                                  inside the SECA is geographically
    Tanker
                                                                                  closer to densely populated are-
     20 %
                                                                                  as. Combustion of HFO outside
                                                                                  the SECA, on the contrary, has the
                                                                                  highest total health costs, since this
                               CO₂-emissions                        Container     fuel oil contains significantly more
                                                                      26 %        sulphur.

                                                                                  Furthermore, the table shows
                                                                                  that total health damage caused
                                                                                  by burning one tonne of fuel oil
                                                                                  is around USD 2,000 outside the
                                                                                  SECA and around USD 1,600 in the
                                                                                  SECA. By comparison, HFO costs
                                                                                  about USD 400 per tonne, while
                   Passenger (Ro-Ro)                                              low-sulphur fuel oil for use in SE-
                         32 %
                                                                                  CAs costs approximately USD 625
                                                                                  (January 2018). If shipowners had
Figure 1: CO2 emissions from shipping in the seas around Denmark in 2011          to pay for health damage caused by
                                                                                  their air pollution, the price would
                                                                                  increase six-fold outside SECAs and
In table 1, average health costs         due to global warming, such as the       more than triple in SECAs, respec-
(externalities) in Europe from ship      costs associated with the integra-       tively. Shipowners would in such
emissions of SO₂, NOX and fine           tion of many millions of climate refu-   case immediately make a switch
particles in the northern hemisphere     gees in Europe and, consequently,        from HFO to low-sulphur fuel oil
inside and outside the North Eu-         an enhanced risk of wars and na-         everywhere, and they would install
ropean SECA are calculated per           tional isolation/protectionism.          efficient flue gas cleaning. However,
kilogram of pollutant and per tonne                                               since society and the public pay for
of combusted fuel oil. In addition       Nevertheless, a pricing of CO2 emis-     the resulting health damage, this
to health damage, costs due to           sions is often seen: however, such       does not happen. Lack of internal-
damage on crops, buildings and           prices are the price of CO2 emission     isation of externalities thus causes
nature should be added. It is not        allowances or the cost of reducing       a traditional market failure, where
possible to make equivalent cost         one tonne of CO2. This cost is typi-     ships pollute much more than the
calculations of impacts and damage       cally set to USD 30-50 per tonne of      socio-economic optimal from an
(externalities) related to CO2, since    CO2. However, this is not the costs of   economic point of view.
long-term impacts on society and         damage caused by emitted CO2 but
public health from global warming        the costs of avoiding CO2 emissions.     Figure 1 shows an estimate of CO2
are highly unpredictable. Hence,         The attempts made to estimate the        emissions from shipping in seas
in addition to all the predictable       actual costs of CO2 due to the effects   around Denmark in 2011 on the basis
damage to food production, health        of global warming arrive – with great    of ship type. In outline, the relative
and biodiversity, several areas are at   uncertainty – at far higher amounts.     distribution of SO₂, NOX and parti-
risk of becoming uninhabitable due       Regardless of the lack of valuation      cles follows the distribution of CO2
to intensified drought, flooding and     of CO2 impacts, there is a need to       emissions by ship type, as all four
overheating, etc. Furthermore, it is     reduce both the harmful air pollution    pollutants are caused by burning
impossible to estimate indirect costs    and CO2 emissions from shipping.         fuel oil.

6                                                                                            THE DANISH ECOLOGICAL COUNCIL
Carbon dioxide                           UN cannot impose emissions reduc-         and the expected CO2 emissions
Globally, shipping emits about 800       tion obligations as it is done with,      from the sector towards 2050 de-
million tonnes of CO2 per year,          e.g. power plants. Thus, CO2 emis-        spite an increasing globalisation.
which is about 2-2.5% of anthro-         sions from shipping are not included
pogenic CO2 emissions. About             in national CO2 statistics. Shipping      Sulphur dioxide
80% originates from cargo ships,         gets the status of an independent,        Emissions of sulphur dioxide from
while 20% is due to fishing boats,       diffuse and global sector that must       shipping in the seas around Den-
passenger ships, etc. In addition to     be regulated as such through the UN       mark make up around 60% of emis-
global warming, the increasing CO2       by the IMO or UNFCCC.                     sions from all Danish land-based
concentration in the atmosphere                                                    pollution sources. If Denmark had
contributes to acidification of the      It is a specific challenge for shipping   not been geographically placed
oceans, as the concentration of          that the increasing globalisation         inside a SECA, the emission level
carbonic acid (H₂CO3) increases.         entails a steady increase in ship         from shipping would have been
Acidification of oceans together         transport by 2050 and, hence, is ex-      approximately 15 times higher than
with increasing sea temperature          pected to significantly increase CO2      all Danish land-based sources. The
due to global warming will have          emissions from the sector. However,       sulphur content in fuel oil is regulat-
fatal consequences for several of        the global CO2 emissions are sup-         ed by the IMO both in and outside
the most amazing ecosystems, e.g.        posed to be at least halved by 2050       SECAs (see page 21).
unique coral reefs.                      compared to 1990 levels to live up
                                         to the Paris agreement. Meanwhile,        A substantial part of SO₂ in the flue
Although shipping emits almost           CO2 emissions from shipping have          gas is transformed into sulphate
as much CO2 as France, Italy and         already increased significantly           (SO₄2-) in the atmosphere, e.g. by
the Czech Republic together, CO2         since 1990. If the increase continues     the formation of sulphuric acid
emissions from shipping are still        and all other sectors reduce their        (H₂SO₄) creating acid rain, which
not included in any directly binding     CO2 emissions in compliance with          contributes to, among other things,
international regulation. Theoretical-   the Paris agreement, a worst case         forest decline. Moreover, SO₂ is a
ly, shipping is included in the Paris    scenario would be that shipping           directly health hazardous gas. How-
agreement, where all polluters must      emits 10% of all anthropogenic CO2        ever, SO₂ from shipping mainly con-
contribute to reductions to limit the    in 2050. This calls for urgent CO2        tributes to health damage through
anthropogenic rise in temperature to     reductions from shipping. Finally, it     hazardous secondary fine parti-
a maximum of 2°C above preindus-         is worth mentioning that insourcing       cles formed through atmospheric
trial levels. However, since emissions   through automation and technology         reactions between SO₂ and other
from international shipping cannot       leaps such as 3-D printing can re-        pollutants (primarily ammonia).
be assigned to a specific nation, the    duce the need for shipping activities
                                                                                   Figure 2 shows emissions from
                                                                                   shipping in Danish seas. The main
                                                                                   shipping routes are clear.

                                                  Figure 2: Geographic
                                                  distribution of emissions
                                                  from shipping in Danish
                                                  seas

                                                      High emissions.

                                                      Average emissions

                                                      No emissions

CLEANER SHIPPING                                                                                                        7
Nitrogen oxides
Emissions of NOX from shipping
in the seas around Denmark are
approximately 1.5 times higher than
emissions from all Danish land-
based sources. Emissions of NOX are
regulated by the IMO (see page 22).
NOX emissions will, however, only
decrease significantly in the long
term inside NOX Emission Control
Areas (NECAs) as the current regu-
lation is weak.

NOX emissions consist mainly of
nitrogen monoxide (NO) and, to
a lesser extent, nitrogen dioxide
(NO2). NOX can be transformed into
nitric acid (HNO3) in the atmosphere
and become acid rain contributing          cally in micrograms per cubic metre.      Fine particles that consist of black
to forest decline. NOX enhances the        They are long lived and therefore         carbon contribute significantly
formation of health damaging smog.         cause long-range transbounda-             to global warming, since they are
Simultaneously, a substantial part of      ry air pollution. Ultrafine particles     transported to – and deposited on
NO reacts and becomes directly             (PM0.1) are particles with a diame-       – the Arctic ice sheet. Here, they
health damaging NO2. However,              ter less than 0.1 micrometre (100         absorb sunlight and heat the ice,
NOX primarily contributes to health        nanometres). They are measured in         thereby accelerating the melting of
damage in the form of hazardous            number of particles per volume air,       the ice and reinforcing global warm-
secondary fine particles formed            typically number per cubic centime-       ing. Most recent studies show that
through atmospheric reactions              tre. They are short lived and mainly      black carbon is the second-most
between NOX and other pollutants           cause local air pollution. Fine and       important cause of Arctic warming
(primarily ammonia). Finally, NOX          ultrafine particles are both emit-        and melting of the ice after CO2. The
can be deposited in low-nutrient           ted directly from ship engines as         closer to the icecap the particles are
ecosystems where nitrogen acts as          primary particles that often contain      emitted, the greater share is depos-
a fertiliser and destroys the unique       a high level of soot (black carbon).      ited on it. In the Arctic area shipping
low-nutrient ecosystems, which are         In addition, secondary fine particles     is the greatest regional source of
the habitat for a wide range of the        are formed from inorganic contami-        black carbon emissions. However,
planet’s rare flora and fauna species.     nants through chemical reactions in       shipping only contributes to a limit-
                                           the air, e.g. SO₂, NOX and ammonia        ed extent to the deposition of black
Particles                                  (see above) and as organic conden-        carbon on the ice, as the main con-
Emissions of fine particles from           sate particles.                           tribution is long-range transbound-
shipping in the seas around Den-                                                     ary pollution coming from wood
mark correspond to approximately           Particles increase the risk of cancer,    stoves, diesel traffic, power plants,
15% of emissions from Danish land-         cardiovascular diseases, blood clots      etc. in Canada, Europe, Russia, etc.
based sources. Emissions are not           and respiratory diseases, all of which    The temperature in the Arctic is
regulated by the IMO.                      contribute to premature death. As         increasing with double speed com-
                                           fine particles are spread over long       pared to the rest of the planet, and
Particles in air are classified by size.   distances, they contribute to health      the size of the sea ice is currently
Fine particles (PM2.5) are parti-          damage both when they are emitted         record low. This has opened up for
cles with a diameter less than 2.5         at sea and in ports. By contrast, ul-     ships taking a shortcut through the
micrometres. They are measured in          trafine particles are primarily a prob-   Arctic, which increases emissions of
particle mass per volume air, typi-        lem when emitted in port areas.           black carbon near the icecap – and

8                                                                                                THE DANISH ECOLOGICAL COUNCIL
dential and public areas. These ships         Figure 3 shows that no measurement
                                          often use ports close to large cities         goes below 20,000 particles per
                                          and emit high amounts of ultrafine            cm³ and that the average pollution
                                          particles. For ferries, it is in particular   reaches a level of about 30-40,000
                                          frequent arrivals and departures that         particles per cm³ both near the ship
                                          contribute to the pollution, whereas          and 50-100m downwind the ship.
                                          cruise ships are large energy con-            This should be compared to the
                                          suming hotels that often have long            typical particle level at the dock,
                                          stays at berth while producing en-            which is about 2,000 particles per
                                          ergy (heat and electricity) with their        cm³ when there are no cruise ships
                                          own extremely polluting engines and           in the port area. An average pollution
                                          fuel. Furthermore, cruise tourism is          level of around 35,000 particles per
                                          dramatically growing these years,             cm³ corresponds to the pollution
                                          and at the same time many ports are           level found near the most polluted
                                          progressively expanding with new              streets of Copenhagen during rush
                                          residential and public areas. Local           hour on a calm day. When the same
                                          air pollution from ferries and cruise         high concentrations are measured
                                          ships at berth can be eliminated if           50-100m downwind from a ship un-
increases the risk of oil spill in some   ships use land power (cold ironing)           der conditions with relatively strong
of the most vulnerable ecosystems         instead of their own engines.                 winds (4-4.5 m/s at measurement
where a clean-up is practically                                                         height) it shows that the pollution
impossible. A regulation of black         In figure 3 air quality measurements          plume from the cruise ship is very
carbon from shipping in the Arctic is     of ultrafine particles from a cruise          intense and can reach much of the
therefore urgently needed.                ship at Oceankaj in the Port of Co-           port area. By way of comparison,
                                          penhagen can be seen, both near               pollution with ultrafine particles from
Ultrafine particles from cruise ships     the ship (15-20m from the ship) and           road traffic 50-100m downwind the
and ferries at berth can be a specific    50-100m downwind the ship. Meas-              most polluted streets in Denmark will
problem both in relation to occupa-       urements were made with P-Trak’s              hardly be measurable at a local wind
tional health for port workers and        from TSI.                                     speed of 4-4.5 m/s due to dilution.
for the population in nearby resi-

Figure 3: Air pollution with ultrafine particles from cruise ships at Oceankaj in Port of Copenhagen.

Particles per cm³
180,000
                                                                                    Departure           Local wind speed at berth:
160,000                                                                                                 4 - 4,5 m/s

140,000
                                                                                                              Near the ship
120,000                                                                                                       50-100 m downwind
                                                                                                              the ship
100,000

80,000

60,000

40,000

20,000

      0
          16:07             16:36               17:05                 17:34                18:02

CLEANER SHIPPING                                                                                                              9
Table 2: Emissions from shipping compared to Danish land-based sources in 2018

                                                                                                                                Fine
     Emissions in tonnes                                                          SO₂                         NOX             particles

     Shipping in the northern hemisphere                                      1,500,000                 3,355,000              240,000

     Shipping in the North Sea and the Baltic Sea                               29,000                   955,000                13,000

     Shipping in the seas around Denmark                                        6,000                    173,000                2,500

     Danish land-based air pollution sources                                    10,000                   114,000               20,000

Source: Calculated from data obtained from DCE at Aarhus University.

Table 3: Health damage due to air pollution from shipping in 2018

                                               Northern hemisphere                                     North Sea and Baltic Sea
                                          Denmark                      Europe                        Denmark                   Europe

     YOLL   1)
                                           4,600                      570,000                         3,500                    140,000

     Respiratory disease                  280,000                    32,000,000                      225,000                  7,900,000

     Sick days                            430,000                   50,000,000                       350,000                 12,600,000

1)
     YOLL: Years of lost living (about ten years of lost living is the same as a premature death).

Source: Calculated from data obtained from DCE at Aarhus University.

Table 2 shows emissions of SO₂, NOX                 NOX pollution from shipping in the                From table 3 it is seen that the pol-
and fine particles from international               seas around Denmark exceeds the                   lution from shipping in the north-
shipping in the northern hemisphere                 pollution from all Danish land-based              ern hemisphere causes four times
and shipping in the North Sea and                   pollution sources.                                as many health damage incidents
the Baltic Sea compared to emis-                                                                      across Europe compared to the
sions from shipping in the seas                     Table 3 shows the health damage                   pollution in the North Sea and the
around Denmark and from all Danish                  caused by the emissions of SO₂, NOX               Baltic Sea. In Denmark, on the con-
land-based pollution sources.                       and fine particles from shipping in               trary, 80-90% of the health damage
                                                    the northern hemisphere and in the                incidents caused by pollution from
Table 2 shows that the SO₂ and                      Northern Sea and the Baltic Sea for               shipping are caused by emissions
particle emissions from shipping in                 Denmark and Europe. The health                    in the North Sea and the Baltic Sea.
the northern hemisphere sum up to                   damage is estimated based on                      This illustrates that, despite of the
50 and 20 times as high as the ship                 knowledge of where the pollution is               SECA covering all seas around Den-
emissions in the North Sea and the                  emitted, the dispersion and trans-                mark, shipping in these seas contin-
Baltic Sea, respectively, while the                 formation of the pollution in the                 ues to cause huge health damage.
NOX pollution is only about 3.5 times               atmosphere, the dose-response cor-
as high. This is due to lower sulphur               relation between air pollution and
content in the fuel used in the SECA                health damage as well as knowledge
in the North Sea and the Baltic Sea,                about the size of population ex-
which reduces particle emissions                    posed to the pollution.
as well. Further, it is seen that the

10                                                                                                                  THE DANISH ECOLOGICAL COUNCIL
Table 4: Health costs in Europe due to air pollution from shipping in 2018
Health costs in Europe (billion USD)
SO2 NOX Fine particles Total
Shipping in the northern hemisphere 25 45 6.5 76.5
Shipping in the North Sea and the
0.5 20.5 0.5 21.5
Baltic Sea
Source: Calculated from data obtained from DCE at Aarhus University.
Table 4 shows the socio-economic
costs due to health damage from air
pollution from shipping estimated
for Europe and divided on different
pollutants.
From table 4 it can be seen that
health damage from pollution from
shipping in the northern hemisphere
sums up to a yearly cost of USD
76.5 billion in Europe. Likewise, it
is seen that NOX causes the largest
total cost – particularly in the North
Sea and the Baltic Sea, where NOX
accounts for 95% of total costs re-
lated to air pollution from shipping.
This is because the sulphur content
in the fuel oil is significantly lower in
the Baltic Sea and large parts of the
North Sea due to the SECA.
In Denmark, socio-economic costs
due to air pollution from shipping
in the northern hemisphere amount
to about USD 0.65 billion a year,
of which around 80-90% is caused
by shipping in the North Sea and
the Baltic Sea. By comparison, air
pollution from all Danish land-based
pollution sources sums up to around
USD 1.33 billion a year. Air pollution
from shipping thereby causes health
damage and socio-economic costs
in Denmark corresponding to around
half of all Danish land-based air
pollution sources. It should be noted
that damage from ultrafine particles
is not included in these estimates.
CLEANER SHIPPING 11Climate wins, environment loses tion would not occur at all if it was The solution is, however, not to stop
If land-based transport per tonne not for extremely cheap shipping. global trade. Attempting to limit
of cargo is compared to shipping, Therefore, it does not always make transportation is a possibility, but it
cargo transported by train emits 2-7 sense to only compare alternative seems more reasonable to reduce
times more CO2 while trucks emit modes of transport. No transport air pollution from shipping con-
5-15 times more CO2. In terms of is, all things being equal, preferable verting shipping to a green mode
global warming, shipping is there- from a purely environmental per- of transport. However, this requires
by a favourable mode of transport. spective. It is recognised, however, focused efforts technically and po-
However, as shipping emits several that international shipping can be litically. Fortunately, several techni-
hundred times more SO₂ and more seen as a precondition for develop- cal solutions have been developed
than 50 times more particles than ment and a more even distribution that can minimise air pollution from
modern trucks per tonne of trans- of resources. shipping. Most technical solutions
ported cargo, shipping causes for shipping have much lower reduc-
serious health and nature damage All new trucks in the modern part tion costs than if further reductions
as well. of the world use low-sulphur fuel, were to be implemented on land-
which contains about 100 times based pollution sources. This is due
From a health perspective, shipping less sulphur than the ship fuel used to the fact that significant efforts to
is therefore not the best mode of inside SECAs and 2,500 times less reduce air pollution from land-based
transport. However, shipping has sulphur than the ship fuel used out- sources have already been made
several other advantages compared side SECAs. Furthermore, modern in most parts of the world, while
to land-based transportation such trucks have efficient NOX removal astonishingly little has been done to
as less noise exposure of the pop- and particle filters. Hence, weak reduce air pollution from shipping.
ulation, fewer traffic accidents and regulation gives shipping competi- Hence, the relatively high degree
cheap infrastructure. On the other tive advantages at the expenses of of air pollution from shipping is the
hand, a large share of transporta- trains and trucks. result of lack of political action.
12 THE DANISH ECOLOGICAL COUNCILTECHNICAL SOLUTIONS Several technical solutions have been developed to reduce emissions of CO2, SO₂, NOX and particles from There are four types of shipping. As shown below, a combi- technical solutions: nation of solutions can significantly reduce CO2 emissions and minimize 1. Reduced fuel consumption. SO₂, NOX and particle emissions in 2. Use of cleaner fuel. the short term. In the long term, new larger ships and cleaner fuels can 3. Reduced engine pollution. make shipping the green transport 4. Flue gas cleaning. of the future. Reduction costs for implementing technical solutions are often many times lower than the costs of health damage caused by air pollution (costs of no actions). Thus, many solutions are beneficial from a socio-economic point of view, as society saves (earns) many millions of dollars, every time one million is invested in flue gas cleaning. As an example, sulphur regulations inside health damage costs amount to Some of the solutions can be the SECAs have a reduction cost of USD 13.5-21.5 per kilogram of NOX. combined, but reductions do not about USD 4 per kg of SO₂ due to However, without regulation ship- necessarily sum up. Furthermore, higher fuel prices, while the avoid- owners have no incentives to pollute not all solutions can be used on all ed health damage costs are about less, as health and nature damage is ships. The largest reductions can be USD 18.5 per kg of SO₂ removed, i.e. paid by society and is thus invisible achieved on new ships. the profit is 4-5 times higher than to shipowners. Therefore, pollution the costs. Additionally, a significant from shipping must be regulated to particle reduction is automatically realise the benefits. achieved. For the 2020 regulation outside SECAs, a reduction cost There are four types of technical of USD 2 per kilogram of SO₂ is solutions: expected, while the avoided health damage costs are USD 16.5 per 1. Reduced fuel consumption. kilogram. For NOX, the reduction 2. Use of cleaner fuel. cost lies between USD 0.2-2.50 3. Reduced engine pollution. (depending on ship type and flue 4. Flue gas cleaning. gas cleaning technology) per kilo- gram of NOX, whereas the avoided CLEANER SHIPPING 13
capacity must be upheld since the
                                                                                   duration of transport between ports
                                                                                   increases. Nevertheless, fuel savings
                                                                                   of 20-25% net are often achieved
                                                                                   with reduced speed (slow steam-
                                                                                   ing). Reduced speed increases flexi-
                                                                                   bility as well, since the speed can be
                                                                                   increased when unforeseen delays
                                                                                   occur. This increases the probability
                                                                                   of scheduled arrival. Also, reduced
                                                                                   speed will increase the demand for
                                                                                   ships in order to maintain the trans-
                                                                                   port capacity, which can strip away
                                                                                   some of the existing overcapacity in
                                                                                   the industry and bring freight rates
                                                                                   up to an economically sustainable
                                                                                   level. This would enable investments
                                                                                   in flue gas cleaning technologies
                                                                                   and new, improved ships. In the long
                                                                                   term, larger ships with improved en-
                                                                                   gines and an energy-efficient design
                                                                                   will further reduce fuel consumption,
                                                                                   however, not enough to compensate
                                                                                   for an increase in fuel consumption
                                                                                   due to increased shipping.

                                                                                   In an ideal world, the potentials of
                                                                                   operational measures are exploit-
                                                                                   ed to an extent equivalent to the
                                                                                   economic benefits of the associat-
Reduced fuel consumption                 acteristics. Furthermore, scheduled       ed fuel savings. If the price of fuel
Fuel consumption can be reduced          arrival may avoid waiting (on idle)       increases, savings increase and the
through several operational actions;     for permission to enter ports. Finally,   potentials of operational measures
including better use of capacity         the speed of a ship has a significant     will be applied to a greater extent.
and logistics (route optimisation)       influence on fuel consumption. By         Hence, in times with high fuel prices,
combined with maintenance of the         reducing speed, substantial fuel          slow steaming has been implement-
hull, propeller(s) and engines along     savings can be achieved. Reduced          ed. However, profitable operational
with optimal sailing in respect to the   speed will, however, require more         measures are not fully utilised due
weather and the physical ship char-      ships (more capacity), if transport       to various market disturbances.

14                                                                                            THE DANISH ECOLOGICAL COUNCIL
There are several options to
reduce fuel consumption.
Source: Force Technology
By minimising water, wave and wind
resistance of the hull through better
ship design, new types of coating
and by releasing air bubbles under As a specific example, the
the hull (air lubrication), further fuel
company Silverstream Techno-
reductions can be achieved. This
can be combined with optimisation logies has developed and paten-
of the engine, such as waste heat ted an air lubrication system that
recovery (WHR), and the propeller/ can be retrofitted on many types
rudder (optimal design) relative to of ships. In verification tests this
the specific ship. In addition, there system has shown fuel savings
are quite a few new options, of
up to 10%.
which several have moved from the
prototype to large scale in recent
years, for instance kites, sails for
larger cargo ships, Fletner Rotors,
solar panels, etc.
CLEANER SHIPPING 15Cleaner fuel between natural gas and biogas, pared to traditional HFO containing
By using cleaner fuels, pollution whether electricity and hydrogen around 2.5% of sulphur. The bene-
can be significantly reduced. This are produced from coal or wind fits of LNG depend on engine tech-
concerns both well-known fuels power, whether biofuels are pro- nology. It is possible to eliminate
such as liquefied natural gas (LNG) duced from food or waste, etc. In methane slip (assumed in the table)
and low-sulphur fuel containing 0.1% addition, emissions of unburned in some engines. However, there is
of sulphur, but also other sources of methane from the engines (meth- a general disagreement in literature
energy such as electricity (especial- ane slip) can have a very important on the actual reductions using LNG,
ly ferries and cruise ships at berth) impact on the climate calculation, which explains the intervals in the
and in the long term fuels such as since methane has a global warming table.
road diesel, hydrogen, methanol, potential (GWP) 25 times higher
biofuels, etc. In the longer term per- (100 years’ time horizon) than CO2. Low-sulphur fuel oil is today required
spective, LNG could be replaced by Furthermore, auxiliary fuel (if en- inside SECAs. From 2020, a global
liquid biogas (LBG). gines are not pure gas engines) can regulation of a sulphur content of
reduce the environmental potentials. maximum 0.5% will come into force
Environmental benefits of the Finally, whether the fuel is used in outside SECAs (see page 21), and
individual fuels depend on many a 2-stroke or a 4-stroke engine can this will reduce health and nature
factors, including whether only make a significant difference. damage from shipping significantly.
emissions from the ship are con- However, as shown in table 5, it will
sidered, or a life-cycle perspective Table 5 shows reductions from the not result in a significant reduction
is applied where the production of ship stack when using LNG, low-sul- in NOX emissions, which is the most
fuel is taken into account as well. phur fuel oil and electricity (ferries harmful type of air pollution from
Evidently, there is a big difference and cruise ships at berth) com- shipping (cf. table 4, page 11).
Table 5: Pollution reductions from the engine due to cleaner fuels (in percent)
Engine CO2 SO2 NOX Particles
2-stroke 20-25 1)
> 90 2) > 20 40-95 2)
Liquified Natural Gas (LNG)
4- stroke 20-25 1) > 90 2) 50-90 40-95 2)
Low-sulphur fuel oil, SECA (0.1% sulphur) 0 95 5-10 35-85
Low-sulphur fuel oil, global 2020 (0.5% sulphur) 0 80 < 10 ?
Electricity (ferries & cruise ships) 3) 100 100 100 100
1) It is assumed that the release of unburned methane escaping through the stack is eliminated.
2) Depending on sulphur content and auxiliary fuel/lubrication oil used.
3) In the EU where CO₂, SO₂, NOX and fine particles from power plants are limited by emission allowances.
?: Depends on the type of fuel that is used to comply with the 2020 regulation of maximum 0.5% sulphur.
Source: General literature review
16 THE DANISH ECOLOGICAL COUNCILCO2 and NOX emissions can be
significantly reduced by using larger
and more efficient engines.
Source: MAN Diesel & Turbo
Cleaner fuel has several other eliminate emissions of black carbon systems utilising waste heat (WHR).
benefits. Liquid gas and electricity from shipping. Further, a low-NOX valve for 2-stroke
eliminate the risk of oil spill (except engines has been developed, which,
for auxiliary fuel/lubrication oil and Better engine technology without increasing fuel consump-
cargo). Low-sulphur fuel oil reduces For the last 50 years, the consump- tion, reduces the engine’s NOX emis-
the risk of long-term effects of oil tion of fuel oil per container per sions by 10-20% and, at the same
spills. This is particularly important nautical mile has been reduced by time, reduces particle emissions.
in the Arctic, where often there is more than 80% through the devel- Exhaust Gas Recirculation (EGR),
no immediate possibility for clean- opment of larger engines (for larger where part of the flue gas is recir-
up after oil spills, where oil pollution ships) with increasing efficiency. culated through the engine, has
slowly decomposes due to darkness This development will continue to proven to be an effective method
and low temperatures, and where oil some extent, however, at a more to reduce NOX emissions. EGR can
pollution causes long-term damage subtle pace as older and smaller reduce NOX emissions from 2-stroke
on the unique and sensitive ecosys- ships are replaced with new and engines by more than 80%. The
tems. Finally, low-sulphur fuel oil will larger ones. The optimisation of reduction achieved by EGR on
enhance the operation of particle engines continues, among other 4-stroke engines is around half of
filters for ships, which can almost things, with the development of that.
CLEANER SHIPPING 17Flue gas cleaning Flue gas from ships can be cleaned SO₂ and particle emissions for SO₂ in a scrubber where SO₂ is can be significantly reduced washed out of the flue gas using in a scrubber. seawater. Inside the scrubber, SO₂ is transformed into harmless sulphate Source: Alfa Laval Aalborg (SO42-) that can be discharged with the scrubber water at sea. However, the scrubber water also contains several toxic tar compounds. Hence, it cannot be discharged near coastal areas. Here it is stored in tanks and recirculated (with added sodium hydroxide). According to Alfa Laval Aalborg, a scrubber removes more than 95% of SO₂ and usually 50- 60% of the particles in the flue gas. DFDS is seeing the same results from their scrubbers in operation. During testing, some scrubbers have shown removal rates of 70-80% of particles (Venturi scrubber). It has, however, not been documented they also remove soot particles. A oil and meet the regulations inside whether scrubbers primarily remove scrubber can thus achieve the same SECAs as well as the 2020 global inorganic particles or to what extent SO₂ reduction as low-sulphur fuel sulphur regulation. Using a scrub- 18 THE DANISH ECOLOGICAL COUNCIL
The NOX-emission can
                                                               be minimized by SCR
                                                               technology.

                                                               Source: DANSK TEKNOLOGI

ber can thereby be an alternative       the flue gas by using particulate         es the filtration process. Full scale
to low-sulphur fuels. The potential     filters - the same technology as is       testing with particulate filters on the
of scrubber technology will depend      widely used in diesel cars. Particles     Ærø ferry carried out by Dinex A/S
on the fuel prices. DFDS and Royal      are removed by a physical filtration      has shown 90% particle removal
Arctic Line have both chosen to         process in a closed particulate filter.   for both fine and ultrafine particles.
implement scrubber technology,          Through electrical regeneration           Finally, particles can be removed
whereas Maersk Line has chosen to       (controlled particle combustion           very efficiently in a dry scrubber.
use low-sulphur fuels.                  inside the filter) particles are trans-   CCR Denmark has demonstrated
                                        formed to CO2 and water vapour.           through full scale testing a removal
For 4-stroke engines selective cat-     Low-sulphur content in the fuel oil       of ultrafine particles of 99.8% in a
alytic reduction (SCR) is one of the    reduces ash formation and enhanc-         dry scrubber.
most promising technologies for the
removal of NOX. In SCR systems, a
precise amount of urea is automat-
ically added to the flue gas. Am-
monia (NH3) is released from urea
at high temperatures and reacts
with NOX in the flue gas, converting
NOX and ammonia to harmless free
nitrogen (N₂) and water vapour. SCR
systems for ships can remove more
than 90% of NOX in the flue gas
at high temperatures (above 300
degrees Celcius). Is the temperature
lower, ammonia can be added as a
pure gas, thus maintaining high effi-
ciency down to 180 degrees Celcius.
Some studies also show particle
removal when using SCR systems.
Finally, SCR systems can reduce
noise significantly. SCR systems                           Particles can be
have been successfully used on both                 efficiently removed by
2-stroke and 4-stroke engines.                            particulate filters.

Particles can be removed from                               Source: Dinex A/S.

CLEANER SHIPPING                                                                                                      19
Combining technical solutions in the developed part of the world combining solutions the pollution
Many of the technical solutions can where heavy duty vehicles use both from shipping can be significantly
be combined on ships as done on desulphurized fuels (max. 0.001% reduced (table 6).
newer trucks and busses to com- sulphur), EGR combined with SCR
ply with environmental regulation and closed particticulate filters. By
Table 6: Reductions by combining solutions compared to a traditional container ship (in percent)
LNG + WHR
LNG LNG + WHR + EGR
CO₂ reduction 20-25 30 30
SO₂ reduction > 90 > 95 > 95
NOX reduction > 20 > 25 > 90
Particle reduction > 40 > 45 > 60
LNG: Liquid natural gas. WHR: Waste heat recovery. EGR: Exhaust gas recirculation.
20 THE DANISH ECOLOGICAL COUNCILREGULATION
more than 90% shows that SECAs
are a success. It also highlights NOX
pollution from ships as the major
remaining problem, now accounting
for 95% of total health damage from
ships in the North Sea and the Baltic
Sea.
As previously mentioned, global en- The seas around Denmark are SECA.
vironmental regulation for shipping Hence, sulphur emissions have been An estimation of SO₂ concentrations
is decided by the IMO. reduced by around 93% between in the air in Denmark in 2007 and
2006 and 2015. The reduction is 2020 is given in figure 4. It clearly
Sulphur regulation percentagewise somewhat lower shows that shipping has a signifi-
Table 7 shows the IMO regulation on than the reduction of the sulphur cant effect on SO₂ concentrations
the sulphur content in ship fuels. As content (96%) in the fuel as there in 2007, whereas the pollution is
an alternative to low-sulphur fuels, has been a simultaneous increase almost invisible in 2020 despite
ships can choose to remove SO₂ in shipping activity. However, a increasing shipping activity between
from the flue gas in a scrubber. reduction of sulphur emissions of 2007 and 2020.
Table 7: Global regulation of the maximum sulphur content in ship fuels (percent)
2007 2010 2012 2015 2020
Non-SECA (World seas) 4.5 - 3.5 - 0.5
Sulphur content
SECA 1.5 1 - 0.1 -
CLEANER SHIPPING 21Figure 4: SO2 concentrationen (µg/m³) in Denmark in 2007 and 2020
2.50 <
2.25 – 2.50
2.00 – 2.25
1.75 – 2.00
1.50 – 1.75
1.25 – 1.50
1.00 – 1.25
0.75 – 1.00
0.50 – 0.75
< 0.50
Source: DCE at Aarhus University.
Figure 5: Regulation of NOX from shipping
g/kWt
Tier I: Ship engines (above 130 kW)
18
installed on a ship built after 1st
16 Tier
TIER I I January 2000
Tier
TIER II II
14 Tier II: Ship engines (above 130 kW)
Tier
TIER III III
12
installed on a ship built after 1st
January 2011
10
Tier III: Ship engines (above 130 kW)
8 installed on a ship built after the
6 year the NECA came into force.
4
2
0
0 500 1,000 1,500 2,000 2,500 RPM Source: International Maritime Organization
The estimated decline in sulphur NOX regulation only inside the NECA. At present,
concentrations (figure 4) is sup- Figure 5 shows the global regulation NECAs is only established in North
ported by Danish measuring sta- of NOX emissions from ships. In line America/US. The current SECA in
tions. Following the tightening of with SECAs, NECAs have now been the North Sea and the Baltic Sea will
the regulation inside SECAs in 2015, introduced. For 2-stroke engines, in be extended to a NECA from 2021,
these now detect half the sulphur addition to implementing EGR and after which Tier III will apply to new
concentration on land. This decrease SCR, NOX reductions of 80% for Tier ships in Danish seas. However, as
documents that air pollution from III can be achieved by using LNG in soon as a ship leaves the NECA, it
shipping is dispersed over land and some engines. must only meet regulations of Tier
has a significant influence on air II and can significantly reduce NOX
quality and thereby on public health. Although NOX causes most of total removal. Finally, ship engines built
In addition to the Northern Europe- health damage (cf. table 4, page 11), between 1990 and 2000 must be
an SECA in the Baltic Sea and the the significant NOX reductions (Tier upgrated to Tier I but only if
North Sea, two SECAs have been III) only apply to new ships (built technology is available.
established in North America/US. after the NECA came into force) and
22 THE DANISH ECOLOGICAL COUNCILFigure 6: NO2 concentrations (µg/m³) in Denmark in 2007 and 2020
> 10.00
9.00 – 10.00
8.00 – 9.00
7.00 – 8.00
6.00 – 7.00
5.00 – 6.00
4.00 – 5.00
3.00 – 4.00
2.00 – 3.00
< 2.00
Source: DCE at Aarhus University.
It should be noted that it is the age in the North Sea and the Baltic Sea applies to both the particle pollu-
of the ship and the engine’s power is expected to have reduced NOX tion formed directly in the engine
that determines how much the ship emissions in the NECA by about (including black carbon) and the
can pollute with NOX. Old ships and 66% compared to baseline without secondary particles formed through
smaller ships can thus pollute more a NECA. atmospheric reactions. However, no
than new and large ships. This gives direct regulation of particle pollution
an incentive to maintain old small Finally, particle pollution is signif- has been decided – neither in the
ships, which in general pollute much icantly reduced because of the climate-sensitive arctic areas nor in
more than new large ships. sulphur and NOX regulation. This metropolitan ports.
Estimations of NO2 concentrations
(indicator for the NOX pollution)
in Denmark in 2007 and 2020 are
shown in figure 6. During this pe-
riod, a small increase in NOX emis-
sions in the seas around Denmark is
expected due to increased shipping
activity. Yet, the concentration
of NO2 will decrease significantly
thanks to a substantial decrease in
emissions from land-based emission
sources due to further restrictions
by EU regulation. Nevertheless,
the NOX regulation of shipping has
a positive effect, since ships’ NOX
emissions without regulation would
have increased by 10-15% from 2007
to 2020. However, the increase will
be kept at 2.5% due to the regula-
tion. By 2040, the upcoming NECA
CLEANER SHIPPING 23CO2 regulation builders to freely choose the most is a monitoring tool that allows
The IMO regulates CO2 emissions efficient solutions and motivates to monitoring fuel efficiency during
from new ships through the Ener- develop even better technologies. various operational changes. The
gy Efficiency Design Index (EEDI), More than 85% of CO2 emissions IMO has developed teaching mod-
which is mandatory for all new ships from shipping originate from ship ules in SEEMP.
built after January 1, 2013. EEDI types covered by EEDI. However,
promotes more energy efficient as the lifespan of a ship is typically By 2050, it is expected that EEDI/
ships by requiring increased energy 25-30 years, EEDI will first influence SEEMP have cut up to approximate-
efficiency for different ship types CO2 emissions in the long term. ly 1,000 million tonnes (30-40%)
and sizes compared to a specified Table 8 lists the EEDI regulations for of CO2 emissions from shipping,
reference level. It is measured in different types of ships. compared to a baseline without
grams of CO2 per transport work CO2 reductions. In addition to EEDI/
(capacity mile) and calculated from The IMO has also adopted the Ship SEEMP, the IMO has initiated a pro-
several parameters: ship type and Energy Efficiency Management Plan ject on further CO2 reductions from
design, fuel, engine type and size, (SEEMP) as an operational tool, shipping, which will lead to a whole
propellers, etc. By further tightening reducing the fuel consumption of new climate strategy framework in
the regulation every five years, new ships and thereby CO2 emissions. 2023 that will allocate CO2 reduc-
ships will continue to be more and SEEMP can be used for both new tions in the short, medium and long
more energy efficient. The regula- and existing ships and is based on terms. In addition to CO2 reductions,
tions only focus on the performance best practice in relation to ener- fuel savings (burning less fuel) will,
of ships and not on the technolo- gy efficient operation. This can be all things being equal, reduce air
gies used to fulfil the regulations. combined with Energy Efficiency pollution with SO₂, NOX and parti-
This allows ship designers and ship Operational Indicator (EEOI), which cles.
Table 8: EEDI regulations (reductions in percent) for different ship types built in different years
Size (Dwt) Reduction 2015-19 Reduction 2020-24 Reduction 2025 – …
> 20,000 10 20 30
Bulk carriers
10-20,000 0-10 1) 0-20 1) 0-30 1)
> 10,000 10 20 30
Gas tankers
2-10,000 0-10 1)
0-20 1) 0-30 1)
> 20,000 10 20 30
Tankers
4-20,000 0-10 1) 0-20 1) 0-30 1)
> 15,000 10 20 30
Container ships
10-15,000 0-10 1)
0-20 1)
0-30 1)
> 15,000 10 15 30
General cargo ships
3-15,000 0-10 1) 0-15 1) 0-30 1)
Refrigerated cargo > 5,000 10 15 30
carriers 3-5,000 0-10 1)
0-15 1) 0-30 1)
> 20,000 10 20 30
Combination carriers
4-20,000 0-10 1)
0-20 1)
0-30 1)
Dwt: Dead weight tonnage.
1) The reduction factor is linear in the interval (highest for large ships and lowest for small).
24 THE DANISH ECOLOGICAL COUNCILTable 9: Estimated emission of pollution from shipping in the seas around Denmark.
CO2 SO2 NOX Fine particles
2011 (tonnes) 7,850,000 41,000 173,250 4,000
2020 (tonnes) 9,250,000 6,000 177,600 2,650
Changes in % + 18 -85 +2,5 -34
Source: DCE at Aarhus University.
Estimated emissions of CO2, SO₂, areas and metropolitan port areas. future. As a result, health and nature
NOX and fine particles from shipping Recent studies indicate that the fuel damage caused by air pollution
in seas around Denmark in 2011 and oil quality (aromatic content) is a from shipping will for many years
2020 are shown in table 9. crucial parameter to black carbon be a major economic burden for
formation and emissions. society; primarily due to a weak NOX
CO2 and NOX emissions show a net regulation. Considering the climate,
increase between 2011 and 2020 Although the IMO regulation is a there is need for action as the
due to an increase in shipping activi- major step in the right direction, existing regulation does not reduce
ty and a weak regulation of these shipping is still subject to much less CO2 emissions from shipping to a
pollutants. Hence, CO2 and NOX strict regulation than land-based level in line with the goal of the Paris
pollution from shipping will contin- transport. Fuel oil used in SECAs agreement: To keep the anthropo-
ue to be the most urgent challenge contains 100 times more sulphur genic global warming at a level that
both inside and outside NECAs. The than road diesel. Even new ships in avoids dangerous and irreversible
highest reduction is seen for sulphur, NECAs (Tier III) can emit 5-7 times climate change. Thus, there is an
resulting directly in reduced particle more NOX per kWh engine power urgent need for stricter regulation of
emissions. Outside SECAs, the glob- compared to new trucks. Addition- pollution from shipping – especially
al sulphur regulation from 2020 will ally, they emit more than 50 times NOX and CO2 – before the sector
result in a reduction in particle emis- as many particles. Hence, even the becomes the green transport of the
sions as well. However, emissions strictest IMO regulation in SECAs future in an increasingly globalised
of soot particles (black carbon) will and NECAs does not change ship- world.
continue to be a problem in arctic ping to the green transport of the
CLEANER SHIPPING 25ENFORCEMENT to comply with the regulation. This
requires the right balance between
control and sanctioning for circum-
vention. If the risk of being caught
violating the regulation is low, the
economic sanctions must, of course,
be high to prevent non-compliance.
However, the IMO regulation only
International environmental regulation economic incentive to circumvent focuses on environmental regula-
of shipping is needed to gain major so- the regulation is considerable while tion. IMO entrusts the enforcement
cio-economic benefits from reduced air enforcement is modest; control and to the flag states, which have a very
pollution. Regulation is, however, not fines are symbolic compared to the different priority of regulation.
sufficient in an international industry, economic savings from circumven-
where circumvention and corruption tion. Thus, there is a real risk that The enforcement of the sulphur
is widespread. To avoid systematic shipowners violating the regulation regulation in SECAs and on a global
violations of the regulation, enforcing will outmatch compliant shipowners level from 2020 has been the object
the regulation will be just as impor- fulfilling the regulation and thereby of intense discussions. In SECAs,
tant as the regulation itself to achieve earn money on harming society. savings of around USD 165,000 per
the full environmental benefits. The Finally, systematic violations must ship (English Channel to Gdansk
be avoided to allow compliance and back) can be attained by using
costs (e.g. extra fuel costs) to be traditional HFO instead of the re-
transferred from shipowners to quired more expensive low-sulphur
cargo owners and further on to end fuel oil. Hence, ships violating the
The world’s largest
consumers who get the benefits of regulation can make higher profit
shipping companies
less mortality and morbidity. and offer lower prices than com-
have now joined forces Efficient enforcement prevents vio- pliant shipowners. NOX regulations
in Trident Alliance only to lations by making it more expensive in NECA (Tier III) will face similar
achieve enforcement to circumvent the regulation than challenges.
of the sulphur
regulation
The Danish Ecological Council has
organised several large conferences in
Copenhagen and Brussels on enforce-
ment in close cooperation with Danish
Shipping and other key stakeholders.
26 THE DANISH ECOLOGICAL COUNCILNorth European SECA an initiative to create a public regis- tion indicates that more than 95% of To meet the challenges associat- ter that displays shipping companies the ships inside the SECA fulfil the ed with enforcement, the EU has (name and shame) who are caught sulphur regulation. passed a directive establishing a circumventing the regulation. procedure for port state control in The 9,865 inspections that were car- the EU. Member States perform the Since the regulations inside SECAs ried out in the EU’s SECA until spring port state control and must in- were tightened in 2015, Danish 2017 showed that 92.5% of the ships spect 10% of all port calls to control authorities have reported about 20 complied with the regulations. Of the logbooks, fuel oil receipts, etc. In cases of violations to the police. 7.5% that did not meet the regula- addition, fuel samples for sulphur During the same period, there have tions, several of the violations were analysis must be carried out in 4% been approximately 300,000 ship of administrative character (insuffi- of all port calls. However, fines for passages in the seas around Den- cient logging, missing fuel receipts, violations are based on national mark. According to model calcula- etc.), and not non-compliant fuel. decision (non-EU competence). tions, the measured sulphur reduc- Nonetheless, according to the EU directive fines must be high enough to prevent systematic violations. Hence, if the risk of getting caught in the SECA is 4-10% while the sav- ing is USD 165,000, the fines should be USD 1.65-4.13 million just to break even. Higher fines are need- ed to make violations unattractive. However, fines are typically 50-100 times lower (USD 0.03-0.06 million). Thus, from an economic viewpoint, The small, Danish entrepre- the benefits of non-compliance are neurial company Explicit is 50-100 times greater than being specialised in monitoring in compliance, if inspections are sulphur emissions from ships only performed randomly. However, through measurements from focused inspections through inter- helicopters and drones. national cooperation can reduce the benefits of non-compliance. To support port state control, Den- mark has installed sulphur meas- uring equipment under the large bridges, and authorities conduct controls at sea using helicopters measuring sulphur directly in the ships’ flue gas. Based on the ratio of CO2 and SO₂ in the flue gas, the sul- phur content of the fuel oil can be calculated. If these measurements indicate non-compliance, authorities are immediately contacted at the ship’s next port. There, a sulphur sample of the fuel oil is taken, which can be used as evidence in court. Fi- nally, the authorities have just taken CLEANER SHIPPING 27
You can also read