Oil reporting for the FQD An assessment of effort needed and cost to oil companies - Report
←
→
Page content transcription
If your browser does not render page correctly, please read the page content below
Oil reporting for the FQD

An assessment of effort needed
and cost to oil companies

Report
Delft, March 2012

Author(s):
Bettina Kampman (CE Delft)
Jan van den Berg, Gerd-Jan Otten (Carbon Matters)
Pieter Kroon (ECN)
Anouk van Grinsven, Ab de Buck (CE Delft)
Publication Data
                 Bibliographical data:
                 Bettina Kampman (CE Delft), Jan van den Berg, Gerd-Jan Otten (Carbon Matters),
                 Pieter Kroon (ECN), Anouk van Grinsven, Ab de Buck (CE Delft)
                 Oil reporting for the FQD
                 An assessment of effort needed and cost to oil companies
                 Delft, CE Delft, March 2012

                 Oil / Companies / Directive / Quality / Reporting / Costs

                 Publication code: 12.4646.30

                 CE publications are available from www.cedelft.eu
                 Commissioned by: European Federation for Transport and Environment.
                 Further information on this study can be obtained from the contact person, Bettina Kampman.

                 © copyright, CE Delft, Delft

                 CE Delft
                 Committed to the Environment
                 CE Delft is an independent research and consultancy organisation specialised in developing
                 structural and innovative solutions to environmental problems.
                 CE Delft’s solutions are characterised in being politically feasible, technologically sound,
                 economically prudent and socially equitable.

                 Carbon Matters
                 Carbon Matters is an independent company advising industrial and (semi)governmental
                 organisations on their energy and CO2 emission management. The company has a strong
                 background in the process industry. The expertise and core proposition of Carbon Matters is
                 profitable CO2 reduction, based on the development of effective and achievable sustainability
                 business targets. This proposition is offered through three products:
                 1. CO2 Footprint and Benchmark; 2. Profitable Carbon abatement options and quantified business
                 cases and 3. Implementation- or internal audit of the control framework.
                 The Carbon Matters product base is driven by economics. Proposals for improvement are
                 developed to match current legislative requirements and have flexibility to be adapted in line
                 with future directives (more details: www.carbonmatters.nl).

                 ECN
                 The Energy research Centre of the Netherlands (ECN) is the leading center for energy research
                 and development in the Netherlands. ECN conducts technology and policy research to find
                 solutions to meeting social needs for energy services in a safe, efficient and clean way. ECN
                 comprises 700 staff, structured into eight business units: Solar Energy; Wind Energy; Biomass,
                 Coal and Environmental Research; Energy Efficiency in Industry; Hydrogen and Clean Fossil Fuels;
                 Energy in the Built Environment, Engineering & Services, and Policy Studies. The ECN Policy
                 Studies Unit employs some 60 scientific staff of various disciplines. ECN Policy Studies has
                 extensive experience in various domains, among which renewable energy, energy and
                 environmental policy design and energy systems modeling, sector studies on renewables and
                 energy efficiency, policy instrument evaluation and the liberalisation of energy markets.
                 Traditionally, ECN Policy Studies has a unique position to bridge between technological change
                 and the associated policy challenges.

2   March 2012   4.646.1 – Oil reporting for the FQD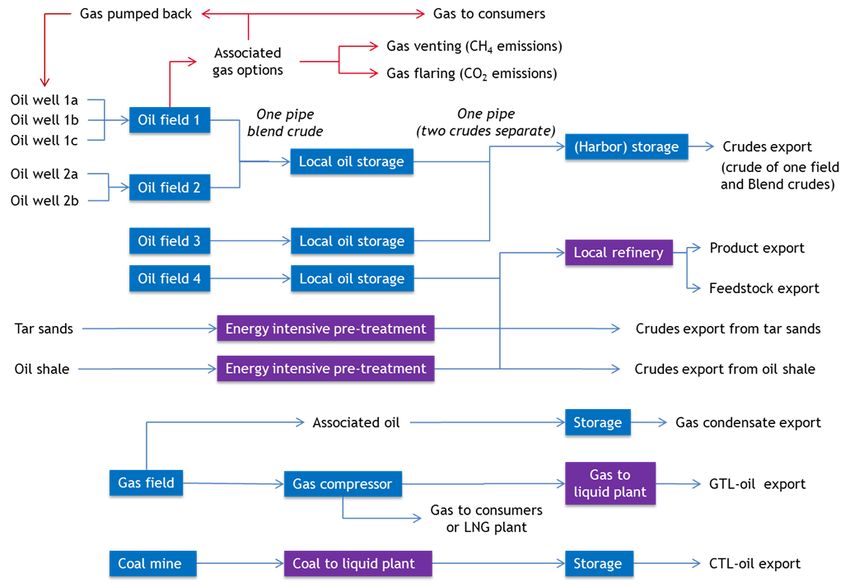
Contents
                 Summary                                                  5

          1      Introduction                                             7
          1.1    Context and purpose of this study                        7
          1.2    The Commission’s proposal                                8

          2      An overview of the oil trade and refining,
                 and current reporting practice                          11
          2.1    Introduction                                            11
          2.2    Oil exploration, production and refining                12
          2.3    Current reporting practice                              19
          2.4    Conclusions                                             28

          3      Efforts and cost of crude oil source reporting          29
          3.1    Introduction                                            29
          3.2    Data gaps                                               29
          3.3    Actions needed to fill the data gaps                    30
          3.4    Administrative efforts required                         31
          3.5    Conclusions                                             35

          4      Other impacts on the refinery industry                  37
          4.1    Introduction                                            37
          4.2    Measures to meet the FQD                                37
          4.3    Potential impacts on the oil market and EU refineries   39
          4.4    Conclusions                                             40

          5      Conclusions and recommendations                         41
          5.1    Conclusions                                             41
          5.2    Next steps                                              43

                 References                                              45

3   March 2012   4.646.1 – Oil reporting for the FQD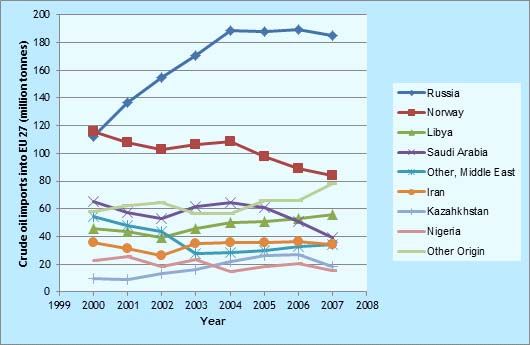
4 March 2012 4.646.1 – Oil reporting for the FQD
Summary
Introduction
In 2009, the European Union (EU) adopted the Fuel Quality Directive
(FQD, directive 2009/30/EC). Among other things, this directive requires oil
companies to reduce the average well-to-wheel greenhouse gas (GHG)
emissions of the road transport fuels sold in the EU, by 6-10% between 2010
and 2020, and to report on the carbon intensity of these fuels. It is one of the
key pillars under EU climate policy in transport, next to the CO2 standards in
cars and light duty vehicles and a target of 10% renewable energy in this sector
in 2020, as defined in the Renewable Energy Directive (RED).
The Fuel Quality Directive includes detailed reporting and calculation
methodologies for biofuels and a set of mandatory sustainability criteria.
In addition, the European Commission proposed a directive in October 2011
which provides detailed implementing measures for fossil fuels. This draft
proposal is currently under discussion in the Environmental Council of the EU.
It provides default GHG intensity values for various types of fossil fuel
feedstocks, reporting obligations for fuel suppliers and Member States, and a
baseline for 2010 GHG intensity to which GHG emissions should be compared.
This draft proposal led to a debate on the need to distinguish between fuel
sources based on their origin and GHG intensity and regarding the
administrative burden that implementation of this directive would cause.
This study addresses part of the issues that are debated: it assesses the
administrative burden and practical feasibility, and broadly explores the
potential effects of the proposal on the EU refining sector. This study is based
on literature research, combined with interviews with stakeholders and
experts, and was commissioned by Transport & Environment.
Administrative efforts required
To assess practical feasibility and administrative practice, an overview was
made of the most relevant issues in the life cycle of fossil fuels. The FQD draft
proposal requires that the fuel suppliers report the origin, feedstock and GHG
intensity of the fuels supplied to the market, so any reporting system should
be able to transmit this information along the chain of transport, processing,
refining and finally distribution to the consumers.
Comparing the requirements with the current reporting practice, it is
concluded that for a large share of the fuels, the necessary data are already
being reported to customs and Member States authorities. Reporting of oil
sources is, however, not yet in place for the following:
Final products (e.g. diesel and gasoline) imported into the EU.
Intermediate products imported into the EU. These are oil-based products
that have undergone processing outside the EU and are imported to be
used as feedstock in EU refineries1.
Petroleum-based feedstock from the chemical industry. The volume of
these streams is relatively small, but they are also feedstock for transport
fuels and thus part of the FQD reporting and GHG reduction obligation.
The volumes of the first two streams are significant: 20 to 25% compared to
total EU crude intake.
1
For example, oil produced in the Middle East is transported to Russia, to be processed in a
refinery to an intermediate product or fuel. This is then imported into the EU, where the
intermediate is processed further in an EU refinery and the fuel is distributed to end users.
5 March 2012 4.646.1 – Oil reporting for the FQD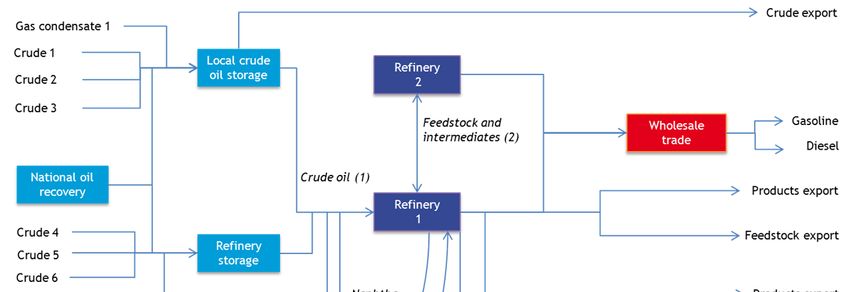
Apart from reporting to governments, large integrated oil companies monitor
                 and report GHG emissions upstream and overall. While GHG intensities of their
                 fuels are published in sustainability reports, they do not necessarily track fuel
                 origin throughout the supply chain. Although these reports are verified through
                 external assurance there is no harmonised and accepted industry standard.

                 This assessment leads to the conclusion that for the EU fuel suppliers the cost
                 of reporting, as described in the draft FQD proposal, amounts to a total of
                 approximately M€ 40-80 annually. This is about €ct 0.8-1.6 per barrel of
                 imported oil, or about one quarter to half a Eurocent per full tank of 50 litre
                 fuel.

                 Other impacts on the oil industry – upstream and downstream
                 Besides administrative cost, there is also the cost of meeting the target of
                 GHG mitigation. With the current proposal, fuel suppliers can choose from
                 quite a wide range of options: adding more biofuels, choosing biofuels with
                 relatively low GHG intensity, reducing venting and flaring, shifting to electric
                 transport or shifting to fossil fuels with low carbon intensity.

                 The current proposal allows almost all WTW GHG mitigation measures to
                 contribute to the target2. This can have a positive impact on GHG mitigation
                 cost: fuel suppliers can implement the most cost effective measures given
                 their specific circumstances. Increasing the use of fossil fuels with low GHG
                 intensity is one of the options available to them. However, it can also be
                 expected to increase cost for fuel suppliers that want to rely on high carbon
                 fuels in the future, as they would have to take compensation measures to
                 meet the FQD target. This will affect oil prices and result in a growing price
                 differential in favour of the low GHG intensity crudes. It is therefore important
                 to maintain a level playing field between refineries and fuel suppliers, both
                 within and outside of the EU: non-EU refineries should be treated the same as
                 refineries inside the EU. If this is not the case, suppliers may get a competitive
                 advantage by unaccounted exports of high carbon fuels to the EU. These kinds
                 of impacts can be prevented by ensuring that all fuels and oil streams placed
                 on the EU market use the same methodology to determine GHG intensity.

                 The proposal will have very limited impact on the origin of the EU’s fossil fuels
                 in the short term. However, it may impact investment decisions in the
                 industry, and provide a sound basis to regulate and control CO2 emissions of
                 transport fuels in the future, where the share of unconventional oil is
                 predicted to increase.

                 Recommendations
                 Supplier reporting of CO2 intensity along the lines of the draft FQD proposal
                 can be implemented at a relatively limited cost. The proposal will, however,
                 benefit from a more detailed elaboration on accounting methodology and
                 assurance standards. Furthermore, it is recommended to include a rule on how
                 to deal with fuels for which the origin and GHG intensity is not reported. Also,
                 the potential role of the Member States in steering their national fuel mix
                 towards fuels and other energy sources with low GHG intensity – although
                 outside the scope of this study - should not be overlooked. In the FQD, fuel
                 suppliers are made responsible and accountable for well-to-wheel GHG
                 intensity, whereas it is the Member States that effectively control tank-to-
                 wheel emissions by supporting different types of fuels and cars (e.g. electric
                 and natural gas vehicles).

                 2
                      Note that GHG mitigation of oil transport, storage, refining and distribution is not included,
                      even though there is potential in these parts of the fuel life cycle as well.

6   March 2012   4.646.1 – Oil reporting for the FQD
1 Introduction
1.1 Context and purpose of this study
In 2009, the EU has adopted the Fuel Quality Directive (FQD, directive
2009/30/EC), which, among other things, requires oil companies to reduce the
average well-to-tank GHG emissions of the road transport fuels sold in the EU,
by 6-10% between 2010 and 20203. The baseline emission value and overall
reporting and calculation methodology to be used were not yet provided, only
for biofuels.
This directive is one of the key pillars under EU climate policy in transport,
next to the CO2 standards in cars and light duty vehicles, and the Renewable
Energy Directive that sets a target of 10% renewable energy in this sector for
2020.
The GHG calculation methodology provided for biofuels was quite detailed,
but nevertheless led to much debate, especially regarding the incorporation of
indirect land use change emissions. By far the largest share of the EU’s
transport fuels is, however, from fossil origin, where no GHG calculation
methodology was given yet in the 2009 legislation. The European Union is now
preparing a directive that provides detailed definitions and GHG calculation
methodologies for fossil fuels, that both fuel suppliers and Member States will
have to adhere to.
In October 2011, a draft of this proposal of implementing measures was
published (although not in the public domain). This proposal provides different
default emission factors for different types of fuel origin, summarised in
Section 1.2, ranging from conventional crude to oil shale, natural bitumen and
CTL (coal converted to liquid fuel). It also further details how and what
suppliers and Member States should report, and defines the 2010 baseline
emissions.
The FQD and this draft proposal have led to a strong debate between various
stakeholders, the Commission and Member States, on the need to distinguish
between different oil sources, on the GHG emission factors but also on the
administrative burden and cost to the fuel suppliers that this draft directive
would cause.
Transport & Environment commissioned a consortium of CE Delft, Carbon
Matters and ECN to carry out a study with the following key objectives:
to assess the practical feasibility of the EC proposal;
to estimate the administrative cost to fuel suppliers;
to broadly explore the potential effects of the proposal on the oil refinery
sector and fuel cost.
3
6% of this target is mandatory, the rest is indicative, to be achieved in non-road transport,
with technological options such as CCS and through CDM.
7 March 2012 4.646.1 – Oil reporting for the FQDThis report is based on literature research, combined with interviews with oil
industry representatives (including Europia), government representative (incl.
customs and statistics), independent assurance providers and a research
institute. Note that biofuel sustainability data reporting requirements (incl.
GHG emissions) fall under the RED and are additional to the FQD requirements.
This report focusses on the fossil fuel reporting only.
1.2 The Commission’s proposal
The EU FQD directive 78/90/EC (amended in 2009 with directive 2009/30/EC)
puts in place two different, but related measures regarding the well-to-wheel
greenhouse gas (GHG) emissions of transport fuels:
1. A reporting obligation of crude/product origin and CO2/MJ content for
transportation fuels (diesel/petrol, including biofuels, and electricity) for
fuel suppliers.
2. A 10% (6+2+2) target for reduction in CO2/MJ between 2011 and 2020
compared to the EU average in 2010. Of these 10%, 6% are mandatory, four
are optional (given as ‘indicative targets’).
In the EC proposal, a European overall average 2010 baseline for petrol and
diesel has been established at 88.3 gr average CO2/MJ on a life cycle basis.
This average currently virtually excludes high CO2 intensity feedstocks as well
as the 4.7% biofuels4, currently achieved in petrol/diesel transportation fuels
in 2010 (see Annex II of the proposal). Note that the directive is limited to
road transport fuels, and does not address fuels used in waterway transport or
other modes.
In order to arrive at the required 6% reduction in g CO2/MJ in Member States,
European fuel suppliers would have to report annual averages of:
volume of each fuel supplied distinguished by feedstock;
electric energy (with a signed statement from the first vehicle owner);
fuel or electric energy type;
greenhouse gas intensity for energy other than biofuels (calculated in
accordance with the rules set out in the directive);
GHG intensity of biofuels (also calculated in line with the rules set out in
the directive);
simultaneous co-processing of fossil fuels and biofuels;
upstream emission reductions;
place of purchase for fossil fuels and biofuels;
annual reports of: origin of fuel or energy, defined as the type of feedstock
used to produce the fuel or energy;
periodic (i.e. less frequent) reports of: origin of fuel or energy in more
detail, including information on the sources supplying the feedstock as
well as the processing it undergoes, where the definition of sources include
data on oil/gas field or group.
Suppliers are, in most cases, the entity responsible for passing fuel or energy
through an excise duty point5. Note that this list only provides an overview,
more detailed information can be found in the proposal.
Member States then have to transmit this information to the European
Environmental Agency.
4
EurObserv'ER, 2011: Biofuels Barometer.
5
Or, if no excise is due, any other relevant entity designated by a Member State.
8 March 2012 4.646.1 – Oil reporting for the FQDA range of different crude types are distinguished:
conventional crude6;
natural bitumen (tar sand oil);
oil shale;
LPG and LNG/CNG from any fossil sources;
coal converted to liquid fuel (CTL), both with and without CCS of process
emissions;
natural gas converted to liquid fuel (GTL).
Default values of GHG intensity are given for each of these crude types to
products routes.
In addition, the proposal provides default GHG intensity values for natural gas
and coal converted to hydrogen, waste plastic to liquid transport fuel, and for
electricity production in the various Member States.
Similar policies in the USA and Canada
California: LCFS
In 2009, the California Air Resources Board (CARB) approved the Low Carbon Fuels Standard
(LCFS). The LCFS directive calls for a reduction of at least 10% in the carbon intensity of
California's transportation fuels by 2020. Providers of transport fuels must track the fuels’
carbon intensity of all fuels provided, through a system of credits and deficits. They must
meet the carbon intensity standards annually, and credits may be banked and traded within
the LCFS market. Rules and carbon intensity reference values were developed and approved in
2009, and came into force on January 1, 2011. However, lawsuits were filed, challenging the
constitutionality of the LCFS. In December 2011, a federal judge granted a preliminary
injunction against its implementation, concluding that the regulation ‘treads into the province
and powers of our federal government, reaches beyond its boundaries to regulate activity
wholly outside its borders’ – an argument that is relevant only in the US/California situation,
and not for EU policy.
Fossil fuels are differentiated, to into high carbon intensity value crude oils (HCICO) and low
carbon intensity fuels.
Practical experience with this system is still limited, but ICCT, 2011 reports that in April 2011,
the Californian market had already started to differentiate high carbon intensity fuels from
low carbon intensity fuels: corn ethanol with about 90 g CO2/MJ cost $ct 2-3 more per gallon
than corn ethanol with a carbon intensity of about 98 g CO2/MJ, as the first are now more
attractive to use than the latter.
Other states and regions in the US have shown interest to follow this example, but no one has
yet implemented it into regulation.
Canada
Two Canadian provinces, Ontario and British Columbia, have expressed their intent to follow
the Californian LCFS example.
USA: EISA
As part of the Energy Independence and Security Act of 2007 (EISA 2007), Section 526 prohibits
Federal agencies from procuring alternative or synfuel unless its life cycle GHG emissions are
less than those for conventional petroleum sources:
‘No Federal agency shall enter into a contract for procurement of an alternative or synthetic
fuel, including a fuel produced from nonconventional petroleum sources, for any mobility-
related use, other than for research or testing, unless the contract specifies that the lifecycle
greenhouse gas emissions associated with the production and combustion of the fuel supplied
under the contract must, on an ongoing basis, be less than or equal to such emissions from
the equivalent conventional fuel produced from conventional petroleum sources.’
6
Definitions of these categories are provided in the FQD.
9 March 2012 4.646.1 – Oil reporting for the FQDThis section is mainly relevant for fuels procured by the US military.
There has been some uncertainty about what exactly is covered by this article, and the US
Defense Energy Support Center (DESC) provides three possible interpretations in (LMI, 2009):
the Department of Defense is only constrained from specifically contracting for products
produced from oil sands crude;
products supplied to DESC cannot be predominantly produced from oil sands crude;
products supplied to DESC can contain only incidental amounts of oil sands crude.
LMI conclude that DESC’s bulk fuel purchases of fuels will be importantly affected by which of
these interpretations governs.
This section 526 has recently been under debate, but it is still in force (see, for example:
http://www.api.org/news-and-media/news/newsitems/2011/may-2011/api-repeal-of-
section-526.aspx
http://www.pewenvironment.org/news-room/fact-sheets/protect-section-526-for-
americas-national-and-energy-security-85899361870
http://www.whitehouse.gov/blog/2011/07/15/national-security-and-fuels-future-
importance-sec-526
Sources:
http://www1.eere.energy.gov/femp/regulations/eisa.html
ICCT, 2009
ICCT, 2011
10 March 2012 4.646.1 – Oil reporting for the FQD2 An overview of the oil trade and
refining, and current reporting
practice
2.1 Introduction
To determine the potential effort needed to monitor the source and origin of
fuels, this chapter provides an overview of the most relevant issues regarding
the global oil market, including exploration, refining and trade.
The aim is
to provide insight into the well-to-tank, and into current practices of crude
oil and product blending throughout this part of the oil’s life cycle; and
to assess what kind of relevant monitoring is already in place.
Well-to-tank is defined here as the part of the oil’s life cycle from its
production (typically at an oil well) to the point where the fuel is being filled
into the vehicle (the fuel tank).
The FQD reporting measures require tracking feedstock origin as the crude
moves along the supply chain during transportation, processing, refining, and
distribution. Data transfer along this chain of custody is not uncommon in the
industry, as GHG emissions are already being tracked for the voluntary
sustainability reporting that many major oil companies adhere to. However,
even though this voluntary reporting also provides data on GHG intensity of
the fuels, is not compliant with the draft FQD proposal. It reports GHG
emissions upstream as well as overall but does not track the origin of the
product as intended by the FQD. The integrated oil companies reporting GHG
emissions have not yet agreed on a harmonised methodology. Some reports on
‘equity’ basis while others choose ‘operatorship’7.
In its simplest form, compliance with the FQD reporting measures means
passing along information on feedstock origin along the supply chain as
ownership is transferred. This is not complicated when the oil streams move
along a straightforward route. In instances of blending, however, where crude
oils or intermediate products are blended and processed, the complexity
increases. There, the relative contribution of the different inputs must be
determined prior to transferring ownership of the output. For example, a
refinery that processes crude oil from 20-30 different sources on an annual
basis, and 1-5 sources at the same time, will need to monitor the inputs in
terms of feedstock origin - information mostly in its possession - and associate
them with the outputs before transfer. The global nature of the industry, one
in which blending and processing occur in different countries and streams
enter the EU at different stages, would seem to pose challenges to this
system. However, substantial amounts of information and systems for
conveying it are already in place, meaning that the FQD reporting measures
essentially require an additional data set to be included. The extent of the
administrative burden required to fill the ‘data gap’ and ensure compliance
with FQD objectives is thus relatively limited, and parallel to existing data
streams.
7
Emissions allocation on equity basis relates to (partial) financial ownership of facilities or
sites. Emissions allocation on operational basis allocates emissions to effective operational
leading company in running respective site or facilities.
11 March 2012 4.646.1 – Oil reporting for the FQDFor the purpose of this study, the points of blending, processing and trade are
the most relevant in the oil-to-fuel chain, as these are the points where
information about oil sources would need to be combined, managed and
transferred from one owner to another. Reporting and monitoring practices
currently in place within the EU require information on imports and exports in
addition to oil production data – the feedstock requirement in the FQD
reporting measures will supplement this information and data with an
additional element, and add reporting requirements to intermediate products
and end products. The current reporting requirements and practices will be
described in Section 2.3.
2.2 Oil exploration, production and refining
The European oil industry and oil trade is mainly based on foreign oil
exploration and production: dependency on oil imports reached 83.5% in 2009
(EC, 2011). As Figure 1 illustrates, most of the imports are currently (2011)
from the Russian Federation, followed by Norway and Libya, Saudi Arabia,
Kazakhstan and Nigeria. This picture changes over the years, though, as the
graph in Figure 2 shows.
Figure 1 Oil imports into the EU
% of Total Imports
Other; 16%
Russian
Federation; 31%
Iran; 4%
Azerbaijan; 4%
Nigeria; 6%
Kazakhstan; 7%
Norway; 12%
Saudi Arabia; 7%
Libya; 10%
Source: Data from EU DG Energy,
http://ec.europa.eu/energy/observatory/oil/import_export_en.htm
12 March 2012 4.646.1 – Oil reporting for the FQDFigure 2 Oil imports into the EU-27 over time
Source: Data from the EU Energy Pocket Book 2010
http://ec.europa.eu/energy/publications/statistics/statistics_en.htm
2.2.1 Oil exploration, production and refining outside the EU
In Figure 3, a schematic diagram of foreign oil exploration, production and
refining is given.
Figure 3 Diagram of oil exploration and export
13 March 2012 4.646.1 – Oil reporting for the FQDLooking at Figure 3, seven relevant types of oil can be distinguished in oil
export:
crude from one field;
a blend crude from different oil fields;
products of a foreign refinery;
feedstocks or intermediate oil stream from a foreign refinery;
GTL oil products made from natural gas;
CTL oil products made from coal.
All steps in the diagram need energy and lead to GHG emissions. The crude
can be either conventional or unconventional (e.g. from tar sands or oil
shales), although in the latter case there may be a need for a separate
pre-processing step to make it suitable as feedstock for refineries.
In the conventional oil chain, a main source of emissions is the associated gas
produced during the oil production. The FQD also specifically mentions this
emission source. If there are no customers in the direct area the best option is
to pump it back in the field, to keep the oil on pressure (also illustrated in
Figure 3). Another option is to flare this gas, which leads to a substantial
amount of CO2 emission. A last option is to vent it directly into the
atmosphere. As this gas is mainly methane, CH4, which has a large global
warming potential, this flaring and venting may lead to very significant GHG
emissions. Note that these conventional oils are typically blended at various
points, for example when oil from various wells and fields are transported
through one pipeline, or at storage facilities.
Instead of a conventional crude, tar sand oil or oil shale can also be the source
of the imported products or crude. These oil types typically lead to higher
GHG emissions than conventional oil, as both oil production and its
pre-treatment are particularly energy intensive, as shown in various
publications such as Brandt, 2011; S&T, 2011. Normally ‘crudes’ made from tar
sand or oil shale (also known as synthetic crudes) are not imported in the
European Union as European refineries do not have the (technical) capability
of processing such crudes. They are either refined in specialised refineries
(outside the EU) or pre-processed to make it suitable for a wider range of
refineries. Technically, some refineries may be able to process a limited share
of these oils (mixed with other crudes), but this is currently not an interesting
route from an economical perspective.
Sometimes crudes from several fields are blended together to form a local
blend crude. Note that it is not necessary to blend crudes if there is only one
pipeline available. Crudes can be pumped through one pipeline in separate
batches.
When gas or coal is converted to a liquid fuel using Gas to Liquid (GTL) or Coal
to Liquid (CTL) processes, the conversion processes require energy which
typically also lead to relatively high GHG emissions. GTL is a high value
blending component which is separately imported for dedicated blending and
therefore easily tracked. CTL is normally not exported to Europe.
14 March 2012 4.646.1 – Oil reporting for the FQDOil shales production and use in the EU
Estonia is one of the main oil shale producers in the world. More than 90% of the electricity
produced in Estonia comes from oil shale, and 80% of oil shale used globally is extracted in
Estonia.
Only a relatively small part of current oil shale production is used for oil, but this may well
change in the coming decade, as Estonia has plans to develop the oil shale technology further,
and shift use from electricity production towards the transport sector.
Oil shale deposits can be found in many parts of the world, with the bulk of the world’s oil
shale resources in the USA.
Sources:
OGJ, March 2011 (http://petroleuminsights.blogspot.com/2011/03/estonian-company-
plans-utah-oil-shale.html)
http://www.mkm.ee/june-8th-2009-oil-shale-conference-in-tallinn-univer/
IEA, 2009
http://www.stat.ee/49452
2.2.2 Oil refining
The total import of crude and gas condensate in the EU-27 in 2009 was 570
Mtoe, 100 Mtoe was produced inside the EU. With the export of 50 Mtoe, this
results in an gross inland consumption of 620 Mtoe. The import of oil products
was about 130 Mtoe, somewhat more than the export of 110 Mtoe. The import
and export of oil products between EU-27 countries was about 180 Mtoe.
Oil products can be used for energy production but can also be used as a
feedstock for refineries, as a feedstock for the petrochemical industry
(producing basic chemicals and blending components for gasoline) and as a
blending component for wholesale trade8.
Currently there are over 190 important types of crude oils in world trade
(OGJ, 2011a). Because every crude has its own properties and conversion
profile in refinery processes, a refinery needs to know the source of the crude
they buy. With the official name of the crude also the country of origin and
the state, region or province are known (or can be traced). So even if a crude
is resold five times during sea transport and is pumped from one vessel into
another at open sea, this information is not lost. However, the number of
crudes is much higher. Oil & Gas Journal mentions over 6,000 important oil
fields in the world. Specifically, in the USA there are 39,791 oil fields with
373,648 producing oil wells (OGJ, 2011b).
Next to crude, a relative small amount of gas condensates is used as refinery
input. These are a side stream of natural gas production. Gas condensates may
come from different fields and are blended prior to export or processing. For
condensate it is important that a GHG emission allocation takes place between
oil and gas at production. This complication is not covered by the draft FQD
proposal9.
8
To illustrated the amounts. In the Netherlands the refineries use about 7% feedstocks.
This is about the same amount as the production of oil products from the petrochemical
industry, which sell it to refineries or wholesale trade. Compared to the Dutch refinery
production about 10% of the oil products is blended in the wholesale trade.
So for about 17% of the oil production the crude is not directly known.
9
It is, however, covered under the WRI/GHG reporting method.
15 March 2012 4.646.1 – Oil reporting for the FQDAs mentioned in the previous section, refineries sometimes use different
crudes at the same time. In addition intermediate products are exchanged
between refineries (both within the EU and between non-EU and EU refineries)
and co-fed to the refinery crude intake at relevant unit feed streams for
further processing. Information on feedstock origin is known to the first refiner
and other qualities of the inputs are tracked, but incomplete information-
management practices on feedstock may result in the information not being
transferred. The data will only be available in case the first refinery uses one
local crude. An overview of the relevant Eurostat statistics is shown in Table 1.
Compared to the crude use, the statistics mention about 3% refinery feedstock
import in the EU-27. Next to this, also petroleum products might be used as a
feedstock. This is about 19% compared to the crude use10. From a substantial
amount of oil products the Eurostat statistics do not specify the country of
import of export. The not specified import is 3% of the crude use.
From these data, it is concluded that the volumes of the intermediate and
product imports are significant, about 20 to 25% compared to total EU crude
intake. The import from outside the EU-27 (including not specified) is 6% for
motor gasoline (compared to a total gasoline refinery production of 125 mln.
ton) and 14% for transport diesel (refinery production is 162 mln. ton).
However, also other oil products might be imported and used for gasoline and
diesel.
Table 1 Import of Petroleum products in the EU-27 in 2010 (data source: Eurostat, compiled by ECN)
Year 2010 (mln. ton) Import Export
Outside In Not Outside In Not
EU-27 EU-27 specified EU-27 EU-27 specified
Crude and feedstocks 544.8 48.0 0.9 16.9 47.0 0.3
Crude oil 519.9 36.9 0.2 12.0 35.5 0.2
Natural Gas Liquids 7.5 2.8 0.0 0.3 1.6 0.3
Refinery Feedstocks 17.4 8.4 0.7 4.6 9.9 -0.2
All petroleum products 117.1 176.8 18.8 107.2 156.9 24.2
LPG 9.7 4.3 0.1 1.7 4.3 0.0
Naphta 14.0 17.7 1.6 3.9 12.1 4.4
Motor Gasoline 2.3 18.3 5.2 40.7 18.6 7.9
Kerosenes - Jet Fuels 17.7 12.5 3.1 3.1 8.2 3.8
Gas/Diesel oil 38.6 73.3 3.4 23.1 59.7 3.9
of which transport diesel 24.5 47.3 2.8 10.7 34.7 3.0
Residual Fuel Oil 22.2 33.9 5.4 27.6 35.3 3.1
Other petroleum products 11.6 15.5 0.6 6.8 18.0 1.8
Not specified 1.0 1.3 -0.6 0.4 0.7 -0.7
Biofuels 0.1 0.5 0.0 0.0 0.3 0.0
Biogasoline 0.0 0.1 0.0 0.0 0.1 0.0
Biodiesel 0.1 0.5 0.0 0.0 0.2 0.0
10
Note that in the statistics, intermediate and final products are not differentiated. Also, the
difference is not always clear. For instance, an important part of diesel/gasoil from Russia is
reprocessed in European refineries to lower the sulphur content.
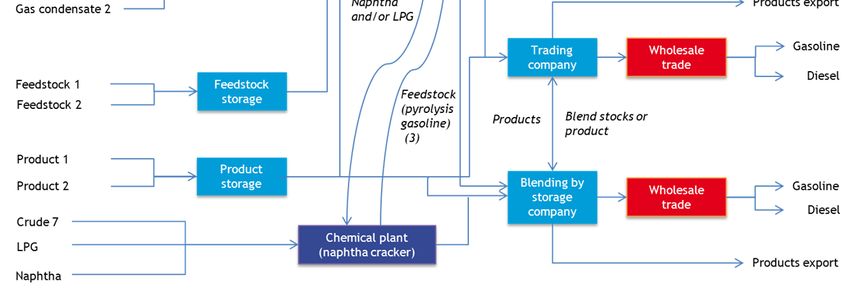
16 March 2012 4.646.1 – Oil reporting for the FQDFigure 4 shows which oil streams can typically be imported in an EU country.
Together with any oil produced nationally, this can be fed into the refineries
or exported to another country. However, not only the refineries produce oil
products, also chemical plants produce blend stocks for gasoline. Finally
storage and trading companies can make their own product by blending
different oil streams or blending components. Unfortunately, a clear overview
of the volumes of the various streams in the EU is not available. Many relevant
data are available at Eurostat, but these are not easy to compile and analyse
due to the complexity of the market.
The excise duty point is the last point where the supplier can submit upstream
and refining CO2/MJ data to a designated authority with the upstream (well-
to-tank) GHG intensity values given in the FQD proposal. Beyond this point, the
supplier does not have any direct control anymore, reaching FQD targets (well-
to-wheel) from here the resulting GHG intensity (LCA basis) depends on the
national car fleet composition and transport related policies of the Member
State.
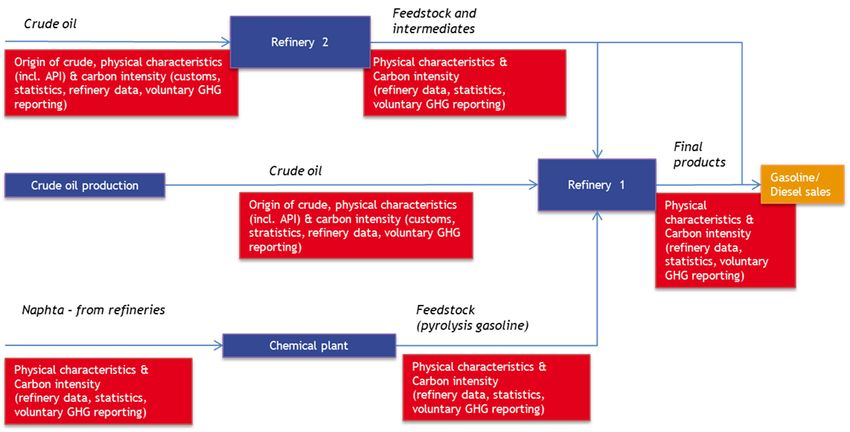
A schematic overview of the various feedstock and product streams in- and out
of refineries is given in Figure 4.
17 March 2012 4.646.1 – Oil reporting for the FQDFigure 4 Diagram of oil streams into refineries, and their output (see Figure 6 for a simplified version with data availability included)
refineries process crude oil [1], feedstock and intermediates from other refineries [2] and feedstock from chemical plants [3];
different types of crude oil and feedstock, and oil from various sources can be blended before final processing;
oil, products etc. may be stored and traded at various points in the life cycle;
part of refinery output is used as feedstock for chemical plants;
country and EU borders may be anywhere in this graph.
18 March 2012 4.646.1 – Oil reporting for the FQDAn illustration: some key data of the refinery sector in the Netherlands
In the Netherlands, with 8% of the EU refinery capacity, there are for instance six refineries,
three naphtha cracker locations (with together six crackers) and about 100 companies in the
wholesale trade of oil products11. This number is relatively high due to the large refinery
sector, which produces large quantities of products for export, has large storage facilities and
a very significant bunker fuels market.
In 2010, 2,200 oil tanker ships visited the port of Rotterdam. About 1,100 were < 80,000 DWT
and mainly used as product tankers. About 1,100 were larger (> 80,000 DWT), and mainly used
for crude transport. These are about 100 crude oil tankers per month delivering ≈50 different
crudes (Havenbedrijf Rotterdam, 2011).
Of the global total of 655 refineries mentioned in the Oil & Gas Journal
(OGJ, 2011c), 109 (16,5%) are located in the EU-27. Of the world capacity of
ethylene production by steam cracking, 29% is located in the European Union.
The 54 EU crackers are situated at 44 locations (Seddan, 2010). Therefore, we
conclude that if the FQD requires oil origin reporting for all fuels sold in the
EU, for at least 153 European locations detailed data has to be calculated on
use of crude and feedstock, and the related production of gasoline, diesel and
related oil streams and the emissions in the production process related to
these oil streams. This could be, for example, a monthly balance corrected for
oil volumes in storage tanks.
2.3 Current reporting practice
Several laws and regulations require information on imported products placed
on the European marketplace, including origin, tariff classification, mass or
volume, and physical characteristics. This means that robust systems have
already been created for communicating this information along the supply
chain, and other systems are created to ensure its accuracy in the instance of
a challenge by competent authorities at customs or elsewhere.
Given this context, the main questions raised by the FQD reporting measures
are twofold: whether the available information is sufficient to comply with
reporting obligations on feedstock origin, if not, what modifications are
needed to the existing systems to track and convey feedstock origin along with
the other required information that is provided. As shown below, given the
construct of the current laws and regulations, a significant part of the required
information is available upon importation and, once in the European
marketplace, additional obligations ensure this information transferred
through the chain of custody as it moves about the European Union. Additional
efforts may be required, however, to make it more systematically accessible
and to ensure that all feedstocks for transport fuel production are included, as
(implicitly) required by the FQD.
2.3.1 Customs legislation
Due to globalisation of the industrial world, the origin of a product is not
always easy to determine. Products move across borders, undergo
transformation into new products, and then move across borders again. But
rules have been crafted to facilitate the determination of origin for trade and
environmental purposes. In addition, from a trade perspective, customs
legislation is the basis for taxation of imported goods and for compilation of
11
Source Statistics Netherlands. Many companies can be found at:
http://www.webtop20.nl/groothandel_olie_en_benzine/
19 March 2012 4.646.1 - Oil reporting for the FQDnational and EU statistics on trade. Several systems are in place with
relevance to the FQD reporting measures.
Combined Nomenclature (CN)
In EU customs legislation, the Combined Nomenclature (CN) is critical in the
categorisation of oil types. This CN consists is based on the Harmonised
Commodity Description and Coding System (HS), which is developed and
maintained by the World Customs Organisation (WCO). The HS system classifies
goods by using a division of sections and chapters and by the use of digit
codes. The 170 members of the WCO have committed themselves to use this
classification system, but are allowed to differentiate the height of tariff
duties. This system has been adopted by the European Union and extended
with additional divisions in the CN. Each CN subdivision has its own 8-digit
code accompanied by a description. The list of CN-codes is updated annually,
following the update of the HS-system.
The CN-codes should be used when importing or exporting goods into or out of
the European Union.12 On the one hand CN-codes help to determine tariff
duties and play an important role in trade negotiations at the WTO level.
On the other hand the CN-coding system is also used for statistical purposes.
The codes that are relevant for fossil oil are in Section V (mineral products),
chapter 27. ‘Mineral fuels, mineral oils and products of their distillation;
bituminous substances; mineral waxes’13, and are given in Table 2. According
to the Dutch national law implementing the Fuel Quality Directive, at the
national level the CN-code for LPG is 2709 00 00. For CNG, LNG and GTL-diesel
this is CN-code 2711 21 00.14
Table 2 CN-codes for crude oil and crude feedstocks
Code Name
2707 99 Other: Crude oils:
2707 99 11 Crude light oils of which 90 % or more by volume distils at temperatures
of up to 200°C
2707 99 19 Other
2709 00 Petroleum oils and oils obtained from bituminous minerals, crude
2709 00 10 Natural gas condensates
2709 00 90 Other
2711 Petroleum gases and other gaseous hydrocarbons
2711 21 00 Natural gas
2714 Bitumen and asphalt, natural; bituminous or oil-shale and tar sands;
asphaltites and asphaltic rocks
2714 10 00 Bituminous or oil-shale and tar sands
2714 90 00 Other
Therefore, natural bitumen and oil shale are classified under the same
CN-code and crude oil has its own code. There are no specific CN-codes (yet)
for CTL- or GTL-based fuels, these are reported together combined with other
product types.
12
http://ec.europa.eu/taxation_customs/customs/customs_duties/tariff_aspects/
combined_nomenclature/ _en.htm
13
http://www.cbs.nl/NR/rdonlyres/40D2B18B-725A-44DF-880A-19793529835F/0/cn10en05.pdf
14
http://wetten.overheid.nl/BWBR0029916/geldigheidsdatum_02-09-2011
20 March 2012 4.646.1 - Oil reporting for the FQDProof of Origin
In order to assess the classification of goods a proof of origin is required.
This customs declaration and other documentation should be verified by the
customs authorities. The Modernised Customs Code contains several articles
dealing with the origin, such as Articles 35-38, which set out the concept of
acquisition of origin and the obligation to report it:
‘Goods wholly obtained in a single country or territory shall be regarded as
having their origin in that country or territory.’
‘Goods the production of which involved more than one country or
territory shall be deemed to originate in the country or territory where
they underwent their last substantial transformation.'
Because of the concept of substantial transformation, a review of customs
declarations might not provide enough information regarding place of oil
extraction. This could be relevant for, for example, Canadian tar sands
extracted and processed domestically before undergoing further refining in the
United States, and then imported into the EU. The European Commission is
charged with adopting measures for the implementation of the acquisition of
origin, including the concept of substantial transformation – until then it will
remain a point of discussion. Nevertheless, in Article 37, the Modernised
Customs Code allows customs authorities to require importers to provide
additional information to prove the indication of origin is accurate.15 Overall it
can be concluded that customs legislation includes the need to provide proof
of origin and the underlying origin of any good when required by competent
authorities.
Commodity code
An important source of information is the commodity code, because origin and
CN-code are combined here. The commodity code includes the CN-code and
two additional numbers for the Taric-code (Integrated Tariff of the European
Communities16). After this code there is space for 4 numbers (first additional
Taric-code), for two numbers (second additional Taric-code), and 4 numbers
Additional national code17. In case of oil, the additional codes are used for oil
products with special tax tariffs. So in case of crude oil the combination of the
CN-code (see Table 2) and the country code can give general information of
the source of the oil.
2.3.2 Administration in relation to movement of goods
Entry of goods
Before the Entry of goods in the European Union an Entry summary
declaration (ENS) has to be completed (for bulk goods four hours prior to
arrival in the first EU port) and send to the local entry customs office. Mineral
oil is an acceptable description in this summary18. Main target for this
declaration is to select which loads are checked by the customs authority.
Also in other forms general information about the ship, its travel, load and
crew is needed.
15
http://eur-lex.europa.eu/LexUriServ/LexUriServ.do?uri=OJ:L:
2008:145:0001:0064:EN:PDF
16
http://en.wikipedia.org/wiki/TARIC_code
17
http://www.douane.nl/bibliotheek/handboeken/handboek_douane/hd_6-00-00-06.html
18
http://ec.europa.eu/taxation_customs/resources/documents/customs/
policy_issues/customs_security/acceptable_goods_description_guidelines_en.pdf
21 March 2012 4.646.1 - Oil reporting for the FQDIt is possible that the country of entry of goods (first EU country in which a
ship arrives) is not the same country as that of the import of goods. However,
in the first EU harbour, it must be clear what the destination of the goods is
and how the goods are transported (e.g. by ship, train, pipeline or truck) to
the importing country. This declaration is not needed for goods which enter by
pipelines or for goods from Norway19. If the goods are unloaded for storage a
Declaration for temporary storage (SAL) is needed. For temporary storage
entered by sea, next steps are needed within 45 days.
Import of goods
For the import of goods or release for free circulation a Single Administrative
Document20 has to be filled in or an electronic declaration has to be made in
the New Computerised Transit System (NCTS).21, 22 The declaration is the same
in all EU countries and is standardised in the Community Customs Code (EC,
1992; Revenue, 2011). Furthermore the same document is used for other
applications such as export of goods, transport of goods between countries
and a number of handlings around storage23. This is a major advantage of the
document. Depending on the use, certain boxes have to be filled in.
But not all the countries require the same boxes to be filled in. For example,
the EU guidelines say that the box that registers the origin of the good can be
left empty. So, although the document is the same, there are still country
depending differences. As this is a rather complicated document, for most oil
imports an electronic declaration will be used.
Every importing company has to use its own EORI (Economic Operation
Registration and Identification) number. Besides data on who and where, other
data need to be filled in if appropriate:
the means of transport (by a code);
the country of origin of the product (by a code);
the product (by a code);
the statistical value (and currency);
the gross and net mass (kg).
Copies of the (electronic) document are submitted to the national statistical
bureau or, in case of transport between member states, to both statistical
bureaus.
19
Norway and the European Union have through Protocol 10 of the EEA Agreement established
an equivalent measure of security on goods entering or leaving the external borders of their
customs territories. The agreement waives the obligation for traders to provide customs with
advance electronic information for security purposes in bilateral trade between Norway and
the EU. It was signed on 30 June 2009 and entered into force on 1 July 2009. The agreement
foresees that Norway implements in its trade with third countries customs security measures
that are equivalent to those applied by the EU. Source: www.toll.no
20
In Belgium and the Netherlands called: ENIG document.
21
http://ec.europa.eu/taxation_customs/resources/documents/customs/
procedural_aspects/transit/common_community/transit_manual_en.pdf
22
http://ec.europa.eu/taxation_customs/resources/documents/annex_i_transit_
brochure_en.pdf
23
Depending on code in Box 1: A: Export /Dispatch, B: Customs warehousing of pre-financed
goods for export, C: Re-export after a customs procedure with economic impact other than
the customs warehousing procedure (inward processing, temporary importation, processing
under customs control, D: Re-export after customs warehousing, E: Outward processing,
H: Release for free circulation, I: Placing under a customs procedure with economic impact
other than the outward processing and customs warehousing procedures (inward processing
(suspension system), temporary importation, processing under customs control), J: Placing in
type A, B, C, E and F customs warehouses, K: Placing in a type D customs warehouse. L
Temporally storage.
22 March 2012 4.646.1 - Oil reporting for the FQDThe country of origin is the country where the crude oil is extracted. However,
the box for the region code is not always filled in (in many countries this is not
obligatory), although this may change when Member States implement the FQD
reporting measures. Furthermore, the origin of the crude oil may disappear
from the data after refining if not managed and transferred appropriately.
So for refined products, in the current situation the country of origin may not
always be the same as the country of extraction, as there is no need to ensure
this information remains accessible.
The customs organisation also uses the Transit system (the New Computerised
Transit System, NCTS) for exporting and importing excise goods from or to
third countries.
2.3.3 Reporting on the import or delivery of crude oil
Another very specific source of information is related to Council Regulation
(EC) No. 2964/95. Any person importing crude oil from third countries or
receiving a crude oil delivery from another Member State must provide
information to the Member State in which he is established concerning the
characteristics of the imports and deliveries. Every Member State, at regular
intervals, reports this information to the European Commission. The purpose is
to have insight in the origin of oil from an oil-security perspective.
This report has to contain:
the designation of the crude oil, including the API gravity (a measure of
how heavy or light a petroleum liquid is, and an important characteristic in
the definition of the various oil types in the FQD proposal24);
the quantity in barrels;
the CIF price (Cost, Insurance and Freight) paid per barrel;
the percentage sulphur content.
Therefore, this information, which includes the designation of the crude and
often the location of extraction, is already collected and submitted to the
government by the various oil companies. Results can be found on the market
observatory site of DG Energy25. These data for the crude register are
collected from the oil importing companies by the national statistical bureau
and confidentiality provisions apply. Note that this statistics includes data of
crude oil imports that are very relevant to the FQD, but it does not cover
imports of intermediates or final products such as diesel.
2.3.4 Statistics
As stated earlier, custom classification systems such as the Customs
Nomenclature and the Harmonised System are used to determine tariff duties,
but can also be used for statistical purposes. In this section the main oil
statistics will be discussed.
24
API is the density compared to water. If the API is greater than ten, it is lighter and floats on
water; if less than ten, it is heavier. One of the criteria for ‘natural bitumen feedstock’, as
given in the FQD proposal, is that it has an API of 10 degrees or less, one of the
characteristics of ‘conventional crude’ is that the API is higher than 10 degrees.
25
http://ec.europa.eu/energy/observatory/oil/import_export_en.htm
23 March 2012 4.646.1 - Oil reporting for the FQDEurostat
Data on the import from non EU Member States is collected from the customs
authorities26. Products are classified27 according to the common classification
for products as already described in Section 2.3.128. A sample of import and
export data is given in Table 3, where a distinction is made between EU
member states and others. Production and storage is included not in Table 3.
In total, Eurostat differentiates between about 270 countries of which about
70 are active in importing or exporting of crude oil or natural gas condensates
(in 2005).
An overview of EU oil import data were provided in Section 2.2.1, where it is
shown that the Russian Federation accounts for about 31% of the EU’s oil
imports29. Total EU oil import amounted to almost 900 million barrels in 2011.
The EU export of 91 mln. ton was for almost 50% to the US and Canada
(BP, 2011).
Table 3 Sample data from Eurostat on crude oil and natural gas condensate
Year 2005 Crude oil (27080090) Gas condensates (27080010)
Import Import Export Export Import Import Export Export
outside from outside to outside from outside to
EU-27 EU-27 EU-27 EU-27 EU-27 EU-27 EU-27 EU-27
Austria 7.6 0.2 0.0 0.0
Belgium 4.2 27.2 0.0 0.0 2.7 0.2 2.6
Bulgaria 0.0 0.0
Cyprus
Czech Republic 7.7 0.0 0.1 0.0
Germany 90.9 23.6 0.9 0.1
Denmark 1.8 0.0 1.2 12.4 0.9 0.0
Estonia 0.0 0.0
Spain 58.0 0.7 0.0 1.2
Finland 8.1 1.5 0.0 1.0
France 77.7 7.3 0.0 0.0 0.0 0.0
United Kingdom 53.4 0.7 17.5 32.9 0.2
Greece 18.9 0.0
Hungary 0.0 0.0 0.0 0.0 0.0
Ireland 2.4 0.7 0.0 0.0 0.0
Italy 87.7 1.3 1.0 0.0
Lithuania 9.7 0.1
Luxembourg 0.0 0.0 0.0 0.0
Latvia 0.0 0.0 0.0
Malta 0.0
Netherlands 67.8 9.4 0.0 0.0 6.7 2.9 0.0 0.0
Poland 17.5 0.1 0.0 0.2
Portugal 12.7 0.3 0.0 0.0 0.0
26
http://www.cbs.nl/nl-NL/menu/themas/internationale-
handel/methoden/dataverzameling/korte-onderzoeksbeschrijvingen/statistiek-
internationale-handel.htm
27
http://www.cbs.nl/NR/rdonlyres/5AC0A8C9-BD14-416E-BCC4-
7D2350093C80/0/2009gnafdelingv.pdf
28
http://epp.eurostat.ec.europa.eu/portal/page/portal/external_trade/documents/
External_Trade_FAQ.pdf
29
Detailed data on EU oil imports can be found on
http://ec.europa.eu/energy/observatory/oil/import_export_en.htm
24 March 2012 4.646.1 - Oil reporting for the FQDYear 2005 Crude oil (27080090) Gas condensates (27080010)
Import Import Export Export Import Import Export Export
outside from outside to outside from outside to
EU-27 EU-27 EU-27 EU-27 EU-27 EU-27 EU-27 EU-27
Romania 8.7 0.0 0.0
Sweden 12.8 6.8 0.0 0.0 0.1
Slovenia 0.0 0.0 0.0
Slovakia 5.4 0.0 0.0
Total 553.3 79.8 18.7 47.7 12.6 3.2 0.0 2.8
Note: Probably some export data from the Netherlands to Germany and Belgium are missing.
An example: Statistics Netherlands
In the Netherlands, additional data is collected on the API index of the crude (this is an
indication on how heavy the crude is, also used in the FQD proposal to distinguish between a
number of crude types). Also the target of the crude is collected: is it for export or storage,
direct use or inland refining? However, after the crude is imported, the target may change
without notification of the change. When the crude is imported from a different country where
it has been processed, the original oil producing country is not listed but his information may
be requested by customs authority to ensure proper origin. But the refinery itself, still wants
to know the quality of the crude, which is directly related to its origin.
For the oil production data, data is collected every month30 from the main oil traders and
refineries (electronic form). Data is checked on reliability by using a mass balance (what gets
in has to come out) in which energy efficiency of the refinery processes is taken into account.
For blending of oil products in the refinery sector the efficiency must be at least 98%, for the
petrochemical industry it has to be at least 95%. Deliveries between companies are checked
(this results in data for the small oil traders) and import and export data are compared with
the oil import and export statistics. The definitions are for 95% comparable to the CN8
definition used for the import and export statistics. For the energy statistics all EU members
use the same definitions.
Joint Organisation Data Initiative (JODI)
After the Seventh International Energy Forum, six international organisations
decided in June 2011 to work on a common data reporting exercise, called the
Joint Oil Data Exercise. The organisations are APEC, Eurostat, IEA/OECD,
OLADE, OPEC and the UNSD. The outcome was a questionnaire asking for
month-old and two-month-old information. Later, the decision was made to
make the JODI a government reporting obligation for the member countries of
the six organisations. Since 2005, the IEF Secretariat coordinates the JODI,
which resulted in the development of a worldwide database on monthly oil
statistics.31
30
http://www.cbs.nl/nl-NL/menu/methoden/dataverzameling/aardoliegrondstoffen-prod-
ob.htm
31
http://www.iea.org/stats/jode.asp
25 March 2012 4.646.1 - Oil reporting for the FQDYou can also read