Fast App Launching for Mobile Devices Using Predictive User Context
←
→
Page content transcription
If your browser does not render page correctly, please read the page content below
Fast App Launching for Mobile Devices Using Predictive
                       User Context

                       Tingxin Yan1 , David Chu2 , Deepak Ganesan1 , Aman Kansal2 , Jie Liu2
                                        1
                                            University of Massachusetts Amherst, 2 Microsoft Research
                   {yan, ganesan}@cs.umass.edu, {davidchu, kansal, jie.liu}@microsoft.com

ABSTRACT                                                                             can improve our daily app interaction experience is poised
As mobile apps become more closely integrated into our                               to be widely beneficial.
everyday lives, mobile app interactions ought to be rapid                               Early pioneers in mobile computing recognized that dur-
and responsive. Unfortunately, even the basic primitive of                           ing mobile interactions, human attention is a scarce resource [8,
launching a mobile app is sorrowfully sluggish: 20 seconds                           13]. Our analysis of a long term user study [14] supports
of delay is not uncommon even for very popular apps.                                 this view: 50% of mobile phone engagements last less than
   We have designed and built FALCON to remedy slow app                              30 seconds, and 90% of engagements last less than 4 min-
launch. FALCON uses contexts such as user location and tem-                          utes. With such brief periods of interaction, it is all the
poral access patterns to predict app launches before they                            more important that interaction is rapid and responsive.
occur. FALCON then provides systems support for effective                               Unfortunately, interacting with apps can be surprisingly
app-specific prelaunching, which can dramatically reduce                             sluggish. Applications can take dozens of seconds to launch,
perceived delay.                                                                     negating any sense of agility. A particularly troubling class
   FALCON uses novel features derived through extensive data                         of apps are games, some of which can take upwards of 20
analysis, and a novel cost-benefit learning algorithm that                           seconds to fully launch past splash screens, and even more
has strong predictive performance and low runtime over-                              time to reach a playable state. Our investigation shows that
head. Trace-based analysis shows that an average user saves                          even relatively simple apps such as weather reporters can
around 6 seconds per app startup time with daily energy cost                         experience launch delays of 10 seconds or more.
of no more than 2% battery life, and on average gets con-                               Some applications, such as email clients, are optimized for
tent that is only 3 minutes old at launch without needing                            quick launch within seconds. However, these applications
to wait for content to update. FALCON is implemented as an                           mask actual latency by showing stale content while asyn-
OS modification to the Windows Phone OS.                                             chronously fetching new content over the network. While
                                                                                     appropriate for a restricted set of interactions, stale content
                                                                                     fails to engage the user in the same way that the latest fresh
Categories and Subject Descriptors                                                   content can. When considering the full launch time starting
C.5.3 [Computer System Implementation]: Microcom-                                    from touch until the latest content is displayed, apps with
puters—Portable devices; D.4.8 [Operating Systems]: Per-                             asynchronously loaded content can also exhibit severe load
formance—Modeling and prediction                                                     times of up to a dozen seconds.
                                                                                        One possible approach to decrease launch time is to cache
                                                                                     apps in memory. This approach is implemented by iOS,
Keywords                                                                             Android and WP, yet suffers from several drawbacks. First,
Mobile devices, Context, Location, Application prediction                            some apps, especially games, demand large amounts of mem-
                                                                                     ory, overwhelming memory real estate for other apps. There-
                                                                                     fore, naı̈ve caching schemes can exhibit low benefit. Second,
1. INTRODUCTION                                                                      caching does not address the issue that content may become
  Mobile apps have blossomed in popularity and ubiquity.                             stale by the time the user interacts with the app.
With each generation, the multitude and diversity of apps                               Another possible approach that addresses stale content is
continues to grow. A recent tally revealed 380,000 iOS apps,                         the use of push notifications. While push notifications can
250,000 Android apps and 35,000 Windows Phone (WP)                                   ensure content freshness, the energy cost of push communi-
apps. With so many apps out there, systems support that                              cation can be prohibitively high [12]. Not surprisingly then,
                                                                                     four out of the top five battery saving suggestions offered by
                                                                                     Apple concern disabling push notifications [1].
                                                                                        Ideally, we would like to take advantage of both avail-
Permission to make digital or hard copies of all or part of this work for            able cache and proactive content updates without incur-
personal or classroom use is granted without fee provided that copies are            ring their drawbacks. It so happens that mobile devices are
not made or distributed for profit or commercial advantage and that copies           equipped with an increasingly sophisticated array of sensors
bear this notice and the full citation on the first page. To copy otherwise, to      such as IMUs, mics, cameras and geolocation units. Each
republish, to post on servers or to redistribute to lists, requires prior specific
permission and/or a fee.
                                                                                     can provide insightful context for the OS [7]. For a par-
MobiSys’12, June 25–29, 2012, Low Wood Bay, Lake District, UK.                       ticular user, Angry Birds usage may be much more likely
Copyright 2012 ACM 978-1-4503-1301-8/12/06 ...$10.00.
at home, whereas Email and Calendar usage may be much                                                  1
more likely at work. Or, a user may habitually check Face-

                                                                             Cumulative Probability
book after receiving an SMS when at school.                                                           0.8
   We have built the FALCON1 system to predictively prelaunch
apps based on context signals and user access patterns. Prelaunch                                     0.6
entails both preloading apps in memory and app-specific
fresh content preparation.                                                                            0.4
   At the foundation of FALCON is a data-driven analysis that
reveals surprising insights about how and when we use mo-                                             0.2
bile apps. We find an intrinsic bundling behavior in how
mobile apps are used — once a user starts using the phone,                                             0
say for a phone call or SMS, they tend to use several other                                                 1           5            10

applications before turning away from the phone to another                                                      Duration (Minutes)
task. Bundling behavior manifests not just at the timescale
of single user session with the phone, but across longer du-        Figure 1: App usage durations for a representative
rations of several weeks. We find that games are often used         individual over a one year long trace.
in bursts where users tend to obsessively use a game for a
few weeks, and then ignore it entirely for several months.
Similarly, other contexts such as location and time-of-day                 dictions lead to launch latency reduction of nearly 6
plays a central role in app usage, perhaps indicative of our               seconds per app usage with the daily energy cost of no
tendency toward structured behavior.                                       more than 2% battery lifetime. Predictions also lead
   While such behavioral insights can be distilled into a set of           to getting content that is only 3 minutes old at launch
preload prediction rules, a key challenge is that users are not            without waiting for content to update at launch.
alike in how these behaviors apply to them. Some users are               • We prototype FALCON on a Windows Phone, and demon-
more likely to open several apps after a phone call whereas                strate that it has minimal runtime energy overhead of a
others do so after opening the browser; some users have                    few µAh and a small memory footprint of under 2 MB.
strong tendencies at a core set of tightly defined locations
such as home and work whereas others exhibit more diver-            Taken as a whole, FALCON effectively replaces a subset of
sity. To address this, FALCON personalizes the context trig-        the policy decisions traditionally reserved for the memory
gers to the individual to maximize prelaunch accuracy.              manager and scheduler. Context permits FALCON to make
   Applications also differ widely in terms of the benefits         much more informed app decisions which lead to substantial
from correct prelaunch versus the cost of incorrect prelaunch.      launch time reductions at minimal overhead.
As an example comparing two popular games, Need for Speed             The rest of this paper is organized as follows. §2 pro-
takes over 2× more energy than Plants vs. Zombies even              vides quantitative background of the problem. §3 provides
though both load equally slowly. FALCON uses a novel cost-          an overview of the system. §4 discusses the launch predictor,
benefit adaptive prediction algorithm that accounts for both        features and learner. §5 details implementation aspects. §6
the expected latency benefit of correct predictions and the         evaluates FALCON. §7 discusses related work, and §8 offers a
expected energy cost incurred for wrong predictions. The al-        discussion and conclusion.
gorithm adapts to budget constraints and jointly optimizes
the applications to prelaunch as well as the temporal and           2.    BACKGROUND AND PROBLEM SCOPE
location contexts under which such prelaunching is enabled.
                                                                       In this section, we take a closer look at the issue of app
Both features and learning algorithm are designed to achieve
                                                                    launch latency. Our investigation is based on trace data col-
very low runtime overhead.
                                                                    lected from the Rice LiveLab user study [14], and our own
   We have implemented FALCON as an operating system mod-
                                                                    internal study. In the Rice LiveLab’s study, thirty four vol-
ification to the Windows Phone 7.5 operating system and
                                                                    unteers were given iPhones for a period of fourteen months
show that it has minimal energy, memory and processing
                                                                    from 2010-2011. During this time, their device usage was
overhead. In addition to preloading apps from local storage,
                                                                    monitored. Our own internal double-blind study consisted
FALCON ensures content freshness by prefetching content be-
                                                                    of three WP users monitored over one month. We focus on
fore app launch. This is achieved with a WP event handler
                                                                    the following elements which were recorded in both traces:
that FALCON invokes whenever it predicts the app is about
                                                                    app usage, location, datetime. The LiveLab’s trace is much
to be launched. For example, a Twitter app can fetch new
                                                                    more extensive; it will be the main focus of investigation
tweets during this event. As a result, a user’s time to first
                                                                    unless otherwise noted.
meaningful app interaction is no longer bound by network
                                                                       We first examine the thesis that mobile interactions are
latency.
                                                                    inherently brief [8]. Figure 1 illustrates the CDF of app
   Our major contributions are as follows.
                                                                    usage durations across all users in the Rice trace. Indeed,
    • From extensive data analysis, we design spatial and           most interactions with the phone are short with 80% of the
      temporal features that are highly indicative of mobile        apps being used for less than two minutes. This indicates
      app access patterns.                                          that short engagements are the norm and the proportional
                                                                    effect of slow app startup can be expected to be even more
    • We design a cost-benefit learning algorithm whose pre-        severe for mobile users.
1
 Fast App Launching with Context. The peregrine falcon                 Qualitative reports suggest that slow app launch is a sub-
can swoop dive at more than 200 mph – making it the fastest         stantial drag on user experience. As an example, a recent
animal on earth.                                                    iOS upgrade caused an outcry from iPhone owners that were
Most Popular Marketplace Apps Pre-installed Apps
!"#$%&'$()*+&!,-.&/01& '!"
&#"
&!"
%#"
%!"
$#"
$!"
#"
!"
34 "
"= "
"
"B "
"
>- )8"
9) -"
,G "
M, 1:"( "
7) 6"
"
.6 "
2"
F "
2 1 62 "
O 6/8"
?G 2,/ "
F HI D"
2) ))*feature description
ft triggers
fdt dynamic triggers
fλ location cluster
fdt,λ dynamic triggers per location
fT oD time of day
fβ burst behavior indicator
Table 1: Feature Summary
session
Time
trigger
Figure 5: App usage is correlated with location.
Figure 4: During this 2 hour timeline, SMS (in red)
triggers other follower apps (in green). Arrows in-
Pr(F = α | T ∈ τst ) expresses the probability that the fol-
dicate start of triggered sessions.
lower app is the candidate launch app α given that the trig-
ger app is one of SMS or Phone. Note that probabilities are
scribes a novel cost-benefit learner and decision engine well- based on the data distribution observed during training.
suited to launch prediction. Interestingly, we found that the best triggers were different
for different applications, even for a single individual. For
4.1 Personalized Features example, the best three triggers for Email are different from
Our primary objective for feature design is to identify a those for AngryBirds. There is also significant variability
set of features that give strong insight into the next app to across users — a heavy user of games might have a game
launch and that are very inexpensive to compute at infer- as a trigger whereas others may not. These differences lead
ence time. As is typical of feature design, we take a data- us to propose dynamic triggers that are calculated on a per-
driven approach. This investigation is heavily guided by our launch-candidate basis as the set of top-k triggers most likely
data exploration of the LiveLab and internal user studies. to lead to the launch candidate as a follower.
For each feature, we present a motivating vignette uncov- τ̂k = argmax Pr(F = α | T ∈ τk )
ered from the traces, followed by a formal definition of the τk
feature. Table 1 summarizes the features considered. fdt,k = Pr(F = α | T ∈ τ̂k ) I(τ̂k )
4.1.1 Triggers and Followers where τ̂k represents the k best triggers for α. §4.2 discusses
A novel feature in FALCON is session triggers and followers. the procedure for choosing k to arrive at a fixed set of dy-
Our data analysis reveals that once the user starts using namic triggers per app fdt .
the phone – for example to answer a phone call or view an
SMS message – they have a tendency to open a sequence of 4.1.2 Location Clustering
other applications within relatively short durations of each Empirical observations suggest that location is correlated
other. We refer to such a sequence of application launches with app usage. Figure 5 illustrates the effect of location on
as a session. app usage for a brief two week time window for a represen-
The data traces reveal that certain apps are more likely tative user from our internal user study. For this user, there
than others to be the trigger apps that start sessions, whereas is a surprisingly strong tendency for game usage at home,
other apps are more likely to be follower apps that are used Browser and Calendar usage at work, and Twitter usage at
in the same session as the trigger apps. Figure 4 shows a frequently visited shopping center.3
a two hour extract of one user’s trace. During this time The location feature fλ is computed by assigning the user’s
SMS was the trigger for four separate sessions. Analysis of current location to the nearest neighbor cluster.
aggregate user behavior revealed that SMS, Phone, Email,
Facebook, and Web Browser are among the most popular fλ = argmin DIST(λ, lc )
triggers across all users. This is intuitive since trigger apps c∈Clusters
are ones that grab the users’ attention (e.g. SMS and Phone) where λ is the current location and lc is the central location
or satisfy immediate information needs (e.g. Browser). of cluster c. Clusters are computed from the user’s historical
Let ft denote a trigger feature. Intuitively, the trigger data during the training phase. The literature offers many
features identify the occurrence of a trigger app weighted geospatial clustering algorithms [11], and after experiment-
with the likelihood of a follower app. For random variable ing with several, we chose k-means clustering which incurs
follower app F , trigger app T , and candidate launch app α, low computation cost while performing comparably to the
the trigger feature is calculated as follows. others.
ft = Pr(F = α | T ∈ τt ) I(τt ) We can use location in conjunction with triggers as a joint
feature fdt,λ . For each location, we compute the best set of
where τt is a set of triggers, for example {SM S, P hone},
and I(x) is an indicator function that is 1 if (any member 3
The labels Home, Office and Shop are educated guesses
of) x is observed, and 0 otherwise. The term according to the recorded geocoordinates.Figure 6: This particular user launched the app An-
gry Birds frequently from mid-Jan to mid-Feb only.
Both yearly and monthly timelines are shown.
dynamic triggers as follows.
τ̂λ,k = argmax Pr(F = α | T ∈ τλ,k , L = λ)
τλ,k
fdt,λ,k = Pr(F = α | T ∈ τ̂λ,k , L = λ) I(τ̂λ,k ) I(λ) Figure 7: Time of day is correlated with app usage.
This feature captures dynamic trigger variation across loca-
tions. By analyzing historical data, we can now determine the
4.1.3 Temporal Bursts best window size as the one with the highest score, and use it
to detect a burst. This window size can be used to compute
We also find that a user’s app usage changes significantly fb , which is set to 1 if we are currently within a burst window
over longer time scales. Figure 6 illustrates an app, Angry and 0 otherwise.
Birds, becoming popular during a month-long period, then
ceasing to be used at all afterward. Perhaps not surprisingly,
this behavior turns out to be very common for games and ĵ = argmax(wj )
j
entertainment apps. However, our data analysis reveals that
such burst usage behavior is dependent on the type of ap- fβ = bn−ĵ,ĵ
plication, for example, games have shorter but more intense
bursts in comparison with other applications. Therefore, a Time of Day Feature: Besides multi-day temporal bursts,
key challenge is to determine the frequency and duration of app usage likelihood changes throughout the day as well.
these bursts for each application in an efficient manner. Figure 7 illustrates this for a typical user in our internal user
To address this issue, we develop a novel burst predictor. study. A simple Time of Day (ToD) feature fT oD represents
The burst predictor uses multiple sliding windows, each of the time of the day, segmented by hour. Our experiments
a different resolution, to detect and react to sudden upticks with finer and coarser granularities did not yield much dif-
in app usage. Each app has its own burst predictor to track ference.
its bursty behavior.
As a basis for our burst predictor, we use a wavelet-based
4.1.4 Additional Context Signals
burst detection algorithm [15] as a subprocedure. Given a We also built context sources mapping to accelerometer,
stream of data, the detector’s goal is to find all windows gyroscope and ambient light level sensors. These proved
of any length during which the aggregate statistic of the sufficiently straightforward to incorporate into the FALCON
window exceeds a threshold. In our instantiation, this cor- architecture. However, we do not yet have sufficient user
responds to detecting any sequence of days during which an trace data to analyze their effectiveness at predicting app
app is launched more than a threshold per day on average. launches.
We currently set the threshold to one.
The wavelet detector uses a unique modified wavelet data
4.1.5 Multi-feature Decision Engine
structure in order to bound the computational complexity The different features that we have described can be used
of detection by O(n) where n is the number of days, whereas as the core inputs of a decision engine that makes application
the brute force solution is O(n2 ). The output is an indicator prelaunch decisions. Once training phase has provided the
for each window wi,j where i indicates the offset from the trigger features location clusters, and burst predictions, the
start of the stream and j indicates the length of the window. decision engine can decide whether or not to launch an ap-
Let bi,j be a burst indicator which corresponds to a sliding plication α when a trigger T is met. The decision procedure
window starting from day i of length j days. bi,j is true if the takes three steps.
corresponding sliding window is a burst, and false otherwise.
Provided the burst detector, our burst predictor must de- 1. fβ is checked to see whether a burst of α is underway.
cide whether the next time step is part of a burst or not. 2. fλ is checked to see whether the current location sug-
To make the decision, our predictor measures the predictive gests use of α.
power of each burst window size j in being able to success-
fully predict whether the app is used in the day following the 3. fdt,λ is checked to see whether a trigger for α started
window. Let wj represent the predictive power of window the current session.
size j.
The three steps are executed in a sequential order. The
n launch decision for α can be summarized as follows.
1 X
wj = [bi,j bi+j,1 + (1 − bi,j )(1 − bi+j,1 )]
true if fβ fλ fdt,λ > 0
n−j decision(α) =
i f alse elseOur description of the decision engine, however, has a ma- Let cα and bα represent the energy cost and latency reduc-
jor omission — it does not take into account the actual cost tion benefit respectively for a single prelaunch of α. Then
and benefit of a correct preload versus an incorrect preload. the expected cost c′ and benefit b′ of selecting to prelaunch
In the following section, we describe how we can incorporate α for all encounters of t and λ is calculated as follows.
these cost-benefit considerations into our decision engine.
b′t,λ,α = bα × recall(t, α, λ)
4.2 Cost-Benefit Learner c′t,λ,α = cα × (1 − precision(t, α, λ))
The Cost-Benefit Learner (CBL) combines the output of
Note that while the benefit b′ is scaled by the proportion of
the decision engine for each application together with knowl-
triggers leading to the follower, the cost c′ is scaled by the
edge of the cost-benefit tradeoffs of launching the application
proportion of triggers not leading to the follower. This is
to decide whether to preload an application. We first pro-
because mistaken predictions incur a cost cα whereas energy
vide an intuition for how the CBL operates before launching
for correct predictions can be accounted toward the user’s
into the specifics of its mechanics and the details of the cost-
actual launch.
benefit trade-off.
We map our formulation to the 0-1 Knapsack problem to
4.2.1 CBL Overview model the cost and benefit trade-off. Consider all tuples
< t, λ, α > as candidates for the Knapsack. The predefined
To decide whether to prelaunch or not, CBL takes three
energy budget corresponds to the max allowable Knapsack
steps: First, it computes the precision and recall metrics for
weight, the expected reduced launch time b′t,λ,α corresponds
an application from the decision engine (§4.1.5). Second, it
to the benefit of inclusion in the Knapsack, and the expected
converts the precision and recall number to cost and benefit.
energy cost c′t,λ,α corresponds to the weight in the Knapsack.
Third, it determines the best followers for each trigger by
It is a 0-1 Knapsack since a tuple can be included or excluded
maximizing benefit for a fixed cost budget.
in its entirety.
Precision and Recall: The precision and recall for a The 0-1 Knapsack model for the cost-benefit trade-off is
trigger and follower pair {T, F } at location cluster λ are formulated as follows.
defined from observed user data as follows. X ′
maximize bt,λ,α I(< t, λ, α >)
t,λ,α
launches of F after T at λ
precision(T, F, λ) = X
sessions with trigger T at λ subject to c′t,λ,α I(< t, λ, α >) ≤ W
launches of F after T at λ t,λ,α
recall(T, F, λ) =
sessions with follower F at λ As before, the function I() is either zero or one, indicating
whether or not to include the tuple < t, λ, α >. W is the
Cost and Benefit: We measured the energy cost and energy budget.
loading time of all apps apriori. We can use the measure- One possibility to solve the Knapsack problem is with dy-
ment results to determine the cost and benefit of prelaunch- namic programming. However, a dynamic programming so-
ing by combining the precision and recall results. lution requires pseudo-polynomial time. Instead, we use a
Precision describes the expected number of prelaunchs standard greedy approximation to solve the Knapsack prob-
that leads to an actual usage. Multiplying by energy cost lem. The greedy approximation sorts the tuples in decreas-
of a prelaunch, we can derive the energy cost of a prelaunch ing order of their benefit per unit of cost. It then proceeds
that leads to an actual usage. Recall describes the probabil- to pick the tuples according to the ranked order, starting
ity that a follower is preloaded. Multiplying by the launch with the top-ranked one, until the energy budget is reached.
time of the follower, we can derive the loading time benefit The output of the greedy approximation is K, a list of tuples
of a prelaunch across all launches. We will quantitatively sorted by benefit per unit cost within the energy budget.
analyze the cost and benefit in the next section. The final step of the optimization updates the dynamic
Trading-off cost and benefit: We assume that the CBL trigger feature fdt,λ to use the appropriate top-k triggers.
is provided a daily energy budget. The energy budget is a Recall from §4.1.1 that for a given α, the value of k is used by
predefined percentage of the total battery capacity that the τ̂λ,k for the feature fdt,λ,k . k is set according to the number
CBL engine can use for its prelaunches within a day. (For of appearances of α in K. The decision engine, which looks
example, the CBL may only be able to use 1% of the battery at fdt,λ,k for the chosen k, performs inference in time linear
each day across all prelaunches.) Given this constraint, the to the length of K.
goal of the CBL is to pick, for a given user, the best set of Dynamic Energy Constraints
followers to prelaunch. Intuitively, we should prelaunch the There are several ways to define an energy budget for the
items that have least energy cost and highest loading time Knapsack optimization framework. For example, one could
benefit. The goal of our optimization framework is to choose budget a fixed percentage of the battery per day, pick a per-
the best option given the energy budget. centage of the current battery level or have an finer-grained
budget at an hourly level. While our optimization can work
4.2.2 CBL Optimization Framework with different definitions of the energy budget, we use the
We first describe the optimization procedure which runs representative example of a budget that is chosen based on
during training. For ease of exposition, we cover the CBL’s the residual energy. The Knapsack model is adapted to the
method for finding dynamic triggers on a per location- and dynamic energy constraint W ′ as follows.
per app-basis. In our implementation, the technique is ex-
W ′ = (W − U )θ
tended in the straightforward way to additionally include
time-of-day. where U is the energy consumed so far by prelaunching,and θ is a tuning parameter in the range (0, 1] that can be
chosen to discourage aggressive prelaunching when energy is
abundant. We currently set θ = 1. Note that meeting the
dynamic budget constraint does not require recomputation
of Knapsack. Instead, we maintain a pointer to the position
in K which represents the dynamic energy budget cutoff.
Eviction Policy: Most phone OSs use an LRU policy for
app eviction.4 While the CBL is primarily used for launch
prediction, the sorted tuple list K is also used to evict the
app least likely to be used. As part of launch prediction,
apps already resident in memory are assigned very low cost
scores. Nonetheless, such an app may still be evicted due to
its meager benefit b′ according to the current trigger t and
location λ. This conveniently integrates launch prediction
with eviction policies.
Server-based Training If the user app launch behavior changes
(e.g. a new location is visited or a new app is installed),
retraining is recommended. Even though the greedy Knap-
sack approximation is efficient, training involves scanning
through all the logged context data. Therefore, we offload
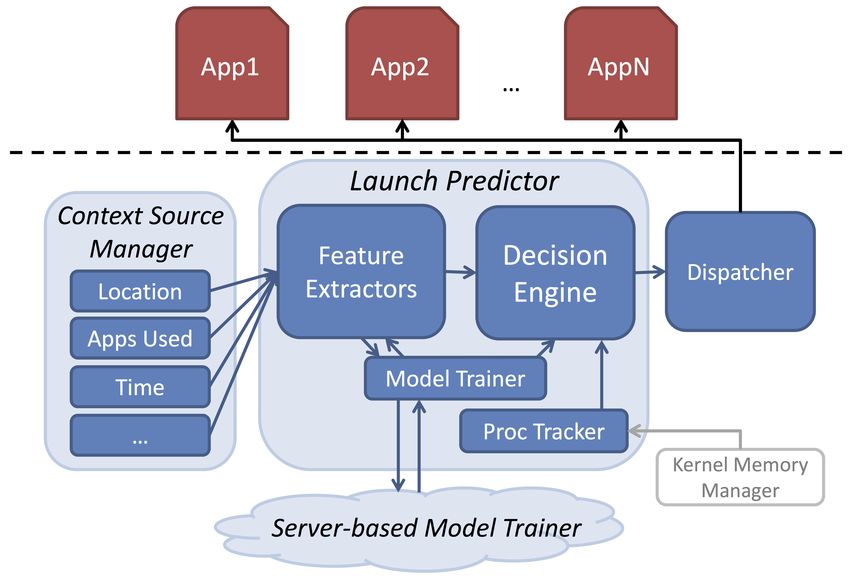
Figure 8: FALCON ambient display widget is shown at
training to a server. We currently initiate retraining man-
the top of the home screen. Current predictions are
ually. The log with data records since the last training are
Monopoly, FindSomeone and Music+Video.
sent to the server, and new parameters are sent back to the
phone.
Memory Constraints In the preceding discussion, we treated Tombstoned apps, the OS retains some minimal tombstones
all preloads equally in terms of memory cost. The FALCON of bookkeeping information, such as the last page of the app
implementation and its associated evaluation also make this the user was on. In very low memory conditions, even tomb-
simplifying assumption. In practice, apps vary in memory stones may be dropped. To limit battery drain, background
usage. A logical extension of our Knapsack model can han- apps are only permitted 15 seconds of CPU time every 30
dle multiple-constraints where both energy and memory are minutes.
treated as constraints.
5.2 Implementation Description
5. IMPLEMENTATION FALCON is implemented in three parts. The first is an OS
We have implemented FALCON as an OS modification to service. The second is a new application event upcall. The
Windows Phone (WP) 7.5. We first discuss the elements third is an ambient display widget.
of WP’s app model relevant to our implementation before The FALCON OS services is a privileged daemon written in
describing the implementation details. native code. As such, it has access to the registry, a per-
sistent structured datastore, and can call privileged library
5.1 Background on Windows Phone Apps and system calls. For example, starting a new process is
WP apps are similar to webapps in organization. Each a privileged call. FALCON replaces a subset of the standard
app is collection of pages with links pointing across pages. policies of the system’s memory manager and scheduler with
An app is referenced by its unique ID (UID), and a page its prelaunch decisions.
within an app is referenced by its page name. Pages can The service manages a thread for each context source.
take arguments as parameters. The following is an example Currently, three context sources are used corresponding to
of these elements: app:///ShowContactInfo?id=8. the features described in §4.1. Context sources post up-
Each app has a default page Default that is loaded at startup. dates at different rates, depending upon the rate of change
Apps can also support multiple entry points by supporting of the underlying signal. In order to support variable update
“deep links” to specific pages. For example, the standard rates, the main service shares a model data structure with
Address Book app supports pinning of contact cards to the each source and the launch predictor. Each source indepen-
home screen via deep linking. Links are not functional cross- dently updates the model with observations for the context
app; WP enforces strict app isolation. for which it is responsible.
The WP app lifecycle consists of four states: Not Launched, The launch predictor uses the model’s observations in its
Active, Deactivated and Tombstoned. Apps transition from inference process. The launch predictor is executed when-
Not Launched to Active when tapped from the home screen, ever one of several defined events occurs: (1) the phone re-
and from Active to Deactivated whenthe user navigates away ceives an SMS or phone call, (2) the user unlocks the phone,
to the home screen or another app. An app undergoing deac- or (3) the user launches a trigger app. These events al-
tivation has a 10 second grace period to perform cleanup ac- ready activate the phone’s application processor from a low
tivity before receiving no further cycles. A deactivated app to high energy state so it is inexpensive to piggyback the
is still resident in memory until it is evicted by the memory launch predictor execution.
manager which then changes its state to Tombstoned. For Upon generating an inference, the launch predictor passes
the candidate app(s) to the dispatcher, which vectors the
4
Without paging, apps are evicted in their entirety. launch signal through the appropriate prelaunch event up-call. For third party apps which are written in managed 6.2 Microbenchmarks
C#, this process involves translating native calls to man- Before measuring the performance of FALCON, we first bench-
aged code calls. mark three critical parameters for each app: a) the time
Apps implement the event handler as a custom page named taken for launching an app, b) the amount of energy con-
Prelaunch, e.g. app:///Prelaunch. The dispatcher sumed during app launch, and c) the memory consumed by
jumps directly to the Prelaunch deep link. An app can im- the app at launch time. Note that we focus on these pa-
plement any custom prelaunch logic in its Prelaunch page. rameters at launch time as opposed to how they vary during
For example, our modified Email app fetches new emails dur- app usage.
ing prelaunch, and our modified game loads the last level the Our measurements are conducted on an LG Mazza phone
user played during prelaunch. In general, network content running Windows Phone 7.5. We measured the top twenty
fetch or local storage load operations are good candidates for most popular apps in the Windows Phone Marketplace, as
Prelaunch. For apps that do not implement the Prelaunch well as the first party apps that are preinstalled on the
link, the dispatcher opens its Default page instead. This is phone, including People, Email, and Maps.
sufficient for us to reduce launch time for many apps without Figure 9(a) shows the CDF of app launch time with and
requiring app modification. without prelaunching. The launch time includes both the
In WP, pages are meant to show a display to the user, OS loading time and network fetch time. The network fetch
which is not appropriate for prelaunching. Once the dis- time is the average over a number of measurements under a
patcher opens an app to either the Prelaunch or Default good WiFi connection, which is an optimistic estimate since
page, it immediately deactivates it. With the existing WP a cellular data connection is likely to be slower. Without
deactivation grace period, this gives the app an opportu- preloading, half of the apps require more than 10 seconds
nity to complete its app-specific prelaunch operation. For to be fully launched, and around 10% of apps have a launch
prelaunch deactivation, the grace period is modified to 25 time of more than 20 seconds. With preloading, the app
seconds, which is high enough to cover the total app launch launch time can be reduced dramatically to close to zero.
times of most apps. The deactivation event also gives apps Figure 9(b) shows the CDF of energy cost to launch an
an opportunity to adjust for any side-effects (e.g. unregister- app. The energy cost as measured with a Monsoon power
ing server state) that the Default page may have initiated. meter ranges from 500 to 2500 µAh, with a median energy
Conveniently, developers already implement the deactiva- consumption of 750 µAh. For reference, a typical LiOn bat-
tion event as part of the regular app lifecycle management tery on a mobile phone has a capacity of 1500 mAh, therefore
protocol. the energy cost ranges from 0.03% to 0.17% of the battery
Lastly, FALCON includes an ambient display widget using capacity for a single launch. Clearly, when app usage is high,
the WP live tiles mechanism. Live tiles are simply home the total energy cost of launching applications can be a sig-
screen icons that can be updated programmatically. Fig- nificant fraction of the overall budget. A benefit of FALCON
ure 8 shows a screenshot of the FALCON widget. The launch is that we can cap the total amount of energy for preloading
predictor updates the live tile to show the highest likelihood to ensure that its effect on battery life is bounded.
candidate apps. Figure 9(c) shows the CDF of memory cost for launching
an app. The memory consumption varies from 10 MB to 90
MB, with a median memory consumption of 30MB. This is
6. EVALUATION a significant fraction of available memory on smartphones,
In this section, we evaluate the performance of FALCON which typically have memory capacity between a few tens to
through extensive data analysis as well as measurements of hundreds of MB. (Our latest WP phone has about 150MB
our prototyped system implementation. available for user apps.)
6.1 Dataset 6.3 Benefits of Individual Features
The primary dataset in our analysis is the Rice LiveLab
At the core of FALCON are three features: session triggers
user study [14]. In this study, thirty four volunteers were
and followers, temporal bursts, and location clusters. We
given iPhone 3GSs for a period of up to fourteen months.
now look at the benefits of using each of these features in
We use two traces from the LiveLab users study: the app
isolation.
usage trace which records the start time and duration of
every app usage, and the location trace which records the
user’s location with an interval of five minutes when GPS 6.3.1 Session Triggers and Followers
is available. By joining the app usage table and location Our goal in this section is to understand trigger and fol-
table, we have a trace of the time and location information lower behavior across different users and applications. Specif-
corresponding to each app usage. Note that since location ically, we ask three questions: a) what applications are the
is obtained at a relatively coarse granularity compared to best triggers across different users, b) are there differences
app usage data, there are several instances where we do not between individuals in their trigger and follower behavior,
have data at precisely the times that an app was used. To and c) for a single user, are there differences in triggers for
address this, we interpolate location points using a nearest different follower apps?
neighbor method. In total, the interpolated trace of time Figure 10(a) shows the top 5 session triggers across all
and location information contains over 400 thousand sam- users. Not surprisingly, this list includes Email, Facebook
ples across fourteen months. The majority of our evaluation and Safari — all popular apps. What is surprising, however,
is conducted based on the LiveLab dataset, except for mi- is that SMS and Phone calls are excellent triggers as well.
crobenchmarks which are measured on the Windows Phone In other words, receiving an SMS or a phone call creates
platform. an interruption into an individual’s routine, and once inter-1 1 1
Cumulative Probability
Cumulative Probability
Cumulative Probability
0.8 0.8 0.8
0.6 0.6 0.6
0.4 0.4 0.4
0.2 0.2 0.2
NO-OP
Preloading NO-OP NO-OP
0 0 0
0 5 10 15 20 25 30 0 1000 2000 3000 0 15 30 45 60 75 90
Loading Time (seconds) Energy Consumption (uAh) Memory Consumption (MB)
(a) CDF of launch time (b) CDF of energy consumption (c) CDF of memory consumption
Figure 9: Microbenchmark of launch time, energy cost, and memory cost. Apps measured include the top
20 most popular ones in Windows Phone Marketplace, and preinstalled first party apps.
0.3 0.25 0.4
0.25 0.35
Probability Density
Probability Density
Probability Density
0.2
0.3
0.2
0.15 0.25
0.15 0.2
0.1 0.15
0.1
0.05 0.1
0.05
0.05
0 0 0
SMS
Email
Facebook
Phone
Safari
WordsWF
SMS
Email
Phone
Safari
SMS
Phone
CyaniAH
Prefer
Safari
(a) Top 5 triggers across all users. (b) Top 5 triggers for a specific user. (c) Top 5 triggers for “Angry Birds”.
Figure 10: Different set of session triggers for (a) aggregation across multiple users, (b) a specific user, and
(c) a specific app across different users. Y-axis shows the probability that each app acts as a trigger. App
name abbreviations in the graphs are: “WordsWF” = “WordsWithFriendsFree,”“CyaniAH” = “CyanideAnd-
Happiness.”
rupted the users tend to use other applications before they 1
close the phone. 0.9
Figure 10(b) shows the top 5 triggers across all users are
Cumulative Probability
0.8
not necessarily the best triggers for an individual. This
graph shows the best triggers for a user who is heavy user 0.7
of games — in this case, the best trigger is in fact the 0.6
WordsWithFriends game. This indicates that personaliza- 0.5
tion is needed for the user, and we cannot assume that trig-
0.4
gers are the same across everyone.
To understand if different apps have different triggers, we 0.3
look at the triggers for a specific application across all users. 0.2
All Apps
We choose Angry Birds as our target app in this evaluation 0.1 Games
since it is very popular across multiple users and its loading First-party Apps
0
time is representative for games. Figure 10(c) shows that 1 30 60 90 120 150 180
triggers for AngryBirds are also different from those across
Number of Days in Burst Window
all applications, suggesting that triggers should be chosen
differently for each application.
To conclude, this evaluation shows that triggers need to Figure 11: CDF of number of days that involve
be both user- and app-specific, and it makes the case for dy- bursty usage for each application. 80% of games
namic personalized triggers that we will evaluate in §6.4.2. have less than 30 bursty days over 14 months usage.
6.3.2 Temporal Bursts
We now turn to evaluate the performance of the temporal
feature, namely bursty app usage. Temporal bursts can be used in a bursty manner and which are not. Intuitively, one
an effective feature for improving prelaunch accuracy since would expect that games are likely to be used in a bursty
it indicates when an application is heavily used during a rel- manner whereas First-party apps such as Email or People
atively short window of time, such as a span of several days. (WP Facebook client) should have a more steady usage pat-
Our evaluation looks at which applications are likely to be tern. Therefore, we explore the burstiness for three cate-gories of apps — All applications, Games, and First-party 1
apps. 0.9
Figure 11 shows the CDF of number of bursty days for
Cumulative Probability
0.8
each app category. Each point in this graph corresponds
to a {user, app} pair. From this graph, we can conclude 0.7
that games have stronger bursty behavior than apps such 0.6
as Email and Facebook. Around 80% of games are used 0.5
within 30 days out of 14 months trace length, while only
0.4
20% of the first party apps are used within the same time
frame. This observation suggests that bursty behavior is a 0.3
discriminating feature that we can exploit to improve the 0.2
Location Only
prelaunching performance, especially for games. 0.1 Burst Only
Location+Burst
0
6.3.3 Location Clusters 0 10 20 30 40 50
After temporal burst feature, we now look at the perfor- Number of Preloads
mance of location clusters. Similar with temporal features,
we look for applications that are heavily used within cer-
Figure 13: Benefit of location and temporal burst
tain location clusters to improve prelaunch accuracy. We
features, measured in terms of number of preloads
evaluate the distribution of number of location clusters per
per correct usage.
application (determined via k-means clustering). We use the
same categories as the previous section — All applications,
Games, and First-party apps. Our intuition is that games
tend to be used in fewer locations than other apps. 6.4.1 Benefits of location + temporal features
Figure 12 shows the CDF of number of clusters where In this experiment, we look at the benefits of combining lo-
each app category is used. From this graph, we can see cation and temporal features. We fix trigger apps to include
that games have a higher locality than other apps — 90% the most common triggers across users, Phone, SMS, and
of game apps are used in less than 25 clusters, and more Safari. We then explore the benefit of using only location
than half of games are used in less than 10 clusters. Thus, clusters, only temporal bursts, and finally a combination of
we conclude that location clustering is also a discriminating the two for each follower app. For each setting, we look at
feature, particularly for games. improvement in prelaunch accuracy, specifically, the number
of preloads per app usage for each user.
Figure 13 shows the CDF of number of preloads across all
1 users. Note that all curves have the same set of triggers. As
0.9 seen from the figure, location clustering by itself performs
Cumulative Probability
0.8 poorly — the median number of preloads that lead to an
0.7 actual app usage is around 27. If we use only temporal
bursts, the median preload number is reduced to only six.
0.6
Combining the two features gives even better performance
0.5 — median number of preloads reduces to around five.
0.4
0.3 6.4.2 Benefits of dynamic triggers
0.2 All Apps While combining location and temporal features improves
0.1 Games preload accuracy, it still incurs the cost of several preloads
First-party Apps per app usage. We now look at how dynamic triggers im-
0
1 10 20 30 40 50 prove performance over static triggers. This experiment
evaluates improvement in precision and recall by personal-
Number of Clusters Where Apps Are Used
izing triggers for each user based on both location and tem-
poral burst contexts. We focus on “Angry Birds”, a popular
Figure 12: CDF of number of location clusters per game that provides a representative example of an applica-
app. Over 50% of games are used within less than tion that exhibits both location and spatial selectivity.
ten clusters. We compare the precision and recall of preloading under
three trigger settings: static triggers for all users and loca-
tion clusters, dynamic triggers for each user but the same for
6.4 Combining Features all location clusters, and dynamic triggers for each user at
We now look at the benefits of combining the features each location clusters. Figure 14(a) and Figure 14(b) shows
of temporal burst and location clusters on prediction accu- the precision and recall for two different users when the fol-
racy. Our evaluation consists of two steps. First, we look lower app is AngryBirds. For both users, dynamic triggers
at how adding temporal features and location clusters im- for each location cluster achieves the best precision and re-
proves accuracy when the set of triggers are fixed across all call, and clearly provides dramatic improvements over the
users and apps. Second, we evaluate the benefits of making other two cases. In addition, the performance of dynamic
the triggers dynamic, in which case triggers can be modified triggers for each location cluster is also stable for different
within a cluster and burst window based on the individual users, while the performance of the other two schemes varies
and target application for each user. significantly for different users. This observation clearly in-1 1
Dynamic trigger w/ cluster Dynamic trigger w/ cluster
0.9 Dynamic trigger w/o cluster 0.9 Dynamic trigger w/o cluster
Static trigger Static trigger
0.8 0.8
Precision 0.7 0.7
Precision
0.6 0.6
0.5 0.5
0.4 0.4
0.3 0.3
0.2 0.2
0.1 0.1
0 0
0 0.1 0.2 0.3 0.4 0.5 0.6 0.7 0.8 0.9 1 0 0.1 0.2 0.3 0.4 0.5 0.6 0.7 0.8 0.9 1
Recall Recall
(a) User 1 (b) User 2
Figure 14: Precision and recall of prelaunching a follower app for two individual users under static and
dynamic trigger settings. In this graph, “Angry Birds” is used as a representative follower app that exhibits
both temporal and spatial selectivity.
dicates that we should use dynamic personalization of trig- both heavily used and incurs significant delay for fetching
gers at the location cluster level. emails from servers.
First, we compare CBL (noted as Email w/ Prefetching)
6.5 Evaluation of cost-benefit learner against two baseline schemes: a) no prefetching (noted as
Having comprehensively evaluated how features can en- Email w/o Prefetching), and b) active pull with an inter-
able better preloading, we turn to evaluate the performance val of 30 minutes(noted as Email Pulling). Our evaluation
of Cost-Benefit Learner (CBL). Our cost-benefit analysis in- metric is freshness of the app, which is defined as the time
cludes information about the cost of a preload in terms of that elapses between retrieval of content from the server and
energy, and the benefits of the preload in terms of app load- when the app is opened by the user.
ing latency, or in the case of network prefetching, in terms Figure 15 shows the freshness of rhe Email app using our
of the freshness of fetched data. We use the energy/latency scheme (note that the x-axis is in log scale). Compared
benchmarks from §6.2 in this evaluation. We assume for with no prefetching, we improve freshness significantly by
simplicity that each app has equal memory consumption. reducing the median freshness from 30 minutes to around
3 minutes. Our scheme also outperforms the pulling-based
scheme, whose median freshness is about 10 minutes.
1
0.9 6.5.2 Performance of Preloading
Cumulative Probability
0.8 In this experiment, we look at how app loading time can
0.7 be improved by our CBL learner. We compare our scheme
0.6 against LRU caching, which is the standard policy on most
smartphones including Windows Phone. In this experiment,
0.5
we select 24 popular apps (including games, social apps, and
0.4 First-party apps) as follower to cover the most common app
0.3 usage cases on WP platform. We assume that the memory
0.2 manager allows up to five apps, as is the case on the current
Email w/o Prefetching Windows Phone platform. We also assume that every app
0.1 Email w/ Pulling
Email w/ Prefetching has equal memory consumption.
0 While both CBL and LRU take advantages of bursty be-
1s 30s 5m 30m 1d
havior of apps, there is a subtle but important difference in
Freshness (minutes) the way FALCON vs. LRU work for bursty apps. It might
seem like LRU would work well when apps are bursty, but
Figure 15: Benefit of prelaunching for app freshness. the burstiness of apps (e.g. games) is at the timescale of
Email is used as a representative application that days, not minutes. In other words, a “bursty game” might
is both heavily used and has high network content be used once or twice a day. LRU is designed to work well
fetch time. when burstiness is at short timescales, where apps are so fre-
quently used that they are not evicted. CBL is able to take
advantage of burstiness at the timescale of days because we
6.5.1 Performance of Prefetching are looking at longer term contextual and session behavior.
In this experiment, we look at the benefit for apps that Our CBL outperforms LRU by up to 100% in terms of
require fetching new content during the launch process. We loading time. Figure 16 shows the median loading time is
take the Email application as a representative app, which is around 1 second and 2 seconds for CBL and LRU, respec-1 Binary Size 129 KB
Memory (stable state) 1840 KB
0.9
Processor utilization (stable state)1 1
0.9 0.9
0.8 0.8
Precision 0.7 0.7
0.6 0.6
Recall
0.5 0.5
0.4 0.4
0.3 0.3
0.2 0.2
Top-1 prelaunched Top-1 prelaunched
0.1 Top-3 prelaunched 0.1 Top-3 prelaunched
Top-5 prelaunched Top-5 prelaunched
0 0
7 42 84 168 252 7 42 84 168 252
Number of bootstrap days Number of bootstrap days
(a) Precision (b) Recall
Figure 18: Precision and recall of bootstrapping.
for two reasons: a) we don’t need GPS geo-location since we duces the total launch time by calling an app’s prelaunch
only need cluster-level information, hence cell tower trian- routine.
gulation will suffice, and b) we can be opportunistic about Recently, [7] proposed the use of user context informa-
obtaining GPS readings by leveraging cached geo-location tion from sensors to improve mobile operating system per-
results generated from other app’s requests. In this manner, formance, and suggested that OS-managed context could
geo-location information can be obtained with low cost. benefit user privacy, energy, system performance. The au-
Another component of our system is online feature ex- thors speculated that core system services – among others,
traction. Our current implementation of location clustering memory management and process scheduling – could be ben-
is relatively expensive to perform on a mobile phone, and eficiaries of sensor context signals.
therefore needs to be done in the cloud. In contrast, the Browsers and other web systems have long known how
burst detection can be done online with a slightly modified to employ content prefetching and caching to decrease page
version of the wavelet-based burst detection algorithm de- load times [6]. A draft HTML specification includes prefetch
scribed in §4. We implemented a light-weight online burst attributes as hints to the browser [4]. These prefetch mech-
window detection algorithm that adapts the sliding window anisms generally do not guide prefetch decision making, as
size based on historical data, and uses the window to detect our launch predictor does, and are not cognizant of mobile
bursts. Our measurements indicate that our online burst de- context nor energy concerns. Recently, [10] studied mobile
tection has a small performance loss compared to the wavelet web usage data and built a predictive page loading mecha-
based scheme as presented in [15], with 4% less precision, nism based on dividing pages into regularly visited sites and
and 10% less recall. spontaneously visited sites.
Several platform-specific tweaking programs allow mobile
users to configure app loading according to preset rules [5].
7. RELATED WORK The shortcomings of these programs are that they stop short
Systems optimizations for faster application launching has of addressing total launch time, and manually maintaining
a long history on non-mobile computer systems. One area a rule-based system for the typical user is challenging.
that has received significant treatment is the arrangement
of code and data on disk for faster loading. Windows sorts
code and data blocks on disk to minimize disk head move- 8. DISCUSSION AND CONCLUSION
ment during launch, and defragments files on disk for faster Mobile device usage is inherently brief, competing with
launching. Intel TurboMemory supports pinning selected myriad other real demands on human attention. As such,
applications’ blocks to high performance cache to speed launch it is important that app interactions are rapid and respon-
times. [9] investigates interleaving I/O fetch and code ex- sive. Despite the fact that mobile devices are becoming in-
ecution to increase app launch times. These schemes are creasingly resource rich, launch times are and will remain
complementary to our use of context for making prelaunch a significant challenge. This is due to two reasons. First,
decisions. network-bound apps will continue to be limited by network
SuperFetch, a part of Windows OS, is an extension to the fetch latency, which is constrained by cellular technology.
memory manager that tries to predict future code and data Second, increasingly graphics- and media-rich apps targeting
accesses and preload them. The scheme works by learning up-market phones will perpetually leave previous-generation
the user’s favorite apps based on time of day and day of the and budget smartphones feeling sluggish to launch apps.
week, and loading these when there are free pages available. Our work addresses this important problem through the
Unlike FALCON, SuperFetch does not use predictive mobile design of FALCON, a system that uses location and temporal
context such as location nor energy budgets in its loading contexts to predictively launch applications, thereby reduc-
decisions. Whereas both FALCON and SuperFetch interface ing perceived delay for users. We designed a set of features
with the memory manager to load apps, FALCON further re- to capture the essential characteristics of app access pat-terns, and a launch predictor to adaptively balances latency 10. REFERENCES
reduction benefit with energy launch costs. We have shown [1] Apple - batteries - iphone.
http://www.apple.com/batteries/iphone.html.
that launch prediction using context can yield latency reduc-
[2] Daily tip: How to make your iphone camera launch
tions of around 50% vs. LRU at a manageable 2% energy instantly [jailbreak].
cost, and present fresh content at launch within the last 3 http://www.tipb.com/2011/04/20/daily-tip-iphone-camera-
minutes. The FALCON modification to the Windows Phone launch-instantly-jailbreak/.
OS consists of a context source manager, embedded launch [3] ios 5 slowing iphone 4 and 4s complaints.
predictor and prelaunch event upcall dispatcher. These el- http://www.phonesreview.co.uk/2011/10/25/ios-5-slowing-
ements are sufficiently low overhead to require only 2MB iphone-4-and-4s-complaints/.
memory and negligible energy and processing. [4] Link prefetching.
https://developer.mozilla.org/en/link_prefetching_faq.
Although our results show dramatic benefits of FALCON,
[5] Tasker. http://tasker.dinglisch.net/.
there are several possible improvements and opportunities [6] C. C. Aggarwal, J. L. Wolf, and P. S. Yu. Caching on the
that we have not explored. One area is eliminating reliance world wide web. IEEE Trans. Knowl. Data Eng., 1999.
on external servers or cloud services for model training in [7] D. Chu, A. Kansal, J. Liu, and F. Zhao. Mobile apps: it’s
FALCON, thereby mitigating the need for sharing personal time to move up to condos. In Proceedings of the 13th
data with external service providers. An additional ben- USENIX conference on Hot topics in operating systems,
efit of reducing reliance on the cloud is faster adaptation HotOS’13, 2011.
to underlying changes in app usage habits. Another open [8] D. Garlan, D. P. Siewiorek, and P. Steenkiste. Project aura:
Toward distraction-free pervasive computing. IEEE
question is how users’ expectations will change as the OS
Pervasive Computing, 1:22–31, 2002.
predictively prelaunches apps on their behalf. Will the fact
[9] Y. Joo, J. Ryu, S. Park, and K. G. Shin. Fast: Quick
that prelaunching can result in variable launch time hinder application launch on solid-state drives. In FAST, pages
usability of mobile applications or will users appreciate the 259–272, 2011.
quicker interactions that are made possible by such tech- [10] D. Lymberopoulos, O. Riva, K. Strauss, A. Mittal, and
niques? We will address these questions in future studies. A. Ntoulas. Instant web browsing for mobile devices.
[11] H. J. Miller and J. Han. Geographic Data Mining and
Knowledge Discovery. Taylor & Francis, Inc., 2009.
9. ACKNOWLEDGEMENTS [12] F. Qian, Z. Wang, A. Gerber, Z. M. Mao, S. Sen, and
We extend our thanks to Lin Zhong, Ahmad Rahmati, O. Spatscheck. Profiling resource usage for mobile
Clayton Shepard, and the Rice LiveLab team for making applications: a cross-layer approach. In MobiSys, pages
321–334, 2011.
available their extensive mobile user study dataset. We
[13] M. Satyanarayanan. Pervasive computing: Vision and
would also like to thank Alec Wolman for helpful discus- challenges. IEEE Personal Communications, 8:10–17, 2001.
sions and draft feedback, Alexander Varshavsky for shep- [14] C. Shepard, A. Rahmati, C. Tossell, L. Zhong, and
herding, and the anonymous reviewers for their comments. P. Kortum. Livelab: measuring wireless networks and
This research was supported by NSF grants CNS-0546177 smartphone users in the field. SIGMETRICS Perform.
and CNS-0910900. Eval. Rev., 2011.
[15] Y. Zhu and D. Shasha. Efficient elastic burst detection in
data streams. In KDD ’03.You can also read