Studies of General Precipitation Features with TRMM PR Data: An Extensive Overview - MDPI
←
→
Page content transcription
If your browser does not render page correctly, please read the page content below
remote sensing
Review
Studies of General Precipitation Features with
TRMM PR Data: An Extensive Overview
Nan Li 1,2, * , Zhenhui Wang 1 , Xi Chen 3 and Geoffrey Austin 4
 1    CMA Key Laboratory for Aerosol-Cloud-Precipitation, School of Atmospheric Physics, Nanjing University
      of Information Science and Technology, Nanjing 210044, China; eiap@nuist.edu.cn
 2    Laboratory of Straits Meteorology, Xiamen 361012, China
 3    Shanghai Meteorological Sci-Tech Service Centre, Shanghai 200030; chenxiqiuchi@163.com
 4    Department of Physics, The University of Auckland, Auckland 1142, New Zealand; gaustinster@gmail.com
 *    Correspondence: shangjineh@163.com

 Received: 3 October 2018; Accepted: 14 December 2018; Published: 4 January 2019

 Abstract: The Precipitation Radar (PR), the first space-borne precipitation radar onboard the Tropical
 Rainfall Measuring Mission (TRMM) satellite, could observe three-dimensional precipitation in global
 tropical regions and acquire continuous rainfall information with moderate temporal and high spatial
 resolutions. TRMM PR had carried out 17 years of observations and ended collecting data in April,
 2015. So far, comprehensive and abundant research results related to the application of PR data have
 been analyzed in the current literature, but overall precipitation features are not yet identified, a gap
 that this review intends to fill. Studies on comparisons with ground-based radars and rain gauges are
 first introduced to summarize the reliability of PR observations or estimates. Then, this paper focuses
 on general precipitation features abstracted from about 130 studies, from 2000 to 2018, regarding
 lightning analysis, latent heat retrieval, and rainfall observation by PR data. Finally, we describe the
 existing problems and limitations as well as the future prospects of the space-borne precipitation
 radar data.

 Keywords: tropical rainfall measuring mission; precipitation radar; precipitation features; latent
 heat; lightning

1. Introduction
     Precipitation is any product of the condensation of atmospheric water vapor that falls under
gravity to the earth surface. It plays an important role for dynamic analysis of weather process,
numerical weather prediction, water balance, hydrological model and climate change. It also has a
significant impact on the economy and people’s livelihood.
     The tropical region accounts for 40% of the Earth’s surface and about half of the world’s population.
However, tropical precipitation accounts for over two-thirds of the global precipitation. Most of the
tropical regions are ocean, desert or rainforests where rain gauges and ground radars are rare, and this
makes it difficult to implement conventional rainfall observation over much of the region.

1.1. The Tropical Rainfall Measuring Mission (TRMM)
     As an important step in the measurement of tropical rainfall, TRMM was developed jointly by
the National Aeronautics and Space Administration (NASA) of United States and the National Space
Development Agency (NASDA) of Japan, and was launched on 27 November 1997 [1]. The TRMM
satellite traveled around the Earth in about 92 minutes with an orbital inclination about 35◦ and there
were 15 or 16 orbits in a day. In August 2001, the orbit height of the satellite was boosted to 402.5 km
from 350 km at the launch in order to reduce power consumption and extend the life of the satellite.

Remote Sens. 2019, 11, 80; doi:10.3390/rs11010080                       www.mdpi.com/journal/remotesensing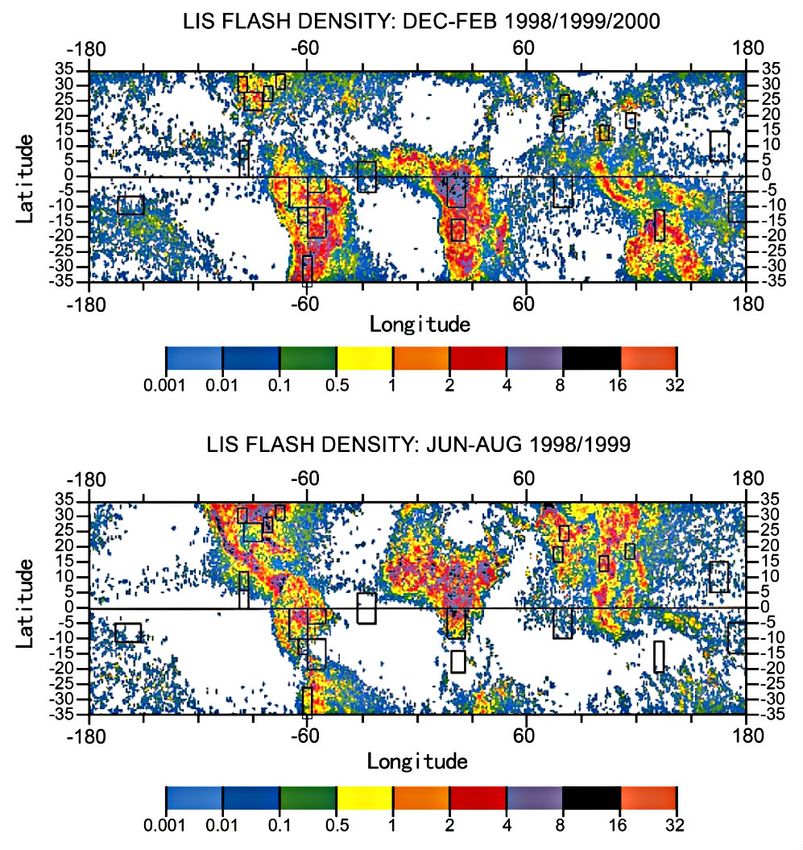
Remote Sens. 2019, 11, 80                                                                                                       2 of 34

After over 17 years of data collecting, the instruments on TRMM were turned off on 8 April 2015.
The spacecraft rushed into the Earth’s atmosphere over the South Indian Ocean on 15 June 2015 and
       Remote Sens. 2018, 10, x FOR PEER REVIEW                                       2 of 33
most of the spacecraft was burned up.
          satellite. After over 17 years of data collecting, the instruments on TRMM were turned off on 8 April
1.2. The 2015.
         Precipitation Radarrushed
               The spacecraft (PR) into the Earth’s atmosphere over the South Indian Ocean on 15 June
          2015 and most of the spacecraft was burned up.
     TRMM satellite carried three primary instruments, Precipitation Radar (PR), TRMM Microwave
Imager 1.2.
         (TMI)The and
                   Precipitation
                        VisibleRadar     (PR)
                                   and Infrared      Scanner (VIRS). It also carried Lightning Imaging Sensor (LIS)
and Clouds TRMM and the    Earth’s
                        satellite     Radiant
                                  carried  three Energy     System Instrument
                                                  primary instruments,      Precipitation(CERES).
                                                                                              Radar (PR), TRMM Microwave
         Imager    (TMI)   and  Visible   and   Infrared  Scanner    (VIRS).
     PR was the first space-borne precipitation radar in the world [2–5].      It  also  carried  Lightning    ImagingatSensor
                                                                                                        It operated        a frequency
         (LIS) and Clouds and the Earth's Radiant Energy System Instrument (CERES).
of 13.8 GHz (Ku band) or a wavelength about 2.2 cm. PR scanned perpendicularly to the satellite
               PR was the first space-borne precipitation radar in the world [2-5]. It operated at a frequency of
orientation   with a scanning angle of 17◦ and had an observation range between 36◦ S–36◦ N. The swath
         13.8 GHz (Ku band) or a wavelength about 2.2 cm. PR scanned perpendicularly to the satellite
width was    247 kmwith
         orientation    witha ascanning
                                  horizontalangleresolution
                                                   of 17° andat  hadtheanground      5 kmrange
                                                                           observation       afterbetween
                                                                                                    the boost 36°while
                                                                                                                  S–36° it
                                                                                                                         N.was
                                                                                                                             The 215 km
with 4.3swath
          km atwidth
                   the launch.
                         was 247 km Thewith
                                          vertical   detection
                                              a horizontal         rangeatwas
                                                             resolution            from the
                                                                             the ground     5 kmground
                                                                                                  after thesurface   up to
                                                                                                             boost while     a height of
                                                                                                                          it was
about 20215
          kmkm     witha 4.3
                 with    highkmrange
                                  at the resolution
                                         launch. The of vertical
                                                          250 mdetection
                                                                    (Figurerange
                                                                               1). PR washadfrom  the grounddetectable
                                                                                               a minimum        surface up to   a
                                                                                                                             equivalent
         height   of  about   20  km   with   a  high  range    resolution    of  250  m   (Figure   1).
reflectivity factor of 18 dBZ [6], and through rigorous calibrations, it had reflectivity error within   PR   had  a minimum
         detectable equivalent reflectivity factor of 18 dBZ [6], and through rigorous calibrations, it had
1 dBZ [3,7–9]. In addition, the PR system noise level was also quite stable with a periodic change less
         reflectivity error within 1 dBZ [3,7-9]. In addition, the PR system noise level was also quite stable
than 0.15   dBa[10].
         with     periodic change less than 0.15 dB [10].
     Due to Due the to
                     satellite  platform,
                       the satellite          PRPR
                                      platform,    hadhada aview
                                                             view of   thewhole
                                                                    of the  whole      tropical
                                                                                    tropical       region
                                                                                               region  fromfrom    the and
                                                                                                             the space  spacedidand did
not suffer
         notfrom    surface
               suffer  from constraints        like thelike
                               surface constraints       curvature      of the earth
                                                               the curvature       of theand    beam
                                                                                             earth   andblocking    for ground-based
                                                                                                           beam blocking      for
         ground-based      radars.   As  an  active  remote   sensing    instrument,     PR   could
radars. As an active remote sensing instrument, PR could achieve all-weather and all-day observation  achieve  all-weather   and
         all-day
of rainfall  withobservation       of rainfall quantitative
                     3D high-resolution          with 3D high-resolution
                                                                   measurement.   quantitative    measurement.
                                                                                          With these                With PR
                                                                                                          advantages,      these
                                                                                                                               played a
         advantages, PR played a crucial role in TRMM's goals such as measurements of precipitation and
crucial role in TRMM’s goals such as measurements of precipitation and latent heating [2].
          latent heating [2].

              Figure 1. A schematic diagram of the detection of TRMM (Tropical Rainfall Measuring Mission)
      Figure 1.   A schematic diagram of the detection of TRMM (Tropical Rainfall Measuring Mission)
              including PR (Precipitation Radar). ([1])
      including PR (Precipitation Radar) [1].
        1.3. PR Products
1.3. PR Products
     The PR standard products can be classified into Level 1 (1B21, 1C21), Level 2 (2A21, 2A23,
2A25), and Level 3 (3A25, 3A26), in which Level 1 and Level 2 products are data in the instantaneous
field of view (FOV) and Level 3 products are data of monthly statistical values for rain parameters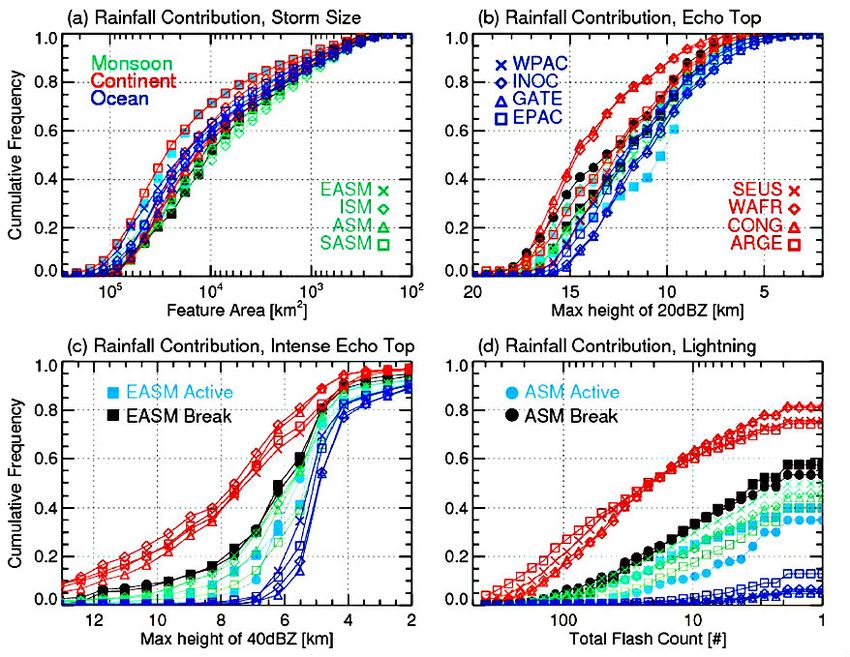
Remote Sens. 2019, 11, 80                                                                                                      3 of 34

(Table 1). Due to the TRMM boost from 350 km to 402.5 km in August 2001, major impacts on PR
observations included the degradation of PR sensitivity, the increase of the footprint size, and the
mismatch between transmission and reception angles for one pulse among onboard averaging pulses,
leading to small changes in PR reflectivity and rainfall estimation [11,12]. Detailed descriptions of PR
product algorithms and the changes between versions can be referred to Table 2 and the "Instruction
Manual of TRMM PR Algorithm" at the website of Japan Aerospace Exploration Agency (JAXA) [13].

       Table 1. TRMM (Tropical Rainfall Measuring Mission) standard PR (Precipitation Radar) products.

       Products                   Name                                            Brief Description
               1B21          PR Power                      total received power and the noise level clutter contamination.
   Level 1
               1C21        PR Reflectivity                     radar reflectivity factors without attenuation correction.
               2A21     Surface Cross Section                     the surface cross section and the path attenuation.
   Level 2     2A23        PR Qualitative           the detection of rain and the bright band, and the classification of rain types.
                                                        vertical profiles of rainfall rates and the attenuation corrected radar
               2A25             PR Profile
                                                                                   reflectivity factors.
                                                     monthly accumulations of 1C21, 2A21, 2A23 and 2A25 products at 5◦ ×5◦
               3A25             PR Rainfall
   Level 3                                                                      grid and 0.5◦ × 0.5◦ grid.
                                                      monthly probability distribution of path-averaged rain rates and the rain
               3A26            Surface Rain
                                                                         rates on fixed heights at 5◦ × 5◦ grid.

                             Table 2. Major changes of PR products from the previous version.

   Product Version                                      Major Changes from the Previous Version
                                                      modified definition of the reliability factor;
                                                           subdivided rain type categories;
       Version 5                                    modified drop size distribution (DSD) models;
                                                    introduced new vertical rain structure model;
                                       modified weighting factor of the hybrid method for attenuation correction.
                                     improved estimation rain rate in the range that is cluttered by the surface echo;
                                                      introduced attenuation correction of gaseous;
       Version 6                                                modified initial DSD model;
                                     modified calculation of reflectivity and rainfall rate in the attenuation correction;
                                                  disabled non-uniform beam filling (NUBF) correction.
                                                            introduced new NUBF correction;
                                              defined new profiles of the phase state model of hydrometeors;
       Version 7                   modified default parameters in the attenuation correction and the rainfall estimation;
                                          introduced new error sources in the path integrated attenuation (PIA);
                            estimated PIA to the rain bottom by the maximum likelihood method instead of the mean estimate.

1.4. Existing Studies on Precipitation Features Using the PR Data
     In addition to the two primary goals of determining surface rainfall patterns and latent heating
profiles, the actual much longer life cycle of the TRMM was helpful for studies on characteristics of
precipitation with enough samples in the tropics and subtropics, compared to the expected duration in
orbit of about three years. In fact, most of the existing studies using the PR data were precipitation
observations for a period of years, and some were studies on the physical phenomena during
precipitation processes including latent heat and lightning. Although the TRMM and the PR had
ended in 2015, related studies still continued using PR data storage.
     The University of Utah Precipitation Measuring Missions (PMM) science group has accomplished
a great deal studying precipitation features from the PR data. The group has established an event-based
reanalysis database of precipitation feature from temporally and spatially collocated TRMM data and,
afterwards, climatological descriptions of the identified features are generated [14]. Other research
groups include the Houze group and the International Precipitation Working Group (IPWG) [15].
The Houze group interpolated and geolocated the PR data into a three-dimensional Cartesian grid,
and from this stored dataset it is possible to identify structures of echoes that satisfy certain criteria [16].
The authors of this article have been paying attention to this field since 1997 [4,17] and especially in the
Remote Sens. 2019, 11, 80                                                                                      4 of 34

last few years we have reviewed much of the literature with the support of a Commonwealth Industry
Research Project.

1.5. The Goal of the Review
     To the best of our knowledge, there is no paper that incorporates and integrates the specific
research results to extract some general precipitation features from all existing studies. Therefore,
the goal of this review is to seek an overall understanding of tropical precipitation by investigating
common achievements among the isolated studies, and exploring the problems and future prospects
in using the space-borne precipitation radar data.
     In this review, we summarize features of precipitation and the related physical phenomena in
existing studies mainly using the PR data. While introducing the selected studies, we lay emphasis on
abstracting general and reliable conclusions, rather than presenting the research aims, processes or
significances, regarding it being difficult to give full treatment and cover details of numerous studies
in a usual review article. Although many studies used older versions of PR products, the revealing
conclusions in them are independently meaningful. Nevertheless, we still give information of PR
product versions, study periods, and study regions for reference.
     The approach of this review is to identify categories of the mentioned contents in the studies,
single out the agreement and disagreement, reveal general precipitation features that may come to
light in the context of multiple studies, and analyze possible mechanisms yielding the conclusions.
One advantage of this review is the aggregation of information leading to a higher statistical power
and more robust conclusion than is possible from the specific measure derived from the individual
studies, and provide useful reference and inspiration for studies relating to the next generation of
space-borne precipitation radar.
     In the remainder of the paper, the content is structured as follows. To illustrate the reliability of
PR data, Section 2 introduces comparison studies between precipitation measures obtained by the PR
with that observed by ground-based radars or rain gauges. Sections 3–5 elaborate the PR measures
on, respectively, lightning analysis, latent heat retrieval and rainfall observation. In Section 6, the
conclusion, existing problems, future prospects in using space-borne precipitation radar data as well
as the review limitation are presented. A conceptual scheme of the paper is shown in Figure 2.
         Remote Sens. 2018, 10, x FOR PEER REVIEW                                                    5 of 33

                                          Figure 2. A conceptual scheme of the article.
                                       Figure 2. A conceptual scheme of the article.
         2. The Reliability Evaluation of PR Data by Comparisons with Ground-Based Instruments
              In order to provide accurate rainfall measurements, PR needed to be evaluated or calibrated
         before the data can be used in further applications with confidence. A variety of studies have been
         carried out to address the issue through cross comparisons of PR and ground-based instruments. A
         fundamental difficulty with this sort of research is that all the measurement equipment including
         rain gauges and ground-based radars have different sampling spaces and time resolutions as well as
Remote Sens. 2019, 11, 80                                                                            5 of 34

2. The Reliability Evaluation of PR Data by Comparisons with Ground-Based Instruments
     In order to provide accurate rainfall measurements, PR needed to be evaluated or calibrated
before the data can be used in further applications with confidence. A variety of studies have been
carried out to address the issue through cross comparisons of PR and ground-based instruments.
A fundamental difficulty with this sort of research is that all the measurement equipment including
rain gauges and ground-based radars have different sampling spaces and time resolutions as well as
their own systematic errors.
     In fact, before the cross comparison could be performed, it should be considered that there are
objective factors affecting PR measurements. First of all, attenuation correction should be taken into
account for PR since it worked at the Ku band suffering extensively from rain attenuation [18,19].
Secondly, the NUBF needed to be considered [18,20,21]. Additionally, non-Rayleigh scattering might
frequently occur for PR because it operated at a short wavelength, inducing reflectivity differences
compared with GR, particularly for rain containing large or solid drops. This difference needed to
be corrected before the comparison of PR and GR [22–24]. Some of these issues had already been
addressed in the products of PR data, such as corrections of attenuation and NUBF, but might be
not satisfying.

2.1. Comparisons of Reflectivity with Ground-Based Radars
      Both the PR and the ground-based radar (GR) detected radar reflectivity of rainfall and hence
could be compared with each other. Key information of the studies on reflectivity comparison of PR
with GR is listed in Table 3.
      There are four primary TRMM Ground Validation (GV) radar sites around the world: Houston,
Texas (S-band), Melbourne, Florida (S-band), Kwajalein, Republic of the Marshall Islands (S-band),
and Darwin, Australia (C-band). These famous GV radars had already been corrected and thus could
be served as credible references for PR measurements [25,26]. Before the reflectivity comparison of PR
and GR, spatial matching of measurements should be carried out since PR and GR had different view
angles, scanning modes, and data resolutions. The matching approaches could be classified into two
categories: grid-matching [27,28] and area-matching [29,30].
      When the reflectivity of calibrated GR was used as the reference, PR reflectivity could be evaluated.
It was shown that PR reflectivity generally agreed well with GR reflectivity, but a notable difference was
that PR highly undersampled weak echoes below the detection sensitivity of PR [25,29]. Fortunately,
this defect had no substantial effect on the total accumulated rainfall measurements because the weak
echoes contributed little to the precipitation amounts. Most studies showed that the attenuation
correction of PR performed quite well for stratiform rain but insufficiently for convective rain from
studies comparing PR with GR for different rain types and different altitudes (Figure 3) [27,30,31].
An exception was a study indicating that the attenuation was accurately correcting for convective rain
and was overcorrecting for stratiform rain [28], but it was noted that the non-Rayleigh scattering was
not taken into account before the comparison.
      On the other hand, some scholars used the reliable PR reflectivity as the reference to evaluate or
calibrate the GR reflectivity. Gabella et al. [32–35] designed range-dependent adjustment methods for
the compensation of GR observations in consideration of the increasing sampling volume of the GR
with range, and used this method to improve the rainfall estimation of the GR. Some recent studies
made comparisons to evaluate the GR reflectivity in East Asia [36–40], in which stratiform precipitation
was generally used to avoid uncertainties of PR products related to convective rain.
      To analyze in detail the sources and magnitudes of discrepancies between PR and GR reflectivity,
it is necessary to adopt more and further simulation studies or dual-polarimetric radar observations
for various possible situations like rainfall types, intensities and space-time positions, phase states of
drops, topography effect, etc. Early examples are studies of [20,23].
Remote Sens. 2019, 11, 80 6 of 34
Table 3. Key information on the studies of comparisons of PR with GRs (ground-based radars).
Preprocessing before
Reference Period Ground-Based Radar Products (Version) of PR Matching Method Study Region
Comparison
an S-band radar of National Center
Bolen and non-Rayleigh scattering grid-matching and
Aug. 1998 for Atmospheric Research (NCAR), PR data Melbourne, US
Chandrasekar [29] correction area-matching
US
data removal in shielded or
Gabella et al. [32] 12 Feb. 2002 a C-band radar in Kykkos, Cyprus 2A25 grid-matching Cyprus
clutter areas
southeast corner of the
Gabella et al. [33] 3 to 21 Mar. 2003 a C-band radar at Shacham in Israel 2A25 / grid-matching
Mediterranean Sea
two C-band radars at Kykkos in southeast corner of the
Gabella et al. [35] Feb. 2002 and 2003 2A25 / grid-matching
Cyprus and at Shacham in Israel Mediterranean Sea
S-band radars in Jindo, Pusan,
Kim et al. [36] Aug. 2006 to Aug. 2010 2A25 (version6) / area-matching Korean Peninsula and inshore areas
Gosan and Seongsan, Korea
removal of precipitation
2A25 (version6 and
Li et al. [40] 2003–2014 an S-band radar in Nanjing, China boundaries; non-Rayleigh grid-matching Nanjing, China
version7)
scattering correction
the S-band radar in Melbourne, non-Rayleigh scattering
Liao et al. [31] 1998 2A25 grid-matching Melbourne, US
Florida, US correction
Liao and the S-band radar in Melbourne, non-Rayleigh scattering
1998–2007 2A25 (version6) grid-matching Melbourne, US
Meneghini [27] Florida, US correction
Park et al. [37] Jun. to Aug. 2012 6 S-band radars in Korea 2A25 (version7) / grid-matching Korean Peninsula and inshore areas
Schumacher and the S-band radar in Kwajalein,
Aug. 1998 to Aug. 1999 2A25 / grid-matching Kwajalein, Marshall Islands
Houze [25] Republic of the Marshall Islands
southeastern US; Darwin, Australia;
Schwaller and non-Rayleigh scattering
Aug. 2006 to Mar. 2009 25 S-band and C-band radars 2A25 (version6) area-matching Gosan, Korea; Kwajalein, Marshall
Morris [30] correction
Islands
the S-band and C-band radars in
Houston and Melbourne, US;
Houston, Texas; Melbourne, Florida;
Wang and Wolff [28] 1998–2007 2A25 (version6) / grid-matching Kwajalein, Marshall Islands; Darwin,
Kwajalein, Republic of the Marshall
Australia
Islands; Darwin, Australia
non-Rayleigh scattering
Wang et al. [38] 2007 an S-band radar in Shanghai, China 2A25 (version6) area-matching Shanghai, China
correction
an S-band polarimetric radar of
non-Rayleigh scattering
Wen et al. [23] 2005–2009 National Severe Storms Laboratory 2A25 (version6) area-matching Norman, US
correction
(NSSL), US
Jun., Jul., and Aug. of 23 S-band radars in central and
Zhong et al. [39] 2A25 (version7) / grid-matching China
2011 and 2012 south China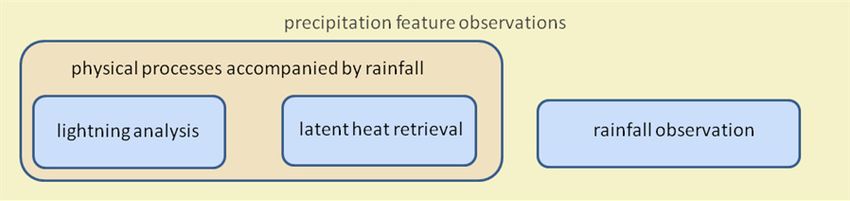
give larger echo area and weaker echo intensity due to a coarse horizontal resolution, and give
stronger echo intensity due to non-Rayleigh scattering. PR captured most of the rainfall amount
though light rain and rain area might be overlooked because of the low detection sensitivity. It
seems that PR tended to give underestimation of rainfall amount for convective and heavy
         Remote Sens.
precipitation          give11,overestimation
                 and2019,      80                for light precipitation because of the incomplete attenuation     7 of 34

correction of PR products and the coarse temporal and horizontally spatial resolution of PR
measurements.
         2.2. Comparisons of Quantitative Precipitation Estimation with Ground-Based Radars
     With new versions of PR products, further studies are necessary to quantitatively distinguish
               Quantitative precipitation estimation (QPE) can be used as criteria to evaluate the measurement
the rolesof of  factors like grid and time resolution, rainfall types and amounts under different
            PR or GR since the QPE derived from reflectivity is a straight application of radar detection.
samplingKeytime    scales, the
               information        parameters
                              about  the studiesinon
                                                   the
                                                     QPEZ–R   relationship
                                                           comparison        ofwith
                                                                         of PR  PR algorithms,    distribution
                                                                                    GR is listed in Table 4.     density
of rain gauges,     etc. It  had   been  noted    that  the peak   of  high  correlation  of  PR  and    the rain
               In general, the rain rates estimated by PR agreed well with GR on different spatial and temporal    gauge
observations
         scales occurred
                  although PR formissed
                                   the near    nadir cases
                                          the majority         andrains
                                                         of light    several   minutes
                                                                         [41–43].       afterQPE
                                                                                  The major    the error
                                                                                                     instantaneous     PR
                                                                                                           sources of PR
observation    because
         included         it tookZ–R
                     inaccurate    minutes    for theMie
                                       relationship,   raindrops    to reach
                                                          scattering,         the ground
                                                                       attenuation,        surface
                                                                                    and NUBF        [67].
                                                                                                [44,45].

     Figure 3.Figure   3. Scatterplots
                 Scatterplots          of radar
                                  of radar       reflectivityfactors
                                             reflectivity     factors (top)
                                                                       (top)and their
                                                                              and     probability
                                                                                   their          densitydensity
                                                                                          probability     functionsfunctions
                                                                                                                    (bottom)
              at a height   of 1.5 km  derived  from   210  TRMM    overpasses   over  Melbourne
     (bottom) at a height of 1.5 km derived from 210 TRMM overpasses over Melbourne for the period for the period 1998-2007.
              "PR"PR
     1998-2007.   m " and  "PR" refer to the PR-measured, and PR-corrected reflectivities, respectively. ([27] © American
                      m" and "PR" refer to the PR-measured, and PR-corrected reflectivities, respectively.
              Meteorological Society. Used with permission.).
     ([27] © American Meteorological Society. Used with permission.).

3. Lightning Analysis of PR Data
     Studies on lightning accompanied by rainfall are important for the analysis of microphysical
processes and precipitation mechanisms. Some researchers investigated characteristics of the
lightning activity using PR data of rain type, rainfall rate, and vertical reflectivity profile (Table 6).

3.1. Lightning Activity over Land and Oceans
     Studies noted that lightning appeared more frequently over land than over oceans (Figure 4)
[73-78]. It is well known that the charge separation mechanism requires collisions between graupel
Remote Sens. 2019, 11, 80 8 of 34
Table 4. Key information on the studies of QPE (quantitative precipitation estimation) comparison of PR with GR.
Reference Period Ground-Based Radar Products (Version) of PR Spatial Scale Conclusion Study Region
the S-band and C-band radars in
Houston, and Melbourn, US;
Houston, Texas; Melbourne, Florida; higher than GR at Kwajalein while
Wolff et al. [41] 1998–2002 3G68 (version6) 0.5◦ × 0.5◦ Kwajalein, Marshall Islands;
Kwajalein, Republic of the Marshall lower than GR at Melbourne
Darwin, Australia
Islands; Darwin, Australia
the S-band radars in Houston, Texas;
PR missed the majority of light rains Houston, and Melbourn, US;
Gebremichael et al. [42] 1998–2000 Melbourne, Florida; Kwajalein, 2A25 (version5) 4–64 km
compared with GR Kwajalein, Marshall Islands;
Republic of the Marshall Islands
the S-band radars in Melbourne, lower than GR over land and coasts
Melbourne, US; Kwajalein,
Wolff and Fisher [43] 1999–2004 Florida; Kwajalein, Republic of the 3G68 (version6) 0.5◦ × 0.5◦ while higher than GR over oceans at
Marshall Islands
Marshall Islands Melbourne; lower than GR at Kwajalein
rain rate estimates show quite good
S-band Weather Surveillance
agreement for rainfall accumulations
Radar-1988Doppler (WSR-88D) 0.04◦ × 0.04◦
Amitai et al. [44] 2007–2010 2A25 (version6) while probability distribution of PR southern US
network, US and a C-band dual 5 km × 5 km
shifted toward lower rain rates for
polarimetric radar in Alabama, US
instantaneous rainfall estimates
PR missed majority of light rain, and
Kirstetter et al. [45] Mar. to May 2011 S-band WSR-88D, network, US 2A25 (version6) 4.5 km × 4.5 km probability distribution of PR shifted southern US
toward lower rain rates
2A25 (version6 and
Kirstetter et al. [46] Mar. to May 2011 S-band WSR-88D network, US 5 km × 5 km lower than GR southern US
version 7)Remote Sens. 2019, 11, 80 9 of 34
2.3. Comparisons of Rainfall Rate with Rain Gauges
Observations of rain gauges can be also used as references to compare with rainfall measurements
of PR. Key information of the studies on comparisons of rainfall rate derived from PR with rain gauges
is listed in Table 5.
In general, PR and the rain gauges gave consistent rainfall measurements on the whole,
but discrepancies had been noted in early studies [32,47–49]. Recently, there were more studies
on PR rainfall measurements by comparisons of TRMM Multi-satellite Precipitation Analysis (TMPA)
products 3B42 or 3B43 with rain gauge data over different regions across the world. The results showed
good agreement and high correlation between the two datasets, with some small differences. Most of
the studies implied that there was overestimation for light rainfall and/or underestimation for heavy
rainfall [50–60], but few of them gave an opposite conclusion [61]. Some studies concluded that the
consistency between TMPA products and rain gauge measurements was related to the altitude and the
topography [54,59,61–65].
More attention had been paid to statistics of the results for previous studies on rainfall
measurements of PR and rain gauges. However, the QPE algorithms of PR should also be carefully
analyzed under different situations, and this issue is worth studying before the usual comparisons.
For instance, the DSD used in PR rainfall products might be not suitable for some regions, topography
or seasons. Ioannidou et al. [66] used a 2D-video disdrometer to measure the DSD and establish
the Z–R relationship in Crete island of Greece, and then they found the coefficients of the local Z–R
power laws were different from the values used in PR algorithms and consequently there was an
overestimation of rainfall rate by PR algorithms for light to moderate stratiform rain. In addition,
the improvement of PR products may also affect the results of QPE. Kirstetter et al. [46] analyzed the
error structure of PR QPE products of version 6 and version 7 based on GR products, and the results
indicated that version 7 was in closer agreement than version 6. The bias of the rain rate estimates was
improved from an underestimation bias of −23% of version 6 to −18% of version 7.Remote Sens. 2019, 11, 80 10 of 34
Table 5. Key information of the studies on QPE comparison of PR with rain gauges.
Reference Period Sites Products (Version) of PR Temporal Scale Conclusion Study Region
88 gauges in network of the USDA-ARS
(Agricultural Research Service of U.S. very good agreement with low
Amitai et al. [67] 1999–2010 Department of Agriculture) Walnut 2A25 (version7) 1 minute bias values and high correlation southeastern Arizona, US
Gulch Experimental Watershed with in coefficients
southeastern Arizona, US
daily, monthly and
As-Syakur et al. [68] 1998–2002 3 rain gauges over the island of Bali 3B42 and 3B43 lower than the rain gauges the island of Bali, Indonesia
seasonal
NOAA (National Oceanic and
Demoss and Jan.1998 to tropical Atlantic and Pacific
Atmospheric Administration) tropical 3G68 (version6) 6-hour mean lower than the rain gauges
Bowman [48] May 2005 Oceans
ocean buoys
66 high-resolution rain gauges from the overestimation for high
Fisher [47] 1998–2001 2A25 and 3A25 (version5) monthly Oklahoma, US
Oklahoma Mesonet precipitation months
underestimation for Feb., Mar., Jun.
Dec. 1997 to southeastern
Gabella et al. [32] 25 rain gauges in Cyprus 3A25 (version5) monthly and Jul while overestimation for
Nov. 2002 Mediterranean area
Sep. and Oct.
Liu et al. [49] 1998–2005 430 rain gauges in the southern China 2A25 (version6) annual and season mean lower than the rain gauges southern China
Jul.2009 to Jun. 14 rain gauges in Minas Gerais state,
Nogueira et al. [69] 3B42(version7) daily no significant difference Minas Gerais state, Brazil
2015 Brazil
higher than the rain gauges in
Retalis et al. [63] 1998–2012 113 rain gauges 3B43 (version7) monthly and yearly plain areas while lower in Cyprus
mountain areas
20 standard manual and automatic rain
Prasetia et al. [50] 2004–2008 3A25 (version6) monthly and seasonal underestimation Indonesian
gauges
overestimate light rainfall and
940 rain gauges and 240 synoptic
Moazami et al. [51] 2003–2006 3B42 (version7) daily underestimate moderate and Iran
stations (1180 rain gauges)
heavy rainfall
Jan. 2011 to
Teng et al. [52] 1379 rain gauges in Zhejiang Province 3B42 daily overestimation Zhejiang Province, China
Jul. 2012
daily, monthly and
Gebere et al. [53] 2003–2006 9 rain gauges 3B42 (version7) overestimation eastern region of Ethiopia
seasonal
3B42 (version 6 and underestimationfor V6 and slightly
Fensterseifer et al. [55] 1998–2011 25 rain gauges daily and monthly Southern Brail
version 7) overestimation for V7
Dec. 2000 to 4 mannedstations and 21 automatic sub-daily, daily, monthly overestimationfor light rain and
Hur et al. [60] 3B42 (version7) Singapore
Nov. 2010 stations and seasonal underestimation for heavy rain
Zad et al. [61] 1998–2014 32 rain gauges 3B42 (version7) daily overestimation Pahang, Malaysia
daily, monthly and
dos Reis et al. [70] 2009–2014 11 rain gauges 3B42 (version7) overestimation southeastern Brazil
annual
good agreement with slight
Weiberlen and
1998–2012 22 conventional weather stations 3B42 (version7) daily overestimations or Paraguay
Benı´tez [71]
underestimations
daily, monthly and
Chen et al. [59] 2015–2017 43 rain gauges 3B42 (version7) overestimation Huaihe River basin of China
annualRemote Sens. 2019, 11, 80 11 of 34
Table 5. Cont.
Reference Period Sites Products (Version) of PR Temporal Scale Conclusion Study Region
monthly, seasonal and
Tan et al. [72] 1998–2014 22 rain gauges 3B43 underestimation Singapore
annual
Jul. 2009 to south-southeast region of
Nogueira et al. [69] 14 rain gauges 3B42 (version7) daily overestimation
Jun. 2015 Minas Gerais state, Brazil
3B42 (version 6 and daily, monthly and
Milewski et al. [62] 1998–2012 125 rain gauges 3B42 V7 outperforms 3B42 V6 Northern Morocco
version7) annual
Wehbea et al. [65] 2000–2010 53 rain gauges 3B42 (version7) monthly good agreement United Arab Emirates
daily, monthly and underestimation in rainy regions
Darand et al. [56] 1998–2013 157 synoptic stations 3B42 and 3B43 (version7) Iran
annual and overestimationin dry regions
Apr. 2014 to underestimation for heavy rain
Wang et al. [57] 53 rain gauge stations 3B42 (version7) daily Mekong River Basin
Jan. 2016 and overestimationfor light rain
May to Oct.
Xu et al. [64] 194 rain gauges 3B42 (version7) daily and monthly overestimation southern Tibetan Plateau
2014
daily, monthly and underestimation in wet season and nine mountainous regions
Derin et al. [54] 2000–2013 5-208 rain gauges 3B42 (version7)
annual overestimation in dry season across the globe
underestimations during the northeastern Indian
Terao et al. [58] 2004–2013 36 tipping bucket raingauges 2A25 (version7) instantaneous
monsoon season subcontinentRemote Sens. 2019, 11, 80 12 of 34
2.4. Remarks on the Comparison Studies with Ground-Based Instruments
It was shown from the results of these comparison studies that PR observations or estimates
agreed well with those of reliable ground-based instruments on the whole, but the difference attracted
more attention. Besides small convective rainfall systems, edges of precipitation, and rainfall areas
distant from PR where nonhomogeneous beam filling was likely to occur, PR tended to give larger echo
area and weaker echo intensity due to a coarse horizontal resolution, and give stronger echo intensity
due to non-Rayleigh scattering. PR captured most of the rainfall amount though light rain and rain
area might be overlooked because of the low detection sensitivity. It seems that PR tended to give
underestimation of rainfall amount for convective and heavy precipitation and give overestimation
for light precipitation because of the incomplete attenuation correction of PR products and the coarse
temporal and horizontally spatial resolution of PR measurements.
With new versions of PR products, further studies are necessary to quantitatively distinguish the
roles of factors like grid and time resolution, rainfall types and amounts under different sampling time
scales, the parameters in the Z–R relationship of PR algorithms, distribution density of rain gauges, etc.
It had been noted that the peak of high correlation of PR and the rain gauge observations occurred
for the near nadir cases and several minutes after the instantaneous PR observation because it took
minutes for the raindrops to reach the ground surface [67].
3. Lightning Analysis of PR Data
Studies on lightning accompanied by rainfall are important for the analysis of microphysical
processes and precipitation mechanisms. Some researchers investigated characteristics of the lightning
activity using PR data of rain type, rainfall rate, and vertical reflectivity profile (Table 6).
3.1. Lightning Activity over Land and Oceans
Studies noted that lightning appeared more frequently over land than over oceans (Figure 4) [73–78].
It is well known that the charge separation mechanism requires collisions between graupel and small
ice particles in the presence of supercooled liquid water [77,78]. The environmental differences over
land and oceans could impact the precipitation height and thus the mixed-phase processes, leading to
the significant difference of flash production. Although the difference of lightning occurrence over land
and oceans was noticed, the reasons have not been firmly established. At present, there are two main
theories accounting for the land–ocean contrast of lightning: ground-surface property and aerosol
concentration [79,80]. In our view, the influence of water vapor availability could be also considered,
but there were few related studies. When the water vapor availability over land was not as great
as that over oceans, it might result in higher condensation altitudes and a greater possibility for the
occurrence of solid or mixed phase particles. However, the relative humidity might play opposite roles
in wet or dry regions with different magnitudes of water vapor content [81]. It would be worthwhile
to give further analysis on aspects of all impact factors.
3.2. Lightning Activity Associated with Convective and Stratiform Rainfall
Unsurprisingly, the studies found that lightning occurred more frequently for convective rainfall
than stratiform rainfall [82,83], and it was found that the absence of lightning could be explained
by the stratiform nature of the precipitation patterns [76]. Meanwhile, flashes in stratiform rainfall
accounted for a larger fraction of lightning over oceans than over land [77]. Convective rainfall usually
had larger vertical velocities and developed at higher altitudes and thus had a greater possibility for
the occurrence of lightning in comparison with stratiform rainfall.
3.3. Lightning Activity and the PR Reflectivity
Radar reflectivity was an index to the character of rainfall development and convection intensity,
and it was noticed that lightning occurrence was accompanied by high radar reflectivity [74–76,82]Remote Sens. 2019, 11, 80 13 of 34
and high rainfall rate [73,78,84]. Cecil et al. [75] and Cecil and Zipser [76] found that the possibility
of lightning was a function of radar reflectivity and the depth of reflectivity for a given magnitude.
Similarly, Liu et al. [78] found that the flash rate was a function of the maximum reflectivity and the
area and volume of high reflectivity larger than 30 dBZ.
Lightning is more likely to occur in convective rainfall with strong updraft. Therefore, the
accompanying precipitation often showed uniform vertical structure and the absence of the bright
band. Toracinta et al. [74] and Kodama et al. [82] noticed that rainfall systems with lightning tended to
have a smaller lapse rate of reflectivity with the height above the freezing level than those without
lightning. Tadesse and Anagnostou [85] found that there were weak vertical reflectivity gradients and
obscure bright bands at the growth stage of thunderstorms with high lightning density while strong
vertical gradients and obvious bright bands at the dissipation stage of thunderstorms with lightning
density decreasing rapidly to zero.
Table 6. Key information of the studies on lightning from PR data.
Reference Period Location Products (Version) of PR
Cecil et al. [75]; Cecil and
Dec. 1997 to Dec. 1998 tropics 2A23 and 2A25 (version4)
Zipse [76]
Kodama et al. [82] Jan. and Feb. of 1998–2003 western North Pacific 2A25 (version5)
the University of Utah
Liu et al. [78] 1998–2010 tropics
precipitation feature database
Petersen and Rutledge [73] Dec. 1997 to Feb. 2000 tropics 2A25 (version5)
Peterson and Liu [77] 1998–2009 tropics 2A23 and 2A25 (version7)
Tadesse and Anagnostou [85] Jul. to Dec. 2004 African continent PR precipitation products
Africa, South America, east
Toracinta et al. [74] Aug. to Oct. 1998 2A25 (version4)
Pacific, and west Pacific
Wang et al. [83] 2002–2005 tropics 2A23 and 2A25 (version6)
Zhang, Y. et al. [84] 2007–2008 Nanjing area 2A25 (version7)
3.4. Remarks on the Studies of Lightning with Rainfall
From the results of PR observations, it could be concluded that the lightning probability and high
flash rates were more likely to occur over land for convective rainfall than over oceans for stratiform
rainfall, and with higher radar reflectivity and weaker vertical reflectivity gradients. Nevertheless,
due to the low sensitivity to weak precipitation and phase states of drops, the formation process
of lightning was difficult to be analyzed by PR data alone. Spaceborne microwave radiometer,
cloud-aerosol lidar and cloud radar are possible collaborative instruments as assistance to provide
important information such as water vapor, aerosols and small drops.stratiform rainfall, and with higher radar reflectivity and weaker vertical reflectivity gradients.
Nevertheless, due to the low sensitivity to weak precipitation and phase states of drops, the
formation process of lightning was difficult to be analyzed by PR data alone. Spaceborne microwave
radiometer, cloud-aerosol lidar and cloud radar are possible collaborative instruments as assistance
Remote Sens. 2019, 11, 80 14 of 34
to provide important information such as water vapor, aerosols and small drops.
Figure
Figure 4. Lightning
4. Lightning flash
flash densitiesobserved
densities observedby
by TRMM
TRMM for
forDecember-February
December-February of 1998–2000 and and
of 1998–2000
June–August of 1998–1999. TRMM-PR analysis boxes are indicated. ([73] © American Meteorological
June–August of 1998–1999. TRMM-PR analysis boxes are indicated. ([73] © American Meteorological
Society. Used with permission.).
Society. Used with permission.).
4. Latent Heat Measurements of PR Data
4. Latent Heat Measurements of PR Data
The latent heat (LH) produced during the rainfall process accounts for three-fourths of all heat
energy for the
The latent heatatmosphere and has
(LH) produced a significant
during impact
the rainfall on water
process cycles for
accounts of the Earth. Studies
three-fourths on heat
of all
structures of the LH could provide references for the diabatic control and the feedback
energy for the atmosphere and has a significant impact on water cycles of the Earth. Studies on of rainfall,
the large
structures scaleLH
of the circulation and its forecasting,
could provide references and cloud
for the parameterization
diabatic control andschemes. It is meaningful
the feedback to the
of rainfall,
analyze the features of the LH measured by PR for a long time period and from a global view. Previous
large scale circulation and its forecasting, and cloud parameterization schemes. It is meaningful to
representative studies are listed in Table 7.
analyze the features of the LH measured by PR for a long time period and from a global view.
Previous representative
4.1. Retrieval studies
Algorithms are listed in Table 7.
of the LH
Before the LH analysis was contemplated, algorithms needed to retrieve the LH from PR data.
Commonly used retrieval algorithms included convective and stratiform heating (CSH) [86,87], spectral
latent heating (SLH) [88,89], trained radiometer algorithm (TRN) [90,91], and precipitation radar
heating (PRH) [92]. It was noted that some parameters played crucial roles in the algorithms like the
surface rainfall rate and the proportion of stratiform rainfall, as well as the height of the echo top and
the rainfall rate at the melting level.Remote Sens. 2019, 11, 80 15 of 34
Table 7. Key information of the studies on LH (latent heat) from PR data.
Reference Period Location Products (Version) of PR Retrieval Algorithms of LH
central Indian and
Barnes et al. [104] Feb. 1998 to 2012 2A25 and 2H25 (version5) SLH
West Pacific Oceans
Hagos et al. [93] 1998–2007 tropics CSH etc CSH
Li et al. [98] 1998–2005 South China Sea CSH CSH
Liu et al. [94] 1998–2012 tropics 2H25 (version7) SLH
a cloud physics
parameterization and the
thermodynamic equilibrium
Indian subcontinent
Magagi and Barros [96] Jun. of 1999–2001 2A25 (version 5) equation, a combination of
and Tibetan plateau
radiosonde and the radar
reflectivity and the rain-rate
estimates.
Jan. 1998 to 0–240◦ E and
Morita et al. [101] 2A25 (version5) SLH
Jul. 2001 20◦ N–20◦ S
Similar to CSH but used rain
Schumacher et al. [97] 1998–2000 tropics 2A23 and 2A25 (version5)
types in 2A23
Tao et al. [95] Feb. 1998 tropics 2A25 CSH
Wang and Huang [99] 1998–2010 South China Sea CSH (version6) CSH
Zhang, C. et al. [102];
1998–2007 15◦ N–15◦ S. 2A25 and 3G68 CSH, SLH, PRH and TRN
Ling and Zhang [103]
South Asia monsoon
Zuluaga et al. [100] 1998–2006 CSH CSH
region
4.2. Vertical Profiles of the LH over Land and Oceans
Because of the well-known land-sea difference, some systematic differences were revealed for
vertical profiles and the diurnal variations of the LH over land and over oceans. Two peaks were
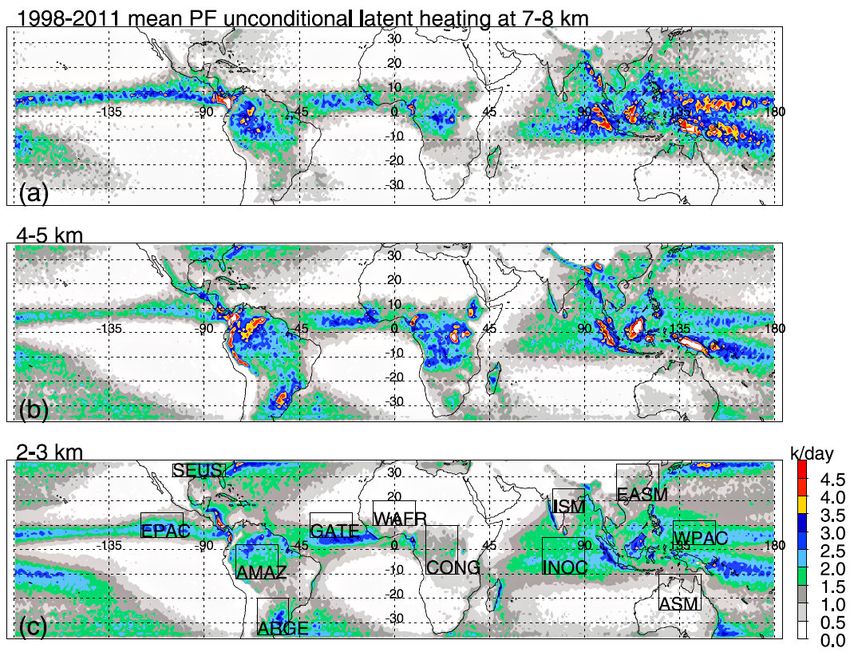
found at about 3 km and 7 km in LH profiles over oceans [93,94], while only one peak at about
7 km over land [94–96]. Hagos et al. [93] discovered that the upper peak was associated with a high
precipitation rate and the lower peak was associated with a low precipitation rate. Liu et al. [94]
noticed that the upper peak was associated with mesoscale convective systems (MCS) while the lower
peak was associated with small shallow precipitation. Tao et al. [95] and Liu et al. [94] measured the
difference in the fractional contribution of the LH at an altitude over different land areas including
central Africa, South America and United States, and the difference might be attributed to differences
in convection intensity and in the size of the MCSs (Figure 5). Regarding the diurnal cycles, the LH
was much stronger in the later afternoon over land and was a little stronger in the early morning over
oceans [94]. However, it was found that the LH showed higher values along the southern slopes of
the Himalayas during the night and early morning than during the afternoon [96] and this exception
might be attributable to the impact of the Himalayas on the latitudinal distribution of the LH.Remote Sens. 2019, 11, 80 16 of 34
Remote Sens. 2018, 10, x FOR PEER REVIEW 16 of 33
5. Retrieved
Figure 5. Retrieveddistribution
distributionofofthe
themean
meanunconditional
unconditional LH
LH at at
(a)(a)
7–87–8
km;km;
(b)(b)
4–54–5
km;km;
andand (c) 2–3
(c) 2–3 km
km levels
levels during
during 1998–2011.
1998–2011. ([94]([94] © American
© American Meteorological
Meteorological Society.
Society. UsedUsed
withwith permission.)
permission.)
4.3. The LH Observation
5. Rainfall and the Climate
ofResponse
PR Data
In the long run,
Compared withthe distribution observations,
conventional of LH accompanying the rainfall modulated
GR observations, and passive the microwave
large scale
circulations
observations, andPRthus had provide
could an interaction with climate
high-resolution 3Dresponse such as
data above thethe El Nino–Southern
entire tropical region Oscillation
without
(ENSO). The LH released during precipitation processes would change the heat budget
occlusion. It was very beneficial to the studies on precipitation features including vertical structure, and balance
of the atmosphere, and the consequently adjusted atmosphere
diurnal variation, and climate characteristics with the accumulated PR data. motions would in turn impact the
water vapor evaporation and transportation and thus the precipitation distribution. This was a
complex feedback
5.1. Vertical effect
Structure and some studies made pioneering works and preliminary analysis by PR
of Rainfall
data. Schumacher et al. [97] calculated the four-dimensional distribution of the LH and modeled the
PR detection could penetrate the precipitation from top to bottom and had a high vertical
response of the atmosphere by an idealized model with derived LH as initial values. Results showed
resolution of 250 m. Therefore, it was very suitable to investigate the vertical structure of rainfall
that during El Nino years, the gradient in stratiform precipitation across the Pacific became more
with PR data. The maximum height to which the rainfall develops (hereinafter referred to as
pronounced. This led to major changes in the LH field and the circulation response to the LH was
precipitation height or rainfall height) as well as the correspondence to the rainfall rate could be
stronger than the other years. Li et al. [98] and Wang and Huang [99] investigated the variation of the
analyzed (Table 8).
LH associated with the summer and the winter monsoon over the South China Sea (SCS). They found
that
5.1.1.the interannualHeight
Precipitation variation of the LH
of Rainfall over the SCS depended on El Nino or La Nina conditions,
Systems
and the LH over the SCS was much smaller during El Nino years than during La Nina years. By
Studies
contrast, foundetthat
Zuluaga thereindicated
al. [100] was a difference of rainfall height
that the monsoonal between
interannual convective
variation of theandLH stratiform
could not
be explained by the ENSO when they examined the four-dimensional LH structure over thethat
precipitation and between precipitation over land and over oceans. Most of them concluded the
South
height of convective
Asian monsoon region. precipitation was higher than stratiform precipitation [105-107], and the
precipitation height was higher over land than over oceans [105,107-111]. These conclusions
The Madden–Julian oscillation (MJO) is a quasi-periodic variability in tropical atmosphere. It turns implied
thattostratiform
out andintra-annual
be the main warm rain were more that
fluctuation common overweather
explains oceans variations
than over in land,
the while
tropicsice-based
and has
microphysics was more apparent over land than over oceans, especially
significant impacts on the global climate including ENSO events. Some studies analyzed for continental convection
the MJO
(Figurefrom
signal 6) the
[110,112]. A few
perspective studies
of LH, noticed
and they foundno asignificant
double peakheight difference
structure between
of LH profiles stratiform
with peaks at
precipitation over land and over oceans [106,108], and even that the height of stratiform
precipitation over oceans was higher than that over land [113]. There was also precipitation height
difference over different oceans or different land [114,115].Remote Sens. 2019, 11, 80 17 of 34
about 3 km and 7 km and the largest amplitudes appeared over the Indian Ocean and over the western
Pacific Ocean during MJO stages [101–104].
4.4. Remarks on Studies of Latent Heat with Rainfall
Important characteristics of LH vertical profiles and the diurnal variations were yielded under
a wide range of studies. By comparison, the long-term climate effects of the LH are not understood
enough and more studies are needed in the future, in which atmosphere circulation theories and
models would be inevitably participated. On the other hand, conclusions on climate effects of the
LH should be carefully examined and need to be verified because complex climate dynamics were
involved and there might be uncertainty in models and computations.
5. Rainfall Observation of PR Data
Compared with conventional observations, GR observations, and passive microwave observations,
PR could provide high-resolution 3D data above the entire tropical region without occlusion. It was
very beneficial to the studies on precipitation features including vertical structure, diurnal variation,
and climate characteristics with the accumulated PR data.
5.1. Vertical Structure of Rainfall
PR detection could penetrate the precipitation from top to bottom and had a high vertical
resolution of 250 m. Therefore, it was very suitable to investigate the vertical structure of rainfall with
PR data. The maximum height to which the rainfall develops (hereinafter referred to as precipitation
height or rainfall height) as well as the correspondence to the rainfall rate could be analyzed (Table 8).
5.1.1. Precipitation Height of Rainfall Systems
Studies found that there was a difference of rainfall height between convective and stratiform
precipitation and between precipitation over land and over oceans. Most of them concluded that
the height of convective precipitation was higher than stratiform precipitation [105–107], and the
precipitation height was higher over land than over oceans [105,107–111]. These conclusions implied
that stratiform and warm rain were more common over oceans than over land, while ice-based
microphysics was more apparent over land than over oceans, especially for continental convection
(Figure 6) [110,112]. A few studies noticed no significant height difference between stratiform
precipitation over land and over oceans [106,108], and even that the height of stratiform precipitation
over oceans was higher than that over land [113]. There was also precipitation height difference over
different oceans or different land [114,115].
5.1.2. Precipitation Height and the Rainfall Rate
Most studies yielded that there was a high positive correlation between the precipitation height
and the rainfall rate [106,116,117], but this might not demonstrate the necessary and sufficient condition
for each other. Hamada et al. [118] found that an extreme amount of rainfall was characterized by
less intense convection with strong radar echoes not extending to very high altitudes (around 8–9 km)
compared with extreme convective cases with altitudes more than 10 km even 16–17 km. They indicated
the importance of warm rain processes in producing high rainfall rates. Hu et al. [113] found that
a high rainfall rate was associated with a deep rain system but a deep rain system was not always
associated with a high rainfall rate. These results imply that the rainfall rate may not be simply related
to the vertical extent of precipitation. Specific conditions of dynamic, thermodynamic and water vapor
need to be taken into detailed consideration. For example, the rainfall of large vertical extention might
need moderate water vapor because abundant water vapor would be condensed easily in low altitudes.Remote Sens. 2019, 11, 80 18 of 34
5.1.3. Vertical Profiles of Radar Reflectivity
Studies analyzed patterns of the vertical profile of reflectivity (VPR) and the influencing factors.
On the whole, they revealed that, at low altitudes, VPR had a larger negative slope for convective
precipitation over land than stratiform precipitation over oceans, while, at high altitudes, the decrease
of reflectivity with the height was more slowly for convective precipitation over land than stratiform
precipitation over oceans [109,119]. It was also noticed that the underlying surface and the terrain in
different regions had significant impact on the VPR [105,107,119].
Table 8. Key information of the studies on vertical structure of rainfall from PR data.
Reference Period Location Products (Version) of PR
Berg et al. [114] Dec. 1999 to Feb. 2000 East and west Pacific 2A25 (version5)
southern California, Arizona, and
Cao et al. [119] Jan. 2000 to Oct. 2011 2A23 and 2A25 (version7)
western New Mexico
Cao and Qi [117] Dec. 1997 to Aug. 2012 Huaihe River Basin (HRB) of China 2A23 and 2A25 (version7)
Fu et al. [105] 1998–2007 Asia 2A25
Fu et al. [106] 1998–2007 Asia 2A25
Fuentes et al. [108] Jun. to Sep. of 1998–2004 West Africa 2A25 (version6)
Geerts and Dejene [115] 1998–2002 Africa and Amazon 2A25
Guy and Rutledge [110] 1998–2010 West Africa 2A25
Hamada et al. [118] Sep. 2001 to Aug. 2012 tropics 2A25 (version7)
Hu et al. [113] 1998–2007 Southeast Asia 2A25 (version6)
the University of Utah
Liu et al. [109] 1998–2006 tropics
precipitation feature database
Saikranthi et al. [107] 1998–2012 India and adjoining oceans 2A23 and 2A25 (version7)
Jun. to Aug. 1998;
Short and Nakamura [116] tropics 3A25 (version4)
Dec. 1997 to Feb. 1998
Xu and Zipser [112] 1998–2010 tropics 2A25 (version6)
5.1.4. Remarks on the Vertical Structure of Rainfall
Differences in the vertical structure of precipitation and its variation lay in rainfall types, sea–land
difference and regional differences, and had a correlation with the surface rain rate. These differences
can be understood by different thermodynamical conditions between sea and land, between stratiform
rainfall and convective rainfall, and between different regions. The convective rainfall had prominent
instability conditions and thus it could ascend to higher altitudes than the stratiform rainfall. There
was more moisture over oceans than over land and thus the moist air would be condensed more easily
at lower altitudes over oceans than over land.You can also read


