THE EUROBITUME LIFE-CYCLE INVENTORY FOR BITUMEN - VERSION 3.1 Oil extraction Transport
←
→
Page content transcription
If your browser does not render page correctly, please read the page content below
THE EUROBITUME
                 LIFE-CYCLE INVENTORY FOR BITUMEN
                                          VERSION 3.1

Oil extraction

 Transport

  Refining

   Storage
D/2020/7512/31 © Eurobitume 2020 3rd edition April 2020 Published by the European Bitumen Association Boulevard du Souverain 165 B - 1160 Brussels, Belgium T: +32 2 566 91 40 info@eurobitume.eu www.eurobitume.eu 2
INDEX
1. Acknowledgements.........................................................................................4
2 Executive summary.......................................................................................... 5
3 Introduction.....................................................................................................6
4 Goal & scope of the study................................................................................ 7
4.1 Intended application and intended audience.......................................... 7
4.2 Product description.................................................................................. 7
4.3 Declared unit............................................................................................ 7
4.4 System boundaries................................................................................... 7
4.5 Allocation procedures..............................................................................8
4.5.1 Crude oil extraction step...............................................................8
4.5.2 Refinery step.................................................................................8
4.5.3 Storage of bitumen........................................................................8
4.6 Data sources............................................................................................8
4.7 Data quality..............................................................................................9
4.7.1 Temporal, geographical & technological representativeness........9
4.7.2 Precision & accuracy......................................................................9
5. Inventory analysis.......................................................................................... 10
5.1 Crude oil basket..................................................................................... 10
5.2 Crude oil extraction................................................................................ 10
5.2.1 Raw material................................................................................ 11
5.2.2 Consumption of energy resources................................................ 11
5.2.3 Greenhouse gas emissions...........................................................12
5.2.4 Non-Methane Volatile Organic Compounds (NMVOCs)...............12
5.2.5 Sulphur dioxide (SO2)...................................................................12
5.2.6 Nitrogen oxides (NOx)..................................................................12
5.2.7 Halon emissions...........................................................................12
5.2.8 Losses...........................................................................................12
5.2.9 Emissions to water .......................................................................12
5.2.10 Emissions to soil (Oil spills)..........................................................13
5.2.11 Fresh water drawn from the environment....................................13
5.2.12 Crude oil extraction data..............................................................14
5.3 Transport of crude oil to Europe..............................................................14
5.3.1 Transport by pipeline...................................................................14
5.3.2 Transport by ship..........................................................................15
5.4 Bitumen production................................................................................16
5.4.1 Consumption of energy resources................................................17
5.4.2 Water consumption......................................................................18
5.4.3 Refinery infrastructure..................................................................18
5.5 Bitumen storage......................................................................................18
5.5.1 Consumption of energy resources................................................18
6. Summary data (cumulative LCI results)..........................................................19
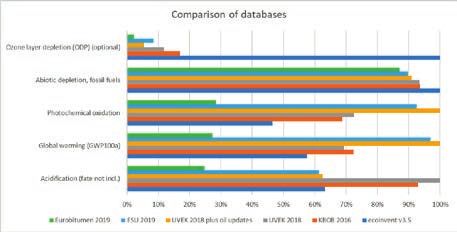
7. Life cycle impact assessment........................................................................20
8. Uncertainties................................................................................................. 22
9. Use of the Life-Cycle Inventory data.............................................................. 23
9.1 Additional processing of bitumen.......................................................... 23
9.2 Example of calculation........................................................................... 23
9.3 Reliability of data.................................................................................... 23
9.4 Feedstock energy................................................................................... 23
10. Summary remarks.................................................................................. 24
Appendices
Appendix 1 – Infrastructure data.................................................................... 26
Appendix 2 – Comparison for ship transportation with ecoinvent data......... 27
Appendix 3 – Uncertainty assessment of foreground data............................ 28
Appendix 4 – Report of the Independent Review..........................................30
References..........................................................................................................44
31. ACKNOWLEDGEMENTS Veronique Ducreux – ExxonMobil Luis Gamez Lopez – Cepsa Fabio Menten – Deloitte Laurent Porot – Kraton Mike Southern – Eurobitume Richard Taylor – Shell Wim Teugels – Nynas (chair) Clara Tromson - Deloitte Damien Valdenaire – Concawe Benoit Vandermeeren - ATPC Celine Verrat – Total Independent review conducted by Niels Jungbluth – ESU Services 4
2. EXECUTIVE SUMMARY
Following the previous Life-Cycle Inventory published in 2012, Eurobitume
has now updated the data and methodology used for this cradle-to-gate
study. The LCI covers four of the life-cycle stages;
     • Crude oil extraction
     • Transportation
     • Refining
     • Storage within the refinery.
The study covers the production of 1 tonne of straight–run bitumen
manufactured by atmospheric and vacuum distillation.

The report is based upon the most recent and representative data available
from the crude oil production and refining industry. Principal differences
from the previous LCI are;
     • The basket of crudes has been revised based on recent
       European use.
     • Crude oil extraction data are now based on a 5-year average, rather
       than using crude oil data from a single year.
     • A consequence of the change to the crude basket is that the
       transportation distances are revised, with an impact on the overall
       transportation section of the life-cycle.
     • Shipping data have been updated to include the latest generation of
       Aframax crude carrier and current emission requirements
     • Allocation methodology within the refining process has been
       updated to use a thermodynamic approach.
     • An attempt has been made to provide water consumption data,
       although there is limited certainty about the data.
     • A Life-Cycle Impact Assessment has been carried out for the four
       stages considered in this report.
The primary data sources were chosen on the basis that they were the most
robust data available. However, the foreground data were supplemented
by background data from EcoInvent (version 3.5) where complete datasets
were not available.

A full Inventory is available in an Excel format for use in LCI software. This
report provides summary data for the four life-cycle stages with and
without infrastructure contributions.

The LCI has been conducted in accordance with ISO 14040 and ISO 14044.
As part of the requirements within these standards the report has been
reviewed by an Independent LCI expert.
By consulting and/or using this publication, the user acknowledges and
agrees to be bound by the following stipulations. Eurobitume has made
considerable efforts to compile this publication on the basis of reliable
sources. However, Eurobitume cannot and does not guarantee the
completeness, accuracy, reliability and effectiveness of the information
contained in this publication for whatever purpose. Furthermore, the
content of this publication may be changed, suspended, revised and/or
removed by Eurobitume, at its sole discretion, at any time for whatever
reason and without notice. Finally, except for cases of fraud, neither
Eurobitume nor its members are liable for any loss, damages or injury
whatsoever relating to the consultation or use of this publication, or the
inability to do so.

                                                                                 5
3. INTRODUCTION
The importance of quantifying the impact of products and services on the
environment continues to grow. Consumers and procurement agencies
are increasingly demanding information about the environmental impacts
of products and interest in comparing potential solutions based upon
scientific data is necessary in order to do this.
The bitumen industry recognised the need for such information nearly
20 years ago and produced the first eco-profile, or partial life cycle
inventory analysis (LCI). During 2009, it was decided to update the 1999
eco-profile, because more data had become available and LCI methodology
had been developed further1.
Eurobitume has conducted a review of the previous LCI as the document
has been published for 6 years. In comparison to the previous version, the
main differences of this LCI are described below:
• The basket of crudes has been revised based upon recent
European use.
• The data concerning consumption and emissions for crude oil
extraction has been updated based on the most recent information.
• A consequence of the change to the crude basket is that the
transportation distances are revised, with an impact on the overall
transportation section of the life-cycle.
• The allocation methodology for the refining process has been
reviewed and an alternative allocation methodology is considered.
This study follows the standards and guidelines ISO 14040 and ISO 14044
and has been peer reviewed.
64. GOAL & SCOPE OF THE STUDY • This LCI does not take into account other refinery processes, such as
thermal cracking (visbreaking) or deasphalting. The visbreaking and
4.1 Intended application and intended audience vacuum flashing processes are primarily used to produce vacuum
The aim of this study is to provide inventory data on the production of flashed distillates for use as fuels. The feedstock for the visbreaking
a straight-run paving grade bitumen produced according to EN 12591 in unit is vacuum residue. The energy consumption and emissions from
Europe. the visbreaking and vacuum flashing processes are fully allocated to
the vacuum flashed distillate fraction. The vacuum flashed visbroken
The intended application can be seen as a building block in the calculations residue fraction, a by-product from the processes, may be used
of the further life cycle inventory studies where paving grade bitumen in bitumen production and is deemed to have the same energy
is used. At the time of the study, no specific Product Category Rules consumption and emissions as the feedstock, i.e. vacuum residue
(PCR) from bitumen were recognised. Only a draft PCR (#335) was under • The de-asphalting process is used to produce deasphalted oil for the
preparation for some petroleum products, and Eurobitume was in dialogue manufacture of lubricating oils. The feedstock for the deasphalting
with the authors. Hence, this study does not follow a specific PCR for unit is vacuum residue (or bitumen). The energy consumption and
bitumen products. emissions from the deasphalting process are fully allocated to the
deasphalted oil fraction. The precipitated asphaltene fraction, a by-
The Eurobitume LCI is a cradle-to-gate study for the manufacture of product from the process, may be used in bitumen production and is
bitumen and can be considered to be representative for any European deemed to have the same energy consumption and emissions as the
refinery within the European Union, independent of geographical location feedstock, i.e. vacuum residue.
and/or crude processed in the refinery.
4.3 Declared unit
Secondary transportation from the specific refinery gate to the asphalt The declared unit of this LCI is 1 tonne (1 000 kg) of paving grade bitumen.
plant or other processing factory, directly or via intermediate storage at Refined bitumen is not used on its own and is always blended with other
bitumen depots, is not included and must be added. materials, therefore this LCI refers to a quantity of a construction product
for use as a reference unit in an Environmental Product Declaration (EPD),
The target audience consists of customers of bitumen producers and Section A1 of EN 158043 for asphalt mixtures and other construction
organisations studying environmental issues, such as the European products.
Commission, national official bodies, consultants, universities, asphalt
producers, industries, etc. 4.4 System boundaries
The system boundaries are unchanged in this study compared with the
4.2 Product description previous LCI from Eurobitume, published in 20121. The LCI covers four stages
The general assumptions concerning the bitumen studied in this LCI are as of the product life-cycle and is a ‘cradle to refinery gate’ study, covering the
follows: product stage of the life cycle (stages A1, A2 and A3 of EN 15804) as follows;
• The bitumen is paving grade bitumen according to EN 125912. This is • A1; extraction of crude oil,
the most widely used paving grade bitumen in Europe. • A2; transportation of the crude oil from the country, or region of
• The bitumen is made in a hypothetical modern, complex, heat- extraction,
integrated refinery, located in EU. The refinery is considered to be • A3; refining of bitumen from crude oil
a complex refinery manufacturing a broad variety of petroleum • A3; Storage of the refined bitumen within the refinery
products, including bitumen.
• The bitumen is manufactured by straight-run distillation of crude A schematic description of the system boundary is provided in Figure 1.
oil, which is the most common production route for paving grade A more detailed view of the refinery processes and co-products is shown
bitumen manufactured in Europe. During this process the residue in Figure 6.
from the atmospheric distillation of crude oil is further distilled in a
vacuum tower to produce paving grade bitumen. The Figure 6 shows
a schematic view of the refinery processes and products.
System Boundary
Complex refinery
Transport to
Europe
Paving grade
bitumen
Crude oil Pipeline Refining Storage
extraction Sea transport
Figure 1. System boundaries for the bitumen LCI (cradle-to-refinery gate approach)
74.5 Allocation procedures of ancillary processes is a small fraction, around 3%, of the total energy
Allocation is the process by which partitioning of the input or output flows use within a refinery. This value is based on expert opinion. Overall energy
of a process or a product system is conducted between the product under consumption is taken from confidential data from Solomon reports6 and
study and one or more other products. this percentage is allocated to the ancillary processes, because bitumen
production represents typically around 3% of the value of total production
Bitumen is a co-product of the crude oil refining process. In order to assess of a complex refinery (economic allocation), based on expert opinion.
the environmental impact of bitumen, a method must be determined to
allocate the impacts of the production chain between bitumen and the 4.5.3 Storage of bitumen
other co-products: liquefied petroleum gas, gasoline, kerosene, gas-oil, Allocation for the storage stage of the life-cycle was based upon a mass
heavy fuel oil, etc. balance and is unchanged from the previous LCI (2012).
The aim of the allocation procedure is to find a suitable parameter so that 4.6 Data sources
the inputs and the outputs of the system studied can be assigned to the For the main processes (crude oil extraction, straight-run distillation and
product under consideration. storage), this LCI is based upon:
The most recent reports of the crude oil and refining industry
According to ISO 140404 & ISO 140445, there are different ways to address • Crude oil extraction data is based on the data from the International
allocation issues: the preference is physical allocation (based on mass, Association of Oil and Gas Producers (IOGP), completed with
calorific value, etc.) or when this is not possible, economic allocation Ecoinvent 3.5 for background processes. Data for crude oil extraction
(based on relative values). are averaged over the years 2013 – 2017 using data derived from the
International Oil & Gas Producers’ Association (IOGP) Environmental
In this LCI, the allocation of the inputs and outputs at the different stages of Performance Indicators reports, the most recent being 20177 and
the production chain are made as follows: previous volumes of the same report.
• Refinery fuel and energy consumption are taken from CONCAWE.
4.5.1 Crude oil extraction step Data for emissions and fuel consumption represent 63 refineries
At crude oil extraction step, the IOGP reports data for “hydrocarbons unit”. and 68% of European refinery throughput so it was considered that
Burdens at crude oil extraction step are allocated by oil-equivalents (energy this data from CONCAWE was the most source representative of a
allocation). modern European refinery producing bitumen.
European collated submissions and data collected by industry*
4.5.2 Refinery step • The average supply distribution of the crudes used specifically
The allocation at the refinery is changed from the previous LCI and avoided for bitumen manufacture is based on internal information from
by using an approach following up energy flows within the distillation Eurobitume members. The crude oil diet defined in this LCI is
column, using physical relationships, as proposed in ISO 14040 and ISO representative of the average European supply used for bitumen
14044. No allocation is made at this stage but the energy uses are modelled production.
bottom-up. The following issues have been taken into account for this • For transport by pipeline and ships, actual data from pipeline
decision: companies and a ship owner (Wartsila) was used. These data
• In a modern, heat-integrated, oil refinery the crude oil is pre-heated have been completed with further data from the International
using heat recovered from the distillation products before entering Maritime Organisation (IMO) concerning emissions to air. It was
a furnace, where it is further heated to the temperature necessary judged that data from IMO and ship owner was more relevant than
to produce the distillate materials required. The majority of the ecoinvent. The change in the crude basket has led to changes in the
heat input from the furnace is used to provide the energy required transportation calculations due to the differences in percentage of
to change the distillate fractions from liquid to vapour phase crude oil from the respective origins and the consequent differences
(the enthalpy of vaporisation). This energy is recovered in heat in transportation distance. Further details on the assumptions used
exchangers from the distillate products as they condense (enthalpy are found in section 5.3.2.
of condensation) and the recovered energy is used to pre-heat the Thermodynamic calculation and model
crude oil feed to the main furnace. • For energy consumption of refining, the amount of energy was
• Bitumen does not change state in either the atmospheric or the calculated, based on the heat required to raise the temperature of
vacuum distillation column, remaining in the liquid phase throughout bitumen fraction within the crude oil to 175 °C.
the distillation process, therefore the enthalpies of vaporisation and For other processes (electricity production) and infrastructure (oil wells
condensation can be disregarded. and platforms, ships, pipelines, oil refinery), information from the ecoinvent
• Because bitumen does not change state during the refining 3.5 cut-off database has been used. For infrastructure, a review of the data
process a simplified approach could be adopted. The amount sources used within the ecoinvent 3.5 database8 concluded that confidence
of energy required to change the temperature of the bitumen is in both the calculations used previously and the source data within
calculated from the specific heat capacity of bitumen and the overall ecoinvent was low. This data was corrected, applying the values given in the
temperature change from the crude oil to the run-down temperature ESU-services study on life cycle inventories of crude oil extraction9. The LCI
of the crude oil. Further detail is provided in section 5.4. of bitumen is provided with and without infrastructure.
In this study energy consumption data are not provided for ancillary
processes in the refinery, such as desalting and dewatering of the crude
oil as reliable data are not available separately. The energy consumption * Confidential internal data provided by Eurobitume member companies
84.7 Data quality
4.7.1 Temporal, geographical & technological
representativeness
The selection of data sources was conducted on the basis of identification
of the most appropriate source of data for current production of bitumen in
Europe in 2017. The Task Force conducted literature surveys to identify the
most recent and relevant reports from which the data were available.
• The data for the principal processes is representative of the
European context. The crude oil basket, whilst not necessarily
applicable for any individual refinery, is believed to be representative
of the average European supply for bitumen manufacture and has
been reviewed by Concawe, the European oil refining association.
Transportation is representative of the principal routes to Europe
from the regions of crude oil extraction.
• Data for crude oil extraction represent 44 of IOGP’s 56 members
operating companies covering operations in 80 countries worldwide
and ~30% of global production sales. In this report data are
provided as an average of 5 years (2013 – 2017), the previous LCI
report used data from a single year. A review of extraction data over
several years indicated that energy consumption and emissions can
change significantly from one year to the next, due to differences
in reporting and/or due to actual changes in energy/emissions,
therefore an average value over 5 years was considered to be the
most representative approach.
• Shipping data are taken from technical data sheets of a major ship
constructor10 and transportation distances are derived from a
publicly available shipping rate calculator11.
• Refinery fuel consumption and emissions data are taken from
Concawe12, whose members include 41 companies that operate
petroleum refineries in the European Economic Area. Data for
emissions and fuel consumption represent 63 refineries and 68% of
European refinery throughput.
Other process data from the ecoinvent 3.5 database are representative of
the current average technology in Europe.
4.7.2 Precision & accuracy
The LCI is provided in an aggregated format. Since the format of the LCI
does not allow to show the standard deviation of each input, a quantitative
uncertainty assessment for each flow cannot be provided in a .csv format.
However, the Pedigree matrix was assessed for each foreground data.
The results are presented in appendix 3. The uncertainty range is also
displayed, via a Monte Carlo assessment, on the LCIA results are displayed
in Appendix 3.
In addition to using a statistical approach for uncertainty assessment, data
quality has been considered. An overall qualitative assessment of accuracy
can be given by taking into account the reliability and the completeness
of data used (data from literature, measured data or estimated data). This
assessment can be given as follows:
• There is reliable accuracy for the most relevant flows in the
bitumen production chain: crude oil consumption, natural gas
consumption, emission to air of carbon dioxide (CO2), sulphur
dioxide (SO2), nitrogen oxides (NOx), methane (CH4) and non-
methane volatile organic compounds (NMVOC). Data from IOGP
for the main flows are representative of 84 – 100% of participating
company production and are therefore considered to be reliable and
representative on a regional basis. Further explanation is provided in
section 5 of this report.
• There is good, or satisfactory accuracy for the other flows.
95. INVENTORY ANALYSIS at similar levels in previous years to 2010. Regional coverage is uneven,
ranging from 82% of known production in Europe to 10% in the Former
In several of the data tables the total values may show small inconsistencies Soviet Union (FSU). The data are considered to be representative of IOGP
due to rounding of values. membership production. In discussion with IOGP, the data for Russian
Federation are the less robust data. This is due to a lack of reporting from
5.1 Crude oil basket Russian oil and gas producers. However, despite this, data are provided
The first stage of the LCI review was to evaluate the average crude diet used by IOGP member companies that have Joint Venture relationships in the
for the manufacture of bitumen in EU28. A review of the data for typical Russian Federation. Much of the IOGP data are independently verified so
bitumen crude volumes imported to Europe suggested the changes shown confidence in the data is considered to be adequate for the aggregated
in Table 1 to the crude slate to be used for the LCI. data used in this study, but the uncertainties suggest that such data should
not be used for individual refineries, or specific crude oils.
Within a complex oil refinery numerous different crude oils may be
processed. The European Union collects information on all crude oil IOGP data include the following operations
consumption within the EU13, these data were reviewed, but were not • Drilling (exploration, appraisal and production drilling)
representative of the typical crude oils used for bitumen manufacture. • Oil and gas extraction and separation (primary production)
Certain crudes, generally lighter, low-sulphur crudes, are not used for • Primary oil processing (water separation, stabilisation)
bitumen production, for which specific, typically heavy, high-sulphur crude • Crude oil transportation by pipeline to storage facilities
oils are used. Refinery crude diets are kept strictly confidential within oil • Offshore crude oil ship loading from primary production
refineries, therefore an internal, Eurobitume member-company review was • Onshore crude oil storage connected by pipeline to primary
conducted in order to develop the revised diet, which does not reflect the production facilities
overall European crude oil consumption data. The crude oil barrel selected • Gas transportation to processing plant (offshore/onshore)
is representative of an average EU barrel for bitumen production and has • Primary gas processing (dehydration, liquids separation, sweetening,
been validated by Eurobitume member companies. The revised figures CO2 removal) performed with the intent of making the produced gas
were reviewed by Concawe and represent a contemporary typical crude meet sales specifications
diet for a complex refinery. To be noted that no fracking is included as these • Floating Storage Units (FSUs)
crude oils tend not to be used for bitumen production and no oil sands • Offshore support and standby vessels
crude oil is included since no North American crude oil is considered. • Exploration (including seismic) activities
• Activities related to geologic storage of CO2 from natural gas
The Inventory analysis uses weighted values for the LCI based upon the processing
relative percentages of crude oils below. • Mining activities related to the extraction of hydrocarbons
Table 1. Crude diet used for the LCI review in 2012 and 2018 review The following items are specifically excluded by IOGP
Average • Gas processing activities with the primary intent of producing gas
2018 LCI (%) –
Crude source
2012 LCI
used in this
European liquids for sale (unless data cannot be separated out);
(%)
study
crude oil
consumption • Secondary liquid separation (i.e. Natural Gas Liquids [NGL]
Former Soviet Union (FSU) 61 30 39
extraction using refrigeration processing)
Middle East 18 45 17 • Ethane, Propane, Butane, Condensate (EPBC) fractionation
South & Central America 11 15 4* • Liquefied Natural Gas (LNG) and Gas to Liquids (GTL) operations
Europe 10 10 20 (LNG data are being compiled separately from the E&P data using
Africa 0 0 20 this same process)
Total 100 100 100 • Transportation of personnel
• Transportation of oil and gas, after sales metering devices (LACT
5.2 Crude oil extraction units) or after ship loading at the primary production site
Crude oil extraction data is based on the IOGP data, completed with • Storage of refined products
Ecoinvent 3.5 datasets for background processes. Data for crude oil • Partners' operations
extraction are averaged over the years 2013 – 2017 using data derived from • Non-operated joint ventures, except when the operator is not an
the International Oil & Gas Producers’ Association (IOGP) Environmental IOGP member and the joint venture has agreed that one company
Performance Indicators reports, the most recent being 201714 and previous should take the lead on data reporting
volumes of the same report. These data represent oil and gas wellhead • Upgrading activities related to the extraction of hydrocarbons. All
production of 2,072 million tonnes (15,4 billion BOE**), about 27% of 2017 other non-E&P activities
global production sales15, with the absolute and relative production values
* Percentage of crude oil from south, central and north America
** Barrels of Oil Equivalent
105.2.1 Raw material
Raw material energy use and emission data were derived from the IOGP
environmental reports, providing data between 2003 and 2017. In the
previous LCI data from a single year, 2009, were used. However, it became
clear that differences in reporting meant that data from single years may
not provide a representative picture, therefore mean values of the reported
data for the years 2013 – 2017 were selected for this report. Figure 2
illustrates the variability in annual emission data for CO2e on a regional
basis.
Former Soviet Union Middle East South & Central America Europe
250 250 250 250
200 200 200 200
150 150 150 150
100 100 100 100
50 50 50 50
0 0 0 0
CO2e emissions (t/10^3t)) CO2e emissions (t/10^3t)) CO2e emissions (t/10^3t)) CO2e emissions (t/10^3t))
Figure 2. CO2e emissions for crude oil extraction, by region over time
The aggregated CO2e emission data for crude oil extraction compared to the The following definitions are used for the emissions and energy
data used in the previous report and for 2013 – 2017 are shown in Figure 3. consumption per unit of production:
Data available from IOGP are believed to be the most reliable source for 5.2.2 Consumption of energy resources
crude oil extraction. Therefore, the main flows provided by IOGP were For the oil extraction process, the energy consumption given in the IOGP
included into ecoinvent inventories. These flows were also completed by report ranges from 344 MJ/t to 1 432 MJ/t depending on the type of crude oil
considering indirect emissions, from energy and material purchase. To be and the location, most of the energy is locally produced (table 2). The split
noted that IOGP data are not available in commercial LCI databases, but between gas and crude oil depends on the crude oil type and is generally
were also considered in the study from Meili et al. on life cycle inventories of assumed to be natural gas. The split between onsite combustion and
crude oil extraction9. purchased energy is taken from the IOGP environmental report, purchased
energy is assumed to be electricity. In this report data are presented as %
CO2e emissions per tonne of crude oil onsite combustion, purchased energy and unspecified. For this report it was
FSU
considered that oil producers would know when energy was purchased,
therefore unspecified was considered to be onsite production.
Middle East
The reported energy is converted into masses using calorific values of
South & Central America
43 MJ/kg for crude oil and 49,4 MJ/kg for natural gas, the same values were
Europe
used for the previous Eurobitume LCI (2012).
0 50 100 150 200 250
Table 2. Resource consumption for energy consumed during crude
Value 2009 Average 2013 - 2017
oil extraction
Figure 3. Comparison of 2009 crude oil extraction data with values for Consumption of natural Former
Middle South
2013–2017 (source IOGP) resources used for energy Soviet Europe
East America
production Union
IOGP reports a range of environmental endpoints and for this study the
Energy consumption MJ/t 1226 344 1170 1432
following inputs and outputs were selected: Crude oil kg/t 0 0 13 0
• Total energy consumption per unit of production Natural gas kg/t 23,1 5,1 11,3 26
• Carbon dioxide (CO2) emissions Electricity kWh/t 19,2 21,4 12,1 33,4
• Methane (CH4) emissions
• Greenhouse Gas (GHG) emissions (CO2e) The purchased electricity was considered into the scope of this LCI, as it
• Non-Methane Volatile Organic Compound (NMVOC) emissions was not included into the OGP data.
• Sulphur dioxide (SO2) emissions
• Nitrogen oxide (NOx) emissions
• Emissions to water
• Emissions to soil
115.2.3 Greenhouse gas emissions 5.2.8 Losses
For crude oil extraction, Carbon Dioxide (CO2) and methane (CH4) are the Fugitive losses occur from venting and other uncontrolled releases.
principal contributors to greenhouse gas emissions, arsing mainly from Methane emissions arise mainly from the process and tank vents and
flaring and processing. When the source of emissions was specified, 68% of are recorded as ‘Natural gas - vented’ under the losses section. Direct
the reported carbon dioxide emissions are from energy use, 25% are from emissions from venting and fugitive losses are covered by the IOGP study.
flaring, 6% are from venting and 1% are from fugitive losses.
This amount of fugitive losses are in line with the report made by the Regarding the natural gas venting, the range of values for methane
ICCT (International Council on Clean Transportation) for the European emissions from vented natural gas found in the literature is very high, from
Commission16. The table 4.13 of this report shows that in some cases 3,11·10-4 Nm3 to 42,2 Nm3 per tonne of oil extracted9. In this study, the total
fugitive emissions may represent a higher percentage of oil production amount of methane emissions from venting represents 0,28 Nm3 per tonne
emissions, up to 19%, for example, for Duri in Indonesia, but in many cases of oil extracted*, which is much lower than the IEA value (14,2 Nm3/tonne
the fugitive emissions are less than 1% (for wells in the USA, Canada, Saudi OE) used in the ESU-services study9.
Arabia, Libya, Russia, UK and Norway). It should be highlighted, however,
that these are highly dependent on the well characteristics and a strong 5.2.9 Emissions to water
variability is observed even within a same country. 5.2.9.1 Water emissions
Produced water is the highest volume liquid discharge generated during
Differences between the values in Table 4 and the calculated values from the production of oil and gas. It consists of formation water (water present
the averaged CO2 and CH4 values are the result of rounding and averaging naturally in the oil reservoir), and/or floodwater (water previously injected
of reported values and year-to-year reporting differences. into the reservoir).
5.2.4 Non-Methane Volatile Organic Compounds After extraction, produced water is separated and treated (de-oiled) before
(NMVOCs) discharge to surface water (including seas, rivers, lakes, etc.) or to land
NMVOC emissions mainly occur from flaring, venting and fugitive releases (including to evaporation ponds). Produced water can also be injected
and, to a lesser extent, combustion equipment. either into the producing reservoir where it can enhance hydrocarbon
recovery or into another appropriate formation for disposal. The volume of
5.2.5 Sulphur dioxide (SO2) produced water typically increases as recovery of oil and gas from a field
Sulphur oxide emissions arise through oxidation during combustion of progresses, that is, as the field becomes ‘mature’.
sulphur naturally contained within flared gas (Hydrogen Sulphide (H2S)
content) and diesel (sulphur content). The figures provided are the sum The quality of produced water is most widely expressed in terms of its oil
of sulphur dioxide (SO2) and sulphur trioxide (SO3) expressed as SO2 content. There are a number of analytical methodologies in use around the
equivalent. world for measuring oil in water.
Where the source was specified, 51% of sulphur dioxide emissions reported
were from flaring, 48% were from energy use and 1% were from venting. In 2017, IOGP participating companies reported the oil content of 976
million tonnes of discharged produced water. Where the location was
5.2.6 Nitrogen oxides (NOx) specified, approximately 82% of water discharged was from offshore
Emissions of nitrogen oxides, (principally nitric oxide (NO) and nitrogen operations and 18% was from onshore operations.
dioxide (NO2) expressed as NOx), occur almost exclusively from the
combustion of natural gas or other fuels. These emissions are a function of Onshore, where disposal to surface is often constrained by regulatory
the combustion equipment, loading and technology. and environmental concerns, injection of produced water is the principal
Where the source was specified, 95% of nitrogen oxide emissions reported disposal route. In 2017, 86% of water produced from onshore assets was
were from energy use and 5% were from flaring. returned below ground in data sets where the volumes of re-injected water
were provided by reporting companies .
5.2.7 Halon emissions
The emissions of halon and firefighting equipment occurs for offshore 5.2.9.2 Oil spills to water
crude oil production in Europe. An amount of 0,7 mg halon/t crude oil Accidental oil spills due to accidents on offshore platforms have caused
extracted offshore was considered9, with 20% as Halon 1301 and 80% as large oil spills. Based on a literature review, Meili et al.9 defined that a ratio
Trifluoromethane. No halogenic emissions were considered for onshore of 36g crude oil spilled/tonne crude oil produced offshore is representative
operations. of the oil emissions to water occurring during accidental oil spills. This value
was applied in this study. Since only oil from Europe is extracted offshore
(10% of the crude oil basket), this study considers that 3,6 g/tonne of crude
oil is emitted into the water during the oil extraction stage.
* This estimation was made, considering the value of 0,34 kg/t OE of vented natural gas,
with 0,58 kg CH4/kg natural gas and a density of 0,71kg CH4/Nm3
125.2.10 Emissions to soil (Oil spills) 5.2.11 Fresh water drawn from the environment
Spills are an important environmental performance indicator for the oil The definition of fresh water varies in accordance with local statutes and
and gas industry since they can have a significant and visible impact on the regulations. Where it is not defined by local regulations, fresh water is
environment. defined for reporting purposes as non-brackish water and may include
drinking water, potable water, water used in agriculture, etc.
The environmental impact is highly dependent on the nature of the
release, where it occurred and how it was subsequently managed. Most oil Fresh water drawn from the environment
0.10
exploration and production companies have spill contingency plans and
0.09
measures in place to respond to and mitigate spills. 0.08
0.07
For the purpose of this report a spill is defined as any loss of containment 0.06
m3/t
from which the released material reaches the environment (i.e. is not 0.05
retained within secondary or other containment). The volume reported 0.04
represents the total volume that reached the environment, irrespective of 0.03
0.02
quantity of released material that may be recovered.
0.01
0.00
Spills may have a number of causes such as equipment failure (including
Former Soviet Union Middle East South & Central America Europe
corrosion), operating errors, and unlawful third-party damage such as
sabotage and theft.
Figure 4. Fresh water drawn from the environment (m3/t), by region
Fresh water withdrawn from the environment by source
100.0
90.0
80.0
70.0
60.0
50.0
%
40.0
30.0
20.0
10.0
0.0
Captured rainwater Groundwater Municipal water supplies
Other sources Surface water Treated municipal wastewater
Unspecified
Figure 5. Fresh water drawn from the environment, by source
In 2017 regional averages for quantity of fresh water withdrawn for the
purpose of use expressed per unit of production varied from 4,6 to 371,45
cubic litres per tonne of hydrocarbon production. Figures 4 and 5 show
fresh water consumption and source for crude oil production. The water
consumption was characterised by their water region in the final LCI, as
show in Figure 4, using the following flows:
Table 3. Water flow modelling for crude oil extraction
Region Elementary flow
Former
Water, unspecified natural origin, RU
Soviet Union
Middle East Water, unspecified natural origin, RME
South & Central
Water, unspecified natural origin, VE (used as a proxy)
America
Europe Water, unspecified natural origin, Europe without Switzerland
135.2.12 Crude oil extraction data
Table 4. Summary data for crude oil extraction
Former
Unit Middle East South America Europe Total
Soviet Union
Crude oil source % 30 45 15 10 100
Raw material
Crude oil kg/t 1 000 1 000 1 000 1 000 1 000
Fresh water L/t 92 4,9 59 34 42
Consumption of energy resources
Process
Crude oil - onsite combustion kg/t 0 0 13,0 0 1,9
Natural gas - onsite combustion kg/t 23 5,1 11 26 14
Purchased electricity kWh/t 19 21 12 33 21
Losses
Natural gas, flared kg/t 10 5,5 7,8 3,5 7,0
Natural gas, vented kg/t 0,48 0,10 0,70 0,48 0,34
Emissions to air
CO2 g/t 104 962 71 259 108 419 103 212 90 139
CO 1) g/t 14 11 8,7 11 12
SO2 g/t 267 633 144 79 395
NOx g/t 227 158 499 359 250
CH4 g/t 509 137 757 482 376
NMVOC g/t 160 310 755 264 327
Particulates 1) g/t 31 7,6 4,9 24 16
Emissions to water
Oil g/t 0,7 10 9,9 44,7 10,7
Emissions to soil
Oil spills g/t 4,8 12 6,4 6,1 8,4
1) From Ecoinvent v3.5 background data
5.3 Transport of crude oil to Europe It was assumed that electricity was produced by a diesel generator
The crude oils for European bitumen production are mainly transported to consuming around 0,1 litres of diesel per kWh, this value is a significant
the refinery by ship. The exception is Former Soviet Union crude oil, that change from the 2012 report. This is a conservative assumption, as it is
is partly transported by pipeline. In this study it is assumed that the FSU known that some of the power consumed is also produced by gas-driven
crude oil is transported from the Samara area to the Baltic Sea by the Baltic generators and some comes directly from the grid.
Pipeline System (BPS) and then, from the Baltic Sea to the Amsterdam-
Rotterdam-Antwerp (ARA) region by ship. The consumptions and emissions attributable to the diesel burned are
given in the life cycle inventory “Diesel, burned in diesel-electric generating
5.3.1 Transport by pipeline set {GLO}| market for | Cut-off, U” of the ecoinvent 3.5 database.
For transport by pipeline, data from pipeline companies was used. The The data concerning pipeline infrastructure are presented in Appendix 1.
energy requirement of the BPS was not available. As a consequence,
an estimate was calculated using data from another pipeline and a Table 5. Summary data for pipeline transport.
topographical analysis, as the main energy requirement depends on the Former
Middle South
topography and length of the route. The topography of various pipelines Unit Soviet
East America
Europe Total
was modelled17. Union
Crude oil source % 30 45 15 10 100
Distance km 1800
The SPSE pipeline between Lavera, France and Karlsruhe, Germany is
Energy MJ/t 129,6 0,0 0,0 0,0 38,9
regarded as having the closest topographic profile to the BPS. The same
Electricity kWh/t/100 km 2,0 0,6
amount of energy per tonne of crude oil and per 100 km needed by the kWh/t 36,0 0,0 0,0 0,0 10,8
SPSE was used to calculate the energy needed by the BPS.
See Table 5 for the summary information for transport by pipeline.
145.3.2 Transport by ship 5.2.3.3 Emissions to water
In the calculations, crude oil is transported to Europe in 106 000 Dead Emissions to water from shipping are assumed to be zero. The ship travels
Weight Tonne (DWT) Aframax* vessels. This is a typical vessel size for from the crude oil loading terminal full of crude oil and returns to the
Former Soviet Union and South America. For Middle East crude oil using loading terminal with ballast water. Ballast water is treated at the loading
the route via Suez, the size varies between 130 000 DWT and 250 000 terminal. The emissions of pollutants and chemicals substances from bilge
DWT, and for Europe the size is 70 000 DWT. The use of a 106 000 DWT water and tank washing are not covered in this study.
ship for all regions is considered to be a conservative compromise. Data are
summarised in Table 7. The inventory “Transport, freight, sea, transoceanic 5.2.3.3.1 Oil spills
tanker {GLO}| processing” from ecoinvent v3.5 was adapted with more up- Nowadays, the volume of oil spilt represents a very small fraction of the
to-date and specific data. volume that is transported in tankers. The total amount of oil spilt from
2000 to 2009 (19600 tonnes20) represents less than 0,001% of the total
5.3.2.1 Consumption of energy resources amount of crude oil transported between 2000 and 2009***. Based on this
Data for fuel consumption were taken from Wärtsilä Aframax data sheet10, value, it was considered that the spills from shipping represent 10 g crude
fuel consumption assumptions used are provided in Table 6. oil spilled/t crude oil transported.
Table 6. Ship fuel consumption data
Average Speed 13,5 knots (25 km/h)
Fuel consumption
Fully loaded 36 t/day
Ballasted 26 t/day
Loading** 2t (10 hours)
Discharging** 11,5t (12 hours)
Fuel consumption 9,87E-04 kg fuel/ t.km
The transportation distance is calculated with a port-to-port distance
calculation tool11. The duration of the voyage is calculated using an average
speed of 13,5 knots.
The fuel consumption is calculated with one way fully loaded and a return
trip ballasted and includes loading and discharging.
The consumptions and emissions due to the production of marine fuel are
given in the life cycle inventory “Heavy fuel oil {RER}| market group for |
Cut-off, U” of the Ecoinvent 3.5 database.
5.3.2.2 Emissions to air
Emission factors for ship fuel combustion were taken from the IMO GHG3
report18, using data for slow-speed diesel, 2-stroke diesel engines compliant
with IMO Tier II criteria. These data are considered to provide a conservative
estimate of emissions, as the ship for which the data are provided is fitted
with emission reduction technology, compliant with IMO Tier III criteria,
which would reduce SOx and NOx emissions. Compliance with Tier III would
reduce NOx emissions by a factor of approximately 4.
SO2 emissions are calculated on the basis of High Sulphur Fuel Oil being
used outside the Sulphur Oxide Emission Control (SECA) area and 0,1%
sulphur fuel oil within the SECA area. Data from Marintek19 reported that
there are no methane emissions from diesel engines running Medium or
Heavy Fuel Oil, therefore no methane emissions are attributed to shipping
fuel combustion.
The IMO has established a maximum sulphur content of 3,5% for fuel oil,
the typical highest value in use today is 2,7% sulphur, this figure has been
used for ship emissions outside any Emission Control Area (ECA). This value
will be reduced to 0,5% in 2020 and will have a concomitant impact on
emissions of sulphur oxides from that time. Within the Sulphur Emission
Control Area (SECA) of Europe the maximum content of sulphur in fuel oil
is 0,1%, this figure is used for shipping fuel combustion in SECA waters. A
comparison with ecoinvent dataset can be found in appendix 2.
* Average Freight Rate Assessment (AFRA) denomination for oil tankers *** Considering an amount of 15 414 millions tonnes of oil transported, based on unctad
** Data taken from MT Mastera data (https://unctad.org/en/PublicationsLibrary/rmt2018_en.pdf)
15Table 7. Ship transportation data
Former Soviet
Crude oil source Unit Middle East South America Europe Total
Union
% 30 45 15 10 100
Sea transport to ARA from St, Petersburg Ras Tanura Maracaibo Bergen
Russia 1) Saudi Arabia 2) Venezuela North Sea
Data on sea transport
Vessel DWT (t) 106 000 106 000 106 000 106 000 106 000
Distance km 2 332 12 040 8 253 1 007 7 456
Speed km/h 25 25 25 25
Duration h 93 482 330 40 298
Fuel consumption, total t/trip 253 1 252 862 117 780
- Fuel 2,7% S t/trip 1 164 781 641
- Fuel 1,0% S t/trip 59 5,9
- Fuel 0,1% S t/trip 253 88 81 59 133
Consumption of energy resources
Heavy fuel oil kg/t 2,39 11,81 8,13 1,10 7,36
1) Around Denmark, not via the Kiel Canal
2) Via Suez
The data for infrastructure is described in Appendix 1.
5.4 Bitumen production 5.4.1 Consumption of energy resources
The straight-run distillation process is shown in Figure 6. In this process, The allocation of energy and emissions at the refining level is complex
the residue from the atmospheric distillation of crude oil is further distilled due to the numerous coproducts produced during the distillation
in a vacuum tower to produce paving grade bitumen. In a complex refinery process. An economic allocation was used in the previous LCI, as this
a broad range of petroleum products is produced, bitumen being a minor is the method used within the refinery to determine a relative value for
product compared with other products. different oil products. However, the process of distillation is governed by
the thermodynamic principals governing change-of-state (from liquid to
The bitumen yield from the average European bitumen crude blend is vapour), therefore for this review the Task Force considered a different
28,5% by mass. approach should be used. In the previous LCI (2012) the relative value
The process unit emission values include a share of common resources of bitumen to crude oil was taken as 0,61. However, there is not a formal
such as crude oil handling, desalting, flaring, loading area, general heating relationship between hydrocarbon value used in the refinery and crude oil.
and lighting. No chemicals are added to paving grade bitumen or to the The 2012 value was derived using a ‘Complexity Weighted Tonne’ (CWT)
straight-run distillation process. approach developed by Solomon Associates21.
Gas, propane, butane
Other
Distillates products
to other
refinery units
Gasoline
Kerosene ºC m Hg Vacuum
m
10-1 370
gas oil
Gas oil
00
Crude oil Fuel oil Vacuum
Furnace Atmospheric
350ºC distillation distillation
Bitumen
Furnace Storage
Bitumen
Storage
Figure 6. Schematic diagram of the refinery process
16As mentioned in section 4.5 of the report, physical allocation is preferred in Table 8. Bitumen manufacture calculations
the ISO standards. Unit Value ΔT
Crude oil temperature °C 40
The majority of the energy that is input to the distillation process is used to Atmospheric distillation
provide the enthalpy of vaporisation, to change the distillate fractions from Furnace inlet temperature °C 260 220
liquid to vapour phase (enthalpy of vaporisation). This energy is recovered Furnace outlet temperature °C 350 90
as the enthalpy of condensation when the distillates condense further up Atmospheric column outlet temperature °C 350
the distillation column and is collected through heat exchangers and, in a Vacuum distillation
heat-integrated refinery, used to pre-heat the crude oil prior to the furnace. Furnace inlet temperature °C 350 0
Furnace outlet temperature °C 370 20
Vacuum residue temperature °C 370 0
Bitumen is a residual stream and does not change state during the
Run-down temperature to storage °C 175 -195
distillation process. The approach used in this LCI has been to consider
Overall temperature change 135
only the heat required to change the temperature of the bitumen molecules
Specific heat capacity of bitumen J/kg·K 2 100
within the crude oil using the specific heat capacity of bitumen22 to
Temperature adjustment J/K 0
determine the amount of energy required to raise the temperature of the
J/kg 283 500
bitumen fraction of the crude oil to 175 °C. A conservative estimate of heat- Energy required to heat bitumen
MJ/t 315*
exchanger efficiency of 90% was assumed and energy consumption was
* Heat exchanger efficiency assumed to be 90%
adjusted accordingly.
The energy mix used for the calculations was based upon data from
At this time a further study to develop a model of a heat-integrated refinery Concawe from a survey conducted in 201023. 93,5% of the total energy
is under consideration, such a model would take into account the energy (steam, heat and internal electricity) needed for the production is
flow for each of the major streams from the atmospheric and vacuum produced in the refinery from refinery gas (86,7%) and heavy fuel oil
distillation columns and heat transferred between products and heat (13,3%), the remaining 6,5% is assumed (by Concawe) to be gaseous fuels,
exchangers. such as natural gas. All gaseous fuels were considered equivalent to refinery
gas (same calorific value and life cycle inventory).
Based on this allocation method, the energy required for the production of
straight-run bitumen is 315 MJ/t. Table 9. Distribution of energy sources for bitumen production in refinery
Other options for allocation are possible and would change the results for Distribution of energy sources for bitumen
MJ/t bitumen
the refining part of the life-cycle. production in refinery
The sensible heat method uses the mass of material and its specific heat Heavy fuel oil 13,3% 41,9
capacity and includes an efficiency term for the heat exchangers used in Refinery gas 86,7% 273,1
the refinery as follows; Total 100% 315
Where; The calorific values of the heavy fuel oil (40,0 MJ/kg) and refinery gas
C · ΔT = Thermal energy C = specific heat capacity (J/K) (49,4 MJ/kg) allow the calculation of the consumption of energy for the
ŋ required ΔT = net change in temperature of bitumen (K) production of bitumen by straight-run distillation. The following amount of
ŋ = efficiency of heat exchangers heavy fuel oil and refinery gas were considered:
Table 10. Energy consumption for bitumen production in refinery
Heavy fuel oil 1,05 kg/t bitumen
Refinery gas 5,53 kg/t bitumen
The consumptions and emissions due to the production and consumption
of refinery gas and heavy fuel oil are given in the following life cycle
inventories of the Ecoinvent 3.5 database: “Heat, district or industrial, other
than natural gas {Europe without Switzerland}| refinery gas, burned in
furnace | Cut-off, U” and “Heavy fuel oil, burned in refinery furnace {Europe
without Switzerland}| processing | Cut-off, U”.
175.4.2 Water consumption. 5.5 Bitumen storage
Data for water consumption were taken from Concawe24. The data Directly after production, bitumen is transferred into heated storage tanks
represent water consumption from 70 European refineries and cover intake, at the refinery where it is held at the required temperature. The bitumen
discharge and consumption. Water consumption varies depending upon remains within these tanks until loaded for subsequent transfer.
refinery complexity, with more complex refineries consuming more water
than less complex refineries. The report considers water consumption An average size storage tank of about 6 200 m3 in volume is used for the
for refineries with 4 categories of Nelson Complexity Index (NCI)25 in study. A typical storage temperature is 175°C; bitumen is also transferred
which bitumen production is assigned an NCI of 1.5. Therefore, water from the production process at this temperature. Bitumen in the storage
consumption was taken as a mean of class 1 and 2 data. In total, 342,50 L tank is circulated constantly using a pump powered by an electric motor.
water/ t crude oil are consumed. However, it is not possible to regionalise The same pump is also used for loading. The annual throughput of the tank
this flow since this LCI described an average refinery based in Europe. is fixed at 40 000 tonnes. The infrastructure for bitumen storage is not
covered due to the lack of specific data.
However, the source of fresh water for the refining stage was considered, as
shown in figure 7. Water consumption associated with storage is assumed 5.5.1 Consumption of energy resources
to be included in the refining data. The mean energy losses from the storage tanks and pipework were
calculated by three independent sources using standard engineering
100.0
90.0
methodology and calculations. The average energy use was as follows:
80.0 • Maintain the bitumen temperature within the storage tank 70,1 MJ/t
70.0
• Maintain the temperature within the pipework 20,2 MJ/t
60.0
50.0 • Circulate and load bitumen 9,7 MJ/t
%
40.0 • Total storage energy 100 MJ/t
30.0
20.0
10.0 Table 12. Energy calculations for bitumen storage.
0.0
Bitumen tank Heat losses
Purchased raw water Groundwater Surface water
Volume m3 6 200 Bitumen storage MJ/t 70,1
Purchased potable water Other Harvested storm/rain water
Temperature °C 175 Pipelines
Annual throughput t 40 000 - bitumen MJ/t 20,2
Figure 7. Refining fresh water consumption by source
Outside conditions - heating oil MJ/t
The following flows were used to characterise the fresh water source: Temperature °C 10 Total storage MJ/t 90,3
Wind m/s 5 Energy need MJ/t 90,3
Table 11. Water flow modelling in refinery Annual use h 8 000 Fuel for Hot oil
Heating oil effiency % 85 Energy need MJ/t 9,7
Source Elementary flow Pumps kW 11 Electricity
Rain water Water, rain Annual usage time h 8 760 Total energy MJ/t 100,0
Other Water, unspecified natural origin/m3
Refinery fuels are used in heating the tank and pipe work. The split between
Purchased potable water Water, process, drinking refinery gas and heavy fuel oil is the same as in the refinery. The circulation
Surface water Water, river and loading pump utilises electricity from the grid.
Ground water Water, groundwater consumption
Purchased raw water Water, unspecified natural origin/m3 Table 13. Energy source at refinery for bitumen storage
Fuel kg/t Energy kWh/t
Energy source Split % Energy MJ/t
bitumen bitumen
5.4.3 Refinery infrastructure Refinery gas 79,3 71,6 1,45
The infrastructure for refinery was based on the ecoinvent inventory Heavy fuel oil 20,7 18,7 0,47
“Petroleum refinery {RER}| construction | Cut-off, U”. Electricity - 9,7 2,69
The consumptions and emissions due to the production of electricity and
to the production and combustion of heavy fuel oil and refinery gas are
calculated in the same way as in the refining step.
18You can also read