Renewable Energy Market Update - Outlook for 2020 and 2021
←
→
Page content transcription
If your browser does not render page correctly, please read the page content below
Renewable
Energy Market Update
Outlook for 2020 and 2021
Renewable energy market update May 2020

Table of content
Key findings ................................................................................................................ 3
Context ....................................................................................................................... 5
2020 and 2021 forecast overview .............................................................................. 6
Covid-19 impact on renewable energy growth .......................................................... 11
Technology summaries ............................................................................................ 20
  Solar PV ........................................................................................................................... 20
  Wind ................................................................................................................................ 30
  Bioenergy for power ....................................................................................................... 38
  Hydropower .................................................................................................................... 39
  CSP and geothermal ....................................................................................................... 40
  Transport biofuels ........................................................................................................... 42
  Renewable heat............................................................................................................... 47
Challenges and opportunities beyond 2021 ............................................................. 51
Designing stimulus packages for a cleaner energy future ........................................ 57

                                                                                                                                             IEA All rights reserved.

                                                               PAGE | 2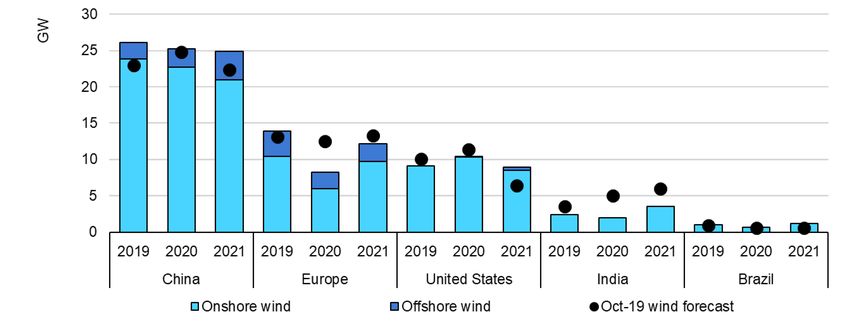
Renewable energy market update May 2020
Key findings
The Covid-19 crisis is hurting – but not halting – global growth in renewable
power capacity. The number of new renewable power installations worldwide
is set to fall this year as a result of the unprecedented Covid-19 crisis, marking
the first annual decline in 20 years. But, given supportive government
policies, growth is expected to resume next year as most of the delayed
projects come online.
In 2020, the IEA forecasts net additions of renewable electricity capacity to
decline by 13% compared with 2019. The decline reflects delays in
construction activity due to supply chain disruption, lockdown measures and
social-distancing guidelines, and emerging financing challenges. This
nevertheless corresponds to a 6% increase in global installed renewable
power capacity, which surpasses the combined size of power systems in both
North America and Europe.
In 2021, renewables are expected to show their resilience – the majority of
the delayed projects are expected to come online, leading to a rebound in
new installations. As a result, next year is forecast to reach the same level of
renewable electricity capacity additions as in 2019. Despite the rebound,
combined growth in 2020 and 2021 is almost 10% lower compared to the
previous IEA forecast published in October 2019.
Solar PV and wind account for 86% of global renewable capacity additions
this year, but their annual expansion is forecast to decline by 18% and 12%
respectively compared to 2019. The forecast expects utility-scale PV and
wind to rebound as the majority of projects in the pipeline are already
financed and under construction. However, forecast uncertainty remains for
projects that were due to achieve financial close in 2020 and become
operational next year. Moreover, total PV additions in 2021 are expected to
fall short compared to 2019 due to slower recovery of distributed PV
applications, as individuals and small business are expected to reprioritise
investment decisions.
The impact of Covid-19 on renewable electricity technologies with long lead
times, such as hydropower, offshore wind, CSP and geothermal, remains
limited. Hydropower capacity additions are forecast to increase both in 2020
and 2021, driven by the commissioning of two mega hydropower projects in
China and supporting the rebound of renewables next year. The forecast for
IEA All rights reserved.
PAGE | 3Renewable energy market update May 2020
offshore wind remains unchanged as most projects are already financed and
under construction.
The Covid-19 crisis has radically changed the global context for biofuels.
Transport biofuel production is anticipated to contract by 13% in 2020, the
first decrease in output in two decades. Gasoline demand is forecast to fall
by 9% in 2020 and diesel demand by around 6%. This, in turn, limits biofuel
consumption resulting from mandate policies. Some of the impacts from the
Covid-19 pandemic could be temporary. If a rebound in transport fuel
demand occurs in 2021, biofuel production could return to 2019 levels.
However, this would still be 5% lower than the output anticipated in our
forecast for 2021 prior to the Covid-19 crisis. Longer-term implications for
growth may arise from the suspension of new policy initiatives in some
countries due to low oil prices.
Renewable heat consumption is also likely to decline in 2020. The industrial
sector is expected to consume less renewable heat as lower commercial,
industrial and construction activity during lockdown results in a demand
shock for most heat-intensive industries. Moreover, current low oil and gas
prices are affecting the cost-competitiveness of renewable heat fuels and
technologies: many planned investments to switch from fossil fuel heating to
renewable or electric solutions are likely to be postponed or cancelled in the
absence of stronger policies.
At the start of this year, renewables in several markets were already facing
challenges regarding financing, policy uncertainty and grid integration.
Covid-19 is now intensifying these concerns. However, governments have the
opportunity to reverse this trend by making investment in renewables a key
part of stimulus packages designed to reinvigorate their economies. This
offers the prospect of harnessing the structural benefits that increasingly
affordable renewables can bring, including opportunities for creating jobs
and economic development, while reducing emissions and fostering
innovation.
IEA All rights reserved.
PAGE | 4Renewable energy market update May 2020
Context
This report is a market update on the IEA’s most recent five-year renewable
energy forecast, Renewables 2019, published in October 2019. It provides an
early analysis of the drivers and challenges since last October, and covers
renewable capacity additions for all technologies and transport biofuel
production expected during 2020 and 2021. An update on renewable heat
technologies is also included; however, the analysis is qualitative due to
limited data availability. Given ongoing uncertainty, the forecasts for 2020
and 2021 will be updated in the second half of the year to reassess recent
market and policy developments.
Renewables are not immune to the Covid-19 crisis, but
they are more resilient
Renewables are not immune to the Covid-19 crisis, but are more resilient than
other fuels. The IEA’s Global Energy Review 2020 projected renewables to be
the only energy source to grow this year compared to 2019, in contrast to all
fossil fuels and nuclear.
Globally, overall demand for renewables is expected to increase due to their
use in the electricity sector. Even with end-use electricity demand falling
significantly because of lockdown measures, low operating costs and priority
access to the grid in many markets allow renewables to operate at near full
capacity, enabling renewable generation to grow. This increased production
is in part due to record-level capacity additions in 2019, a trend that was set
to continue into this year. However, supply chain disruptions, construction
delays and macroeconomic challenges increase the uncertainty about the
total amount of renewable capacity growth in 2020 and 2021.
The IEA anticipates that consumption of transport biofuel and industrial
renewable heat will be more acutely impacted by an economic downturn
than will renewable electricity. Lower transport fuel demand directly affects
the prospects for biofuels such as ethanol and biodiesel, which are mostly
consumed blended with gasoline and diesel. Renewables directly used for
heat processes mostly take the form of bioenergy for the pulp and paper,
IEA All rights reserved.
PAGE | 5Renewable energy market update May 2020
cement, textile, food and agricultural industries, all of which are exposed to
demand shocks. Suppression of global demand has a stronger impact on
biofuels and renewable heat than it does on renewable electricity. This impact
will critically depend on the duration and stringency of lockdowns and the
pace of economic recovery.
2020 and 2021 forecast overview
Electricity markets
The IEA forecasts that additions of renewable electricity capacity will decline
by 13% in 2020 compared with 2019, the first downward trend since 2000.
This is a 20% downward revision compared to our previous forecast in which
2020 was due to be a record year for renewable power. The update reflects
both possible delays in construction activity due to supply chain disruptions,
lockdown measures and social-distancing guidelines, and emerging
financing challenges. The outlook also takes into account ongoing policy
uncertainty and market developments such as the most recent auctions and
newly financed projects before the Covid-19 outbreak.
However, the majority of these delayed projects are expected to come online
in 2021 and lead to a rebound in capacity additions. As a result, 2021 is
forecast to almost reach the level of renewable capacity additions of 2019.
Despite the rebound, the combined growth in 2020 and 2021 is almost 10%
lower compared to the previous IEA forecast.
IEA All rights reserved.
PAGE | 6Renewable energy market update May 2020
Renewable electricity capacity additions in updated IEA forecast
250
GW
200
150
100
50
0
2007
2008
2009
2010
2011
2012
2013
2014
2015
2016
2017
2018
2019
2020
2021
Actual Forecast
China Europe United States India Japan Brazil Rest of the world
The United States and the People’s Republic of China (hereafter, “China”) are
both expected to see an increase in capacity additions in 2020 and 2021
compared with last year. The phase-out of subsidies in China and the expiry
of tax credits in the United States (in 2020 and 2021, respectively) are
resulting in project development rushes. However, both governments are
expected to provide some flexibility, allowing projects to be commissioned
in 2021 without losing their incentives. As a result, the forecast expects that
some wind and solar PV will be rescheduled and commissioned in 2021.
Construction delays are expected to have an immediate impact on European
utility-scale projects, as certain countries in Europe introduced some of the
strictest lockdown measures in the world. However, capacity additions are
expected to rebound in 2021. Covid-19 exacerbates existing policy
uncertainty and permitting challenges in Germany and France, while the
large pipeline of projects outside the auction scheme in Spain may see
commissioning delays. Distributed PV, which has been the backbone of
recent growth in large European PV markets, is expected to slow. Compared
to 2019 levels, it is not expected to fully recover in 2021 as small investors
reprioritise investment decisions.
In India, Covid-19 is exacerbating existing challenges concerning the financial
health of distribution companies, which play a critical role in the deployment
of both utility-scale and distributed PV. In addition, India’s strict lockdown
IEA All rights reserved.
PAGE | 7Renewable energy market update May 2020
measures are expected to result in delays to wind and PV projects, and thus
to slower growth in installations in 2020 compared with 2019.
The economic downturn is also expected to increase existing financing and
project development challenges for developing countries in Africa,
Latin America and Eurasia, pushing some planned projects beyond 2021 and
resulting in downward forecast revisions in all three regions.
The IEA forecast expects 167 GW of renewable capacity to become
operational in 2020. Solar PV accounts for half of this renewables expansion,
but its additions decline from 110 GW in 2019 to over 90 GW in 2020. New PV
installations are expected to see a partial rebound in 2021, owing to utility-
scale projects that return to 2019 addition levels, while distributed PV is hit
more severely and does not fully recover. Onshore wind installations are also
affected by commissioning delays, although they are mostly compensated
for in 2021 as the majority of projects in the pipeline are already financed and
under construction. However, forecast uncertainty remains for projects that
were planning to achieve financial close in 2020 and become operational
next year. The commissioning of two mega hydropower projects in China in
2021 supports the overall rebound of renewables.
Renewable electricity net capacity additions growth by technology in 2020 and
2021
15
GW
10
5
2020 2021
0
Wind Utility-scale PV Distributed PV Hydropower
-5
-10
-15
Overall, the updated forecast revises down combined capacity growth in
2020 and 2021 by almost 10%. The drivers behind this revision vary by
IEA All rights reserved.
PAGE | 8Renewable energy market update May 2020
technology and country (details in the technology sections). The distributed
PV forecast is revised downwards by the largest proportion, almost 36%,
mainly in Europe, China and the United States. The forecast for utility-scale
PV remains mostly unchanged except in the United States, where larger
pipelines of utility-scale projects prior to Covid-19 underpin more optimistic
growth. For wind, the European Union, China and India are mainly responsible
for the downward forecast revision in 2020 and 2021. Forecast revisions for
hydropower, bioenergy and other renewables are not directly connected to
Covid-19. The forecast for hydropower integrates new project commissioning
dates, based on recent construction activity since our previous forecast.
Transport biofuel markets
The Covid-19 crisis has radically changed the global context for biofuels. The
widespread application of containment measures and stalling of economic
activity has strongly reduced transport fuel demand. Global gasoline demand
is forecast to fall by 9% in 2020 and diesel demand by around 6%.
This, in turn, limits biofuel consumption resulting from mandate policies that
require a set percentage of biofuels to be blended with fossil transport fuels.
We anticipate total transport biofuel production to contract by 13% in 2020,
with ethanol output contracting by 15% and a 6% reduction anticipated for
biodiesel and hydrotreated vegetable oil (HVO) output.
Annual change in biofuel production, actual 2018-19 and forecast for 2020
10
Billion litres
5
0
-5
- 10
- 15
- 20
2018 2019 2020 2018 2019 2020
Ethanol Biodiesel and HVO
IEA All rights reserved.
PAGE | 9Renewable energy market update May 2020
Some of the impacts from the Covid-19 pandemic are likely to be temporary.
Biofuel production will follow gasoline and diesel demand upward as
governments ease confinement measures, allowing mobility and economic
activity to resume. If a rebound in transport fuel demand occurs in 2021,
biofuel production could return to 2019 levels. However, this would still be
5% lower than the output anticipated in our forecast for 2021 prior to the
Covid-19 crisis.
While disruption to construction activity on new biofuel production facilities
may delay commissioning by a matter of months, this additional capacity
should eventually come online.
Disruption to key biofuel support mechanisms may occur this year, as
reduced mobility affects the intended functioning of policies. The US
Renewable Fuel Standard (RFS) sets annual volume requirements for
renewable fuel consumption based on projected fuel demand, as opposed to
the majority of policies, which are based on achieving a given biofuel share.
Actual fuel demand in 2020 will clearly be less than projected due to the
Covid-19 crisis. Therefore, it is likely that the specific biofuel volumes required
by the RFS in 2020 will be far in excess of the levels that can be consumed
according to technical limits on the percentage of biofuel blending. Brazil’s
newly introduced flagship RenovaBio programme may need to adjust its CO2
emissions reduction targets for the year, which could have consequences for
the value of associated CBIO certificates.
In addition, 2020 is the milestone year in which EU member states need to
demonstrate compliance with the Renewable Energy Directive’s 10%
renewable energy share in transport. Given the disruption to transport fuel
demand and biofuel production, the shares that member states would have
achieved under normal circumstances could well be different due to the
impact of Covid-19. This may raise implications for compliance with the
target.
IEA All rights reserved.
PAGE | 10Renewable energy market update May 2020
Renewable heat markets
Beyond the direct impacts on heat consumption, the Covid-19 crisis further
compromises the already slow growth of renewables in heat supply. First,
delays in renewable district heating projects and in the manufacturing, sale
and installation of renewable heating equipment may not be fully recovered
in the second half of the year. Second, current low oil and gas prices are
affecting the cost-competitiveness of renewable heat fuels and technologies.
Given the uncertain future financial situation of many companies and
households, many planned investments in switching from fossil fuel heating
to renewable or electric solutions are likely to be postponed or cancelled in
the absence of stronger policies.
Without government intervention, the crisis could have a long-lasting effect
on the construction sector, slowing down modernisation of the buildings
stock and the rate of retrofits, which play a crucial role in energy efficiency
improvements and deployment of renewable heat technologies. At the same
time, building renovation in several countries is being considered for
inclusion in economic stimulus packages due to the early opportunity it offers
for creating jobs and triggering economic recovery. This represents an
important opportunity to integrate renewable heat technologies in the
building sector, which could consequently lead to higher-than-anticipated
deployment.
Covid-19 impact on renewable energy
growth
2020 was expected to be another record year for
renewables
The previous IEA forecast, published in October 2019, announced that
renewable capacity additions were set to achieve double-digit growth in 2019
after stalling the year before. The Renewables 2019 forecast was very close
to actual performance; the 192 GW new installations actually connected to
the grid last year was a 7% increase on 2018.
IEA All rights reserved.
PAGE | 11Renewable energy market update May 2020
Renewables growth in 2019 was dominated by solar PV, with capacity
additions breaking another record to reach 110 GW, slightly lower than the
IEA estimate of 114 GW. Due to policy changes, China’s PV additions declined
for the second year in a row to 30 GW, a sharper reduction than previously
forecast. China’s share of global PV additions declined from a record of 55%
in 2017 to less than 30% in 2019. In contrast, other markets such as the United
States, the European Union, Brazil and Viet Nam outpaced expectations for
PV additions.
Wind power saw its second-largest expansion since 2015, driven by faster
growth in China and the European Union, while hydropower additions
continued their declining trend as fewer projects came online in China.
Renewable electricity capacity additions by technology, actuals and IEA forecast in
2019
250
GW
200
150
100
50
0
2015
2016
2017
2018
2019
2019
2020
Actual Oct-19 forecast
Wind Solar PV Bioenergy Hydropower CSP Geothermal
After a strong 2019, global additions were expected to hit a record in 2020
before declining in 2021, a trend resulting from policy-driven developments
in major markets:
In the United States, onshore wind additions were expected to peak in 2020
then start to decline as the production tax credit (PTC) begins to phase out.
In China, the phase-out of feed-in tariffs (FITs) was expected to drive a rush
to complete wind and solar PV projects in 2020, while several large-scale
conventional and pumped hydropower projects were due to be
commissioned in 2020.
IEA All rights reserved.
PAGE | 12Renewable energy market update May 2020
In India, the growth of wind and solar projects needed to accelerate to
achieve the ambitious 175 GW target for 2022.
In the European Union, multiple countries had previously awarded wind and
solar PV capacity in competitive auctions to close their gap on 2020 targets.
Prior to the start of the Covid-19 crisis, biofuel production and renewable heat
consumption were both expected to increase by around 3% in 2020. Three
factors were driving our previous five-year forecast: Brazil’s new biofuels
policy, the wider implementation of China’s ethanol blending mandates and
continued biodiesel expansion in ASEAN member countries. In the
European Union, renewable heat was set to benefit from further policy
support, 2020 marking the start of the implementation period of new 2030
renewable energy goals.
Biofuel production and renewable heat consumption, actuals, IEA estimates and
forecast in 2019
Biofuels Renewable heat
Mtoe
Billion litres
180 600
160
500
140
120 400
100
300
80
60 200
40
100
20
0 0
2017 2018 2019 2020 2017 2018 2019e 2020
Actual Oct-19 Actual Oct-19
forecast forecast
Covid-19 is expected to delay renewables deployment
Like other industries, renewables are exposed to new risks from Covid-19,
varying significantly by market sector and technology. On 5 April 2020,
global lockdown measures had reached a peak with over 4.2 billion people –
more than half of the global population – being subject to complete or partial
lockdowns. Even though countries all over the world began to gradually lift
some of these measures in early May, their impacts are still far-reaching.
Social-distancing guidelines and lockdown measures have been triggering
IEA All rights reserved.
PAGE | 13Renewable energy market update May 2020
supply chain disruption and delays in project construction, having a direct
impact on the commissioning of renewable electricity projects, biofuel
facilities and renewable heat investments. Restrictions on business activities,
travel and border closures have sharply reduced energy demand in transport
and industry, decreasing the consumption of bioenergy and other
renewables. Emerging macroeconomic challenges may prompt cancellation
or suspension of investment decisions for both large and small-scale projects
under development. All of these factors may put projects at risk, even if they
are at an advanced stage.
Delaying projects under construction
For utility-scale electricity and transport biofuel projects under construction,
commissioning delays will depend on the length and severity of confinement
measures. These can vary by country, state or even city. By mid-May, the
world’s top growth markets in 2020 had undergone four to ten weeks of non-
essential business closure or lockdown, with some of the strictest measures
in place in certain US states, Europe and India starting mid-March.
Length of full and partial lockdown measures in top renewable growth markets
Brazil
Mexico
Australia
Turkey
United Kingdom
France
Germany
Texas, US
Oklahoma, US
California, US
India
Spain
Netherlands
Italy
Japan
Korea
China
23 January '20 February '20 March '20 April '20 15 May
Social distancing Business closure or Full lockdown
partial lockdown
Source: IEA analysis based on Olivier Lejeune (2020), Coronavirus Counter Measures,
https://github.com/OlivierLej/Coronavirus.
IEA All rights reserved.
PAGE | 14Renewable energy market update May 2020
While these measures are intentionally strong, in most countries the energy
sector counts among the essential services. Therefore, lockdown measures
do not necessarily imply that construction activity on energy projects,
including renewables, has fully stopped. This varies by market, however, as
in some countries, access to sites was allowed under full lockdown, while in
others, work on some projects could not continue even under a partial
lockdown. For instance, India allowed the construction of renewable energy
projects to continue during its three-week full lockdown, while major
construction firms in Japan suspended works in response to the state of
emergency.
Delays due to supply chain disruptions and/or closure of construction sites
have the obvious result of reducing additional short-term capacity additions,
with the impacts most likely seen in 2020.
A second consequence is that delayed projects may run the risk of not
reaping the benefit of incentives ending in 2020. Even with site access,
almost all lockdown measures and social-distancing guidelines require
companies to follow precautionary safety measures. Limitations on the
number of workers allowed on site and/or stricter hygiene protocols
inevitably slow construction down, increasing the risk of delays. Delays in
components or construction put companies at risk of missing critical policy
deadlines in China, the United States and Europe, denying them financial
incentives they previously qualified for.
It is reasonable to assume that a majority of projects missing incentive
deadlines may be further delayed or cancelled. In order to address these
concerns, a number of countries have introduced policy changes, as
reported in the table. This positively influences the outlook, in particular for
2021.
IEA All rights reserved.
PAGE | 15Renewable energy market update May 2020
Recent policy changes providing flexibility for delays
Impact
Country Policy change
year
Extension of the construction period for wind
Austria 2020-21
farms by 6 months
3-5-month extension of commissioning deadlines
Denmark for household wind turbines; 2-month extension 2020
for subsidy applications for biogas projects
Extension of commissioning deadlines by 2-6
France 2020-21
months
Federal network agency announced flexibility in
Germany project commissioning for previously auctioned 2020-21
projects
6-month extension for projects due to come
Greece 2020-21
online in mid-2020
30-day extension of commissioning deadlines for
India 2020-21
renewable projects after the lockdown
6-month extension of the FIT completion deadline
United Kingdom 2020
for community solar projects
Extension of PTC/ITC safe harbour provision
United States 2020-21
proposal
Covid-19 poses a risk to investments made by individuals and small to
medium-sized enterprises in renewable energy applications, such as
distributed PV, solar thermal water heaters, heat pumps and biomass boilers.
These investments run a higher risk of delay or even cancellation compared
to large-scale projects. Currently, the installation of distributed solar PV has
slowed in many countries as lockdown measures prevent personal contact
and access to houses or commercial buildings. Moreover, households and
small businesses facing financial shocks and economic uncertainty may
postpone or abandon their plans to install solar PV, solar thermal water
heaters or heat pumps on their property.
IEA All rights reserved.
PAGE | 16Renewable energy market update May 2020
Impacts on existing assets
Existing renewable electricity plants are mostly sheltered from both lower
electricity demand and declining prices. Many renewable electricity plants
have fixed price contracts and are granted priority access to the grid,
resulting in little or no output curtailment. Covid-19 lockdown measures have
resulted in weekly electricity demand decreasing by 10-35% across affected
regions, increasing the overall share of variable renewables to meet this
demand. A combination of low electricity demand and the additional capacity
coming online in 2019 and the first quarter of 2020, are leading to record high
shares of infeed from variable renewables in electricity demand in some
regions.
VRE share over demand in Italy, California and Germany
Italy California Germany
100 100 100
90 90 90
%
80 80 80
70 70 70
60 60 60
50 50 50
40 40 40
30 30 30
20 20 20
10 10 10
0 0 0
0
150
300
450
600
750
900
1050
1200
1350
0
150
300
450
600
750
900
1050
1200
1350
0
150
300
450
600
750
900
1050
1200
1350
hours
Lockdown start to 13/05/2020 Corresponding period in 2019
Italy, Austria and Belgium have experienced well above record-high hourly
shares of variable renewable energy (VRE) compared to last year, reaching
almost 63%, 70% and 67% instantaneous VRE penetration respectively. In
addition, Germany had a new record low net load as a result of declining
demand. Conversely, systems such as California and Texas experienced VRE
shares similar to last year. These states experienced higher hourly VRE shares
before lockdown measures, showing that in some cases variability due to
weather had stronger impacts than electricity demand reduction due to
Covid-19.
IEA All rights reserved.
PAGE | 17Renewable energy market update May 2020
VRE share over demand in Austria, Belgium and Texas
Austria Belgium Texas
100 100 100
90 90 90
%
80 80 80
70 70 70
60 60 60
50 50 50
40 40 40
30 30 30
20 20 20
10 10 10
0 0 0
0
150
300
450
600
750
900
1050
1200
1350
0
150
300
450
600
750
900
1050
1200
1350
0
150
300
450
600
750
900
1050
1200
1350
hours
Lockdown start to 13/05/2020 Corresponding period in 2019
Despite increasing VRE shares, security of supply has not been jeopardised
during the current crisis, even in countries with very high penetration rates.
However, as we transition into summer, more challenging conditions could
arise – particularly in PV-dominated systems – when even more extreme VRE
shares may be expected. Systems could start facing a more recurrent
challenge of either decreasing conventional generation to accommodate
renewable energy or curtailing renewables.
Experience shows that balancing supply and demand during summer can be
an increasing challenge, as a growing percentage of demand is served on-
site with distributed PV, while generation from utility-scale solar PV and other
renewables also increases. This means that conventional sources are turned
off and cannot provide grid-balancing services such as frequency regulation
and voltage management. This problem might be exacerbated by lower
demand resulting from lockdown measures and consequently even higher
VRE in-feed into the system. However, these ancillary services could be
provided by solar PV and wind by implementing operational changes; some
countries are already actively doing this. Covid-19 may require system
operators to make use of balancing tools more frequently and for longer than
IEA All rights reserved.
PAGE | 18Renewable energy market update May 2020
in past summers, as is already stated by Great Britain´s electricity system
operator (National GridESO), in their April 2020 Summer Outlook. 1
While existing renewable electricity assets have not seen much impact from
the decline in demand, transport biofuel production plants have idled or
reduced their output. In the first quarter of 2020, road transport in regions
with lockdowns in place dropped by between 40% and 80% compared with
2019 during the same period. As ethanol and biodiesel are blended with oil
products, their production in key countries fell in line with transport fuel
demand. For instance, US ethanol production declined by almost 50% in mid-
April compared to the same period in 2019. Renewable heat consumption in
industry also saw a similar trend.
Evolution of road transport and aviation activity in 2020 relative to 2019
Road transport activity Number of flights
150 150
Year-on-year % change
125 125
Europe
100 100
India
75 United States 75
50 China 50
25 World 25
0 0
January February March April January February March April
Renewable heat consumption in industry sees a similar trend, as reduced
commercial, industrial and construction activities during lockdown results in
a demand shock for most heat-intensive industries, in particular for large
bioenergy consumers such as the cement and wood industries. Although
reduced electricity demand tends to lift the share of renewables in the
electricity supply, and thereby raise the indirect contribution of electric
heating and heat pumps to renewable heat consumption, this effect remains
marginal overall.
1
National Grid ESO (2020), April 2020 Summer Outlook, https://www.nationalgrideso.com/document/167541/download.
IEA All rights reserved.
PAGE | 19Renewable energy market update May 2020
Technology summaries
Solar PV
Having stalled in 2018, solar PV capacity additions surged again by almost
14% in 2019, reaching a record of 110 GW of newly installed capacity globally.
This is despite Chinese PV additions declining by almost a third, as annual
installations elsewhere grew by 50% last year.
Covid-19 has led to construction delays and weaker than anticipated
investment, requiring us to revise capacity addition projections down by over
15% for 2020. While the impact will be across the entire sector, Covid-19
related risks are not spread equally as distributed PV is more affected than
utility-scale projects.
Solar PV capacity additions, actual and IEA forecasts
120
GW
100 Off-grid PV
80
Residential PV
60
40 Commercial PV
20
Utility-scale PV
0
2019 2020 2021 2020 2021
Actual Oct-19 forecast May-20 forecast
Utility-scale projects are more susceptible to supply chain concerns, labour
constraints and construction delays, all leading to delays in project
commissioning. The distributed PV sector is more at risk as it relies on both
individuals and SMEs, who are more severely affected by lockdown measures
and any economic downturn resulting from Covid-19; they will be reluctant
to invest in such systems as they look to save money or reduce capital
spending. Given recent precautionary measures, such as social distancing
IEA All rights reserved.
PAGE | 20Renewable energy market update May 2020
and lockdowns, project development challenges could last through the end
of Q3 2020. Our updated forecast expects a rebound for utility-scale projects
in 2021, but with total PV installations remaining below 2019 levels due to
much slower recovery of distributed PV applications.
All PV sectors are at risk of prolonged supply chain delays associated with
Covid-19. With China accounting for 70% of global PV module manufacturing,
the country’s factory shutdowns in February and the first two weeks of March
drastically lowered the availability of equipment. After the easing of these
shutdowns, manufacturing in China has ramped up production and the solar
PV supply chain is rapidly resuming activity, despite some lingering shipment
delays. Other major supply markets such as South East Asia saw slowdowns
in production, but for the most part maintained a similar volume of output
throughout the pandemic.
Even with any production slowdown, there remains significant manufacturing
overcapacity in the PV market. The global manufacturing capacity for cells is
150 GW, while 120 GW worth of solar PV cells were shipped in 2019 and
110 GW were installed. As a result, the market had 30 GW of unused
manufacturing capacity and 10 GW of cells stored for later use. In addition,
since 2018 manufacturers, developers and traders have built inventories,
taking advantage of low prices.
Solar PV module manufacturing and demand, 2014-19 actual and 2020 estimate
180
GW
160
140 Manufacturing
capacity
120
100
80
60
Annual
40 installations
20
0
2014 2015 2016 2017 2018 2019 2020e
IEA analysis based on Paula Mints (2020), The Solar Flare, SVP Market Research, San Francisco, CA.
IEA All rights reserved.
PAGE | 21Renewable energy market update May 2020
Existing stocks helped most developers withstand supply chain issues and
logistical delays due to Covid-19, and thus our updated forecast reflects
limited supply chain-related delays. With the completion of additional
manufacturing facilities in China in 2020, the supply glut is expected to reach
its highest level ever globally, fostering competition and increasing
downward pressure on module prices.
The major risks for solar PV are installation and at the point of sale. For utility-
scale projects, lockdown measures are slowing construction activity,
increasing the risk of commissioning delays. These delays will reduce the
total amount of capacity installed in 2020, causing projects to slip into 2021
and resulting in a 12% rebound next year. Developers in mature markets such
as the United States, China and Europe are likely to recover rapidly from
delays after the easing of lockdown measures, as most have experience in
increasing the pace of construction. As an example, developers in China
installed over 10 GW in November and December 2019 to meet end-of-year
policy deadlines.
Before the Covid-19 breakout, developers were also financing additional
project pipelines for commissioning in 2021. These projects will be hit by the
economic downturn, especially those being built outside a regulated
environment. We expect some to be put on hold or cancelled in China,
Europe and the United States.
Distributed PV has been immediately impacted by Covid-19 measures, while
a longer-term economic downturn is likely to have a potentially devastating
impact on overall investment in the distributed sector if new and stronger
policies are not introduced. Major markets such as the United States, Europe
and Brazil have seen installations of distributed PV drop following stay-at-
home orders and face-to-face sales have understandably slowed drastically.
This results in a dip in installed capacity growth in 2020. The rapid recovery
of the distributed PV sector will depend on the pace of and the nature of any
stimulus packages.
IEA All rights reserved.
PAGE | 22Renewable energy market update May 2020
China
China’s annual PV deployment declined for a second year in a row in 2019, by
32% to 30 GW. Developers had very tight commissioning deadlines after the
award by auction of 23 GW of utility-scale and commercial solar PV in July
2019. The first competitive auction saw tariffs decline by 15-40% compared
to previous incentives, reducing project profitability especially for
commercial and industrial projects. In contrast, residential PV projects saw
significantly higher additions in 2019 than in 2018 because they are outside
the auction scheme and still receive FITs.
Annual PV additions are expected to increase by about 20% in 2020. Utility-
scale projects should dominate this expansion, including previously
auctioned capacity that qualified for subsidies but was not commissioned in
2019. China plans to hold a PV auction for utility-scale and commercial
projects in June, but the government has decided to cut the annual subsidy
budget by over 50% compared to last year. In addition, there is a growing
project pipeline without subsidies. With increasing financing challenges due
to Covid-19, we expect slower growth in distributed PV projects, with
developers focusing on large utility-scale plants in 2020.
Deployment is forecast to remain stable in 2021. In the absence of new
subsidies beyond 2020 and with China’s electricity demand slowing, utility-
scale projects in the pipeline without subsidies may be postponed or
cancelled. An improving economic and financing environment is expected to
enable greater deployment of commercial PV projects in 2021. Overall,
China’s solar PV expansion over 2020 and 2021 is revised downward
compared to our previous forecast, mostly due to slower growth in
commercial solar PV, as investors are expected to delay or cancel some
investments due to the Covid-19 crisis.
IEA All rights reserved.
PAGE | 23Renewable energy market update May 2020
Solar PV capacity additions, China, Europe, United States, India and Brazil, 2019
actual and IEA forecasts
45
GW
40
35
30
25
20
15
10
5
0
2019 2020 2021 2019 2020 2021 2019 2020 2021 2019 2020 2021 2019 2020 2021
China Europe United States India Brazil
Utility-scale PV Commercial PV Residential PV Off-grid Oct-19 PV forecast
United States
The annual increase in solar PV capacity in the United States topped 13 GW in
2019, the second-highest recorded to date, due to the increasing economic
attractiveness of both utility-scale projects and residential PV systems.
However, annual growth is seen slowing in 2020 as the impacts of Covid-19
dampen distributed PV prospects. New installations of both residential and
commercial systems are expected to decrease as social-distancing measures
affect new customer acquisition and self-consumption becomes less
attractive amid a period of economic uncertainty. Distributed PV growth
rebounds in 2021 in the residential segment as consumers rush to take
advantage of the solar investment tax credit (ITC) before it expires at the end
of 2021. California’s new housing mandate, which started in 2020, is also
expected to bolster some growth.
In contrast, utility-scale PV growth accelerates in both 2020 and 2021
because of increasing economic attractiveness and raised renewable energy
targets across several states. Compared to our previous forecast, utility-scale
growth across 2020-21 is more optimistic due to an increase in the pipeline
of contracted projects (40 GW) at the end of 4Q 2019. 2 The surge in
development activity is driven by increased policy support in some states as
2
WoodMackenzie (March 2020), online database, accessed by subscription.
IEA All rights reserved.
PAGE | 24Renewable energy market update May 2020
well as the increasing economic attractiveness of both corporate PPAs and
utility-led procurement to meet long-term planning needs and satisfy
demand for renewable electricity from large consumers.
However, the impact of Covid-19 on the business case of early-stage projects,
meaning those still subject to contract and yet to start construction, is a
forecast uncertainty. While the government plans to modify the rules to
qualify for support under the ITC, monetising this support may be a challenge
if less tax equity is available in a weaker economy.
Europe
Solar PV additions nearly doubled in Europe last year, reaching almost 19 GW
in 2019 compared to just 10 GW installed in 2018. This is the highest level
achieved since 2011 when many countries began to remove high feed-in
tariffs for utility-scale PV. The strong growth in 2019 was driven a combination
of increasing economic attractiveness of distributed PV under net-metering
and self-consumption policies, and utility-scale projects awarded under the
new auction schemes in many countries. Almost half of Europe’s utility-scale
additions came from one auction in Spain held in 2017.
However, PV additions are set to decline in 2020 as a result of several trends:
i) exceptionally high growth in 2019; ii) uncertainty relating to policy
transitions (particularly in Germany and Spain); iii) lockdown-induced
construction delays; and iv) the economic impact of Covid-19 on the business
case of unsubsidised utility projects and distributed PV. In 2021 annual
growth is expected to rebound to 15 GW, the second-highest level since 2013,
largely due to a strong recovery in utility-scale PV as delayed project activity
resumes. Distributed PV additions increase slightly in 2021, but growth is
limited by uncertainties over the attractiveness of self-consumption during a
period of weaker economic growth. Overall, the region is forecast to add
25 GW over 2020-21, led by Spain, Germany, and France. This is 18% lower
than was expected in the October 2019 PV forecast.
IEA All rights reserved.
PAGE | 25Renewable energy market update May 2020
Solar PV capacity additions, Spain, Germany and France, 2019 actual and IEA
forecasts
5.0
Off-grid
GW
4.5
4.0
Residential PV
3.5
3.0
2.5 Commercial
PV
2.0
1.5 Utility-scale
PV
1.0
0.5 Oct-19 PV
forecast
0.0
2019 2020 2021 2019 2020 2021 2019 2020 2021
Spain Germany France
Solar PV additions in Spain marked an all-time high of 4.5 GW in 2019, with
both utility-scale and distributed PV reaching unprecedented levels of
growth. For utility-scale projects, this uptick resulted from developers
rushing to meet the end-of-year commissioning deadline for almost 4 GW of
capacity awarded in the 2017 auction. In the absence of further auctions,
additions in 2020 are expected to fall, but growth will still be far above
historical levels. This is due to the large pipeline of corporate PPA and
merchant projects that have emerged, particularly due to favourable market
conditions in Q3 and Q4 2019. However, the impact of Covid-19 on the pace
of their development is a key forecast uncertainty.
For projects under construction, work stoppages or a decreased workforce
may push some commissioning dates into 2021. For earlier-stage projects
with merchant exposure that are still arranging financing, the uncertainty is
greater as their business case may be challenged, especially if wholesale
electricity prices continue to plummet. In light of these uncertainties, our
forecast expects modest growth in 2020 relative to the pipeline potential and
an increase in 2021 as delayed projects resume development.
In Germany annual PV additions increased by almost 40% in 2019, the fifth
consecutive year of growth. The increase was driven by the rapid expansion
of commercial PV systems, due to attractive economics under the feed-in
IEA All rights reserved.
PAGE | 26Renewable energy market update May 2020
premium. However, the support is set to expire when cumulative capacity
reaches 52 GW, a milestone likely to be reached this year, which contributed
to the surge in activity in 2019. In late 2019 the government announced plans
to extend support beyond the cap, but the extension is contingent upon
reaching consensus on the minimum distance regulations for onshore wind,
which is still unresolved. Due to this policy uncertainty, we expect growth to
fall in 2020 and again in 2021 on the expectation of lower consumer appetite
during a weaker economic environment due to Covid-19.
Meanwhile, utility-scale additions are expected to remain stable in 2020,
driven by competitive auctions. However, some projects may be delayed due
to supply chain shortages or decreased personnel from restrictions on cross-
border workers. As such, our forecast expects a sharp increase in 2021,
reflecting the commissioning of delayed projects originally scheduled for
2020.
France installed about 0.9 GW of PV in 2019, a slight decline on 2018, in part
due to delays in commissioning utility-scale projects. Utility-scale additions
are expected to increase in 2020 and 2021 as these delayed projects are
commissioned alongside those from a new auction scheme that began in
2017. Since 2017, over 4.8 GW of ground-mounted capacity has been
awarded in the new auction scheme.
Annual growth in distributed PV is also expected to increase in 2020 and
2021, driven by a mix of competitive auctions, feed-in premiums and self-
consumption. Recent positive policy developments are also expected to
contribute to accelerated growth: (i) PV installation obligations for new
warehouses, supermarkets and parking shades; (ii) a tax reduction for large-
scale PV installations; (iii) grid connection fee exemptions for small-scale
projects; and (iv) an extension of the FIT eligibility to larger installations.
However, supply chain disruptions caused by the global Covid-19 crisis, as
well as suspension of work during lockdown and delays in permitting
procedures, are growing challenges to the realisation of this large pipeline.
In response to the crisis, the government confirmed its commitment to a
20-GW PV capacity target by 2023 and announced specific measures for
IEA All rights reserved.
PAGE | 27Renewable energy market update May 2020
renewable energy projects in April 2020, including extending commissioning
deadlines, freezing FIT declines for small installations scheduled for Q2 2020,
and postponing scheduled auctions. In light of these uncertainties, slower
growth over 2020-21 is expected relative to our previous forecast.
India
India’s PV deployment is forecast to decrease by 23% in 2020 compared to
2019, with the largest drop anticipated in distributed PV installations.
Challenges concerning the financial health of state-owned companies
responsible for the distribution and sale of electricity (DISCOMs) persist,
hampering faster growth of renewables. The Covid-19 crisis has put additional
pressure on DISCOMs and therefore on solar PV and wind development. A
rebound is expected in 2021, with capacity additions exceeding 2019 levels.
Despite government efforts to strengthen the performance of DISCOMs, the
pending payments due to all electricity generators increased by 48% in 2019,
and almost doubled in the case of renewables generators, a trend that
continued in Q1 2020. The weak financial health of DISCOMs has already
resulted in slowing development of distributed PV, delays in signing new
PPAs with solar developers and contract renegotiations.
During the lockdown, India’s electricity demand declined by 25%, mostly in
industrial and commercial segments, which account for the majority of
DISCOMs’ revenues in most states. Initial IEA estimates indicate a possible 6%
year-on-year decline in demand in 2020, further worsening DISCOMs’ already
challenging finances. This situation has been compounded by supply chain
disruptions and the strict lockdown measures that forced many workers to
return to their hometowns. As a result, our forecast expects a slowdown in
the construction of utility-scale projects. In addition, macroeconomic
challenges may lessen the willingness of electricity consumers to invest in
distributed PV. Overall, our combined PV capacity additions in 2020 and 2021
are 19% below our previous forecast, as growing challenges hamper faster
growth.
IEA All rights reserved.
PAGE | 28Renewable energy market update May 2020
Electricity generation and cumulated overdue payments to generators, India
Sources: Left-hand figure – https://praapti.in/ (accessed on 30 April 2020); right-hand figure – IEA (2020).
Brazil
The Brazilian PV market more than doubled in 2019 over the previous year,
driven by distributed installations. Due to a generous net metering scheme,
residential and commercial installations exceeded utility-scale installations
for the first time last year. Annual additions are projected to be lower in 2020
than in 2019, mainly because of slower growth in distributed PV as Covid-19
is expected to increase financing challenges and reduce sales. In April,
distributed PV installations were around 40% lower than the monthly
additions in the first quarter of 2020.
Government auctions, merchant projects and bilateral PPAs are driving
utility-scale growth in Brazil. Capacity driven by auctions is expected to
account for 45% of the expansion in 2020 and 2021. Merchant and corporate
PPA projects represent the remainder, and those projects that have not
already been financed are at risk of being postponed or cancelled with
declining demand, lower electricity prices and financing challenges.
2021 is expected to see both the distributed market and utility-scale sector
slightly recover, but not to 2019 levels, due to the potential macroeconomic
challenges influencing investment in the distributed PV sector and project
economics in the utility-scale sector. In addition, the government has
decided to postpone indefinitely two energy auctions in 2020, citing the
IEA All rights reserved.
PAGE | 29Renewable energy market update May 2020
Covid-19 related demand shock. These auctions would have had an impact
on capacity growth beyond 2021.
Monthly distributed PV installations, Brazil
250
MW
200
150
100
50
0
Source: Geracao Distribuida [Distributed Generation], Agência Nacional de Energia Elétrica [National Electricity
Agency] (May data represented through 15 May 2020).
Wind
Global onshore wind capacity additions jumped by 20% in 2019 compared to
2018, thanks to increasing expansion in China and the European Union. 2020
was expected to be another year of acceleration in deployment. However,
the unprecedented global crisis caused by Covid-19 has pushed our onshore
wind growth forecast for 2020 down by 12% compared to 2019 additions. This
decline is mainly driven by project delays rather than cancellations, thus
leading to a recovery in 2021. Despite a rebound in 2021, combined expected
onshore wind growth in 2020 and 2021 is still lower than in our October 2019
forecast by 9%.
IEA All rights reserved.
PAGE | 30Renewable energy market update May 2020
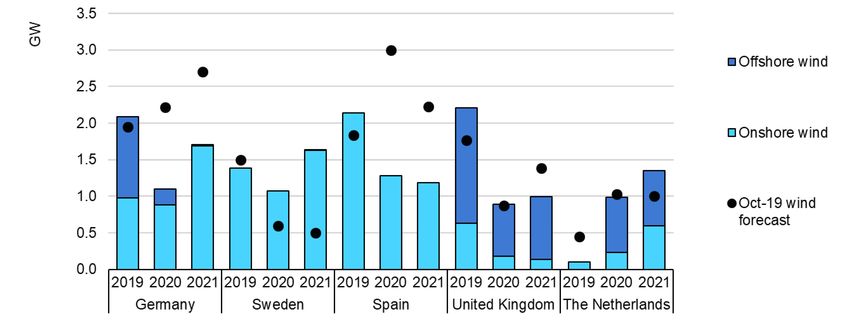
Wind capacity additions in 2019-21, actual and IEA forecasts
70
GW
60
Offshore wind
50
40
30
20
Onshore wind
10
0
2019 2020 2021 2020 2021
Actual Oct-19 forecast May-20 forecast
The wind energy sector has developed a globally interconnected supply
chain, with manufacturing dispersed across all continents. China, Europe, the
United States and India are major manufacturing hubs for various wind
turbine parts. The assembly of a complete wind turbine usually requires
inputs from multiple countries, seamless logistics and timely delivery.
However, recent lockdowns in major manufacturing hubs have disrupted
wind turbine supply chains.
In February, China’s wind manufacturing plants mostly paused production,
followed by shutdowns in Italy and Spain in March due to strict confinement
measures. In late March lockdown in India required wind turbine component
manufacturers to halt production. Although production is gradually restarting
in Europe, China and India, the effects of supply chain disruptions are being
felt in almost all markets, with multiple projects receiving force majeure
notices from suppliers warning developers about possible delivery delays.
In addition to equipment supply disruption, lockdown measures slowed
construction activity, as they often require workers to stay at home or
developers to implement social-distancing rules at construction sites. The
majority of onshore wind projects due to come online in 2020 and 2021 are
under construction. However, some still need to complete the necessary
permitting with multiple government institutions before financial closure.
These processes may require human interaction, which may not be as
IEA All rights reserved.
PAGE | 31Renewable energy market update May 2020
efficient while officials work from home. While permitting processes can be
partly moved online, community outreach cannot. Social acceptance of wind
has already been a major challenge in many countries and reduced social
interaction due to Covid-19 increases the risk of onshore wind project delays.
The impact of Covid-19 on offshore deployment in 2020 and 2021 remains
limited, causing negligible changes to the updated forecast. Offshore
projects have longer construction periods than do onshore projects. Most
projects in our forecast for 2020 and 2021 are either partially commissioned
or at an advanced stage of development, particularly in Europe, which is the
largest offshore market. China is a growing market with many projects in the
pipeline, but our forecast expects that Chinese developers will make up for
any delays. The Covid-19 crisis may impact offshore wind deployment beyond
2021, as some pre-development work such as permitting and environmental
approval is being delayed.
China
China’s wind capacity additions in 2019 reached 26 GW, 27% higher than in
2018 as developers rush to complete projects before the phase-out of
onshore wind FITs by the end of 2020. Onshore wind projects that qualified
for FITs in 2018/19 are under a very tight commissioning deadline of
31 December 2020. Covid-19 has already caused construction delays, with
additions in Q1 2020 40% lower than last year. However, construction activity
is ramping up after lockdown measures were eased at the beginning of April.
Accordingly, our forecast expects wind capacity additions to decline only
slightly in 2020 compared to last year.
We expect developers to shift some delayed projects to 2021, as the
government may provide flexibility for projects that are behind schedule. In
addition, multiple provincial wind auctions are expected to award new
capacity this year, to be operational in 2021 and 2022. However, uncertainty
remains concerning the amount of capacity that will be auctioned this year.
Outside the FIT and auction scheme, a large pipeline of projects without
subsidies has emerged over the past year. These are at higher risk of delay,
IEA All rights reserved.
PAGE | 32You can also read