Why Software Projects need Heroes (Lessons Learned from 1000+ Projects)
←
→
Page content transcription
If your browser does not render page correctly, please read the page content below
Noname manuscript No.
                                         (will be inserted by the editor)

                                         Why Software Projects need Heroes
                                         (Lessons Learned from 1000+ Projects)

                                         Suvodeep Majumder · Joymallya
                                         Chakraborty · Amritanshu Agrawal ·
                                         Tim Menzies

                                         Received: date / Accepted: date
arXiv:1904.09954v2 [cs.SE] 22 Jan 2020

                                         Abstract A “hero” project is one where 80% or more of the contributions
                                         are made by the 20% of the developers. Those developers are called “hero”
                                         developers. In the literature, heroes projects are deprecated since they might
                                         cause bottlenecks in development and communication. However, there is lit-
                                         tle empirical evidence on this matter. Further, recent studies show that such
                                         hero projects are very prevalent. Accordingly, this paper explores the effect of
                                         having heroes in project, from a code quality perspective by analyzing 1000+
                                         open source GitHub projects. Based on the analysis, This study finds that
                                         (a) majority of the projects are hero projects; and (b) the commits from “hero
                                         developers” (who contribute most to the code) result in far fewer bugs than
                                         other developers. That is, contrary to the literature, heroes are standard and
                                         very useful part of modern open source projects.
                                         Keywords Software Analytic, GitHub, Software Defects, Heroes, Social
                                         interaction, Code Interaction, Open Source Project

                                         Suvodeep Majumder E-mail: smajumd3@ncsu.edu
                                         Joymallya Chakraborty E-mail: jchakra@ncsu.edu
                                         Amritanshu Agrawal E-mail: aagrawa8@ncsu.edu
                                         Tim Menzies E-mail: timm@ieee.org

                                         North Carolina State University
                                         Raleigh,North Carolina
                                         USA,27695
2 Suvodeep Majumder et al.
1 Introduction
A “hero” project is one where 80% or more of the contributions come from
20% of the developers. Those developers are called “hero” developers. In the
literature, hero projects are deprecated since, it is said, they are like bottle-
necks that slow down the project development process and causes information
loss [13, 18, 50, 77, 108, 39].
Recent studies have motivated a re-examination of the implications of
heroes. In 2018, Agrawal et al. [2] studied 661 open source projects and 171
in-house proprietary projects. In that sample, over 89% of projects were hero-
based1 . Only in the group of small open source projects (with under 15 core
developers), non-hero projects were more prevalent.
To say the least, this widespread prevalence of heroes is at odds with
established wisdom in the SE literature. The usual stance in the literature
is to warn against heroes since they may become bottlenecks in development
and communication [13, 18, 50, 77, 108, 91, 92, 24]. Hence, it is now an open and
pressing issue to understand why so many projects are hero-based. To that end,
this paper verifies the result which Agrawal et al. [2] found out. All of project
data was recollected from scratch from double the number of open source
projects (over 1000 projects) than used by Agrawal et al. In this study, heroes
are those who participate in 80% (or more) of the total contribution in the
project. At his ICSE’14 keynote, James Herbsleb stated that communication
between developers is an important factor to find bugs when code interaction
happens [47]. So, we decided not to look at the percent of code contribution
but also at the percent of communication involvement. As a result, we will
say that “hero” developer is a developer who participates in 80% or more of
the code contribution or communications in a project. As shown below, the
population of “heroes” defined in this way are an important segment of the
development population (specifically, we will show that these “communication
heroes” add far fewer bugs into software than anyone else).
Despite our different ways to recognize “heroes” and despite our much
larger sample, this study comes to a similar conclusions as Agrawal et al..
This study finds majority of our projects contain heroes, which is very sim-
ilar to the Agrawal et al.’s result. More importantly, this study can explain
why heroes are more important. As shown below, our “hero” commit patterns
(where “heroes” are those who interact most with other developers) are associ-
ated with dramatically fewer defects than the commits from non-heroes (who
interact with fewer people). Hence we conjecture that heroes are so common
since they write better code.
This is not the first paper to comment on the use of hero developers. For
example, in 1975 Brooks [21] proposed basing programming teams around a
small number of “chief programmers” (which we would call “heroes”) who
are supported by a large number of support staff (Brooks’s analogy was the
1 This text use “hero” for women and men since recent publications use it to denote
admired people of all genders– see bit.ly/2UhJCek.Why Software Projects need Heroes (Lessons Learned from 1000+ Projects) 3
operating theater where one surgeon is supported by one or two anesthetists,
several nurses, clerical staff, etc). The Agile Alliance [29] and Bach et al. [8]
believed that heroes are the core ingredients in successful software projects
saying “... the central issue is the human processor - the hero who steps up
and solves the problems that lie between a need express and a need fulfilled.”
In 2002, Mockus et al. [75] analyzed Apache and Mozilla projects to show the
presence of heroes in those projects and reported, surprisingly, their positive
influence on the projects.
That said, this article is different from previous works because:
1. This study clearly demonstrate the benefits of hero-based development,
which is contrary to much prior pessimism [13, 18, 50, 77, 108, 39].
2. Our conclusions come from over 1000+ projects, whereas prior work com-
mented on heroes using data from just a handful of projects [9, 65, 112, 35,
19, 16, 11, 10, 62, 54, 67].
3. Our conclusions come from very recent projects instead of decades-old
data [52, 43, 54, 57, 11, 111].
4. This study shows curves that precisely illustrate the effects on code quality
for different levels of communication. This is different to prior works that
only offered general qualitative principles [106, 33, 42, 48, 27, 26].
5. As discussed in Section 2.2, this paper makes its conclusions using more
metrics than prior work. Not only do we observe an effect (using process
and resource metrics) to report the frequency of developer contribution,
but we also report the consequence of that effect (by joining to product
metrics to reveal software quality).
6. Instead of just reporting an effect (that heroes are common, as done by
Agrawal et al. [2]) this study can explain that effect (heroes are those that
communicate more and that communication leads to fewer bugs).
7. As a service to other researchers, all the scripts and data of this study can
be downloaded from tiny.cc/git mine.
The practical implication of this research is as follows:
– Our results demand a change in the way we develop new technologies or
modern software projects. Specifically, given the prominence and impor-
tance of heroes, future work could usefully explore methods to streamline
the communication between a very large population of developers and a
very small number of heroes that are critical for high quality software.
Before beginning, we make some definitional points. Firstly, when we say
1000+ projects, that is shorthand for the following. Our results used the inter-
section of two graphs of code interaction graph (of who writes what and whose
code) with social interaction graph (who discusses what issue and with whom)
from 1037 projects. Secondly, by code interaction graphs and social interaction
graphs, we mean the following. Each graph has own nodes and edges {N, E}.
For code interaction graphs:
– Individual developers have their own node Nc ;4 Suvodeep Majumder et al.
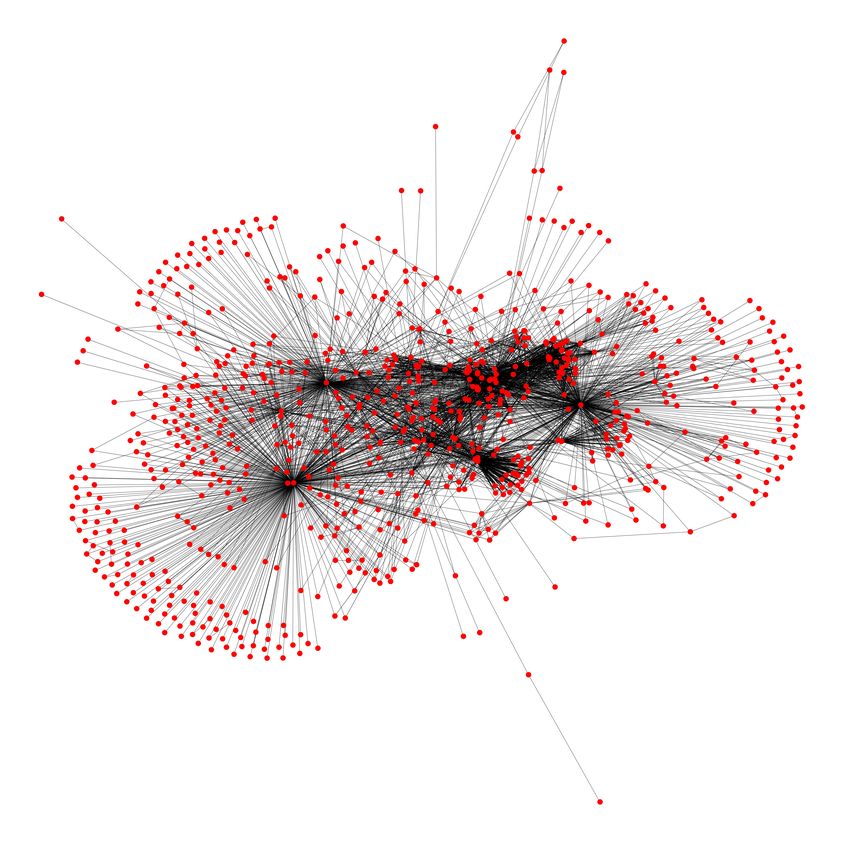
Fig. 1 An example of social interaction graph generated from our data. The number of
nodes equals the number of unique people participating in issue conversation. The existence
and width of each edge represents the frequency of conversation between pairs of develop-
ers. Hero programmers are those nodes which have very high node degree (i.e. who have
participated in lot of unique conversations). Note that, in this example data, these hero
programmers are few in number.
– The edge Ec connects two nodes and indicates if ever one developer has
changed another developer’s code. Wc denotes how much one developer
has changed another developer’s code.
For social interaction graphs like Figure 1:
– A node Ns is created for each individual who has created or commented
on an issue.
– An edge Es indicates a communication between two individuals (as recorded
in the issue tracking system. If this happens N times then the weight
Ws = N .Why Software Projects need Heroes (Lessons Learned from 1000+ Projects) 5
Thirdly, we have defined heroes based on code contribution and commu-
nication. From the “Code interaction graph” , the developers who contribute
more than 80% are hero contributors and in the “Social interaction graph”,
the developers who are making 80% of the communication are hero commu-
nicators. Both are “hero developers” for us. As we show in §4, both these
definitions of heroes are insightful since more can be predicted about a project
using both definitions that it either is applied separately.
The rest of the paper is organized into the following sections. Section 2
provides background information that directly relates to our research ques-
tions, in addition to laying out the motivation behind our work. Section 3.1
explains the data collection process and Section 3.2, a detailed description of
our experimental setup and data is given, along with our performance crite-
ria for evaluation is presented. It is followed by Section 4 the results of the
experiments and answers to some research questions. Section 5 discusses their
implication of our finding.It is followed by Section 6, which discusses threats
to validity. Finally Section 7 concludes the paper.
2 Background And Prior Work
2.1 Heroism in Software Development
Heroism in software development is a widely studied topic. Various researchers
have found the presence of heroes in software projects. For example:
– Peterson analyzed the software development process on GitHub and found
out a pattern that most development is done by a small group of developers
[83]. He stated that for most of the GitHub projects, 95-100% commits
come from very few developers.
– In 2002, Koch et al. [59] studied the GNOME project and showed the pres-
ence of heroes through out the project history. They conjectured (without
proof) that the small number of hero developers may allow easy communi-
cation and collaboration. Interestingly, they also showed there is no relation
between developer’s time in the project and being a hero developer.
– In 2005, Krishnamurthy [61] studied 100 open source projects to find that
a few individuals are responsible for the main contribution of the project
in most of the cases.
– In 2006 and 2009, Robles et al. [93, 92] explored in their research the pres-
ence and evolution of heroes in open source software community.
– In 2018, Agarwal et al. [2] stated that hero projects are very common.
In fact, as software projects grow in size, nearly all projects become hero
projects.
Most prior researchers deprecate heroism in software projects. They argue that
– Having most of the work being dependent on a small number of heroes can
become a bottleneck that slows down project development [13, 77, 50, 18,
108].6 Suvodeep Majumder et al.
– In the case of hero projects, there is less collaboration between team mem-
bers since there are few active team members. So, heroes are affecting the
collaboration which is essential [7,104].
This second point is problematic since, in the literature, studies that analyze
distributed software development on social coding platforms like GitHub and
Bitbucket [34, 31] remark on how social collaborations can reduce the cost and
efforts of software development without degrading the quality of software. Dis-
tributed coding effort is beneficial for agile community-based programming
practices which can in turn have higher customer satisfaction, lower defect
rates, and faster development times [76, 87]. Customer satisfaction, it is ar-
gued, is increased when faster development leads to:
– Increasing the number of issues/bugs/enhancements being resolved [75, 51,
17, 6, 44, 90].
– Lowering the issues/bugs/enhancements resolution times [51].
Even more specifically, as to issues related to heroes, Bier et al. warn when
project becomes complicated, it is always better to have a community of ex-
perts rather than having very few hero developers [13]. Willams et al. have
shown that hero programmers are often responsible for poorly documented
software system as they remain more busy in coding rather than writing code
related documents [50]. Also, Wood et al. [108] caution that heroes are often
code-focused but software development needs workers acting as more than just
coders (testers, documentation authors, user-experience analysts).
Our summary of the above is as follows: with only isolated exceptions,
most of the literature deprecates heroes. Yet as discussed in the introduction,
many studies indicate that heroic projects are quite common. This mismatch
between established theory and a widely observed empirical effect prompted
the analysis discussed in this paper.
2.2 Software Quality Metrics
Table 1 offers some context for this research. While this paper product, process,
and personnel metrics for 1000+ projects, most of the papers explore far fewer
projects using a narrower range of metrics. For example, as shown by the
Number of Projects column in Table 1, our sample size (1000+ projects) is
orders of magnitude larger than the typical paper in this arena.
This table was generated as follows. Firstly, using Google Scholar we searched
for “(software heroes) or ((software metrics) and (code quality))”. Secondly,
for papers more than two years old, we pruned “non-influential papers” which
we define has having less than ten citations per year. Thirdly, we read the
papers to determine what kind of metrics they used. When presenting these
results (in Table 1), hero-related publications have a blue background ( bold
text also ) while rows colored in gray denote hero-related publication that offer
no metrics in support of their arguments.Why Software Projects need Heroes (Lessons Learned from 1000+ Projects) 7
Table 1 Some results from Google Scholar query (software heroes) or ((software metrics)
and (code quality)). Hero-related publications have a color background. Rows colored in
gray denote hero-related publication that offer no metrics in support of their arguments.
Uses Uses Uses
#projects
Ref Year cites Product Process Personnel
analyzed
Metrics? Metric? Metrics?
[9] 1996 1994 8 3
[75] 2002 1961 2 3 3
[65] 1993 1268 2 3
[20] 2000 779 1 3
[79] 2006 772 5 3 3
[97] 2002 711 1 3 3
[113] 2007 636 3 3 3
[18] 2006 667 0 3
[81] 2005 622 2 3 3
[112] 2009 466 12 3 3
[61] 2002 466 100 3
[35] 2001 445 1 3
[37] 2001 406 1 3
[25] 2000 400 1 3
[36] 2008 398 4 3
[19] 1999 346 1 3
[59] 2002 305 1 3
[4] 1999 300 3 3
[104] 2007 298 0 3
[95] 2009 271 1 3 3
[73] 2010 256 10 3
[96] 2011 256 17 3 3
[16] 2011 233 2 3 3
[55] 2010 229 38 3
[38] 2004 223 30 3
[84] 2008 223 1 3 3 3
[72] 2008 218 1 3 3 3
[107] 2009 197 1 3 3
[3] 2005 186 SourceForge 3
[15] 2009 177 6 3 3
[14] 1998 172 2 3
[103] 2008 163 3 3 3 3
[11] 2012 163 11 3 3 3
[80] 2014 159 9 3 3
[58] 2006 131 1 3 3
[45] 2015 106 10 3 3
[70] 2012 103 905,470 3
[88] 2008 102 5 3
[92] 2006 99 21 3
[71] 2016 92 3 3 3
[111] 2014 87 1,398 3
[68] 2002 85 39,000 3
[63] 2015 85 0 3 3 3
[69] 2015 76 18 3 3
[76] 2013 68 0 3
[93] 2009 65 1 3 3
[66] 2014 61 GitHub 3
[82] 2010 59 6 3 3
[17] 2013 58 100,000 3 3
[1] 2009 54 1 3 3
[53] 2011 48 2 3 3
[10] 2013 37 3 3 3 3
[108] 2005 36 0
[30] 2010 30 2 3
[12] 2011 27 2 3
[51] 2014 24 2,000 3
[100] 2007 22 4 3
[110] 2016 19 235,000 3 3
[83] 2013 14 1,000 3
[86] 2015 12 1 3 3
[62] 2017 11 10 3 3
[54] 2018 11 15 3 3
[2] 2018 6 832 3
[43] 2017 5 12 3
[13] 2011 3 0
[52] 2018 2 4 3 3
[50] 2002 2 0
[77] 2012 2 0
[89] 2018 0 5 3
[85] 2018 0 1 3 3
[32] 2018 0 2 3
[67] 2018 0 1 3
[102] 2017 0 50 3
[98] 2018 0 0 3 38 Suvodeep Majumder et al.
Table 1 also shows that most papers do not use a wide range of software
metrics. Xenos [109] distinguishes software metrics as follows. Product metrics
are metrics that are directly related to the product itself, such as code state-
ments, delivered executable, manuals, and strive to measure product quality,
or attributes of the product that can be related to product quality. Process
metrics focus on the process of software development and measure process
characteristics, aiming to detect problems or to push forward successful prac-
tices. Lastly, personnel metrics (a.k.a. resource metrics) are those related to
the resources required for software development and their performance. The
capability, experience of each programmer and communication among all the
programmers are related to product quality [106, 33, 27, 26]. In our work:
– Code interaction graph is a process metric;
– Social interaction graph is a personnel metric;
– Defect counts are product metrics.
(Aside: In this text we have used “resource” and “peronnel” interchangeably
since, according to Center for Systems and Software Engineering, [109] re-
source metrics relating to programmer quality or communication related met-
rics are also called personnel metrics.)
This paper explores all three
kinds of metrics and applies the
combination to exploring the ef-
fects of heroism on software devel-
opment. There are many previous
studies that explore one or two of
these types of metrics. Fig 2 sum-
marizes Table 1 and shows that,
in that sample, very few papers
in software metrics and code qual-
ity combine insights from product
and process and personnel met-
rics. To the best of our knowledge,
this is the first paper in this arena
to discuss heroism using product
and process and personnel met-
rics. Fig. 2 Summary of Table 1
Having worked with that data,
we think we know why other pub-
lications do not report results using a wide range of metrics. Such reports
require extensive and elaborate queries. The analysis of this paper required
months of struggling with the GitHub API (and its queries/hour limits), fol-
lowed by much scripting, followed by many tedious manual checks that our
automatic tools were behaving sensibly. In all, we estimate that this paper
required nine weeks of coding (40 hours per week) to join across process and
product and personnel metrics.Why Software Projects need Heroes (Lessons Learned from 1000+ Projects) 9
2.3 Herbsleb Hypothesis (and Analogs)
One way to view this paper is as a check of the Hersleb hypothesis [47]. At his
ICSE’14 keynote, James Hersleb defined coding to be a socio-technical process
where code and humans interact. According to the Hersleb hypothesis [47], the
following anti-pattern is a strong predictor for defects:
– If two code sections communicate...
– But the programmers of those two sections do not...
– Then that code section is more likely to be buggy.
To say that another way:
Coding is a social process and better code arises from better social in-
teractions.
Many other researchers offer conclusions analogous to the Herbsleb hypoth-
esis. Developer communication/interaction is often cited as one of the most
important factor for a successful software development [28, 60, 46]. Many re-
searchers have shown that successful communication between developers and
adequate knowledge about the system plays a key role in successful software
development [99, 41, 64]. As reported as early as 1975 in Brooks et al. text “The
Mythical Man Month” [23], communication failure can lead to coordination
problem, lack of system knowledge in the projects as discussed by Brooks et
al. in the Mythical Man-Month.
The usual response to the above argument is to improve communication
by “smoothing it out”, i.e. by deprecating heroes since, it is argued, that en-
courages more communication across an entire project [13, 18, 50, 77, 108]. The
premise of “smoothing it out” is that heroes are bad and should be depre-
cated. This paper tries to verify whether or not this premise holds true for
open source GitHub projects or not.
3 Methodology
3.1 Data Collection
Figure 3 summarizes the Github data we used for this study. To understand
this figure, we offer the following definitions:
– Release: (based on Git tags) mark a specific point in the repository’s his-
tory. Number of releases defines different versions published, which signifies
considerable amount of changes done between each version.
– Duration: length of project from its inception to current date or project
archive date. It signifies how long a project has been running and in active
development phase.
– Stars: signifies number of people liking a project or use them as bookmarks
so they can follow what’s going on with the project later.10 Suvodeep Majumder et al.
Fig. 3 Distribution of projects depending on Number of Releases, Duration of Project,
Number of Stars, Forks. Watchers and Developers. Box plots show the min to max range.
Central boxes show the 25th, 50th, 75th percentiles.
– Forks: A fork is a copy of a repository. Forking a repository allows user to
freely experiment with changes without affecting the original project. This
signifies how people are interested in the repository and actively thinking
of modification of the original version.
– Watcher: Watchers are GitHub users who have asked to be notified of ac-
tivity in a repository, but have not become collaborators. This is a represen-
tative of people actively monitoring projects, because of possible interest
or dependency.
– Developer: Developers are the contributors to a project, who work on some
code, and submit the code using commit to the codebase. The number of
developers signifies the interest of developers in actively participating in
the project and volume of the work.
Figure 4 shows that the projects we chose for our experiment comprise
different languages. Note that we did not use all the data in Github. GitHub
has over 100 million repositories as of May, 2019 so we only use data from
the “GitHub showcase project” list. Many of these projects contain very short
development cycles; are used for personal use; and are not be related to soft-
ware development. Such projects may bias research findings. To mitigate that,
we filter out projects using the standard “sanity checks” recommended in the
literature [56, 78]:
– Collaboration: refers to the number of pull requests. This is indicative of
how many other peripheral developers work on this project. We required
all projects to have at least one pull request.
– Commits: The project must contain more than 20 commits.
– Duration: The project must contain software development activity of at
least 50 weeks.
– Issues: The project must contain more than 10 issues.
– Personal Purpose: The project must not be used and maintained by one
person. The project must have at least eight contributors.
– Software Development: The project must only be a placeholder for software
development source code.Why Software Projects need Heroes (Lessons Learned from 1000+ Projects) 11
Language Projects
Shell 416
JavaScript 396
HTML 344
CSS 314
Python 291
Makefile 229
Ruby 216
C 167
Java 150
PHP 146
C++ 126
Batchfile 81
Perl 67
Objective-C 67
Dockerfile 54
CMake 48
M4 43
CoffeeScript 38
Roff 35
Roff 35
C-Sharp 34
Emacs Lisp 30
Gherkin 26
Perl 6 21
Fig. 4 Distribution of projects depending on languages. Many projects use combinations
of languages to achieve their results. Here, we show majority language used in the project.
– Project Documentation Followed : The projects should follow proper doc-
umentation standard to log proper commit comment and issue events to
allow commit issue linkage.
– Social network validation: The Social Network that is being built should
have at least 8 connected nodes in both the communication and code in-
teraction graph (this point is discussed further in 3.2.2 and 3.2.3).
For each of the selected projects, the study recreates all the committed files
to identify code changes in each commit file and identifies developers using
the GitHub API, then downloads issue comments and events for a particular
project, and uses the git log command to mine the git commits added to
the project throughout the project lifetime. Using the information from each
commit message, this study uses keyword based identifier [94, 49, 101] to label
commits as buggy commit or not by identifying commits which were used to
fix some bugs in the code and then identifies the last commit which introduced
the bug. This commit is labeled as buggy commit.12 Suvodeep Majumder et al. 3.2 Metric Extraction 3.2.1 Process Metrics Recall that the developer code interaction graph records who touched what and whose code, where a developer is defined as a person who has ever committed any code into the codebase. We create that graph as follows: – Project commits were extracted from each branch in the git history. – Commits are extracted from the git log and stored in a file system. – To access the file changes in each commit we recreate the files that were modified in each commit by (a) continuously moving the git head chrono- logically on each branch. Changes were then identified using git diff on two consecutive git commits. – The graph is created by going through each commit and adding a node for the committer. Then we use git blame on the lines changed to find previous commits following a similar process of SZZ algorithm [105]. We identify all the developers of the commits from git blame and add them as a node as well. – After the nodes are created, directed edges were drawn between the devel- oper who changed the code, to whose code was changed. Those edges were weighted by the change size between the developers. 3.2.2 Personnel Metrics Recall that the developer social interaction graph records who talked to each other via issue comments. We create that graph as follows. – A node is created for the person who has created the issue, then another set of nodes are created for each person who has commented on the issue. So essentially in Social interaction graph each node in the graph is any person (developer or non-developer) ever created an issue or commented on an issue. – The nodes are connected by directed edges, which are created by (a) con- necting from the person who has created the issue to all the persons who have commented in that issue and (b) creating edges from the person com- menting on the issue to all other persons who have commented on the issue, including the person who has created the issue. – The edges are weighted by the number of comments by that person. – The weights are updated using the entire history of the projects. The cre- ation and weight update is similar to Figure 5. 3.2.3 Product Metrics This study explores the effects of social and code communication to assess code quality, by measuring the percentage of buggy commits introduced by
Why Software Projects need Heroes (Lessons Learned from 1000+ Projects)                            13

                                                                  1
                     Ananya         Maria               Ananya            Maria

                                                                  1
                                                         1

                       David        Chen                 David            Chen

                                                    1
                                    Ananya           Maria
                                                  1
                                                   1
                                        1     1 111 1    1
                                                    1
                                        David           Chen
                                                    1
                                    1                                                  1
             Vadim       Ananya     1       Maria            Vadim 1 1      Ananya     1   Maria
                                   11                                                 11
                                   1  1         1                     1               1  1    1
                          1    1   1                                         2    2   1

                          David 1
                                1           Chen                             David 1
                                                                                   1       Chen

Fig. 5 Example of creating a social interaction graph between four GitHub de-
velopers. Step 1 (LHS): Ananya,Maria,Chen and David are four developers in a GitHub
project. Step 2: Ananya creates one issue where Maria,Chen and David comment. So, we
join Ananya-Maria,Ananya-Chen,Ananya-David with edge of weight 1. Step 3: A new de-
veloper Vadim comes. Step 4 (RHS): Vadim creates one new issue where Ananya and
David comments. So, two new edges are introduced - (Ananya-Vadim(1), David-Vadim(1)).
Now we iterate for each developer, so all of them become connected and lastly, weight of
Ananya-David increases to 2.

developers (hero and non-hero developers), but in order to do so we do need
to identify the commits that introduced the bug in the code from the historic
project data. This is a challenging task since there is no direct way to find
the commits or the person who is responsible for the bug/issue introduction.
Hence, our scripts proceed as follows:
 – Starting with all the commits from git log, we identify the commit mes-
   sages.
 – Next, to use the commit messages for labeling, we apply natural language
   processing [49, 94] (to do stemming, lemmatization and lowercase conver-
   sion to normalize the commit messages).
 – Then to identify commit messages which are representation of bug/issue
   fixing commits, a list of words and phrases is extracted from previous stud-
   ies of 1000+ projects (Open Source and Enterprise). The system checked
   for these words and phrases in the commit messages and if found, it marks
   these as commits which fixed some bugs.
 – To perform sanity check, 5% of the commits was manually verified by 7
   graduate students using random sampling from different projects. Disagree-
   ments between manual labeling and keyword based labeling was further
   verified and keywords were added or removed to improve performance.
14 Suvodeep Majumder et al.
– These labeled commits were then processed to extract the file changes as
the process mentioned in process metrics section 3.2.1.
– Finally, git blame is used to go back in the git history to identify a re-
sponsible commit where each line was created or changed last time.
By this process, commits that were responsible for introduction of the bugs in
the system/project can be found. We label these commits as “buggy commits”
and label the author of the commit as the “person responsible” for introducing
the bug.
3.2.4 Final Feature Extraction
To assess the prevalence of heroes in the software projects, we joined across all
the metrics shown above. Specifically, using the two graphs, we calculated the
node degree (number of edges touching a vertex) of the graphs (and note that
vertices with higher degree represent more communication or interaction).
For the sake of completeness, we varied our threshold of “hero” to someone
belonging to 80%, 85%, 90% and 95% of the communication. In our studies,top
contributors (or heroes) and non-heroes were defined as :
n
X
Node Degree of Ni = D(Ni ) = aij (1)
j=1
P
Hero = Rank (D(Ni )) > ∗ (N + 1) (2)
100
P
Non-Hero = Rank (D(Ni )) < ∗ (N + 1) (3)
100
where:
N Number of Developers
P 80,85,90 and 95 Percentile
The percentile rank of a score is the percentage
Rank() of scores in its frequency distribution that is
equal to or lower than it.
Adjacency matrix for the graph
a
where aij > 0 denotes a connection
Using these data and by applying the hero definition from formula (2) and
(3) (look at the top 20%,15%,10% and 5%), we can find the developers who are
responsible for 80%,85%,90% and 95% of the work. We use this to categorize
the developers into 2 groups:
– The hero developers; i.e. the core group of the developers of a certain
project who make regular changes in the codebase. In this study this is
represented by the developers whose node degree is above 80,85,90 and
95th percentile of the node degree (developers’ communication and code
interaction of the system graph).Why Software Projects need Heroes (Lessons Learned from 1000+ Projects) 15
– The non-hero developers are all other developers; i.e. developers associated
with nodes with a degree below the respective threshold percentile.
Following this for each selected projects, we merge the product data col-
lected in section 3.2.3 and section 3.2.1 to find each developer’s code contri-
bution according to the code interaction graph. Similarly process is followed
for section 3.2.2 and section 3.2.1 in the social interaction graph. Using the
above mentioned data, we can validate the code and social contribution of each
developer along with their bug introduction percentage. This information will
help us to answer the research questions asked in this study.
4 Results
Our results are structured around three research questions:
RQ1: How common are hero projects?
RQ2: What impact does heroism have on code quality?
RQ3: Does the results support Herbsleb Hypothesis?
RQ1: How common are hero projects?
Figure 6 shows the result for number of projects marked as hero and non-hero
when the we vary the threshold from “hero-ness” from 80 to 95%.The clear
conclusion from this figure is that the phenomenon that we have defined as
“hero“ is very common. In fact, the phenomenon may be more pronounced
than previously reported. Even when we require heroes to be involved in 95%
of the communication (which is a large amount), we find that that majority
of the projects studied here exhibit “hero-ness”. That is:
Result: Hero projects are overwhelmingly present in open source software
community. That is, in the usual case, there are very few people in each
project responsible for majority of the work.
RQ2: What impact does heroism have on code quality?
RQ2 explores effect heroism have on code quality. In this study, we created
the developer social interaction graph and developer code interaction graph,
then identified the developer responsible for introducing those bugs into the
codebase. Then we find the percentage of buggy commits introduced by those
developers by checking (a) the number of buggy commits introduced by those
developers and (b) their number of total commits.
Fig 7 and Fig 8 shows the comparison between the performance of hero
and non-hero developers. In those figures:
– The x-axis is different projects used in this study.16 Suvodeep Majumder et al.
Fig. 6 RQ1 Result: Distribution of hero projects vs non-hero projects based on hero thresh-
old being 80%, 85%, 90% and 95% respectively. Here threshold being 80% means in that
project 80% code is done by less than 20% of developers
– The y-axis represents the median of the bug introduction percentage for
all hero and non-hero developers for each project respectively.
Here projects are sorted by the number of non-hero developers. In those
charts we note that:
– There exists a large number of non-heroes who always produce buggy com-
mits, 100% of the time (evidence: the flat right-hand-side regions of the
non-hero plots in both figures). That population size of “always buggy” is
around a third in Fig 7 and a fourth in Fig 8.
– To say the least, heroes nearly always have fewer buggy commits than
non-heroes. The 25th, 50th, 75th percentiles for both groups are shown in
Table 2. This table clearly shows why heroes are so prevalent, they generate
commits that are dramatically less buggy than non-heroes, regardless of the
size of the project.
Table 2 The table summarizes of Fig 7, Fig 8 and stratifies the data according to 25th,
50th and 75th percentile of the developers.
Percentile
Metric Group 25th 50th 75th
Hero 0.52 0.58 0.53
Code Interaction Non-Hero 0.67 0.75 1.0
Ratio 1.3 1.3 1.9
Hero 0.44 0.5 0.5
Social Interaction Non-Hero 0.67 0.75 0.67
Ratio 1.5 1.5 1.3Why Software Projects need Heroes (Lessons Learned from 1000+ Projects) 17
Fig. 7 Code interaction graph results for RQ2: Percentage of bugs introduced by hero and
non-hero developers from developer code interaction perspective in Hero Projects .
The other thing to note from Fig 7 and Fig 8 is that they are nearly iden-
tical. That is, no matter how we define “hero”, we reach the same conclusions.
Hence we say -
Result: In modern software projects, reflecting on who writes most of
the code is just as insightful as reflecting on who participates in most of
the discussion about the code.18 Suvodeep Majumder et al. Fig. 8 Social interaction graph results for RQ2: Percentage of bugs introduced by hero and non-hero developers from developer social interaction perspective in Hero Projects. RQ3: Do the results support Herbsleb Hypothesis? In this research question, we explored the Herbsleb hypothesis [47] from sec- tion 2; i.e. does lack of communication between developers predict for bugs in the code? In order to do that for 1,037 projects, we discretized the developers into 3 groups (i.e. High, Medium and Low) based on their code contribution (Code Node Degree) and social communication frequency (Social Node De- gree). In Table 3, group HH (High,High) represents the developers who have
Why Software Projects need Heroes (Lessons Learned from 1000+ Projects)                   19

high high code contribution and social communication frequency and the value
in the cell is median bug introduction percentage, while group LL (Low,Low)
represents the developers who have low code contribution and low social com-
munication frequency.

       rank    group (code,social)    median     IQR
       1              L,H                 30       29            s
       1              M,H                 38       28                s
       2              L,M                 38       31                s
       2              H,H                 42       18                 s
       2              M,M                 46       21                  s
       2              H,M                 46       21                  s
       2              H,L                 48       30                   s
       3              M,L                 52       29                    s
       4              L,L                 67       55                        s
Table 3 This figure shows the result of statistical significance test and an effect size test
on 9 different groups used to study the Herbsleb hypothesis. In this figure the “group”
column represents the 9 different groups in this research question, where the first character
represents the code node degree, while the later is social node degree.

   Table 3 shows the result of statistical test performed on the 9 different
groups representing different frequency and volume of communication. The
“rank” column of that table shows a statistical analysis where one row has a
higher rank than the previous one only if the two rows are
 – Statistically significant different. For this test, we used the the Scott-Knot
   method recommended by Angelis and Mittas at TSE’13 [74].
 – And that difference is not a small effect. For this effect size test, we used
   the the A12 test recommended by Angelis and Briand at ICSE’11 [5]
These statistical tests were selected since they were non-parametric; i.e. they
do not assume normal distributions.
   To summarize the effect reported in Table 3, we need to look at the differ-
ence between the highest and lowest ranks:
 – In the groups with highest defects and highest rank, the social and cod-
   ing groups are both low. That, is non-hero-ness (for both code and social
   interaction) is associated with worst quality code.
 – In the groups with lowest defects and lowest rank, the social group is always
   high while the code groups are either low or medium. That is, extensive
   social interaction even with low to medium code interaction is associated
   with best quality code.
From the above, we can say that:
 – Prior definitions of “hero” based just on code interaction need now to be
   augmented. As shown in Table 3, social hero-ness is much more predictive
   for bugs than merely reflecting on code hero-ness
 – Also, these results support the Herbsleb hypothesis, which suggests com-
   munication between developers is an important factor and lesser social
   communication can lead to more bugs.
20 Suvodeep Majumder et al.
This finding leads to the following conjecture (to be explored in future
work): the best way to reduce communication overhead and to decrease defects
is to centralize the communicators. In our data, commits with lower defects
come from the small number of hero developers who have learned how to talk
to more people. Hence, we would encourage more research into better methods
for rapid, high-volume, communication in a one-to-many setting (where the
“one” is the hero and the “many” are everyone else). In summary, we can say
Result: The Herbsleb hypothesis holds true for open source software
projects. More research should be performed to find better methods for
rapid, high-volume, communication in a one-to-many setting.
5 Discussion
One strange feature of our results is that what is old is now new. Our results
(that heroes are important) echo a decades old concept. In 1975, Fred Brooks
wrote of “surgical teams” and the “chief programmer” [22]. He argued that:
– Much as a surgical team during surgery is led by one surgeon performing
the most critical work, while directing the team to assist with less critical
parts.
– Similarly, software projects should be led by one “chief programmer” to
develop critical system components while the rest of a team provides what
is needed at the right time.
Brooks conjecture that “good” programmers are generally much more as pro-
ductive as mediocre ones. This can be seen in the results that hero program-
mers are much more productive and less likely to introduce bugs into the code-
base. Heroes are born when developers become are so skilled at what they do,
that they assume a central position in a project. In our view, organizations
need to acknowledge their dependency on such heroes, perhaps altering their
human resource policies and manage these people more efficiently by retaining
them.
6 Threats to Validity
6.1 Sampling Bias
Our conclusions are based on 1000+ open source GitHub projects that started
this analysis. It is possible that different initial projects would have lead to
different conclusions. That said, our initial sample is very large so we have
some confidence that this sample represents an interesting range of projects.Why Software Projects need Heroes (Lessons Learned from 1000+ Projects) 21
6.2 Evaluation Bias
In RQ1,RQ2 and RQ3, we said that heroes are prevalent and responsible for
far less bug introduction than non-hero developers. It is possible that, using
other metrics2 then there may well be a difference in these different kinds of
projects. But measuring people resources only by how fast releases are done
or issues are fixed may not be a good indicator of measuring affects of having
heroes in team. This is a matter that needs to be explored in future research.
Another evaluation bias as we report cumulative statistics of lift curves
where other papers reported precision and recall. The research in this field is
not mature enough yet for us to say that the best way to represent results is
one way versus another. Here we decided to use lift curves since, if we d used
precision and recall, we had to repeat that analysis at multiple points of the
lift curve. We find our current lift curves are a succinct way to represent our
results.
6.3 Construct Validity
At various places in this report, we made engineering decisions about (e.g.)
team size; and (e.g.) what constitutes a “hero” project. While those decisions
were made using advice from the literature (e.g. [40]), we acknowledge that
other constructs might lead to different conclusions.
That said, while we cannot prove that all of our constructs are in any
sense “optimum”, the results of Table 3 suggest that our new definition of
social hero-ness can be more informative than constructs used previously in
the literature (that defined “hero” only in terms of code interaction).
Another issue about our construct validity is that we have relied on a
natural language processor to analyze commit messages to mark them as buggy
commits. These commit messages are created by the developers and may or
may not contain proper indication of if they were used to fix some bugs. There
is also a possibility that the team of that project might be using different
syntax to enter in commit messages.
Yet another threat to construct validity is that we did not consider the
different roles of the developers. We had trouble extracting that information
from our data source, we found that people have multiple roles particularly our
heroes who would often step in and assist in multiple activities. Nevertheless
the exploration of different roles would be an interesting study.
6.4 External Validity
Previously Agrawal et al. were able to comment on the effects of hereos in open
and closed source projects. That research group was fortunate enough to work
on-site at a large open source software company. We were not as fortunate as
2 E.g. do heroes reduce productivity by becoming bottleneck22 Suvodeep Majumder et al.
them. We therefore acknowledge our findings (from open source projects) may
not be the same for closed source projects.
Similarly we have used GitHub issues and comments to create the commu-
nication graph, It is possible that the communication was not made using these
online forums and was done with some other medium. To reduce the impact
of this problem, we did take precautionary step to (e.g.,) include various tag
identifiers of bug fixing commits, did some spot check on projects regarding
communication etc.
Our conclusion shows that almost all (when experimenting with 80%, 85%,
90% threshold) of our sample projects are hero dominated. In case of large size
public GitHub projects, there are official administrators and maintainers who
are responsible for issue labelling or assigning. So, they frequently comment
on all of the issues but though they are not active developers. These people
should not be considered as hero developers. Finding these people needs man-
ual inspection which is not possible for 1000+ projects. We decide to put it as
a limitation of our study as we deal with a huge number of projects.
We do not isolate hero projects and non-hero projects and look into them
separately because there are very few non-hero projects and also there are a
lot of developers who work in a large number of projects (some of them are
hero projects and some of them are not).
7 Conclusion
The established wisdom in the literature is to depreciate “heroes”, i.e., a small
percentage of the staff who are responsible for most of the progress on a project.
But, based on a study of 1000+ open source GitHub projects, we assert:
– Overwhelmingly, most projects are hero projects.
– Hero developers are far less likely to introduce bugs into the codebase than
their non-hero counterparts. Thus having heroes in projects significantly
affects the code quality.
Our empirical results call for a revision of a long-held truism in software en-
gineering. Software heroes are far more common and valuable than suggested
by the literature, particularly from code quality perspective. Organizations
should reflect on better ways to find and retain more of these software heroes.
More generally, we would comment that it is time to reflect more on long-
held truisms in our field. Heroes are widely deprecated in the literature, yet
empirically they are quite beneficial. What other statements in the literature
need to be reviewed and revised?
8 Acknowledgements
This work was partially funded by NSF Grant #1908762.Why Software Projects need Heroes (Lessons Learned from 1000+ Projects) 23
References
1. Roberto Abreu and Rahul Premraj. How developer communication frequency relates to
bug introducing changes. In Proceedings of the Joint International and Annual ERCIM
Workshops on Principles of Software Evolution (IWPSE) and Software Evolution
(Evol) Workshops, IWPSE-Evol ’09, pages 153–158, New York, NY, USA, 2009. ACM.
2. Amritanshu Agrawal, Akond Rahman, Rahul Krishna, Alexander Sobran, and Tim
Menzies. We don’t need another hero? Proceedings of the 40th International Con-
ference on Software Engineering Software Engineering in Practice - ICSE-SEIP ’18,
2018.
3. and, S. Christley, and G. Madey. A topological analysis of the open souce software
development community. In Proceedings of the 38th Annual Hawaii International
Conference on System Sciences, pages 198a–198a, Jan 2005.
4. and and. An empirical study on object-oriented metrics. In Proceedings Sixth Inter-
national Software Metrics Symposium (Cat. No.PR00403), pages 242–249, Nov 1999.
5. A. Arcuri and L. Briand. A practical guide for using statistical tests to assess random-
ized algorithms in software engineering. In ICSE’11, pages 1–10, 2011.
6. Dimitrios Athanasiou, Ariadi Nugroho, Joost Visser, and Andy Zaidman. Test code
quality and its relation to issue handling performance. IEEE Transactions on Software
Engineering, 40(11):1100–1125, 2014.
7. L. Augustin, D. Bressler, and G. Smith. Accelerating software development through
collaboration. In Proceedings of the 24th International Conference on Software Engi-
neering. ICSE 2002, pages 559–563, May 2002.
8. James Bach. Enough about process: what we need are heroes. IEEE Software,
12(2):96–98, 1995.
9. V. R. Basili, L. C. Briand, and W. L. Melo. A validation of object-oriented design
metrics as quality indicators. IEEE Transactions on Software Engineering, 22(10):751–
761, Oct 1996.
10. Robert M. Bell, Thomas J. Ostrand, and Elaine J. Weyuker. The limited impact of in-
dividual developer data on software defect prediction. Empirical Software Engineering,
18(3):478–505, Jun 2013.
11. Pamela Bhattacharya, Marios Iliofotou, Iulian Neamtiu, and Michalis Faloutsos.
Graph-based analysis and prediction for software evolution. In Proceedings of the
34th International Conference on Software Engineering, ICSE ’12, pages 419–429,
Piscataway, NJ, USA, 2012. IEEE Press.
12. Serdar Biçer, Ayşe Başar Bener, and Bora Çağlayan. Defect prediction using social
network analysis on issue repositories. In Proceedings of the 2011 International Con-
ference on Software and Systems Process, ICSSP ’11, pages 63–71, New York, NY,
USA, 2011. ACM.
13. Norman Bier, Marsha Lovett, and Robert Seacord. An online learning approach to
information systems security education. In Proceedings of the 15th Colloquium for
Information Systems Security Education, 2011.
14. A. B. Binkley and S. R. Schach. Validation of the coupling dependency metric as a
predictor of run-time failures and maintenance measures. In Proceedings of the 20th
International Conference on Software Engineering, pages 452–455, April 1998.
15. C. Bird, N. Nagappan, H. Gall, B. Murphy, and P. Devanbu. Putting it all together:
Using socio-technical networks to predict failures. In 2009 20th International Sympo-
sium on Software Reliability Engineering, pages 109–119, Nov 2009.
16. Christian Bird, Nachiappan Nagappan, Brendan Murphy, Harald Gall, and Premkumar
Devanbu. Don’t touch my code!: Examining the effects of ownership on software
quality. In Proceedings of the 19th ACM SIGSOFT Symposium and the 13th European
Conference on Foundations of Software Engineering, ESEC/FSE ’11, pages 4–14, New
York, NY, USA, 2011. ACM.
17. Tegawendé F Bissyandé, David Lo, Lingxiao Jiang, Laurent Réveillere, Jacques Klein,
and Yves Le Traon. Got issues? who cares about it? a large scale investigation of issue
trackers from github. In Software Reliability Engineering (ISSRE), 2013 IEEE 24th
International Symposium on, pages 188–197. IEEE, 2013.24 Suvodeep Majumder et al.
18. Barry Boehm. A view of 20th and 21st century software engineering. In Proceedings of
the 28th international conference on Software engineering, pages 12–29. ACM, 2006.
19. L. C. Briand, J. Wust, S. V. Ikonomovski, and H. Lounis. Investigating quality factors
in object-oriented designs: an industrial case study. In Proceedings of the 1999 In-
ternational Conference on Software Engineering (IEEE Cat. No.99CB37002), pages
345–354, May 1999.
20. Lionel C. Briand, Jürgen Wüst, John W. Daly, and D. Victor Porter. Exploring the
relationships between design measures and software quality in object-oriented systems.
Journal of Systems and Software, 51(3):245 – 273, 2000.
21. Fred P. Brooks, Jr. The mythical man-month. SIGPLAN Not., 10(6):193–, April 1975.
22. Frederick P Brooks. The mythical man-month. Datamation, 20(12):44–52, 1974.
23. Frederick P Brooks Jr. The Mythical Man-Month: Essays on Software Engineering,
Anniversary Edition, 2/E. Pearson Education India, 1995.
24. Andrea Capiluppi, Jesus M Gonzalez Barahona, and Israel Herraiz. Adapting the
“staged model for software evolution” to floss. 2007.
25. Michelle Cartwright and Martin Shepperd. An empirical investigation of an object-
oriented software system. Software Engineering, IEEE Transactions on, 26:786 – 796,
09 2000.
26. Marcelo Cataldo, Matthew Bass, James D Herbsleb, and Len Bass. On coordination
mechanisms in global software development. In International Conference on Global
Software Engineering (ICGSE 2007), pages 71–80. IEEE, 2007.
27. Marcelo Cataldo and James D Herbsleb. Coordination breakdowns and their impact
on development productivity and software failures. IEEE Transactions on Software
Engineering, 39(3):343–360, 2013.
28. A. Cockburn and J. Highsmith. Agile software development, the people factor. Com-
puter, 34(11):131–133, Nov 2001.
29. Alistair Cockburn. Agile software development: the cooperative game. Pearson Edu-
cation, 2006.
30. Giulio Concas, Michele Marchesi, Alessandro Murgia, and Roberto Tonelli. An em-
pirical study of social networks metrics in object-oriented software. Adv. Soft. Eng.,
2010:4:1–4:21, January 2010.
31. Valerio Cosentino, Javier L Cánovas Izquierdo, and Jordi Cabot. A systematic mapping
study of software development with github. IEEE Access, 5:7173–7192, 2017.
32. Sarah Dahab, Erika Fernanda Silva Balocchi, Stephane Maag, Ana Rosa Cavalli, and
Wissam Mallouli. Enhancing software development process quality based on metrics
correlation and suggestion. In ICSOFT 2018: 13th International Conference on Soft-
ware Technologies, pages 120–131. Scitepress, 2018.
33. Cleidson RB de Souza, David Redmiles, Li-Te Cheng, David Millen, and John Patter-
son. Sometimes you need to see through walls: a field study of application programming
interfaces. In Proceedings of the 2004 ACM conference on Computer supported coop-
erative work, pages 63–71. ACM, 2004.
34. Luiz Felipe Dias, Igor Steinmacher, Gustavo Pinto, Daniel Alencar da Costa, and
Marco Gerosa. How does the shift to github impact project collaboration? In Software
Maintenance and Evolution (ICSME), 2016 IEEE International Conference on, pages
473–477. IEEE, 2016.
35. K. El Emam, S. Benlarbi, N. Goel, and S. N. Rai. The confounding effect of class size on
the validity of object-oriented metrics. IEEE Transactions on Software Engineering,
27(7):630–650, July 2001.
36. Karim O. Elish and Mahmoud O. Elish. Predicting defect-prone software modules
using support vector machines. Journal of Systems and Software, 81(5):649 – 660,
2008. Software Process and Product Measurement.
37. Khaled El Emam, Walcelio Melo, and Javam C. Machado. The prediction of faulty
classes using object-oriented design metrics. Journal of Systems and Software, 56(1):63
– 75, 2001.
38. Norman Fenton, Martin Neil, William Marsh, Peter Hearty, David Marquez, Paul
Krause, and Rajat Mishra. Predicting software defects in varying development lifecy-
cles using bayesian nets. Information and Software Technology, 49(1):32 – 43, 2007.
Most Cited Journal Articles in Software Engineering - 2000.Why Software Projects need Heroes (Lessons Learned from 1000+ Projects) 25
39. Brian Fitzgerald and David L Parnas. Making free/open-source software (f/oss) work
better. In Proceedings do Workshop da Conferência XP2003, Genova. Citeseer, 2003.
40. Aakash Gautam, Saket Vishwasrao, and Francisco Servant. An empirical study of
activity, popularity, size, testing, and stability in continuous integration. In Proceedings
of the 14th International Conference on Mining Software Repositories, pages 495–498.
IEEE Press, 2017.
41. T Girba, A Kuhn, M Seeberger, and Stéphane Ducasse. How developers drive software
evolution. volume 2005, pages 113– 122, 10 2005.
42. Rebecca E Grinter, James D Herbsleb, and Dewayne E Perry. The geography of
coordination: Dealing with distance in r&d work. In Proceedings of the international
ACM SIGGROUP conference on Supporting group work, pages 306–315. ACM, 1999.
43. Dharmendra Lal Gupta and Kavita Saxena. Software bug prediction using object-
oriented metrics. Sādhanā, 42(5):655–669, May 2017.
44. Monika Gupta, Ashish Sureka, and Srinivas Padmanabhuni. Process mining multiple
repositories for software defect resolution from control and organizational perspective.
In Proceedings of the 11th Working Conference on Mining Software Repositories, pages
122–131. ACM, 2014.
45. Peng He, Bing Li, Xiao Liu, Jun Chen, and Yutao Ma. An empirical study on software
defect prediction with a simplified metric set. Information and Software Technology,
59:170 – 190, 2015.
46. J. D. Herbsleb and A. Mockus. An empirical study of speed and communication in
globally distributed software development. IEEE Transactions on Software Engineer-
ing, 29(6):481–494, June 2003.
47. James Herbsleb. Socio-technical coordination (keynote). In Companion Proceedings of
the 36th International Conference on Software Engineering, ICSE Companion 2014,
pages 1–1, New York, NY, USA, 2014. ACM.
48. James D Herbsleb and Rebecca E Grinter. Splitting the organization and integrating
the code: Conway’s law revisited. In Proceedings of the 1999 International Conference
on Software Engineering (IEEE Cat. No. 99CB37002), pages 85–95. IEEE, 1999.
49. Abram Hindle, Daniel M German, and Ric Holt. What do large commits tell us?: a
taxonomical study of large commits. In Proceedings of the 2008 international working
conference on Mining software repositories, pages 99–108. ACM, 2008.
50. Gregory W Hislop, Michael J Lutz, J Fernando Naveda, W Michael McCracken,
Nancy R Mead, and Laurie A Williams. Integrating agile practices into software
engineering courses. Computer science education, 12(3):169–185, 2002.
51. Oskar Jarczyk, Blażej Gruszka, Szymon Jaroszewicz, Leszek Bukowski, and Adam
Wierzbicki. Github projects. quality analysis of open-source software. In International
Conference on Social Informatics, pages 80–94. Springer, 2014.
52. R. Jayanthi and Lilly Florence. Software defect prediction techniques using metrics
based on neural network classifier. Cluster Computing, Feb 2018.
53. Andrejs Jermakovics, Alberto Sillitti, and Giancarlo Succi. Mining and visualizing de-
veloper networks from version control systems. In Proceedings of the 4th International
Workshop on Cooperative and Human Aspects of Software Engineering, CHASE ’11,
pages 24–31, New York, NY, USA, 2011. ACM.
54. Jirayus Jiarpakdee, Chakkrit Tantithamthavorn, and Ahmed E. Hassan. The impact
of correlated metrics on defect models, 2018.
55. Marian Jureczko and Lech Madeyski. Towards identifying software project clusters
with regard to defect prediction. In Proceedings of the 6th International Conference
on Predictive Models in Software Engineering, PROMISE ’10, pages 9:1–9:10, New
York, NY, USA, 2010. ACM.
56. Eirini Kalliamvakou, Georgios Gousios, Kelly Blincoe, Leif Singer, Daniel M. German,
and Daniela Damian. The promises and perils of mining github. In Proceedings of the
11th Working Conference on Mining Software Repositories, MSR 2014, pages 92–101,
New York, NY, USA, 2014. ACM.
57. Chris F Kemerer and Mark C Paulk. The impact of design and code reviews on
software quality: An empirical study based on psp data. IEEE transactions on software
engineering, 35(4):534–550, 2009.You can also read