Sustainable development in Tasmania: is the proposed pulp mill sustainable? - Tasmanian Round Table for Sustainable Industries Project - Prepared ...
←
→
Page content transcription
If your browser does not render page correctly, please read the page content below
Tasmanian Round Table for
       Sustainable Industries Project

Sustainable development in Tasmania:
 is the proposed pulp mill sustainable?

               Prepared by
      Launceston Environment Centre
                 August 2007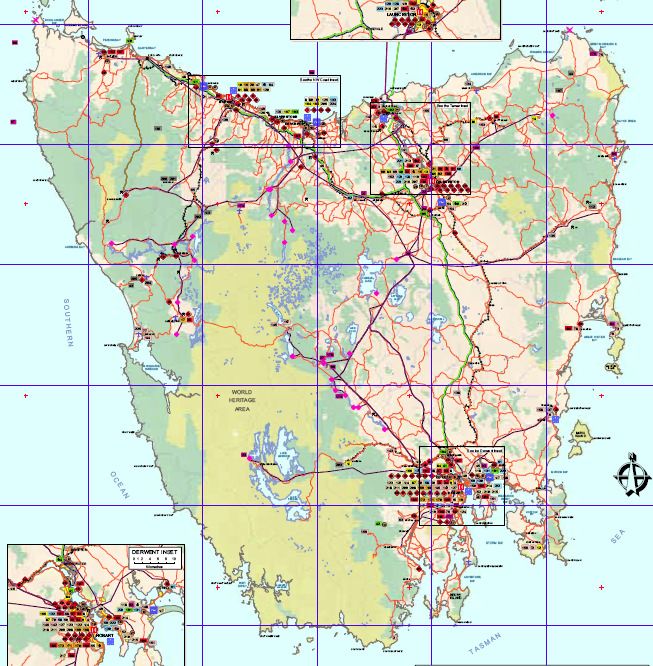
Tasmanian Round Table for
  Sustainable Industries Project

  Sustainable Development in Tasmania:
  is the proposed pulp mill sustainable?
  August 2007

  Launceston Environment Centre
  72 Tamar St
  Launceston, Tasmania

  (61) 3 63318406
  info@lec.org.au

  www.lec.org.au

DISCLAIMER: This information is provided as a contribution to the current public debate on
Tasmania’s future, specifically the sustainability of its various development options. Sources are
provided, and personal enquiries should be made to verify all facts. If you wish to call attention to any
inaccuracies in this report please contact the LEC. This document is intended to inform policy makers,
not as the basis for investment decisions.
                                                                                                     2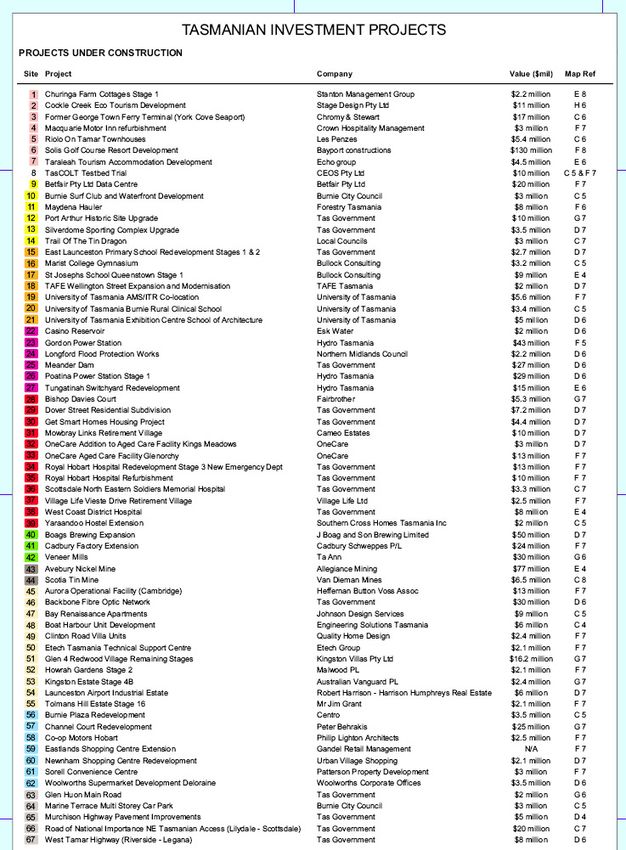
Executive Summary
The Tasmanian Roundtable for Sustainable Industries Project (TRSIP) is an
initiative coordinated by the Launceston Environment Centre. The project
commenced in April 2007, and involved consulting with the business community
to develop policy outcomes that promote sustainable development in Tasmania.

The TRSIP consulted with representatives from the following industry groups:

   ⇒   Property Development
   ⇒   Tourism: state, interstate and international
   ⇒   Farming and Grazing Industry
   ⇒   Organic Agriculture
   ⇒   IT and Business Services
   ⇒   Fisheries
   ⇒   Viticulture and Winemaking
   ⇒   Non Government Organisations

As the largest single development proposed for Tasmania is the Gunns proposed
pulp mill, it was suggested that the mill be investigated for its impact on a
sustainable economy for Tasmania, and alternatives explored.

As a result, the TRSIP commissioned a team of economists to study the
economic claims made by the proponents and the impact the project will have
upon the state’s economy.

Tasmanian based Wells Economic Analysis and Melbourne based
Economist@Large were chosen to conduct the study.

The TRSI study provides, for the first time, the entire picture - an assessment
based on the costs, benefits and risks of the proposal.

The study also makes a first-time attempt at identifying the components of a
sustainable economy in Tasmania.

Since embarking upon the TRISP initiative, Premier Paul Lennon has called upon
the business community to participate in the debate surrounding the pulp mill.
This project provides an important input into that debate.

                                                                                  3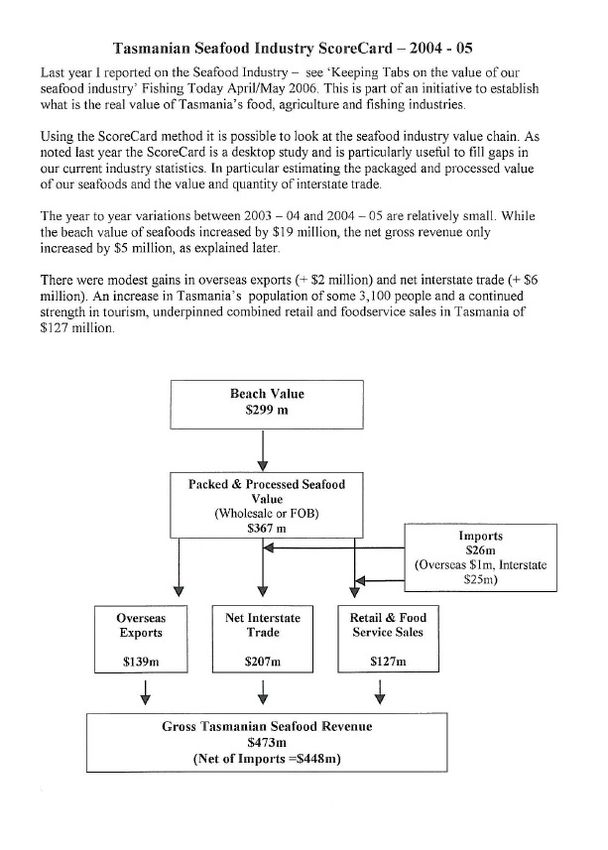
Key findings

   1. The proponents have made a simple but significant error by double
      counting the Pulp Mills tax benefit to the Tasmanian economy.

   2. A benefits analysis conducted by the proponents show an $834 million tax
      contribution over the life of the project but failed to show the $847.3 million
      in subsidies provided to the project.

   3. The proponents have only provided a benefits analysis to the Tasmanian
      economy. They have not factored in risks and costs, including:

               a. Risk of respiratory disease caused by the emissions from the
                  proposed mill, quantified in the report at $350 million.

               b. The cost to the Tasmania economy from converting additional
                  agricultural land to plantations from to supply the proposed mill,
                  quantified in the report at $403 million.

               c. Risks to Tasmania’s fishing industry due to dioxin contamination
                  from pulp mill effluent, quantified as a medium risk scenario
                  could cost the industry $693.5 million and 700 job losses over
                  the life of the project

               d. Following a survey conducted by the Tasmanian Tourism
                  Industry Council, economists were able to quantify the risk to
                  Tasmania’s tourist industry. With 84% of growth in Tourism
                  attributable to repeat visits, a medium risk scenario will cost the
                  Tasmanian economy $1.1 billion and 1044 jobs over the life of
                  the project.

               e. If you add up risks to health and other industries plus the costs
                  and subsidies the total is $3.3 billion.

 4. Only subsidies provided by the Australian taxpayer makes the mill profitable.

 5. Job gains during mill construction may well be offset by the “crowding out” of
 other development opportunities and job losses elsewhere.

 6. On a range of realistic scenarios, the Pulp Mill project may cause an
 economic loss to the State of Tasmania.

 7. The proposed pulp mill does not represent sustainable development for
 Tasmania.

                                                                                        4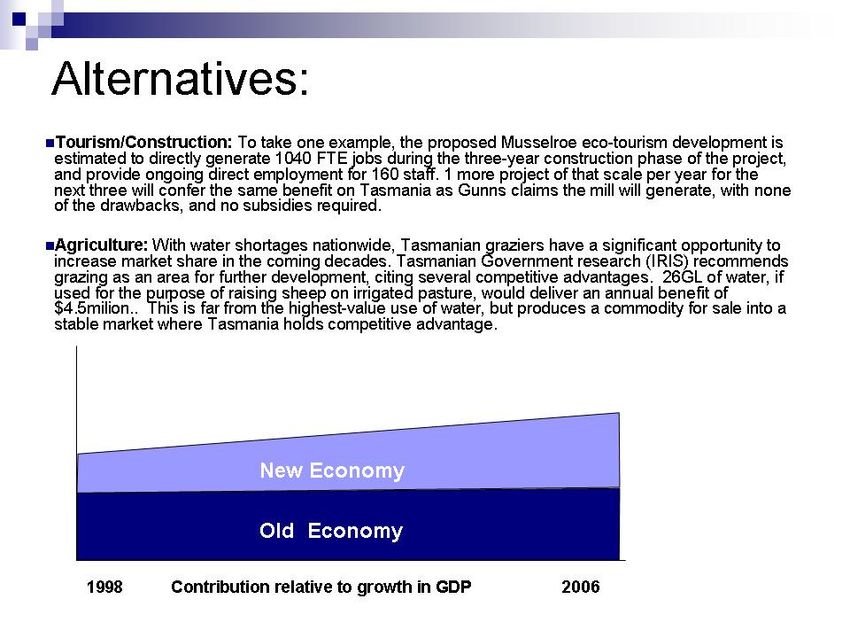
The Alternatives

Tasmania’s economy is currently healthy and unemployment is at a record low.
Although the pulp mill represents the largest single investment in Tasmania,
there are currently over $2 billion worth of other developments on the books for
the State.

Our study demonstrates that the proposed mill could threaten the other
development proposals which we believe constitutes an unnecessary and
unsustainable risk.

The TRSIP recommends that the Tasmanian Government:

   ⇒ conduct its own assessment on the potential economic costs and risks
     associated with the proposal, rather than making a decision based on the
     information contained in Gunns “benefits analysis”

   ⇒ encourage developments that support, rather than detract, from one
     another.

   ⇒ avoid developments which require ongoing subsidies

   ⇒ encourage diversity in the Tasmanian economy as a measure to protect
     our economy from a downturn in one particular sector.

It is highly unlikely that increasing concentration on one heavily-subsidised
industry is a sustainable strategy for Tasmania.

The report

The report has been structured around a 15 minute Powerpoint presentation.

The full texts of the reports written by the economists are provided in the
Appendices.

We chose to present the report in this way as it allows for the messages
contained within to be understood by non-economists.

As a project that aims to promote sustainable development in Tasmania we need
to ensure all sectors of our community have access to information that is
presented in a format that is easy to understand and digest, not lost in technical
jargon that only experts can understand.

The TRSIP welcomes debate on the calculations and conclusions reached.

                                                                                   5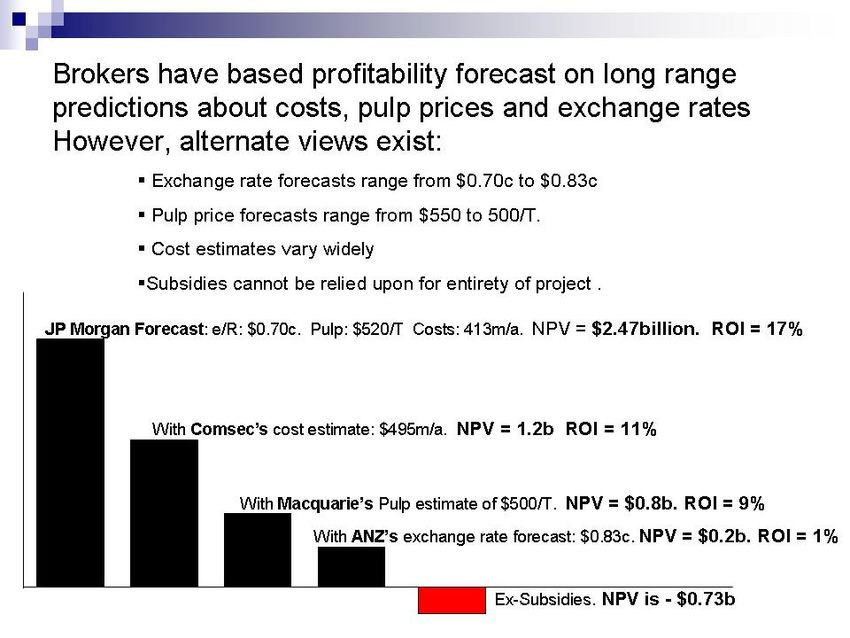
Contents
1 Executive Summary                                 3
2. Introduction                                     7
3. Half-a-nomics                                    9
4. Benefits                                         10
5. The economic findings                            11
6. Overstated welfare benefits                      12
7. Subsidies                                        13
8. Tourism                                          14
9. Agriculture and fisheries                        16
10. Human health                                    17
11. Skill shortages                                 18
12. Interim summary                                 20
13. Assuming the mill is as profitable as claimed   21
14. Profitability forecast                          22
15. Pulp mill closures                              24
16. The whole financial picture                     26
17. A diversified economy                           28
18. Alternatives                                    29
19. Conclusion                                      30

Acknowledgements                                    32
Appendix A                                          36
Appendix B                                          39
Appendix C                                          51
Appendix D                                          52
Appendix E                                          54

                                                         6
1.
         Introduction
           The Tasmanian Round Table for Sustainable Industries Project commenced in April
            2007. With the aim of promoting sustainable development for Tasmania, business
            leaders were consulted from a broad cross-section of the Tasmanian economy
            including agriculture, tourism, property and business services. Collectively, these
            industries employ 31.8% Tasmanians and provide 17.7% of Tasmania’s GSP.

           This report is timely, given Premier Paul Lennon’s request for the business community
            to express its opinions on the Pulp Mill Debate.

           The TRSIP advocates rigorous economic analysis as the only way to ensure optimal
            allocation of resources, and hence a long-term, sustainable economy for Tasmania

           An economic analysis has been commissioned to analyse the impacts of the proposed
            mill. That is, a coalition of independent economists has analysed the costs, benefits
            and risks of the mill.

           The TRSIP offers this analysis in the interests of stimulating an open debate about the
            impact of the proposal on Tasmania’s future. The TRSIP is happy to be debated, and
            stand corrected, should any of these conclusions prove incorrect

Comments:

  ⇒ Forestry contributes $1.4 b to Tasmania’s Gross State Product and
    employs 3900 people directly, approximately 7000 indirectly.

  ⇒ “New Economy” businesses have been driving the growth of the
    Tasmanian economy while contributions from traditional industrial sectors
    have declined

  ⇒ The TRSIP enters the debate with a desire for the long term, sustainable
    growth of Tasmania’s economy with the welfare of all Tasmanians and
    Australians in mind.

                                                                                                      7
Verification:
Gross State Product contribution 2005-06 figures:
Source: Tasmanian Department of Economic Development
NB: It is somewhat difficult to determine the exact contributions from each
industry as the figures do not consistently separate upstream from downstream
manufacturing and processing contributions, and available data does not make it
possible to neatly separate industries.
.
Employment
INDUSTRY Employment (numbers) Employment (%)
Food, Fisheries and 12,700 5.74%
Agriculture (2)
Construction 15,930 7.2%
Tourism (2) 22,900 10.35%
Property IT and 18,806 8.5%
Business Services
TOTAL 70,336 31.79%
Forestry (direct) 3,900 1.76%
Forestry (indirect) 7000 3.16%
Source: Tasmanian Prospectus
82.
Half-a-nomics:“This is not a cost-benefits analysis”
Review of the social and economic benefits (emphasis added)
of the Gunns Ltd Pulp Mill Proposal, ITS Global, Pg 9.
•Jobs
•GSP
B
Contribution
E
CN •Tax
OE Revenue
SF
•A tourist
TI
attraction
ST
S
Comments:
To-date, Gunns have provided a “benefits” analysis which only tells half the story.
⇒ Almost any projects one can imagine have benefits
⇒ There would be benefits to building a hotel in Wineglass Bay, but
common sense tells us that the costs would exceed the benefits, and that
therefore the overall impact would be negative.
⇒ By providing only a “benefits analysis” Gunns has not equipped decision
makers to adequately assess the impacts of the mill.
⇒ The Tasmanian Government has admitted relying on Gunns’ assessments
rather than conducting its own independent analysis.
⇒ A realistic and balanced economic assessment requires an analysis of the
costs, benefits and risks, including the impact on other industries.
⇒ The TRISP has not commissioned this analysis to be confrontational. It
simply believes that for Tasmania to maximise its wealth, it must make
sound economic decisions. Therefore it must ensure rigorous cost-benefit
economic analysis of all projects.
93.
Benefits
Gunns have claimed
A 2.49% increase in household consumption based on Allen
Consulting Welfare Measure (graph below)
A $6.7billion dollar contribution to the Tasmanian economy
280 direct jobs. 1617 indirect jobs
Premier Lennon has stated that every household in Tasmania
B will be $870 better off.
E Percentage increase in private consumption spending
N over base case (Allen Consulting, Table C1)
E 3 Adjustment is conservative: it is based on the biggest (i.e.
F most favourable) change in private consumption spending.
J
2.5
I O
2
T B
1.5
S S
1
0.5
0
200 7 8 9 10 11 12 13 14 15 16 17 18 19 20 21 22 23 24 25 26 27 28 29 30
Comment:
Gunns/Allen Consulting forecast that the mill's impact on private consumption
expenditure will reach its highest point (2.49%) in 2030. The average increase
will be lower. Nevertheless, we have used 2.49 % in our calculations. This is
simply to give the mill the ‘benefit of the doubt’
Anecdote:
⇒ Economist@Large has lengthy experience in assessing economic
government and corporate sponsored analyses. In 1997 Economist@large
conducted an independent analysis on the Victorian Grand Prix. The
Victorian Government cited a forecast economic benefit of $120 million
per annum. Economist@Large was commissioned to independently
assess the impact of the Grand Prix and predicted, once all factors were
accounted for, that the Grand Prix would generate an annual $8 million
loss for Victoria. The core reason was that the underlying business did not
add up. A 2007 Victorian government enquiry admitted that the GP was in
fact a loss-maker in excess of the amount, and for the reasons,
predicted by Economist@Large.
⇒ The TRSIP requests all decision-makers to read this independent
economic analysis of the impacts of a Tasmanian Pulp Mill
.
Verification: ITS GLOBAL report available online at
http://www.justice.tas.gov.au/__data/assets/pdf_file/0004/82282/Final_ITS_Glob
al_Report.pdf
104.
The economic findings:
Double Counting
Overstated Welfare Benefits
Government Subsidies
Impacts on human health
Impacts on other jobs and industries:
Tourism, Agriculture, Aquaculture
Impacts on other developments
Risks
Alternatives
Comment
This is a contents directory. Each topic is dealt with in detail below.
115.
Overstated Welfare Benefits
Gunns claimed a consumption benefit of
2.49%. However:
O
V
E Taxation benefits were double counted
WR B
ES E Failed to take migration effect into
LT N account
FA E
AT F Failed to take governmental J
RE I contribution to welfare into account O
ED T B
S S
Actual consumption benefit is 0.47%
Result: Consumption benefit reduced by 2.02%
Comment:
⇒ Double counting: The proponents have made a simple but significant
error by double counting the Pulp Mill’s tax benefit to the Tasmanian
economy.
⇒ What they did: Gross State Product (GSP) contribution was derived from
the formula GSP = Consumption + Investment + Government + Exports.
Tax benefits were counted as potentially available under the Government
expenditure heading, then counted again as an indirect benefits in the
“Consumption Heading”
⇒ Migration effects: The model included the benefits of new workers
coming to Tasmania, but when calculating the benefits that each
Tasmanian would get, forgot that these additional people would (a)
increase demands on government services, and (b) take a share of the
economic gains.
⇒ Governmental Contribution. The model assumed that all consumption
benefits would be private. This ignores the fact that all households (to
varying degrees) also benefit from governmental assistance. As this
benefit does not increase at all, most households are not as well off as
Gunns reports claim.
Verification:
12This section of the economic analysis was conducted by Wells Economic
Analysis. See Appendix A below.
136.
Subsidies
Gunns analysis has added the benefits of the proposed mill’s $834
million tax contribution over the life of the project, but didn’t subtract
the cost of $847.7 million in government subsidies to the mill.
Subsidies to Tasmanian Forestry and to Gunns:
(Net Present Value, 2007-2030, $m)
State Commonwealth Total
1. One-off 30 65 95
subsidies
2. RFA and 60.86 73.44 134.29/ 2 = 72.1
CFA J
3. Stumpage 434.66 434.66
O
B
4. Water 4.14 4.14
S
-847.7m 5. MIS in 241.83 241.83
forestry
$ Total $847.73m
Result: Big cut in consumption benefit from resource misallocation induced by subsidies
Verification:
This section of the economic analysis was conducted by Wells Economic
Analysis. See Appendix B below
147.
Tourism
A recent survey of 700 tourism operators revealed
34% believed the mill would directly negatively impact their business
58% believed that it would negatively affect Tasmania’s “clean, green” brand
Tourism Facts:
•Visits have increased almost 200,000 since March 2003 to 880,000
per annum.
•84% of this growth was from repeat visitors
•While Forestry contributes marginally more to GSP, Tourism
employs nearly 3 times as many people, representing 9% of the 1044
Tasmanian workforce J
Risks to Direct (on 34%) Indirect (on 58%) Cost ($) Jobs O
Tourism B
1 S
-1.074b Low 5.25 537.04m 522
J
Medium 10.5 2.5 1.074b 1044 O
$ B
High 21 5 2.148b 2088
S
Comments:
The TRSIP obtained Input from business leaders in agriculture, tourism and
fisheries industries, and was able to obtain reliable sources of information as a
result. Other industries may also be affected but were not consulted.
⇒ Repeat Visitors: It is worth emphasizing that of nearly 200,000 additional
per annum visits since March 2003, over 165,000 were repeat visitors.
This means that:
o Tasmania finds it incredibly difficult to attract first time visitors, BUT
is incredibly good at attracting (and its success depends on) repeat
visits.
⇒ It is widely accepted that Tourists come to Tasmania for 3 reasons;
wilderness, history and heritage and food and wine. The mill will affect
2 of these 3.
⇒ Jobs: Many jobs could be lost if a contraction in tourism occurs as a
consequence of the mill being built. While forestry makes a marginally
higher contribution to GSP (Forestry $1.4b, Tourism $1.3b) tourism
employs three times more people. As a result, a small contraction in
tourism will cost more jobs than the potential gains to be made in forestry.
15Verification: Calculations were done as follows:
1. Direct Impacts: 34% of operators thought they would be
directly impacted. We provided three risk assumptions on
the magnitude of this impact (5.25, 10.5 and 21%) multiplied
by 0.34 and then by tourism’s total contribution to GSP
($1.3b).
2. Indirect impacts: 58% of tourism operators believed
Tasmania’s brand would be adversely impacted. Risk
assumptions of 1%, 2.5% and 5% were applied.
3. Present value of costs were calculated over 24 years of the
pulp mill project at 5% (multiplier of 14.448)
Visitor numbers: Tasmanian Visitor Survey March 2003 – March 2007
Employment Figures: Tasmanian Prospectus
Survey: Tourism Council:
http://tict.com.au/cms/mediareleases/tourismindustrycalls_text.php
168.
Agriculture and Fisheries
Agriculture:
Direct cost of lost output from conversion of
farmland to additional plantation: $403m
Water. Growth in plantation timber uses water that
will be needed for irrigation.
Fisheries:
The Seafood Industry contributes $473m annually
to the economy, and provides 7000 jobs. The
following risks apply:
Risks to % Loss Cost Jobs
Fisheries
Perceived Brand Loss 174.95m 175
loss of clean (2.5%)
- 174.9m green image
175
J
O
Real loss of Dioxin 693.5m 700
clean green Contamination
B
$ image (10%) S
Verification
Farmland conversion calculation can be referenced to Appendix B
Tasmanian Fisheries Industry Council’s “Fisheries Industry Scorecard” shows
direct and downstream revenue from fisheries provides $472 million and 7000
jobs. See Appendix C.
Risk Calculations
TFIC’s independently verified position is that Gunns’ hydrodynamic modeling
(marine effluent dispersal) is unable to provide any certainty that there will not be
impacts on fisheries. Therefore, a risk exists.
We have calculated the potential cost of (a) a market perception that Tasmanian
Seafood is no longer clean and green and (b) a market event whereby seafood
is found to be contaminated. The downturn has been assumed at 2.5% and 10%
of the industry respectively over the life of the project and then expressed as a
net present value.
179.
Human Health
Sweco Pic’s report stated that NOx emissions will not meet
guidelines
It is well established that for every 10 microgram increase in fine
particulates, respiratory diseases increase by 4%.
The Tamar Valley has a unique “air shed.” which concentrates
pollution The Tasmanian Government has calculated the cost of
8 additional deaths from respiratory diseases is $160m/annum
Additional contributions from the mill will conservatively increase
Fine Particulates by between .94 and 2.83 micrograms:
Deaths from Logging Truck Accidents are also likely.
Absolute Increase Increa Cost Increase Cost of Work Lost Total
Contributi in Death sed ($m) in Hospit Days Prod over life
on of Pulp and Deaths Hospital alisatio Lost uctiv of
Mill disease isations n (asthma ity project
only) (NPV)
0.94 µ/m³ .37% 4 $10 380 $1.9m 1480 $.225 $175.2m
-216
m
1.89 µ/m³ 0.756% 8 $20 760 $3.8m 2960 $.45 $350.4m
L
m m JI
-350.4m 2.83 µ/m³ 1.32% 12 $30 1140 $5.7m 4440 $.675 $700.8m O
V
m m B
E
$ S
*clearly, this just quantifies economic cost, not the value of a human life) S
Result: 216 lives lost over 24 year life of project
Comments:
⇒ While information on PM 10 (fine particulates) has been provided, data on
PM 2.5 (ultra-fine particulates) has severe shortcomings. It is the health
effects from additional emissions that concerns the Australian Medical
Authority the most and these emissions are considered by them to be the
major health issue in respect to the pulp mill development.
⇒ The medium risk scenario is of 8 deaths per year. Add 1 log truck death
per annum and over 24 years of the lifespan of the project and deaths
increase from 192 to 216. It is all very well creating 280 direct jobs, but
not at the expense of 216 lives.
Verification:
See Appendix D
1810.
Skill Shortages
the TCCI Quarterly Survey shows that skill shortages are clearly the top-ranking
concern among Tasmanian businesses.
Unemployment is at record lows in Tasmania (4.4% seasonally adjusted) and other
states are experiencing severe skill shortages.
‘There is ... a risk that significant labour shortages and wage pressures could emerge
within the Tasmanian economy during the construction phase and that they could
constrict the extent of the economic benefits that would otherwise have been realized
by the State’. (ITS GLOBAL, p. 65)
On Gunns figures, the mill will employ 420 skilled workers currently employed in other
industries in Tasmania.
The skills shortage in Western Australia was a significant contributor to the fall in the
state's economic growth from 8% in 2003-04, to 3% in 2004-05 at the height of the
shortage. The impact of the skills shortage influenced a deceleration in business
investment growth from 28% in 2003-04 to 11%. The deceleration cost the WA
economy $4.8 billion.
More Tasmanian business will be ‘crowded out’ than assumed in Allen Consulting
Report.
Comments:
This is one aspect of the economic debate on the pulp mill that has received little
attention, and deserves to as so many sectors of the Tasmanian economy will be
affected.
If Gunns need 2000 skilled workers in the construction phase, one must ask where they
will come from.
Gunns states that 80% will come from interstate, which begs the question of what terms
Gunns will have to offer to entice workers to relocate. There is already a long-standing
shortage of workers in WA, and West Australian employers have not been as successful
as they would like at attracting interstate employees, despite offering pay in excess of
$2000 per week for most skilled labour.
In these circumstances, Gunns is likely to find it far easier to employ local skilled workers
who, given Tasmania’s current record employment figures (only 4.9% unemployed) are
currently employed elsewhere.
If workers are taken from enterprises with greater Returns on Investment (ROI)
Tasmania will be worse off. A subsidised industry will take workers from industries that
stand on their own two feet. This is economically destructive, and hardly a “fair go”.
19This was of great concern to the business leaders consulted by the TRSIP, and is likely
to concern every employer of skilled workers in Tasmania.
Verification: See Appendix E
WA skill shortage calculations:
An Australian Bureau of Statistics report examined the WA economy following a
significant slowing in 2004/5. GSP growth fell from 8.1% in 2003-4 to only 2.7% in
2004/5.
Skill shortages were cited as a significant factor in the downturn. In 2003/4 WA’s GSP
was $93,339b. Had GSP grown by 8.1% in 2004/5 GSP would have been $99726b.
Instead, GSP was $94,827, a loss of $4.8 billion.
See:
http://www.abs.gov.au/AUSSTATS/abs@.nsf/7d12b0f6763c78caca257061001cc588/18
d5ad97d35892afca2570f8008245d2!OpenDocument
Tasmanian Skill Shortage Figures:
Excerpt from “InSummary” Issue 17, July 2007
Tasmania’s unemployment figure is lower than NSW and South Australia.
Source: www.tasmanianjobs.com
2011.
Interim Summary
Allen Consulting Welfare Benefits
After deduction of double counting and over-statements
After deduction of Subsidies
After costs to other industries
After costs to human health
$
Other Costs and Risks
Comments
⇒ Once welfare benefits are correctly stated, and costs and subsidies netted
out, societal gains from the mill are marginal
Verification:
This is an interim summary based on the information above.
FACTOR COST JOBS
Welfare Takes welfare from 2.5% in -
Overstatement and aggregate to an increase to
Double Counting 0.5% per person
Accounting for Reduces contribution by -
Subsidies $847m
Risks to Tourism Cost of $1.156b (mid scenario) 1044 jobs
Risks to Agriculture Cost of $346.9b (mid-scenario) 174 jobs (mid scenario)
and Fisheries
Health Risks Cost of $350.4m (mid- 216 lives
scenario)
Skill Shortages Unquantified, but significant -
Other costs and risks Unquantified, but significant -
2112.
Assuming, of course, that the mill is as profitable
as Gunns say it will be….
Since benefits to the economy are extrapolated from the profitability of the TPM,
independent financial modelling of the TPM was undertaken to assess NPV
Figures in RED are f or manual input
Tasmanian Pulp Mill Financial Model
Assum ptions Outputs
Build Costs EBITDA (2010) A$m 159
Local Equipment and Development Costs A$m 300 EBIT (2010) A$m 103
Civil w ork construction costs A$m 500 NPAT (2010) A$m - 12
Mill Plant Equipment based f inancing A$m 800
Annualised ROI (EBIT 2010-19) % 5.9%
Ongoing Costs Annualised ROI (NPAT 2010-19) % 0.1%
Debt Funding % 75%
After tax cost of debt % 7% NPV of Project (using FCF) A$m 289
Cost of stumpage from native forest A$ per tonne 11 NPV of Project (before tax) A$m 778
Cost of stumpage from plantations A$ per tonne 36
Cost of harvest & transport from source to millA$ per tonne 36.5
Mill Labour USD per ADT 60
Mill Chemicals USD per ADT 40
Other Manufacturing Costs USD per ADT 40
Tranport f rom Mill to Shanghai USD per ADT 70
% of Pulp shipped overseas % 80% “Despite a strong economy the
Revenues
Conversion ratio of w ood chips to pulp % 25% demand for paper and paperboard
Pulp Price USD per tonne 550
exchange rate A$/USD 0.83 has increased by only 19% over
Calculations
Rate of Depreciation & Amortimisation % 7% the past 9 years compared to
WACC % 9.2%
Terminal Grow th Rate A$m 3%
economic growth of 39% for the
same period.”
http://www.iris.tas.gov.au
Notes
1. Source: Financial Analysis by Economists @ Large and Associates from data provided by ComSec, Macquarie Bank, JPMorgan and ANZ.
Comments
⇒ This model is a “live” model. This means that data can be changed and
the model will calculate the impact on the profitability of the mill. The “live”
model is available on request for those who wish to investigate the
impacts of variables such as commodity prices, subsidies and exchange
rate, many of which the mill is highly sensitive to.
⇒ We have examined broker reports from Comsec, Macquarie and others to
set data within predicted ranges. A sample of the outputs follow:
2213.
Comments:
⇒ In layman’s terms, Net Present Value is the profit of the proposed mill
over its lifetime
⇒ ROI is the Return on Investment.
⇒ A 20% ROI is the benchmark for new projects
⇒ Pulp milling is a highly competitive, low margin business which is highly
sensitive to economic forces that neither Gunns nor the Tasmanian
government have control over.
⇒ Subsidies may be understandable if there is proportional public good to be
gained, but subsidising industries with questionable public good, and
defined public harm, must be seen as having a negative impact.
Verification:
See APPENDIX E: model prepared by Economist@Large
23Calculations:
Based on Gunns' guidance, JP Morgan has forecast that when the pulp mill
operates at close to full capacity (1 million ADT pa), it will generate EBITDA of
A$330m (ROI on EBIT = 17%), NPV = A$2.47bn. For this forecast JP Morgan
used the following assumptions:
⇒ total production costs of A$413m pa (including delivery costs)
⇒ pulp price of US $520
⇒ exchange rate of 70c.
However:
⇒ Comsec estimates total production costs will be A$495m (including
delivery costs). If Comsec cost estimates are used, EBITDA will fall to
A$248m (ROI on EBIT = 11%), NPV = $1.2bn.
⇒ Macquarie Bank's analysis uses a long-term pulp price forecast of
US$500. If this is used EBITDA will fall to A$219m (ROI on EBIT = 9%),
NPV = $0.8bn
⇒ ANZ forecasts the long-term exchange rate will be 0.83. If this is used,
EBITDA will fall to $122m (ROI on EBIT = 5%), NPV = $0.2bn.
⇒ If output is not at 1m ADT pa, but rather starts at 0.75m ADT pa and
gradually builds up to 1.1m ADT pa by 2018, EBITDA will fall to $113m
(ROI on EBIT = 4%), NPV = $0.03bn.
⇒ Furthermore, if native timber subsidy, MIS subsidies, Regional and
Community Forest Agreement subsidies, and one-off subsidies are
excluded, EBITDA will fall to $71m (ROI on EBIT= 4%), NPV will fall to -
$783m
2414.
Pulp Mill Closures
A CIFOR Study of 67 mills concluded that overwhelmingly, mills were less
profitable than predicted
The US and Canada has recently seen a rash of pulp mill closures Between 2004
and 2006, 7 mills closed in Canada alone.
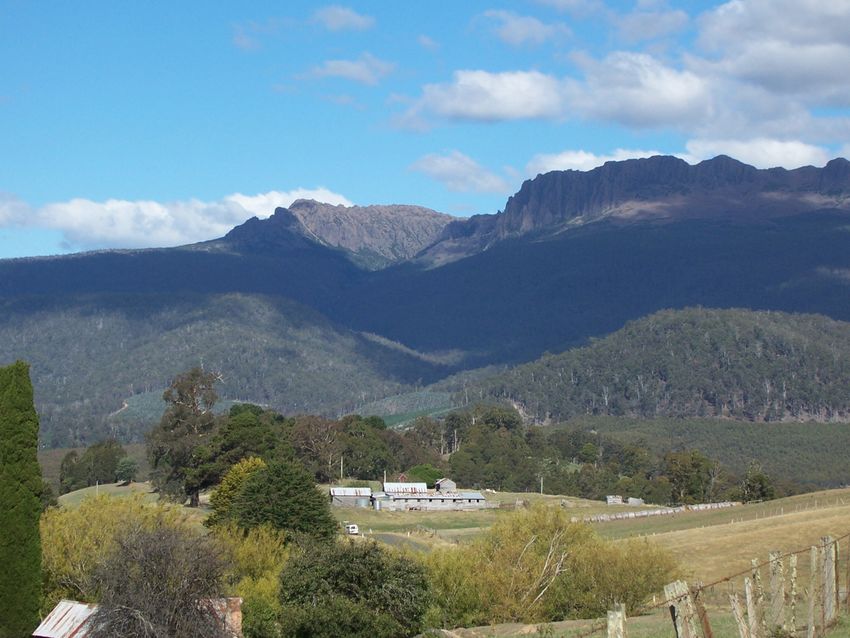
Tasmania has the same underlying problems as Canada relative to the Asian and
South American markets
• Low growth rates due to low temperatures and rainfall
• High cost of labour
Sept. 2004 UPM-Kymmene (pulp line) Miramichi, N.B. • softwood kraft pulp/100 000 tonnes
Sept. 2004 St. Anne-Nackawick Nackawick, N.B. • bleached hardwood kraft pulp for
high-quality photo paper/251 000 T
Oct. 2004 Port Alice Port Alice, B.C. • pulp/160 000 tonnes
Dec. 2004 Domtar (partial closure) Cornwall Pulp Mill, Ont. • bleached hardwood kraft
pulp/150 000 tonnes
March 2005 Neenah Paper Terrace Bay, Ont. • pulp/125 000 tonnes
Weyerhaeuser (Prince
January Prince Albert, market pulp and fine papers / 410 000
Albert pulp and paper
2006 Saskatchewan tonnes
mill)
Domtar Inc. kraft pulp and fine paper /
March 2006 Cornwall, Ontario
(pulp and paper mills) 425 000 tonnes
Comments:
⇒ Asia and South America, where enormous plantation estates have been
established, have faster growth rates and lower costs of labour. Tasmania
is at a significant competitive disadvantage
⇒ Many of the Canadian mills, following years of ongoing “propping up“
through subsidies, are closing within 15 years of commissioning
⇒ The socio-economic legacy of these closures has been bitter
⇒ It goes without saying that the proponents of these failed mills expected
significant positive economic benefits prior to commencing construction.
Anecdote:
We don’t compete with China to manufacture cheap drills. Business
leaders question whether Australia should attempt to compete in markets
where Asia and South America have such clear advantages.
25Verification:
CIFOR Study:
⇒ Canadian Pulp Mill Closures:
⇒ http://cfs.nrcan.gc.ca/sof/sof05/mergers_e.html
and http://cfs.nrcan.gc.ca/sof/sof06/mergers_e.html
2615.
The Whole Financial Picture
E
A A
B
$’s J
J
$’s $’s O
O
C B
B
S
S D
A: Gunns reported outcome: welfare overstated, tax benefits double counted,
costs excluded.
B: Best Case Scenario. Mill profitable as most optimistic long range forecasts,
no costs or risks eventuate, modelling errors corrected, subsidies subtracted.
C: Predicted (mid range) Outcome: Mill as profitable as average of long range
forecasts suggest, mid range risks eventuate, modelling errors corrected
D: Worst Case Scenario. Mill only as profitable as long range forecasts suggest,
known costs eventuate as do mid-range of risks, modelling errors corrected.
E: Alternative Scenario. Alternative projects are pursued (see next slide)
Comments:
⇒ The first point is that Gunns scenario (A) is simply impossible. It is
impossible to have benefits without costs or risks.
⇒ Scenario B is the best possible case – if all goes perfectly for Gunns, there
will be a boost to employment (assuming no crowding out), and Gunns will
make a profit. However, given the level of subsidy, the economic benefits
to Tasmania are marginal.
⇒ Scenario C is an optimistic scenario as predicted by the economic
analysis. In this case, job gains are largely offset by crowding out and job
losses elsewhere, and the mill causes an economic loss, but there is still a
marginal positive impact on jobs.
⇒ Scenario D shows the result if market conditions are not as positive as
Gunns hopes, and if some of the risks quantified above eventuate.
Scenarios A-D do not take into account the opportunity cost of approving the mill.
Scenario E does illustrate that there are alternatives. If these are not pursued,
these become lost opportunities.
27Verification:
Premier Lennon’s statement that every Tasmanian will be $870 better off is not
part of the original Allen Consulting report. As a result, we are unable to
determine how this figure was reached
As the Tasmanian government has not responded to our requests for the basis of
this calculation it is difficult to compare the impacts on wealth with the real costs
Therefore, the graphs above are indicative rather than corresponding to figures
that we are able to calculate with exactitude.
If the government wishes to share that information with us, we would be able to
calculate the impacts with greater accuracy
2816.
A diversified economy
The 2006 Redi Map:
• $2 billion worth of development
projects
• $800 million under construction.
• 141 projects committed to in 2006
compared to 69 in 2005.
• 67 projects under construction in ’06,
only 38 in 2005.
• Investments by Tasmanian firms more
than doubled,
• Tasmania has “full employment”
Comments:
⇒ The 2006 REDI-Map is a compilation of all projects proposed and
commenced in Tasmania. The 2006 REDI Map shows over $2 billion
worth of development proposals, a large increase in proposals from the
2005 survey. This is a sign of a healthy, growing, diversified economy.
⇒ The TRSIP believes that the key to Tasmania’s continued growth is a
judicious and balanced approach to stimulating all of Tasmania’s
industries, building a resilient, diversified economy where each sector
supports, rather than detracts, from others.
⇒ “Too many eggs in one basket” is the phrase that applies to this proposal.
A diversified economy is far more immune to risk – a basic tenet of
investment governance.
Redi-Map available online through the Department of Economic Development’s
Website: http://www.development.tas.gov.au/investintas/economy/redimap.html
2917.
Comments:
⇒ Over the past 10 years, the relative contribution from “old economy”
industries such as forestry and heavy industry has fallen, while
“new economy” industries such as IT and business services,
tourism and property has increased. This has been a large factor in
Tasmania’s economic success in the past decade. In this context,
promoting an “old economy” business at the expense of the new
economy is a backwards step.
30Conclusion
1. The proponents have made a simple but significant error by double counting
the Pulp Mill’s tax benefit to the Tasmanian economy.
2. A benefits analysis conducted by the proponents show an $834 million tax
contribution over the life of the project but failed to show the $847.3 million in
subsidies provided to the project.
3. The proponents have only provided a benefits analysis to the Tasmanian
economy. They have not factored in risks and costs, including:
a) Risk of respiratory disease caused by the emissions from
the proposed mill, quantified in the report at $350 million.
b) The cost to the Tasmania economy from converting
agricultural land to plantations to supply the proposed
mill, quantified in the report at $403 million.
c) Risks to Tasmania’s fishing industry due to dioxin
contamination from pulp mill effluent, quantified at a cost
of $693.5 million and 700 job losses.
d) Following a survey conducted by the Tasmanian Tourism
Industry Council, economists were able to quantify the
risk to Tasmania’s tourist industry. With 84% of growth in
Tourism attributable to repeat visits, a medium risk
scenario will cost the Tasmanian economy $1.1 billion
and 1044 jobs.
4. On a range of economic scenarios, the mill will be reliant on Australian
taxpayer subsidies to remain profitable.
5. Job gains during mill construction may be offset by the “crowding out” of
other development opportunities and job losses elsewhere.
6. On a range of realistic scenarios, the Pulp Mill project may cause an
economic loss to Tasmania.
7. The proposed pulp mill does not represent sustainable development for
Tasmania.
31The Alternatives
Tasmania’s economy is currently healthy and unemployment at a record low.
Although the pulp mill represents the largest single investment in Tasmania,
there are currently over $2 billion worth of other developments on the books for
the State.
Our report demonstrates that the proposed mill could threaten the other
development proposals which we believe constitutes an unnecessary and
unsustainable risk.
Recommendations
The TRSIP recommends:
⇒ the Tasmanian government conduct its own assessment on the potential
economic costs and risks associated with the proposal, rather than making
a decision on the information contained in Gunns “benefits analysis”
⇒ encouraging developments that support, rather than detract, from one
another.
⇒ avoiding developments which require ongoing subsidies
⇒ encouraging diversity in the Tasmanian economy as a measure to protect
our economy from a downturn in one particular sector.
It is highly unlikely that increasing concentration on one heavily-subsidised
industry is a sustainable strategy for Tasmania.
32Acknowledgements
The LEC wishes to thank the following for their expertise and input into the
TRSIP Report 1:
Ed Archer Agriculture – Grazing
Josef Gretschmann Organic Food Production and Processing
Nigel Davies IT and Business Services
John Dingemanse Property Development
TFIC Fisheries
Simeon Michaels Finance and Investment
Kim Seagram Tourism
Peter Whish-Wilson Viticulture and Winemaking
The LEC wishes to thank the following individuals and companies who
generously donated to fund this initiative.
The Crystal Castle
Richard W Hultgren
Jannine Barron
Robert Rosen
Suzanne Shahar
Andy Small
Lara Lyons
C Christopherson
Saul Mordaunt
Di Challen
Maggie Cooper
peter Westheimer
Rachel Bacon
Simeon Michaels
Barry Rafe
Hannah McCaughey
Richard Milroy
Imelda Willamson
Garry Scott
Rose & Robert Hochmann
Rupert Edwards
Kathryn Granheim
Richard Swinton
Daniel Bunning
Ouafaa Karim
Karen Hirst
Bernie Baer
Janice Baxter
Kelly Upton
Saul Michaels
33Chris Derksema
Gary Higgins
Louise O’Halloran
Erik Adams and Jess Poulson
Brian Burke
Wayne Rubin
Warren Haywood
Paul Tosi
Katherine Jankaus
Natalie Stephan
Hunter Hall International
Lynda Dean
Greg A Birtles
Iain MacGill
Nathan Fives
Danielle Leonard
T. Mair (Lorsas Pty Ltd.)
Stan and Zetta Michaels
Byron Bay First National Real Estate
Anthony and Kerry Michaels
Anne-Marie Spagnolo, Ethical Investment Services
Dave and Ross!
Howard Gilmore
Natalie Stephan
Gary Read
Dr. Kirsten Charlesworth
Verity Murray
Duncan Paterson
William Hartnett
W T Kalinko
Sarah Smith
Frankie J and Michelle Holden
Iris Imison
Graeme & Janet Murphy
Ashley Glendowning
Evelyn Michaels-Glover
Cameron Glover
Simon Cant
Leigh Small
Danin Kahn
Neal Bowhay
tarina millar
Lindley Edwards
Tim Winton
Michael Bliss
Grant Hawkins
BJ Musson
Hagit Gal
34Simon Longstaff
James McCaughey
Avi Sharabi
Michael Bartholomew
Mark Guy
Monica Schofield
Merrin Stacey
Sam Green
Bronwyn Bodley
Sue Wyllie
Kristy Guthrie
Leigh Knox
Troy Frurness
Jenny Haines
Cassy Egan
Jason Deo
Kate Cameron
Cheryl Bourne
Anne Clarke
May Jones
Nick Ross
Lisa Bennett
Rochdale Financial Services
F Swart
Mark Mills, Generation Capital
Duncan Murray
Tara Bauser
John Bialylew
Fiona Higgins
Michael and June Drake
Jenny Mason and Jim Sakkas
Joseph Courtney
Roslyn Macvean
Sally Power
John and Kathy Close
Dr. John Glascott
Byron Beach Realty
Robyn and John Frazer
Stan and Zetta Michaels
Lauren Montgomery
Tamara Rockstro
Angela Fossi
Jenny Robinson
Christina Christodoulou
Kim Amato
I and B Glover
Kelli and Tao Browne
Alexander Fearnside
35Pascale Beard
Geoff Wilson
Jane Taylor
Kirsti Simpson
Monica Richter
Max Leslie
Jennie Churchil
Stephen Trstenjak
Finally the LEC would also like to thank and congratulate Simeon Michaels who bravely
paddled his kayak alone from Sydney to Hobart to help raise funds for the TRSIP.
36APPENDIX A:
ITS GLOBAL REPORT OVERSTATES CONSUMPTION BENEFIT FROM GUNNS
PULP MILL
Report by Wells Economic Analysis
The ITS Global Review significantly overstates the effects of the proposed Gunns pulp
mill on Tasmanian household welfare.
It has been widely reported that ‘at the end of the assessment period, Tasmanian
households would be consuming about 2.5% more goods and services than they would
have without the pulp mill’ (ITS Global Review, p.25).
A more relevant estimate, based on the same Allen Consulting report as used by ITS
Global is that, at the end of the assessment period, Tasmanian households would be
consuming, on average, about 0.5% more goods and services than they would have
without the pulp mill.
In other words, for every $1000 of annual consumption undertaken by Tasmanian
households, the modeling on which the ITS Global Review is based suggests that as a
result of the pulp mill we will instead be able to undertake $1005 of annual consumption.
That is, an increase of $5 worth of annual consumption for every $1000 previously
consumed.
This is a positive economic impact, but it is very much less than has been claimed by
ITS Global and in media commentary.
How is this lower estimate – an increase in per capita consumption of 0.5% – derived?
The first point to note is that ITS Global engages in double counting. Their analysis adds
together consumption spending by households and additional tax collections by
government. This is illegitimate, given the modeling assumptions used in the Allen
Consulting report (AC hereafter).
The AC approach is stated explicitly, and worth repeating:
We assume that real government spending by regional
governments and real consumption by the federal government are
unaffected by the Project. We assume that all indirect tax rates
have the same values as in the base case simulation. The Federal
government’s budget balance is fixed to its base case value via
endogenous adjustments to the average PAYG tax rate. State
government budget balances are fixed via endogenous change in
direct transfers to households’ (AC p.54.)
In other words, the AC model holds real government spending constant, and gives any
increased taxes generated by the pulp mill back to households to spend.
Hence it is clearly misleading to state that ‘the best measure of the project’s impact on
the welfare of Tasmanian is the sum of changes in household consumption and State
37tax revenues’, and that ‘Tasmanian households would be consuming about 2.5 per cent
more goods and services than they would have without the pulp mill. For its part, the
State Government would be collecting an additional $48 million in tax revenue.’ (ITS
Global (p.25)).
The AC economic model assumption is that, at the end of the day, there is no change in
State tax revenues. Additional tax revenue has all been given back to households, and
the relevant welfare effect includes only additional household consumption.
The second source of overstatement arises because, in evaluating the change in
household welfare, ITS Global assume that household consumption and household
consumption expenditure are the same thing. This flies in the face of the commonsense
observation that taxpayer-funded services also provide consumption benefits to
households. Public schools and hospitals provide the same consumption benefits as
private schools and hospitals. In the jargon of economists, government consumption
spending yields private consumption benefits.
So if a consumption measure is to be used to gauge welfare effects, it should be based
on private consumption rather than private consumption expenditure.
Importantly, and as noted from the above AC quotation, taxpayer-funded consumption
benefits are assumed to be unchanged as a result of the Gunns project – government
spending is assumed to be fixed.
The third point to note is that a welfare measure should be based on the change in per
capita consumption, not the change in aggregate consumption. Hence, because the
Gunns project will change the Tasmanian population, we need to take population
change into account when assessing the change in per capita consumption benefits.
Now calculate the impact of these three points. Estimates of the change in private
consumption and population from their baseline levels are derived as follows:
- In 2005/06 the trend estimate of real private final consumption expenditure in
Tasmania was $11285m; trend real general government consumption
expenditure was $4011m1. Conservatively, assume only half of general
government consumption expenditure yields private consumption benefits. On
this basis real private final consumption expenditure in 2005/06 is 85% of total
private consumption.
As indicated above, AC’s modeling assumption is that there is no change to real
government consumption expenditure as a result of the expansion in economic
activity consequent on construction of the pulp mill. (AC, Table C.1) indicates that
in 2030 real private consumption expenditure is 2.49% higher than it otherwise
would be. Hence the increase in private consumption is 85% of this figure2.
- The average employment impact in the operating phase (2007-2030) is,
assuming no increase in the number of hours worked per person, an increase in
employment 2.0% over what it otherwise would be. Although the change in State
population is not modeled it is reasonable to assume that by 2030 the State
1
ABS cat.no. 5206027, downloaded 19 September 2006.
2
Note that the figure of 2.49% appears to have been ‘rounded up’ to 2.6% in both AC and ITS Global.
38population will increase by roughly the same proportion as the increase in
employment satisfied by interstate migration. From AC, Table C.2, interstate
migration accounts for 84% of the total increase in employment in 2030.
Although both assumptions – the change in State population and the extent to which
government consumption expenditure yield private consumption benefits – seem
reasonable, they could be challenged3. However, these assumptions imply that the AC
model estimates only a relatively small overall welfare improvement, since in 2030 the
overall change in per capita consumption is
Estimated percentage change in per capita consumption
= 0.85*2.49 - 0.84*2.0
= 0.43%
The conclusion is that data given in the original AC report, on which the ITS Global
Review is based, suggest the project would lead to a relatively small increase in per
capita consumption in Tasmania, making it around half a percentage point higher
than it otherwise would be in 2030.
ITS Global acknowledge that their Review is based primarily on impact assessments
previously presented to the RPDC, and that its Review does not provide a cost-benefit
analysis (ITS Global, p.8), and it is a significant shortcoming that a cost-benefit analysis
has not been conducted.
In the absence of a more complete analysis, it is important that the results of earlier
impact assessments be presented accurately and unambiguously. In our view a more
accurate representation of the earlier work is that, for every $1000 of consumption,
construction of the pulp mill will mean that the average Tasmanian will enjoy only $1005
of consumption.
3
The estimate that only half of government consumption expenditure gives private consumption benefits
may be conservative. On the other hand our estimate of the change in State population may be too high.
Our assumption is that there is no change in hours worked by the average Tasmanian as a result of the pulp
mill. If, as is assumed in the AC report, there is an increase in hours worked by the average Tasmanian, our
calculation overstates the increase in the Tasmanian population. However, it should be noted that the
probable biases work in opposite directions and so will to some extent cancel each other.
39APPENDIX B:
Proposed Gunns Pulp Mill: Subsidies
Report by Wells Economic Analysis
The Allen Consulting report (AC hereafter) enumerates only the positive impacts for
Tasmanian households, including taxation benefits, increased employment and higher
household consumption.
While the studies include tax benefits from the proposed mill, neither AC nor the ITS
Global Review attempt to identify the extent of subsidies to the proposed Gunns pulp mill
or to the Tasmanian forest industry more generally. Any reasonable attempt to evaluate
the net benefit to Tasmanians must take these subsidies into account. It is a serious
deficiency of both these two studies that they have declined to undertake this
work4.
As is detailed below, these subsidies are large, particularly when set against the
increase in household consumption assessed by AC.
Our preferred estimate of the net present value of subsidies to the proposed pulp
mill is $847.73m5.
This estimate is similar to the estimate of the Net Present Value of increased tax
collections by the Commonwealth and Tasmanian governments obtained in the
Allen Consulting Report, and relied on by the ITS Global Review.
In other words the proposed pulp mill is not expected to make any net
contribution to tax collections to either the Commonwealth or Tasmanian
government.
Subsidies to the proposed pulp mill fall into four groups:
1. Government assistance with start-up costs and provision of infrastructure to support
the pulp mill;
2. Subsidies paid by the Commonwealth and Tasmania under Regional and
Community Forest Agreements;
3. Subsidies from Tasmanian taxpayers to Gunns because Forestry Tasmania sells
pulpwood to Gunns at stumpage rates below market prices;
4. Subsidies from Tasmanian taxpayers to Gunns because Hydro Tasmania sells
water to Gunns at a price less than its alternative value in irrigation.
4
AC (p.33) acknowledges that the project has received or is likely to receive government assistance via
provision of infrastructure, Commonwealth Government R&D support, and Managed Investment Schemes.
However these forms of assistance are excluded from the AC assessment on the grounds that they are not
subject to specific contractual agreement between Gunns and the relevant levels of government (p.33). In
the case of taxation arrangements such as the MIS or the stumpage agreement with Forestry Tasmania it is
difficult to see the rationale for this position – were that logic to be followed in other parts of the impact
assessment process it would be unnecessary to model the effects of taxes on other inputs, such as the
payroll tax.
5
The NPV of subsidies is obtained by discounting at the same rate as used by AC – a real rate of 5%.
405. Subsidies to plantation forestry via the use of preferential tax treatment offered by
Managed Investment Schemes.
Subsequent sections of this report detail the calculations underlying estimates of each
form of subsidy. We also provide a partial accounting of the opportunity costs of the
pulp mill project, focusing on the cost of lost agricultural production
Table 1 Subsidies to Tasmanian Forestry and to Gunns: Summary
(Net Present Value, 2007-2030, $m)
State Commonwealth Total
1. One-off 30 65 95
subsidies
2. RFA and CFA 60.86 73.44 134.29/ 2 = 72.1
3. Stumpage 434.66 434.66
4. Water 4.14
5. MIS in forestry 241.83 241.83
Total $847.73m
Source: Calculations in subsequent sections.
One-off subsidies
One-off subsidies include provision of assistance for development of documentation for
the proposed pulp mill, consultancy fees, RPDC expenses, government advertising,
upgrades to the East Tamar highway and other roads, and funding for the Pulp Mill
Taskforce. Estimates shown in Table 1 are taken from Edwards Submission to RPDC,
(September, 2006) and updated with information on costs of RPDC assessments and
consultants’ reports as provided in the tabulation in the Sunday Tasmanian, 15 July,
2007.
Regional and Community Forest Agreements
In 1997, a Regional Forestry Agreement between the Commonwealth and Tasmanian
governments was signed. A subsequent Community Forest Agreement was signed in
2005. Both provide for preservation of old growth forests and various forms of subsidy to
the Tasmanian forestry industry. Since 2005, payments over the remaining life of the
agreement (to 2009-10) are as shown in Table 2.
Table 2 Contributions under Community Forest Agreement ($m)
05-06 06-07 07-08 08-09 09- NPV 07-
10 10
41Commonwealth 24.0 45.2 38.0 24.0 60.86
Tasmanian Government 13.8 13.3 13.7 26.2 27.0 73.44
Total 37.8 58.5 41.7 50.2 27.0 134.29
Source: Supplementary Regional Forest Agreement, Attachment 2.
These subsidies are directed to a variety of purposes in the Tasmanian forest industry.
For the purposes of this calculation it is conservatively assumed that half the total
subsidy flows through to benefit the proposed pulp mill.
Stumpage
Sources of pulpwood supply for the proposed pulp mill include
- Forestry Tasmania (native forests and plantation)
- Private forests
- Gunns freehold forests.
Competitive neutrality (CN) principles developed by the National Competition Council
and agreed to by all states and territories are designed to ensure that GBEs face the
same costs and commercial pressures as their private sector competitors. If these
principles are applied to the sale of pulpwood timber by Forestry Tasmania, the market
value of standing timber would be determined by its residual value, obtained by
subtracting harvesting, transport and processing costs from international prices of
processed wood products, in this case either woodchips or pulp6.
This approach to pricing is essentially the same as adopted by the Gunns subsidiary,
Gunns Plantations Limited (GPL) which offers woodlot projects to investors as Managed
Investment Schemes. Gunns has entered into an agreement with GPL to purchase all
harvested timber in pulpwood woodlot projects, with a price to be the higher of the then
prevailing market price and a floor price. The floor price is calculated from the Leading
Australian Hardwood Chip Export (LAHCE) price by subtracting the costs of harvesting,
processing transporting and management fees. On this basis, and allowing for the fact
that the yield of plantation timber is up to 15% higher than for native forest timber, the
equivalent CN price for sales of native forest pulpwood by Forestry Tasmania can be
estimated to be approximately $30 per green metric tonne.
If Forestry Tasmania’s projected sales volumes and prices for native-forest pulpwood to
Gunns were known, the subsidy could be readily calculated. However neither set of data
is publicly available.
In the absence of firm data forest industry investment analysts must, of necessity, make
best-estimate assumptions in order to provide advice to clients considering purchasing
shares in Gunns Limited. In what follows we use the estimates developed by Comsec to
derive a base-case estimate of the NPV of subsidy Comsec report, 27 October 20067.
Estimates based on alternative scenarios are also presented.
6
Productivity Commission (2001), ‘Competitive Neutrality in Forestry’, CCNCO Research Paper.
p.vii.
7
Comsec report, 27 October 2006.
42When operating at 820,000 Air Dried Tonnes (ADT) of pulp per year, the proposed pulp
mill will require approximately 3.2 million Green Metric Tonnes (GMT) of pulpwood per
year. Allowance for additional tonnage of forest residues and other waste for power
generation from biomass increases this annual tonnage to over 3.5GMT. Gunns
propose that 80% of pulpwood timber will initially be drawn from native forests, moving
to 80% supply from plantation timber by 2018.8 So, excluding demand for export
woodchips, initial demand for native forest pulpwood is 2.8m GMT, falling to 0.7m GMT
in 2018.
Comsec assumes that the long-term wood supply agreement with Forestry Tasmania
guarantees Gunns access to a minimum of 2 million GMT per annum of native forest
timber over a period of 20 years, and this assumption is the starting point for the three
scenarios developed below. The three scenarios are believed to be conservative
estimates of annual purchases a native-forest pulpwood over the life of the project,
particularly in the earlier years.
- Option A assumes that annual purchases from Forestry Tasmania are 2m
GMT per annum, for the life of the project. As the project shifts to plantation
timber for supply to the pulp mill, excess native timber pulpwood is exported
by Gunns as woodchips.
- Option B assumes that annual purchases from Forestry Tasmania start at 2m
GMT and decline linearly until 2018, remaining constant at 1m GMT per
annum thereafter.
- Option C assumes that annual purchases from Forestry Tasmania start at 2m
GMT per annum and decline linearly until 2028 at which point there are no
purchases of native forest pulpwood from Forestry Tasmania.
These scenarios are illustrated in Figure 1.
Figure 1 Forestry Tasmania Sales Scenarios
2.5
Tonnes per annum
2
1.5
1
0.5
0
2007 2009 2011 2013 2015 2017 2019 2021 2023 2025 2027 2029
Option A Option B Option C
8
As the proportion of plantation timber rises, the higher yield of plantation timber allows for increased
output of pulp. Our scenarios assume that this, rather than a reduction of overall demand for pulpwood, will
occur.
43You can also read