Functional Needs, Emotions, and Perceptions of Coffee Consumers and Non-Consumers
←
→
Page content transcription
If your browser does not render page correctly, please read the page content below
sustainability

Article
Functional Needs, Emotions, and Perceptions of
Coffee Consumers and Non-Consumers
Antonella Samoggia * , Margherita Del Prete and Chiara Argenti
 Department of Agricultural and Food Sciences and Technologies, University of Bologna, 40126 Bologna, Italy;
 margherita.delprete5@unibo.it (M.D.P.); info@chiaraargenti.it (C.A.)
 * Correspondence: antonella.samoggia@unibo.it

 Received: 18 May 2020; Accepted: 13 July 2020; Published: 15 July 2020

 Abstract: Coffee is one of the most consumed beverages worldwide. Over the last decades coffee has
 become a specialty product. Drinking a coffee beverage entails several mixed factors, such as pleasure,
 experience, lifestyle, and social status. It can also provide an emotional pick-up, both mentally and
 physically. Only a few studies have explored the motives and emotions of coffee consumption and
 not consumption. There is limited understanding of consumers’ emotional approach towards coffee,
 and what influences a positive and negative inclination towards coffee consumption. This research
 fills the current research gaps by addressing three main questions: (i) What are the emotions and
 habits of coffee consumption? (ii) What are the motives of coffee consumption and non-consumption?
 and (iii) How relevant is the coffee health impact perception of consuming or not consuming coffee?
 The research activities include 467 face-to-face interviews with consumers. Interviews are performed
 in two different countries, Italy and Portugal. Data elaboration includes a principal component
 analysis carried out to identify latent factors on motives and emotions of consumption in both national
 groups, and to explore the relationship between the main emotions and consumers’ habits and
 socio-economic characteristics. Results support that consumers have positive emotions from coffee
 consumption. Perceived emotions are energy, satisfaction, and pleasure. Non-consumption is mainly
 driven by taste and fear of coffee’s health impacts. There are limited differences in the countries
 analysed. Socio-economic characteristics limitedly influence perceived emotions and consumption
 motives. To conclude, consumers are increasingly interested in new coffee products. Understanding
 the functional and emotional factors of coffee consumption contributes to supporting new coffee
 product development and commercialisation.

 Keywords:   coffee; emotions;                  sustainability;   health;   consumer;    perception;     motives;
 non-consumption; food

1. Introduction
     Coffee consumption has increased worldwide in the last 20 years. Global coffee consumption
reached 166.06 million bags in 2019/2020, an increase of 0.5% on 2018/2019 [1]. Among the major
coffee producers, the highest consumption growth was recorded in Vietnam (annual average rate
of +10%) [2], with a Compound Annual Growth Rate (CAGR) of +6.5% from 2016/17 to 2019/20.
Among the biggest coffee importers, the European Union and the Unites States had a CAGR of +1.2%
and +2.4%, respectively, from 2017 to 2020 [3]. Furthermore, China (annual average growth rate of
+12%) [2] is becoming the world’s most promising market for coffee growers and international coffee
chains [2].
     In the last decades coffee has become a specialty and high-quality standard product. Coffee
consumption is a moment of pleasure and part of a lifestyle [4–7]. The evolution coffee has faced
is commonly recognized as the “three waves of consumption” [6]. The first wave, at the end of the

Sustainability 2020, 12, 5694; doi:10.3390/su12145694                           www.mdpi.com/journal/sustainability
Sustainability 2020, 12, 5694 2 of 23
nineteenth century, consisted of converting coffee into an industrial good, mainly managed by Brazil
and the United States coffee industry. In the 1990s, with the second wave movement, coffee became a
specialty beverage, setting a new consumption era. Quality, flavour, ethics were the main drivers of
consumption. With the new century, the third wave of coffee consumption initiated, with increased
attention towards high-quality coffee. The act of drinking a coffee beverage has evolved. It includes
several mixed factors, such as pleasure, experience, lifestyle, and social status [7]. It can also provide
an emotional pick-up, both mentally and physically. It can act as a relaxer or a mental clarifier.
It increases blood circulation and has warming effects; it is psychologically comfortable and has
pleasant associations, along with its appreciated aroma and taste [8].
Past research identified different drivers of coffee consumption, including mixed expectations
about its caffeine content. Coffee has been widely studied in relation to its positive or negative
health-related outcomes. Controversial information about coffee is released and given to consumers,
thus creating uncertainty. Consumers have indeed reported to be confused regarding the health risks
and benefits of coffee. Only 16% of U.S. consumers reported to be informed about the health aspects of
coffee and 66% cope with reducing the amount of caffeine they consume [9]. The situation is similar in
Europe, where 49% believe that coffee may cause health problems [10].
Despite coffee’s great popularity, increased consumption across various countries, and increased
interest in new coffee products, only a few studies have explored the motives and emotions of coffee
consumption and not consumption. Past research mainly focused on consumers’ coffee consumption
behaviour [4,7,11–13]. There is limited understanding of consumers’ emotional approach towards
coffee, and what influences a positive and negative inclination towards coffee consumption. This paper
aims to understand consumers’ preference and reasons for coffee consumption, including emotions,
attitudes, and perceptions that drive coffee consumption and non-consumption. The identification of
the emotions and factors that guide consumers in drinking or not drinking coffee complements past
research findings, and provides a more comprehensive understanding of coffee consumption behaviour.
Moreover, past research supports that countries may have different coffee consumption
behaviours [10,14]. The present study aims at highlighting the existence of various emotional
and motivational approaches in two different countries, that is, Italy and Portugal. Both countries have
a wide coffee consumption culture. Thus, it is relevant to explore whether there are country-specific
emotions and motives to coffee consumption and non-consumption. The study outcomes can support
the definition of research-based marketing strategies. Thus, this research objective is to fill the current
literature gaps by addressing three research questions: (i) What are the emotions and habits of coffee
consumption? (ii) What are the motives of coffee consumption and non-consumption? and (iii) How
relevant is the coffee health impact perception in consuming or not consuming coffee? The research
will highlight differences and similarities between Italian and Portuguese consumers.
2. Literature Review
2.1. The Experience and Emotions of Coffee Consumption
Food consumption patterns have modified in the last decades and are expected to evolve following
consumers’ preferences and new lifestyles. The general interest is less inclined towards commodity food
products purchased and consumed in a massive way [15]. In recent years, consumers’ perspective has
been subjected to a modernisation where aesthetic, uniqueness, and handicraft are expected products’
values. Functionality has lost its relevance in a culture where people have the need to experience
the whole context of emotions deriving from enjoyment of a specific product. Therefore, firms have
changed their evaluation criteria when launching new products or presenting alternatives. The simple
“measurement of liking/acceptability/preference” in consumer evaluation does not fully capture the
complexity of elements that drive the food choice [16].
Emotions are considered essentials, driving people through the choice of different options. Brands
are in charge of differentiating their products according to the different emotions they provide. StudiesSustainability 2020, 12, 5694 3 of 23
indicate that coffee has the capability to impact human wellbeing by influencing life in various subjective
ways, such as body functioning, physical health, mood, emotions, and social relationships [17]. Coffee
has the strength to modify people’s feelings and mood. Moreover, coffee consumption can be driven
by the lack of calories it contains [18]. Coffee is one of the products celebrated for its organoleptic
characteristics, that create a unique sensorial experience [19]. Preparation of coffee involves mainly
smell and taste, while the sight is entailed during the whole process [20].
2.2. Coffee Consumers’ Habits and Consumption Motives
Food and beverages are consumed by people according to different motivations, in different
places, and for different occasions. Consumers’ purchasing behaviour habits are mainly driven by
expected taste and flavour, as rarely is there a chance to use the senses to judge a product while
being in supermarkets [21]. Expectations and previous knowledge replace the missing opportunity
of experiencing taste and flavour before buying. The expectations are stimulated by the food
packaging characteristics.
There are various drivers of coffee consumption. Taste and smell are the main reasons for drinking
coffee. Other important motives of coffee consumption are socialisation, consumption setting, enjoying
coffee at home, at work, and with different people, and the material aspects of the cup (fabric, type of
spoon, etc.) [10]. A recent research review supports that coffee consumer behaviour is influenced by
the following coffee attributes: sustainability labelling, organic, Fairtrade, country of origin, type of
coffee (espresso, filter, instant, single cup, with milk, iced), intrinsic attributes (roast degree, specialty
coffee), and extrinsic attributes (brands and packaging) [7]. In the meal experience, coffee has a double
role. It is an opportunity to socialize, a daily ritual, a part of special occasions, and a nutritional intake,
aiming to increase blood pressure or stimulate alertness.
2.3. Consumers’ Perception of the Relationship Between Coffee and Health
The increasing rates of diet-related diseases such as obesity, heart disease, and diabetes across the
world during the last decades have raised attention towards nutrition and healthy diets, pushing food
companies to differentiate their products with healthier alternatives. Unhealthy diets together with
sedentary lifestyles are considered the two major drivers of the higher disease rates.
One of the main aspects that acts as driver and barrier to coffee consumption concerns health
beliefs [22]. The same effect produced by coffee can lead the consumer to want to consume it or not.
Coffee is often consumed for the beneficial effects that the consumer perceives, such as anti-migraine
or energising effects [23]. More often, however, coffee is considered harmful, and avoided by those
suffering from insomnia or anxiety [24]. Recent studies carried out show that only 25% of the
interviewed people link coffee with positive health effects (e.g., anti-migraine effect) [25]. Around 80%
of the respondents thought that drinking coffee increased blood pressure. The relationship between
coffee consumption and the perception of coffee health impact has been limitedly studied and mainly
in Europe [25]. Despite coffee being a drink included in low-calorie diets [11,22], consuming coffee is
not yet considered a health-oriented behaviour [26]. Until now, consumers still know little about the
beneficial effects that coffee can have on human health. It is mainly perceived as a stimulant.
2.4. Coffee Non-Consumption Motives
The food non-consumption behaviour is complex and can be driven by various factors [24,27].
Consumers may intentionally decide not to consume a specific product, be against one product and
opt for an alternative, and be inadequate for a certain product due to some limitations, for example age
limits. Other conceptual frameworks classify non-consumption to include a consumption behaviour
that rejects, restricts, and reclaims a good. Rejection is about avoiding the consumption of some goods,
restriction is about the reduction of some goods, reclaiming represents an ideological shift regarding
the processes of acquisition, use, and dispossession.Sustainability 2020, 12, 5694 4 of 23
There are consumers that choose not to consume coffee. Consumer behaviour research studies
mostly focus on the reasons for consuming coffee. There are limited studies on the reasons for
not consuming coffee. Past research supports that the same elements may have a role both in
driving or limiting coffee consumption [7]. Key coffee attributes that notably impact the consumers’
non-consumption attitude are aroma, taste, and flavour [24,28]. The negative relationship between
coffee and its flavour is due to the bitterness of some types of coffees [4,24,28]. It is interesting to
note that taste is also the most appreciated attribute of coffee among those who consume it [24,28].
Moreover, not having the habit to consume coffee is another reason to explain coffee consumption
reluctance [24,28]. Concerns about the health effects of coffee also play a negative role in coffee
consumption. Consumers associate coffee with anxiety, insomnia, and gastric problems such as
heartburn and ulcers. However, there may be a possible interest in a coffee with functional characteristics
among non-coffee users [25,28].
2.5. Methodological Scales for Consumer Emotion Measurement
A food product is no longer evaluated only for its sensory characteristics but also for the emotions
it arouses in the consumer. Over time, various methodological scales have been developed to identify
and measure the emotions that food products arouse. The most recent methods are the result of an
evolution of evaluation scales, which have undergone various advancements. A recent literature
review analysed the methods used to assess the emotions evoked by the food experience [29]. The most
relevant methods are analysed below.
First, in the 1970s, the Profile of Mood States (POMS) was developed to assess people’s mood.
It uses 65 mood terms anchored to a Likert five-point rating scale. It measures mood in six
dimensions: tension-anxiety, depression-dejection, anger-hostility, vigour-activity, fatigue-inertia,
and confusion-bewilderment [30]. Moreover, in 1965, the Multiple Affect Adjective Check List
(MAACL) was defined and then revised in 1985 [31]. The last version was integrated with two
positive scales, that is, arousal and activation, and three negative scales, that is, anxiety, depression,
and hostility. These first questionnaires and related measurement scales were initially developed for
clinical screening, and aimed at assessing the emotional state of patients. Then, they started to be
applied to food and product development laboratories.
Second, the Food Choice Questionnaire [32] was developed to identify the determinants of food
choices. Nine factors are identified, including customers’ mood. Laros and Steenkamp (2005) [33] listed
173 negative and 143 positive emotions. In 2008, Desmet and Schifferstein [34] measured responses
to positive and negative emotion-terms, which they called pleasant and unpleasant. More recently,
King, Meiselman, and Carr (2010) [35] defined the EsSense ProfileTM , a list of 39 emotion-terms
related to general food consumption. In order to assess the overall acceptability of the product,
the EsSense ProfileTM has been extended with nine hedonic-focused items. In 2016, a new version
of the EsSense ProfileTM , the EsSense Profile25, was created with the aim of shortening the previous
version, by reducing the number of words from 39 to 25 [36]. A five-point Likert scale (from 1 = not at
all, to 5 = extremely) has been used to measure emotions’ intensity. Standard questionnaires applied
to food products were no longer sufficient to specifically identify the emotional profile of a specific
product. To address the limitations of the available approaches, Spinelli et al. (2014) [37] developed
a food product-specific questionnaire (EmoSemio). EmoSemio is a product-specific questionnaire,
presented in discursive form, and adopting a specific language and culture perspective. In EmoSemio,
the emotions are presented by using full sentences. It developed from one-to-one interviews based on
a modified version of the Repertory Grid Method (RGM) [38]. In RGM, the differences between the
products under consideration are described through the use of three elements that act as a stimulus to
elicit the respondents’ views. Other questionnaires use emotional vocabulary related to food products,
such as the EmoSensory Profile (EMP) [39], the Empathic food test (EFT), the Consumer-Defined
Check-All-That-Apply (CD-CATA) [40], and the Rate-All-That-Apply (RATA) [41]. EPT uses a list
of 14–17 emotional and 13 sensory terms, and EFT uses 12 empathic terms. The CD-CATA andSustainability 2020, 12, 5694 5 of 23
RATA techniques are, respectively, an evolution and a variant of the Check-All-That-Apply (CATA) in
which the respondent is asked to choose and rate the most suitable terms to describe the tested food
product [42].
Finally, specific studies were conducted with the aim of investigating the reasons for coffee
consumption and to formulate a specific vocabulary to identify the full range of emotions that
it arouses. In 1988, Graham [12] tested 18 motives for consuming coffee and tea to analyse this
product’s consumption drivers. Four principal motives were identified, two concerning the social
sphere—sociability and beverage—and two regarding personal effects—stimulant and relief. Based on
Graham’s [12] study, Agoston et al. (2017) [13] developed a 39-item Motives for Caffeine Consumption
Questionnaire (MCCQ). Habit, ceasing fatigue, invigoration, improving concentration, taste, smell,
symptom management, mood, and social reason were the main identified categories. In 2014,
Bhumiratana, Ashikari, and Chambers [43] identified a vocabulary describing the experience induced
by coffee consumption. A total of 44 terms of emotion were identified through a focus group, 17 of
which confirmed the EsSense Profile® . The remaining 27 terms derived from the uniqueness of the
experience generated by different factors, such as the time of day, the situation, cultures, traditions,
and the context of consumption. Thanks to the identification of this comprehensive scale, the list of
terms describing the coffee consumption experience (CDE) has been defined. Recently, Kanjanakorn
and Lee (2017) [8] compared the EsSense Profile® and the specific scale developed for coffee consumers
(CDE) to evaluate the behaviour of coffee consumers and the change in their emotions when drinking
coffee. In addition to these specific studies on coffee, past studies focused on consumers’ emotions by
comparing different product categories [35,44], and analysing a specific product, such as chocolate [45]
and blackcurrant squashes [40]. However, up to now the literature has focused on the emotions raised
by the experience of drinking coffee or other food products in people who consume it. There is limited
knowledge on the reasons that push a consumer not to consume a specific product. In particular,
the present study contributes to the definition of a deeper understanding of the coffee consumers’ and
non-consumers’ behaviour.
3. Method
3.1. Data Collection
The data collection process obtained data and information from Italian and Portuguese consumers.
Respondents were coffee consumers and non-consumers. The interviews were carried out face-to-face,
by telephone, and online. The survey was carried out in Portugal-Lisbon urban area, from January
to February 2019, and in Italy—Bologna urban area, from February to March 2019. A questionnaire
testing phase was carried out in December 2018 to fine-tune unclear questions and develop a robust
data collection instrument. Interviews were carried out in public places, such as bars, restaurants,
parks, and malls. Survey filling lasted around 8 minutes. A total of 467 consumers participated in the
study. Respondents were not remunerated for their participation. After data cleaning, the convenience
sample for data elaboration included 419 questionnaires. The data were gathered with the support of
Qualtrics, a web-based software. It was used to upload responses during the face-to-face interviews
and online responses. Online questionnaire completion was made possible by using an online link or a
Quick Response (QR) code sent to respondents via email.
The sample included 49% respondents in Portugal and 51% in Italy (Table 1). There was a good
gender balance. A total of 61% of the respondents were younger than the average age, which was
35.2 years old, with a minimum age of 18 years old and maximum age of 91 years old. The level of
education was high, as most of the respondents had an academic degree. Most of the respondents
lived in households with at least two members, and had no children. The net family income was low
or medium. The vast majority of respondents were highly interested in a healthy diet. There were no
significant differences among the two countries.Sustainability 2020, 12, 5694 6 of 23
Table 1. Sample characteristics.
Total Portugal Italy
Gender % % %
Women 58 61 55
Men 42 39 45
Total 100 100 100
Level of education
No academic degree 30 16 43
With academic degree 70 84 57
Total 100 100 100
Age
From 18 to 29 years old 52 59 45
From 30 to 39 years old 15 18 11
From 40 to 49 years old 11 11 11
From 50 to 59 years old 15 9 21
From 60 to 69 years old 5 1 9
From 70 years old 2 1 4
Total 100 100 100
Members in the household
Single person 15 15 14
From 2 to 3 41 42 40
>3 45 43 46
Total 100 100 100
Children in the household
None 79 76 82
Between 1 and 2 children 19 23 16
>3 children 2 1 2
Total 100 100 100
Net yearly family income
75,000 Euro 8 8 8
Total 100 100 100
Note: Total valid interviews: 419, with 205 in Portugal and 214 in Italy.
3.2. Questionnaire Structure
Data gathering was based on a questionnaire with close-ended questions. The questionnaire
was available in three languages (i.e., English, Italian, and Portuguese) to allow consumers easy
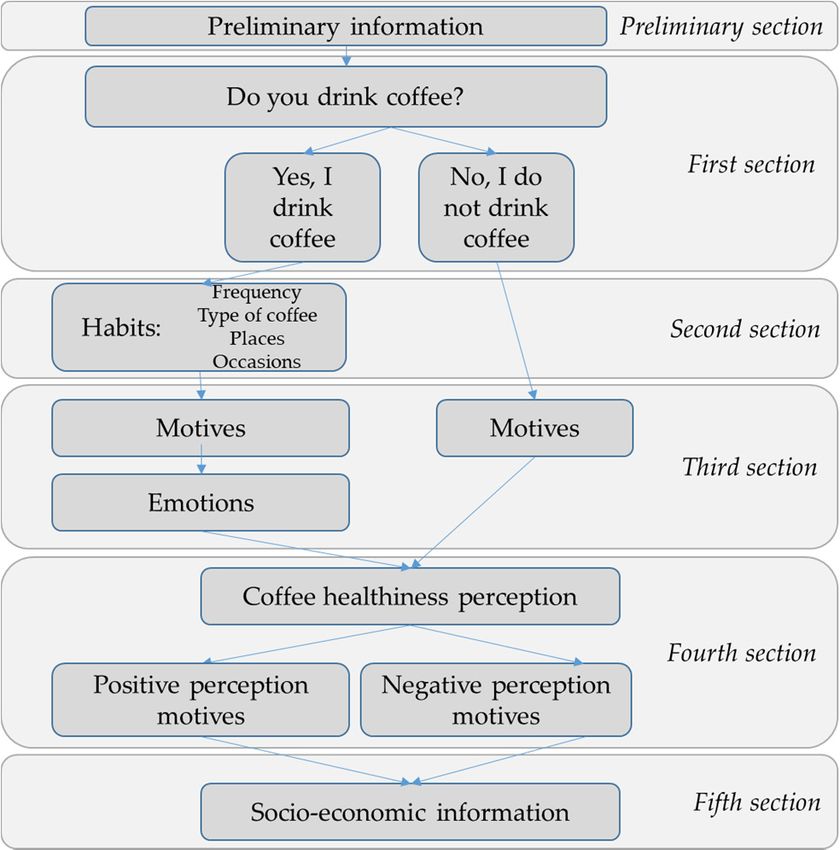
participation in the study. The questionnaire was divided into different sections (Figure 1).
The preliminary section presented the survey, provided information about the research institution
promoting the study and the length of completion, asked confirmation of minimum age, set at 18
years old, provided information on the anonymity and confidentiality of the survey, asked to confirm
the relevant informed consent before proceeding with the questionnaire. The first section asked
if the respondent drank coffee, decaffeinated, or did not drink coffee. This was a filter question.
The rest of the questionnaire had a number of questions differentiated between coffee consumption
and not consumption consumers. If the consumer responded positively, the second section of the
survey gathered information on coffee drinking habits, including consumption frequency (1 cup
per day, 2–3 cups per day, more than 3 cups per day), type of coffee, occasions of consumption (at
breakfast, after a meal—lunch/dinner, midmorning/afternoon breaks), place of consumption (at home,
at bar/café/coffee house, workplace). If the consumer responded negatively, the survey skipped to the
third section.Sustainability 2020, 12, 5694 7 of 23
Sustainability 2020, 10, x FOR PEER REVIEW 7 of 24
Figure 1. Questionnaire structure.
The third section included
preliminary items to explore
section presented the motives
the survey, of coffee
provided consumption,
information aboutincluding taste,
the research
health, alertness,
institution promoting personal habit,and
the study family
the food
length tradition, socialisation,
of completion, asked mood, reduction
confirmation of headaches,
of minimum age,
and
set atmanagement
18 years old,ofprovided
blood pressure.
informationCoffee onconsumers
the anonymity selected
andthe level of importance
confidentiality of each asked
of the survey, of the
proposed
to confirmitems on a five-point
the relevant informed Likert scalebefore
consent 1 = not at allwith
(from proceeding important, to 5 = extremely
the questionnaire. important).
The first section
Then, coffee
asked if consumersdrank
the respondent selected the emotions
coffee, decaffeinated, evoked by not
or did coffee
drinkconsumption.
coffee. This was The alist of proposed
filter question.
emotions
The rest ofwasthe based on the Coffee
questionnaire had aDrinking
number of Experience
questions lexicon [43] and
differentiated on the EsSense
between Profile [36].
coffee consumption
In
and addition, the third section
not consumption consumers.aimedIf attheexploring
consumer theresponded
motives ofpositively,
coffee non-consumption,
the second section including
of the
taste,
surveydoctor
gatheredrecommendation,
information onperception
coffee drinkingof unhealthiness,
habits, includingnegative influence frequency
consumption on anxiety,(1increases
cup per
nervousness,
day, 2–3 cupsstimulates
per day, insomnia,
more thannot a personal
3 cups habit,
per day), andof
type other. Consumers
coffee, occasionsselected yes or no for
of consumption (at
each question
breakfast, afteritem.
a meal—lunch/dinner, midmorning/afternoon breaks), place of consumption (at
home, Theat fourth section explored
bar/café/coffee respondents’
house, workplace). If coffee health orresponded
the consumer unhealthynegatively,
perceptions theof survey
coffee
consumers
skipped to the andthirdnon-consumers.
section. They were asked to rate to what extent coffee is a healthy food
basedThe
on third
a five-point
sectionLikert
includedscaleitems
(1: unhealthy,
to explore5:the healthy).
motivesIfofconsumers answered from
coffee consumption, 3 upwards,
including taste,
the questionnaire asked why they considered coffee as healthy. If consumers
health, alertness, personal habit, family food tradition, socialisation, mood, reduction of headaches, answered a value
and management
lower than 3, theyofwere bloodinvited
pressure. Coffee consumers
to explain why they selected
considered the coffee
level ofasimportance
unhealthy.ofConsumers
each of the
proposed items
positively inclined on awere
five-point Likert
provided scale
with (from 1explicable
possible = not at allanswers,
important, to 5 = extremely
including coffee has important).
a natural
Then, coffee
aspect, it is aconsumers
plant-based selected
beverage,the for
emotions evoked
its caffeine by coffee
content, and consumption.
because a regular The consumption
list of proposed of
emotions was
moderate based of
quantities oncoffee
the Coffee Drinking
decreases Experience
the risk of stress lexicon [43] and
and anxiety; on the EsSense
depression Profile [36].
and headache; and
In addition, thediseases,
cardiovascular third sectionsuchaimed
as high at cholesterol
exploring the motives
[46–49]. of coffee non-consumption,
Consumers negatively inclinedincluding
towards
taste, doctor
coffee’s health recommendation,
impact were provided perception withofpossible
unhealthiness,
answers, negative
including influence on anxiety,
the caffeine increases
content, other
nervousness,
nutrient stimulates
components insomnia,
present not a personal
in the beverage, habit, and
the roasting other. of
processes Consumers
the beans,selected
drinkingyes or no
coffee, for
even
each
in question quantities,
moderated item. excessively increases blood pressure, negatively influences the absorption
The fourth
of minerals section explored
and calcium, and increases respondents’
the risk ofcoffeecancer.health or unhealthy
The provided answersperceptions
were based of on
coffee
the
consumers
literature and non-consumers.
regarding possible health They wereofasked
impact coffeeto(Appendix
rate to what A).extent coffee iscould
Respondents a healthy
opt forfood based
“I do not
on a five-point
know”, and “I do Likert scalea(1:
not have unhealthy,
specific opinion”.5: healthy).
At the endIf consumers answered
of this section, from 3 upwards,
respondents were askedthe if
questionnaire
they asked in
were interested why they considered
health-certified coffee, coffee
which aswas
healthy. If consumers
explained as a coffeeanswered a value
with a health claimlower
[25].
than The
3, they
lastwere
sectioninvited
of theto questionnaire
explain why they aimedconsidered coffeesocio-economic
at gathering as unhealthy. Consumers
information, positively
such as
inclined were
nationality, provided
gender, levelwith possible explicable
of education, age, members answers, including
in the household, coffee has a natural
children in the aspect, it is
household,
a plant-based
and net yearly beverage,
family income. for its caffeine content, and because a regular consumption of moderate
quantities of coffee decreases the risk of stress and anxiety; depression and headache; and
cardiovascular diseases, such as high cholesterol [46–49]. Consumers negatively inclined towards
coffee’s health impact were provided with possible answers, including the caffeine content, otherSustainability 2020, 12, 5694 8 of 23
3.3. Data Analysis
Data elaboration included different steps. First, it aimed at analysing coffee consumers’ and
non-consumers’ characteristics and habits. To test the significance of each variable, the chi-square test
or Student’s t-test were calculated as appropriate.
Second, the research analysed consumers’ emotions when drinking coffee in each country,
calculating the average value of each emotion. Emotion ratings between Italian and Portuguese were
tested with the Student t-test to confirm the differences’ significance. Then, the research identified
the existing latent factors in consumers’ coffee consumption emotions to identify main emotions.
The principal components method (PCA) and Varimax rotation were applied. A total of 23 of the initial
25 items on coffee emotions had factor loadings above 0.56 and were grouped into five components.
The Kaiser–Meyer–Olkin measure of sampling adequacy and Bartlett’s test of sphericity were calculated
to assess the appropriateness of the data for factor analysis. The Kaiser–Meyer–Olkin index was 0.848.
Bartlett’s test of sphericity was highly significant (0.000). The internal consistency of the measurement
items of factors was satisfactory (Cronbach’s α = 0.796–0.926) and no severe violations of the normal
distribution assumption were detected. The internal consistency and convergent and discriminant
validity of each component were verified using composite reliability (CR). CR values were from
0.722 to 0.914. Values were satisfactory and acceptable [50,51]. The average variance extracted (AVE)
provides a measure of convergent validity, and ranged from 0.501 to 0.641. These were satisfactory [52].
The square root of each construct’s AVE was calculated to ensure it was greater than its bivariate
correlation with other constructs in the model and thus confirm discriminant validity. The results
confirmed the reliability and validity of the research components. These results indicate that the data
were appropriate for use in the analysis. The choice of factors was made on the basis of the Eigen value
criterion being higher than 1. The cumulated variance explained by the factors was 69.15%. The factors
were saved as new variables and became the main emotions expressed by consumers.
Third, data elaboration aimed at exploring possible relationships between the rating of main
emotions and the quantity, places, and occasions of coffee consumption. This analysis was carried out
testing the chi-square or Student’s t-test values, as appropriate.
Fourth, the research analysed the motives for drinking and not drinking coffee in relation to
country, gender, and age. Finally, consumers’ perception of coffee healthiness was analysed to explore
in detail to what extent this perception was relevant in the different countries. Data elaboration was
carried out with the support of SPSS (IBM statistics, version 25).
4. Results
Research results show the emotions and motives of coffee consumption and non-consumption,
and to what extent coffee health perception influences coffee (non)consumption. Coffee consumers
were the majority of respondents (274, equal to 65% of respondents). There was no significant country,
gender, and academic degree level difference among coffee consumers and non-consumers (Table 2)
(non-significant chi-square values). The age was fairly significant, as supported by the Student t-test
(Levene’s test F = 3.544, p = 0.06, 95% CI) used to compare the age difference between coffee and
non-coffee consumers. Young women tended not to drink coffee. The vast majority of coffee consumers
drank coffee at home (74.5%) and at breakfast (74.1%), and half of them drank it outside the house and
after a meal. Drinking coffee at the workplace was quite common (39.7%).Sustainability 2020, 12, 5694 9 of 23
Table 2. Coffee consumers’ and non-consumers’ socio-economic characteristics and consumers’ coffee
drinking habits (%).
Women Men Total Chi-Square
Yes, I drink coffee 57.6 42.4 100 0.498
No, I do not drink coffee 58.8 41.2 100
Total 57.8 42.2 100
Italy Portugal Total Chi-Square
Yes, I drink coffee 54.8 45.2 100 0.384
No, I do not drink coffee 49.2 50.8 100
Total 53.8 46.2 100
Below or equal to Above Student’s
Total
average age average age t-test
Yes, I drink coffee 58.4 41.6 100 0.06 *
No, I do not drink coffee 67.8 32.2 100
Total 60.1 39.9 100
Without With
Total Chi-Square
academic degree academic degree
Yes, I drink coffee 28.3 71.7 100 0.146
No, I do not drink coffee 36.1 63.9 100
Total 29.6 70.4 100
Habits of coffee consumers **
Where—
Where—at home Where—at bar/café/coffee house
at workplace
74.5 51.4 39.7
When–
When—at breakfast When—after a meal (lunch/dinner) -midmorning/ When—Other
afternoon breaks
74.1 54.8 54.1 5.2
Note: * Significant at p < 0.10, ** Percentages were calculated for coffee consumers. Consumers could tick more than
one proposed habit.
4.1. Emotions Evoked by Coffee Consumers
Consumers drinking coffee have a mix of emotions (Figure 2). They feel active, comfortable,
motivated, productive, and satisfied. The country-focused analysis supported that Portuguese
consumers have more intense emotions compared to Italian consumers when drinking coffee. There was
a limited number of emotions significantly different among countries. Negative emotions, such as
being worried, annoyed, bored, disgusted, grouchy, and off-balanced, were similar. Positive emotions
differed more notably, in particular when consumers feel enjoyment, merry, productive, satisfied,
and special. The research aimed at exploring whether emotions merge into a limited number of
latent factors that may effectively express the array of various feelings (Table 3). Overall consumers’
emotions can be summarised into five main feelings: (i) annoyance: consumers feel annoyed, bored,
disgusted, grouchy, off-balanced, and worried. These feelings were perceived similarly in Italy and
in Portugal. Yet, consumers tend not to have negative feelings when drinking coffee (average value:
1.60); (ii) enjoyment: consumers feel free, enjoyed, pleased, special and warm. The level of enjoyment
is limited (average value: 2.77); (iii) self-fulfilment: emotions of fulfilment, relaxation, soothing were
perceived similarly in Portugal and Italy, and this factor has limited significance for consumers (average
2.96). The last two factors are the most notable for consumers. When drinking coffee, consumers tend
to feel comfortable (average 3.10) and active (3.54). Feeling comfortable (main feeling iv) means being
balanced, comfortable, and satisfied, and being active (main feeling v) is a mix of emotions including
feeling active, motivated, and productive.Sustainability 2020, 12, 5694 10 of 23
Sustainability 2020, 10, x FOR PEER REVIEW 10 of 24
Figure 2. Emotion ratings of coffee consumers in Italy and Portugal. Note: Black: Portuguese
Figure 2. Emotion
consumers; ratings
Grey line: Totalofconsumers;
coffee consumers
Light grey in Italy
line: and
Italian Portugal.* p-value
consumers. of t-test Portuguese
Note: Black: testing
with p-value
consumers; Greyequal
line:orTotal
below 0.001, aimedLight
consumers; to compare Italian
grey line: and Portuguese
Italian consumers.emotion ratings.
* p-value of t-test testing
with p-value equal or below
Table0.001, aimed
3. Factor to compare
analysis Italian
of emotions and Portuguese
of coffee consumers. emotion ratings.
TableAnnoyance Enjoyment
3. Factor analysis Self-fulfilment
of emotions Comfortable
of coffee consumers. Active
Annoyed 0.865
Bored Annoyance
0.820 Enjoyment Self-fulfilment Comfortable Active
Annoyed
Disgusted 0.865
0.804
Bored
Off-balanced 0.820
0.785
Disgusted
Worried 0.804
0.764
Off-balanced
Grouchy 0.785
0.763
Cronbach’s α
Worried 0.914
0.764
Free Grouchy 0.763 0.877
Cronbach’s α
Enjoyed 0.914 0.763
Warm Free 0.877
0.745
Enjoyed
Special 0.763
0.732
PleasedWarm 0.745
0.648
JoyfulSpecial 0.732
0.603
MerryPleased 0.592
0.648
α
Cronbach’sJoyful 0.926
0.603
Merry
Fulfilled 0.592 0.746
Cronbach’s α
Relaxed 0.926 0.738
SoothedFulfilled 0.746
0.655
Cronbach’s α
Relaxed 0.738
0.805
Soothed 0.655
Cronbach’s α 0.805
Comfortable 0.798
Peaceful 0.698
Balanced 0.690
Satisfied 0.617
Cronbach’s α 0.796
Active 0.833
Productive 0.781Sustainability 2020, 12, 5694 11 of 23
Table 3. Cont.
Annoyance Enjoyment Self-fulfilment Comfortable Active
Comfortable 0.798
Peaceful 0.698
Balanced 0.690
Satisfied 0.617
Cronbach’s α 0.796
Active 0.833
Productive 0.781
Motivated 0.567
Cronbach’s α 0.809
Variance explained (%) 18.95 18.32 14.04 10.24 7.60
Average 1.60 2.77 2.96 3.10 3.54
Std. Deviation 0.83 1.22 1.17 1.02 1.04
Convergent validity and discriminant validity
Annoyance Enjoyment Self-fulfillment Comfortable Active
Annoyance 0.641
Enjoyment 0.829 0.510
Self-fulfilment 0.064 −0.320 0.510
Comfortable 0.257 −0.653 0.040 0.501
Active 0.057 −0.295 0.796 0.233 0.541
CR 0.914 0.877 0.756 0.722 0.775
“Extraction Method: Principal Component Analysis. Rotation Method: Varimax with Kaiser Normalisation.” Note:
Diagonal data (in italics) represent Fornell and Larcker’s average variance extracted (AVE). Sub-diagonal figures
represent the inter-construct correlations. Total variance explained: 69.15%.
4.2. Coffee Consumers’ Emotions and Habits of Coffee Consumption
The research study explored the relationships between the identified main emotions and
habits of coffee consumption (Table 4). There was no difference between the level of active,
comfortable, self-fulfilment, and enjoyment emotions between low or high level of coffee consumption
(non-significant chi-square values). This means that all coffee consumers feel active, comfortable,
self-fulfillment, and enjoyment when drinking coffee with no difference depending on the quantity of
coffee usually consumed. Coffee consumers that drink a higher quantity of cups of coffee feel more
comfortable (chi-square value: 0.098) when drinking coffee, compared to those that drink fewer cups
of coffee. Results support that the sense of comfortableness is more intense among high-frequency
coffee consumers.
The research explored the relationships between the level of emotions and the different places and
occasions of coffee consumption (Table 5). Consumers that feel mostly comfortable and active tend
to equally drink coffee at home, outside, and at the workplace. The vast majority of the people that
feel annoyed feel these emotions wherever they are, at home, outside, and at the workplace. Results
support that the place of consumption does not influence the feelings, as the same feeling will be
perceived in all places. Consumers feel comfortable and active anywhere they drink.Sustainability 2020, 12, 5694 12 of 23
Table 4. Relationships between emotion rating and quantity of coffee consumed (%).
Below Moderate Moderate or Above Total Chi-Square
Annoyance
Equal to or below 3 cups coffee/day 60.4 39.6 100 0.434
Above 3 cups coffee/day 58.0 42.0 100
Total 60.0 40.0 100
Enjoyment
Equal to or below 3 cups coffee/day 52.9 47.1 100 0.514
Above 3 cups coffee/day 52.0 48.0 100
Total 52.8 47.2 100
Self-Fulfilment
Equal to or below 3 cups coffee/day 47.9 52.1 100 0.194
Above 3 cups coffee/day 40.0 60.0 100
Total 46.6 53.4 100
Comfortable
Equal to or below 3 cups coffee/day 51.3 48.8 100 0.098 *
Above 3 cups coffee/day 40.0 60.0 100
Total 49.3 50.7 100
Active
Equal to or below 3 cups coffee/day 23.6 76.4 100 0.197
Above 3 cups coffee/day 16.7 83.3 100
Total 22.4 77.6 100
Note: * Significant at p < 0.01; Emotion rating: Below moderate when below 3; Moderate or above when equal and
above 3. The scale adopted was “1: not at all”, “2: slightly”, “3: moderately”, “4: very”, and “5: extremely” [36].
Table 5. Relationship between emotion rating and place and occasion of coffee consumption (%).
Where:
Where: at Home Where: Workplace
at Bar/Café/Coffee House
Low Medium/High Low Medium/High Low Medium/High
Total Total Total
Level Level Level Level Level Level
Annoyance 67.4 32.6 100 66.4 33.6 100 60.9 39.1 100
Enjoyment 50.9 49.1 100 53.7 46.3 100 52.2 47.8 100
Comfortable 47.7 52.3 100 40.3 59.7 100 46.1 53.9 100
Active 32.9 67.1 100 32.9 67.1 100 34.8 65.2 100
Self-fulfilment 43.5 56.5 100 47.7 52.3 100 52.2 47.8 100
When: after a meal When: midmorning/afternoon
When: at breakfast
(lunch/dinner) breaks
Low Medium/High Low Medium/High Low Medium/High
Total Total Total
level level level level level level
Annoyance 62.8 37.2 100 61.6 38.4 100 61.1 38.9 100
Enjoyment 52.6 47.4 100 50.3 49.7 100 53.5 46.5 100
Comfortable 46.5 53.5 100 50.3 49.7 100 46.5 53.5 100
Active 35.8 64.2 100 38.4 61.6 100 33.8 66.2 100
Self-fulfilment 45.1 54.9 100 47.8 52.2 100 50.3 49.7 100
Furthermore, the research explored how the main feelings differ in the various occasions of coffee
consumption; that is, at breakfast, after a meal, and during breaks (Table 6). Consumers feeling mostly
comfortable and active feel similarly in all contexts. Consumers feeling annoyed also perceive this
emotional status during all occasions of consumption. Results support that the level of main feelings
consumers have when drinking coffee does not differ significantly in the different places and occasions
of coffee consumption.Sustainability 2020, 12, 5694 13 of 23
Table 6. Motives for drinking coffee in relation to country, gender, age.
Below the Above the
Total Italy Portugal Women Men
Average Age Average Age
Mean SD Mean SD Mean SD Mean SD Mean SD Mean SD Mean SD
I like the taste 4.0 1.9 4.0 1.9 3.9 1.6 4.1 1.0 3.9 1.0 3.9 1.1 4.1 1.0
Good for health 2.0 1.3 1.8 1.8 2.1 1.2 2.4 1.1 2.2 1.1 2.2 1.0 2.5 1.2
Makes me alert 3.7 0.4 3.7 0.4 3.6 0.5 3.8 1.1 3.5 1.3 3.8 1.2 3.5 1.2
Part of a personal habit 3.7 0.3 3.7 0.3 3.6 0.4 3.9 1.1 3.5 1.3 3.5 1.2 4.0 1.1
Family food tradition 2.6 0.5 2.6 0.4 2.6 0.5 2.8 1.4 2.5 1.4 2.5 1.3 2.9 1.5
A way to socialize 3.1 0.4 3.0 0.3 3.2 0.4 3.3 1.3 2.8 1.3 2.9 1.2 3.3 1.5
Improves my mood 3.1 1.0 3.0 0.9 3.2 1.1 3.4 1.3 2.7 1.3 2.9 1.2 3.4 1.5
Helps me reduce headaches or manage blood pressure 2.5 1.2 2.7 0.8 2.5 1.2 2.9 1.4 2.0 1.3 2.4 1.4 2.7 1.5
Note: Question open to consumers drinking coffee. The question asked was: Which are the motives that make you drink coffee? Consumers selected the level of importance of each of the
proposed items on a 5-point Likert scale (from 1 = not at all important, to 5 = extremely important).Sustainability 2020, 12, 5694 14 of 23
4.3. Consumers’ Motives for Drinking and Not Drinking Coffee
The research explored what the main motives are for drinking (Table 6) and not drinking coffee
(Table 7). Findings support that the main motives for drinking coffee are the taste, sense of alertness,
and habit. The least important motive is the belief that coffee is good for health. Motives are
similar in Italy and Portugal. In Portugal, consumers associate coffee with socialisation and mood
improvement. Moreover, there are some significant difference in terms of gender and age. Women
and older people drink coffee as a personal habit, to socialise, to improve the mood. In addition,
women appreciate coffee for reducing headaches, and older people drink it because it is a family food
tradition. Results support that taste, sense of alertness, and habit are the key aspects of coffee drinking
across country, gender, and age levels. Women and older people approach coffee drinking similarly,
and there were no significant differences between the two countries analysed. Results support that the
most common motives for not drinking coffee are the taste, habit unfamiliarity, and because coffee
increases nervousness. Beliefs that it can be bad for health, anxiety, and insomnia stimulation are not
perceived as valid motives for not drinking coffee. The motive of taste dislike was more relevant in
Italy, among women, and, in particular, among younger respondents. Coffee unfamiliarity was more
relevant in Italy, men, and, in particular, among younger respondents.
Table 7. Motives for not drinking coffee in relation to country, gender, age (%).
% On Below Above
Coffee the the
Italy Portugal Total Women Men Total Total
Non- Average Average
Consumers Age Age
Do not like the taste 52.5 56.3 43.8 100 58.6 41.4 100 75.0 25.0 100
The doctor told me not to drink 9.8 33.3 66.7 100 50.0 50.0 100 50.0 50.0 100
Bad for health 6.6 75.0 25.0 100 0 100 100 25.0 75.0 100
Bad for anxiety 4.9 66.7 33.3 100 33.3 66.7 100 66.7 33.3 100
Increases nervousness 14.8 44.4 55.6 100 57.1 42.9 100 33.3 66.7 100
Stimulates insomnia 8.2 60.0 40.0 100 40.0 60.0 100 60.0 40.0 100
Not a personal habit 29.5 55.6 44.4 100 43.8 56.3 100 93.8 6.3 100
Note: Question open to consumers not drinking coffee. The question asked was: Which are the motives that
make you not drink coffee? Consumers selected yes/no to each question item. Other reasons: Intolerance, Allergy,
Dizziness, Breastfeeding, Tachycardia, Nausea, Stomach problems.
4.4. Focus on Health as an Element that Favours or Hinders Coffee Consumption
Consumers’ perception of coffee healthiness is a complex issue. The present research results
support that consumers believe coffee is not good for health, but that is not the main reason for
not drinking it. This result was confirmed across socio-economic characteristics of consumers.
Thus, this study explored to what extent the reasons for coffee (un)healthiness differ across countries
(Table 8). Results support that countries of belonging is a significant variable (Student t-test: Levene’s
test, F= 3.068, p = 0.07, 95% CI), and most Portuguese consumers believe coffee is good for health (52.9%),
whereas most Italian consumers (68.4%) believe is not good for health. Negatively inclined consumers
believe that coffee is not good for health because it increases blood pressure and risk of cancer, and it
contains caffeine and other components. Positively inclined consumers believe that coffee is good for
health because it decreases the risk of stress, anxiety, depression, headache, and cardiovascular diseases,
because it comes from a plant, and because it contains caffeine. The vast majority of consumers may
be interested in a health-claimed coffee (72.6% with non-significant chi-square values among the two
countries). The same reasons may lead the consumers to believe in coffee healthiness and unhealthiness.
This supports that consumers are confused or have misconceptions.Sustainability 2020, 12, 5694 15 of 23
Table 8. Consumers’ perception of coffee healthiness (%).
Student
Do You Think Coffee is Good for Health? (i) Total Italy Portugal
t-Test
Yes, coffee is good for health 42.4 31.6 52.9 0.07 *
No, coffee is not good for health 57.6 68.4 47.1
Total 100 100 100
Reasons why coffee is not good for health (ii): Total (a) Italy (b) Portugal (b) Total
Drinking coffee, even in moderated quantities,
18.2 69.7 30.3 100
increases blood pressure
Drinking coffee, even in moderated quantities,
1.7 66.7 33.3 100
increases the risk of cancer
Because of its caffeine content 27.8 67.3 32.7 100
Because of other coffee components 3.6 61.5 38.5 100
Because of the processes to which the beans are
4.4 56.3 43.8 100
subjected (e.g., roasting)
Because drinking coffee, even in moderated quantities,
negatively influences the absorption of calcium and 1.9 42.9 57.1 100
minerals
I do not know 10.2 55.6 44.4 100
Reasons why coffee is good for health (iii): Total Italy Portugal Total
Because it is a natural product 19.8 45.8 54.2 100
Because it comes from a plant 9.4 55.9 44.1 100
Because it contains caffeine 11.6 40.5 59.5 100
Because regular consumption of moderate quantities
15.4 39.3 60.7 100
of coffee decreases the risk of stress and anxiety
Because regular consumption of moderate quantities
16.8 44.3 55.7 100
of coffee decreases the risk of depression and headache
Because regular consumption of moderate quantities
17.1 45.2 54.8 100
of coffee decreases the risk of cardiovascular diseases
I do not know 6.9 48.0 52.0 100
Would you be interested in a health-claimed coffee (iv)? Total Italy Portugal Chi-square
Yes 72.6 71.0 75.5 0.428
No 27.4 29.0 24.5
Total 100 100 100
Note: (i) Scale from 1: unhealthy, to 5: healthy, the answers were grouped in 1 toSustainability 2020, 12, 5694 16 of 23
5.1. Emotions Evoked by Coffee Consumers
The current research results support that coffee drinking impacts some emotions. In particular,
it makes consumers feel comfortable and active. There are limited effects on enjoyment and
self-fulfilment, and coffee drinking does not annoy. Coffee drinking brings a sense of wellbeing and
dynamism experienced in different contexts and occasions of consumption. This confirms past research
studies’ findings [7,17,35,44]. Moreover, coffee drinking may stimulate different emotions in the different
countries. Portuguese consumers significantly value coffee’s capability of improving personal mood
and socialisation. They have stronger emotions evoked by the coffee drinking experience, compared
to Italian consumers. Portuguese respondents pointed out emotions of satisfaction, productivity,
motivation, comfort, activity. These lead to higher pleasure and improvement of humour. Consistently
with great interest towards the alertness given by coffee, Italian respondents mostly feel active, fulfilled,
satisfied, and productive, indicating a general association of coffee with energy and contempt.
5.2. Motives for Drinking and Not Drinking Coffee
The results support the key role of taste in coffee consumption and non-consumption, as from
previous studies [20,24,28], in both countries. Taste is a double-edged sword, as it is the main factor
pushing and limiting consumers towards drinking coffee. This finding is consistent with a previous
study that highlighted the peculiarity of coffee consumption behaviour compared to a number of other
caffeinated beverages [13], and another study that identified the pleasure of drinking coffee for its
taste and smell, as the most important factors [25]. The current study supports that especially young
women do not appreciate the coffee taste. The other key factors for drinking and not drinking coffee
are habit and sense of alertness, as supported by both countries’ respondents. Past studies showed that
consumers drink coffee because it is a ritual or a daily routine [13], a tradition since childhood, and a part
of breakfast or a snack [24]. Coffee consumers perceive distinctive feelings and emotions with all their
senses [54]. Coffee is not an ordinary beverage [55], especially in Western countries [56]. The present
study supports that habit is a key driver for coffee drinking in Italy and in Portugal. Moreover, current
research supports past studies’ findings [55,57,58] on the relevance of alertness, energy, and awakening
effects among the key motives of coffee consumption. Both countries’ consumers confirmed this coffee
drinking motivation. In addition, habit unfamiliarity and the belief that coffee increases blood pressure
and nervousness are detrimental to coffee drinking [19,43]. The current study expands past knowledge
supporting that taste, sense of alertness, and habit are key factors across genders and age levels.
The current study confirmed that breakfast is the most important time of consumption in both
countries [55]. Coffee has an awakening power to face the day, and consumers usually drink two to
three cups per day. Favourite consumption places are home, coffee houses, and at work, with some
differences between the two considered countries. The Italian population mostly consumes coffee
at home. Out-of-home consumption is relevant among Portuguese consumers. The study results
confirm the relationship between coffee consumption frequency and emotions. High-frequency coffee
consumers intensely enjoy and are self-fulfilled by coffee drinking. These results are consistent with
studies supporting that drinking coffee improves mood and positive feelings [59].
5.3. Coffee Health Impact and Coffee Consumption Perception
The present study supports that consumers’ perception of the coffee health impact is a valuable
factor influencing consumer behaviour, with contradictory results. Positive health impact, such as
alertness and energy provided by coffee, are elements that favourably incline consumers towards
consumption. Negative heath impacts are key factors for not drinking coffee. One third of consumers
support that coffee is bad for health, bad for anxiety, increase nervousness, stimulates insomnia,
and doctors suggest not to drink it. This confirms past studies sustaining that factors such as being bad
for health and medical restrictions have a prominent role in explaining coffee non-consumption [24,28].
The current research expanded past knowledge confirming the existence of differences based on genderSustainability 2020, 12, 5694 17 of 23
and countries. Negative perception of coffee health impact is a significant factor for not consuming
coffee among older men, and Italian consumers [25].
The current research results complement past studies on coffee health impact. European consumers
are confused about the potential health effects of coffee, partly due to contradictory and not easily
accessible information (Institute for Scientific Information on Coffee ISIC). Past studies revealed that
only a fourth of the total examined population positively associated coffee with health, implying that
the beverage continues to be appreciated for reasons not attributable to its healthy properties [25].
The present study provides further information and supports that there are differences between
countries. Coffee drinkers and women were the two categories most interested in coffee’s health
benefits, while there were no differences based on age. Consumers’ beliefs about coffee healthiness and
unhealthiness overlapped. This supports consumers’ limited knowledge and understanding on this
issue. Negatively inclined consumers believed that coffee increases blood pressure and the caffeine
content is bad for health. Positively inclined consumers believed coffee is healthy because it is a plant,
a natural product, and it can decrease the risk of a number of health diseases. It is to be underlined
that many consumers reported not having a specific opinion, confirming the confusion on this topic.
Finally, the interest towards a health-claimed coffee confirmed past findings [25], and was found to be
positive for coffee and non-coffee drinkers. Women were particularly favourable, consistent with their
belief in coffee healthiness.
6. Conclusions
In the last 20 years, the global coffee market has undergone several changes, bringing coffee to be
today the second most traded commodity in the world after crude oil. Coffee production has increased
considerably as a response to higher demand, which has extended beyond traditional markets to
include new importing countries and exporting countries. Coffee consumption has experienced an
evolution, going from an industrial commodity to a specialty product, acknowledged as a unique
product differentiated for its origin and artisanal production methods. Drinking coffee has become an
exclusive experience. Coffee consumption behaviour cannot be understood only based on functional
motives. Emotions influence eating behaviour, and emotions are key elements in coffee consumption.
These perceptions influence consumers’ food behaviour and consequently their mood and emotions.
Also, coffee non-consumption behaviour is based on motives, and possibly also on misconceptions.
These may be addressed with a better understanding of coffee consumers’ emotions.
This research study provides both research-related and practical contributions. From a research
perspective, it provides evidence on coffee consumption emotions and habits, and on what motives
drive coffee consumption and non-consumption in different countries. The current exploration
contributes to the expansion of knowledge on the non-consumption food behaviour research field.
From a practical perspective, the increased knowledge provides a contribution to the coffee industry.
Coffee industry managers gain a better understanding of consumers’ functional and emotional needs,
and this may lead to a comprehensive product conceptualisation. Coffee is a beverage product
strongly embedded into personal and family traditions. The emotional attachment, perceptions,
and beliefs of the properties of this product need to be understood to develop a long-term strategy
to approach the coffee consumer and non-consumer. In an increasingly globalised market, strategies
need to be based on the understanding of different countries’ coffee consumers’ and non-consumers’
approaches. Understanding the functional needs, emotions, and perceptions of coffee consumers and
non-consumers can reorient the coffee industry to successfully promote innovative coffee products,
and possibly convey a coffee image that fits in with healthy eating behaviour.
6.1. Managerial Implications
The research results provide a set of information valuable to define coffee managerial strategies
and product conceptualisation. First, some consumers search feelings and sensations rather than
food products’ functional value. The food product should provide unique and involving experiences.You can also read