IMF RESEARCHSpring | Summer 2021 - Promise and Peril - Volume 24, Number
←
→
Page content transcription
If your browser does not render page correctly, please read the page content below

IMF RESEARCH
Volume 24, Number 1                       Spring | Summer 2021

                      Promise and Peril
                                                  resbulletin@IMF.org
CONTENTS
                                                      NOTE FROM THE EDITOR-IN-CHIEF
                                                                      Expert lexicographers behind the
                                                                      Oxford Languages’ Word of the Year
                                                                      campaign came to the conclusion that
                                                                      2020 was not a year that could neatly

01
                Global Economic Outlook                               be expressed in one single word.
                and Policy: Interview with                            Rather, 2020 deserved a report aptly
                                                      named Words of an Unprecedented Year. Economists
                Oya Celasun
                                                      have also adopted words new to their field, adding
                                                      the Great Lockdown to the list of the Great Depression

05
                                                      and the Great Recession. As the world emerges from
                Where are all the                     the traumas of COVID-19, concerns have grown that a
                GDP-Linked Bonds?                     two-track pandemic is leading to a two-track recovery
                                                      and that many countries will come out of the pandemic
                                                      with higher sovereign debt and potential scars, making
                                                      policy choices more difficult.

08              Fiscal Dominance in Sub-              The articles featured in this issue of the IMF Research
                                                      Perspectives offer insights on how we can navigate
                Saharan Africa Revisited
                                                      these uncertain and unprecedented times and
                                                      solve the puzzle of building back better by looking
                                                      at some questions that have occupied economists

12
                The Power of Government               long before the pandemic but have since then gained
                Spending when Interest                urgency. They focus on understanding the risk of fiscal
                Rates are Low                         dominance, getting the most bang for the buck in fiscal
                                                      policies when interest rates are low, improving sovereign
                                                      debt instrument design, incorporating mortality

15
                                                      dynamics into economic models, and supporting
                What Drives Innovation?               innovative solutions to new challenges through public
                Lesson from COVID-19                  involvement. After all, sometimes going back to basics
                Research and Development              is the simplest way to move forward. ~Deniz Igan

18              Understanding Lifelong
                Mortality
                                                                            IMF RESEARCH
                                                                EDITORS-IN-CHIEF
                                                                                    perspectives
                                                                                                             CONTRIBUTORS
                                                                   Deniz Igan                                 Ruchir Agarwal
                                                               Chris Papageorgiou                              Oya Celasun
                                                                                                               Patrick Gaule
                                                                ASSISTANT EDITOR
                                                                                                               John Hooley
                                                                   Patricia Loo
                                                                                                         Adriana Lleras-Muney
                                                              EDITORIAL ASSISTANT                            Giovanni Melina
                                                                 Tracey Lookadoo                             Flavien Moreau
                                                                                                              Francisco Roch
                                                          COVER, DESIGN, AND LAYOUT
                                                                                                            Francisco Roldán
                                                       IMF CSF Creative Solutions Division
                                                                                                                Mika Saito
                                                                                                        Shirin Nikaein Towfighian

                                                      IMF Research Perspectives—the IMF online bulletin with news on research—is a
                                                      biannual publication in English and is available exclusively online free of charge.

                                                      The views expressed are those of the author(s) and do not necessarily
                                                      represent those of the IMF or IMF policy. Material from this publication may

        SIGN UP!
                                                      be reprinted with proper attribution.

                                                      Editorial correspondence may be addressed to:
                                                          INTERNATIONAL MONETARY FUND
For new issues of IMF Research Perspectives and           Attn: Editor, IMF Research Perspectives
a variety of other IMF publications, sign up for an       700 19th Street, NW
electronic notification at IMF.org/external/cntpst.       Room HQ1 9-253
                                                          Washington, DC 20431
Individual issues are available at                        USA                                              ISSN 2708-3535
IMF.org/researchbulletin.                                      resbulletin@IMF.org                         DOI 10.5089/9781513585789.053

                                                                                                                                        i
Oya currently heads the Multilateral Surveillance      ABOUT YOU
Division in the IMF’s Research Department.
                                                       What attracted you to
Prior to that, she was the chief of the World          economics?
Economic Studies Division, which produces              My father was a professor of
                                                       macroeconomics; he was actually self-
the World Economic Outlook (WEO), between              educated. He had gradually shifted
2015 and 2019. She will soon be moving to the          from mining engineering, which he
                                                       studied as an undergraduate and PhD
IMF’s European Department to take on a new             student at Columbia University in the
role as the mission chief to Germany. In this          late 1950s, towards operations research
                                                       and then macroeconomics. I used to
interview with Deniz Igan, Oya tells us about          overhear him speaking to his students or
                                                       visitors from abroad—sometimes from
her journey as an economist and the process            the IMF and World Bank, staffers who
through which original research feeds into             would be asking him for his insights
                                                       on the state and outlook of the Turkish
the Fund’s assessment of the global economic           economy. I thought the issues were
outlook and policy recommendations.                    fascinating—closely connected to our
                                                       daily lives yet requiring sophisticated

IMF RESEARCH perspectives | IMF.org/researchbulletin                                         01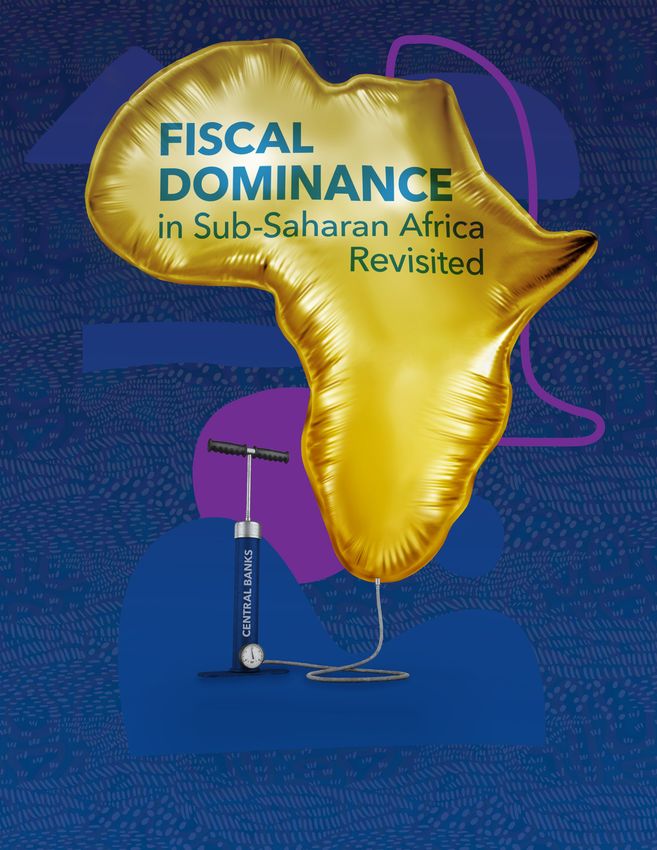
frameworks to understand and form a            Tell us a bit about your research             the time with very little analysis to it.
view on. I therefore studied engineering       interests. You have published on              He collected the data on projected versus
first (in my time, you did so if you could)    various topics, ranging from public           actual macroeconomic variables, sifting
and then moved on to graduate studies          debt sustainability, sovereign risk,          through more than a hundred IMF staff
in economics.                                  and corporate debt and inflation in           reports, and I did the analysis, which
                                               emerging market economies to the              showed that aid shortfalls induced cuts
Was working at the IMF always in               costs of unpredictable aid flows              in investment that were never made
your plans?                                    in low-income countries. What                 up by aid excesses. The Economist
                                               inspired you to look into these               dedicated an article to it shortly after
Not necessarily the IMF, but I was very
                                               questions?                                    we put it out.
much interested in policy institutions.
As I mentioned, I was curious about how        My background. At graduate school I was
economies end up at a given juncture,          drawn to working with Guillermo Calvo,        While the Research Department
what the policies that can put them at         who had done conceptual work on crises        has been your home base, you
a better place are, what the political         and open economy macro problems. My           have also had considerable field
economy constraints are to that. I also        thesis topic was inflation and disinflation   experience—in particular, as
grew up through repeated economic              policies—having lived through                 the mission chief to Uruguay in
and balance of payments crises in my           chronically high inflation for years in       2013–14 and as an economist for
own country and observed firsthand             Turkey. The sovereign risk and corporate      the US and Canada desks. How
how these crises affected people’s lives,      debt topic was inspired by work I did         has your research influenced
as did a lack of development (comparing        for Chile as a RES [IMF Research              your approach to identifying
my father’s country, Turkey, with my           Department] economist participating in        the critical issues facing these
mother’s country, Denmark). I also liked       an Article IV mission.                        countries and developing policy
the idea of working on different countries                                                   recommendations?
                                               My most original empirical work was
and understanding the differences better.      probably on aid predictability—a topic        Uruguay was one of the last few high-
So the IMF was very attractive.                my husband, also an economist, had to         performing emerging markets that had
                                               organize a conference on. He had a great      relatively high inflation (at 8–9 percent:
                                               idea about how to document the cost of        above target), so that was a natural fit
                                               unpredictable aid flows—a buzzword at         for me. I did some background work on

A quiet moment with family

IMF RESEARCH perspectives | IMF.org/researchbulletin                                                                                 02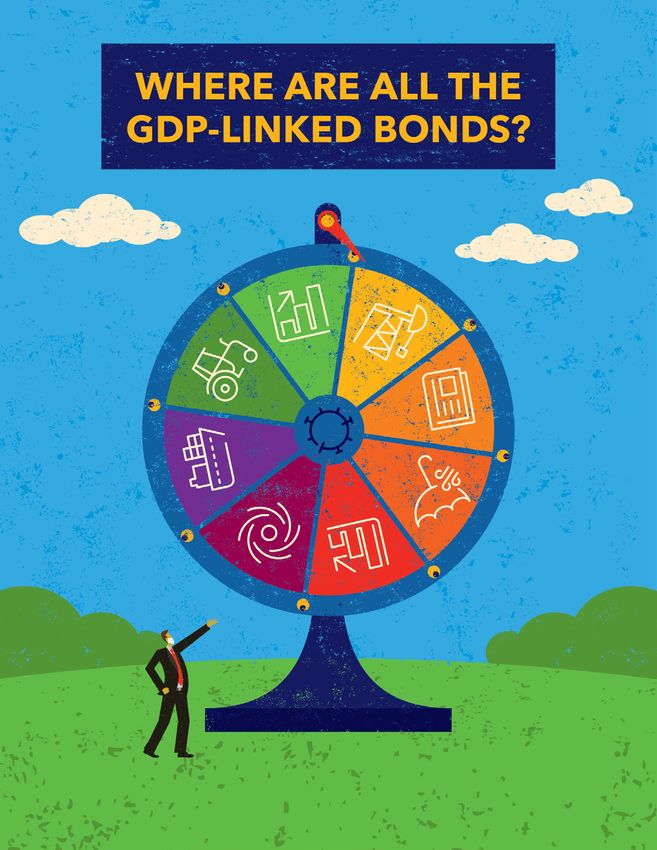
inflation on the US desk for projection        countries would be affected by adopting         counterparts on a particular
purposes as well; I remember that              policies to reduce emissions to net zero,       issue or influenced the agenda
I had found out that the Fed’s most            for instance, which we hope will provide        or approach to a problem?
trusted Phillips curve had very similar        input into discussions on how countries
                                                                                               In our field—especially multilateral
coefficients to mine! And some work            can cooperate and support each other in
                                                                                               surveillance—decisions are so complex
I did on the Islamic Republic of Iran on       stopping catastrophic climate change.
                                                                                               and decision makers so diffuse that it
inflation as a young economist in the
                                                                                               is hard to see the immediate impacts.
Economist Program (applying some               What are the most challenging                   But the strong policy response of many
techniques I learned in a course provided      aspects? What are the most                      countries to ease the burden of the
by the IMF’s Institute for Capacity            rewarding?                                      COVID crisis on people did benefit from
Development) was apparently on the
                                               It’s a truly busy division, and its agenda      all the work the Fund did to support
reading list of an econometrics course at
                                               is constantly expanding in the crisis           the idea. Desks and our economists
Oxford University—a research assistant
                                               environment. But it is rewarding to             did valuable work on tracking policy
I had worked with who then moved
                                               be so close to the main topics of the           responses, which has been a very useful
to do graduate studies there, Roxana
                                               day and have some influence on our              tool for the authorities in learning
Mihet, told me. So I guess I found a way
                                               messages. The most rewarding part               about what other countries are doing to
of working on what I knew more about
                                               is that it’s a very collaborative and           address the crisis. Another example—
and was interested in the countries
                                               easygoing team, despite the very busy           the work my colleagues in RESMS
I worked on here.
                                               work environment. And there is a sense          [Multilateral Surveillance Division]
                                               of collective learning.                         did on financial spillovers from major

YOUR CURRENT
                                                                                               central bank actions was cited often
                                               How, overall, has the Fund                      in the IMFC [International Monetary

WORK                                           contributed to the recovery from
                                               COVID-19? Can you give specific
                                                                                               and Financial Committee] plenary and
                                                                                               G7-G20 meetings at the 2021 Spring
Tell us about what the Multilateral            examples where you noticed that                 Meetings—suggesting that we were able
Surveillance Division does,                    results from your (and colleagues’)             to provide a thought framework for the
especially how it plays an important           research convinced your                         policy discussion.
role in an environment where
global cooperation is most needed.
One of the Division’s tasks is to support
the Finance Track of the G20—which
brings together finance ministers and
central bank governors. You write
reports that set out the issues that
IMF staff think they should be working
on jointly. In other words, you contribute
to their agenda. Such cooperation is
always needed, but it is especially
vital during crises.
Another item is the analysis and
coordination of Fund work on cross-
border spillovers. This is right at the
heart of the Fund’s core mandate,
and something that the institution is
uniquely placed to do. In fact, at the G20
Framework Working Group meetings
(which is a group of Finance Ministry
and central bank staffers), we are always
asked what the spillover effects of
individual members’ policies are.
Finally, we have started an agenda
on climate change, which is the
international coordination problem par
excellence. Our work shows how different
                                               Multilateral Surveillance Division get together after 15 months of working from home.

IMF RESEARCH perspectives | IMF.org/researchbulletin                                                                                   03
THE FUTURE                                     Looking ahead, what are the key
                                               economic issues we need to do
                                                                                          I have a good sense of how much
                                                                                          interaction and communication between
Needless to say, 2020 was an                   more work on? Are the existing             teams and departments it takes to
extraordinary year: not only did               tools enough to tackle them?               achieve internal consistency, and the
it upend lives around the world                Are there areas where going                value that has for the quality of the
but it also posed a new challenge              back to basics could still provide         global and individual country forecasts.
for many in the economics                      valuable insights?                         Working with the G20 Framework
profession. Terminology like                   I think inequality had already become      Working Group made me realize how
“nonpharmaceutical interventions”              the most pressing issue before the         interested country authorities are in
and SIR (susceptible–infectious–               pandemic, and the problem has only         learning from each other’s approaches to
recovered) models embedded in                  deepened and become more visible.          addressing economic problems, and how
macroeconomic models quickly                   The crisis has revealed how people’s       uniquely placed the Fund is to compile
became common in economics                     resilience to shocks varies greatly—       experiences and distill policy lessons for
publications. How has your                     many people have no financial buffers      the benefit of all its members. A great
work adapted? Any lessons for                  to deal with setbacks, and what could      example is the COVID-19 Policy Tracker,
remaining agile if we’re faced with            seem temporary losses get handed down      initially developed in the Strategy and
another nontraditional shock?                  across generations in the form of lost     Policy Review Department by a team led
It’s all about being curious, putting in       opportunities. I think distributional      by Vladimir Klyuev, and later extended
the hours, and talking to people who           consequences, and in particular how        by a team in RESMS. But the biggest
know about the topic much more than            lower-income groups are affected by        contributors to these efforts are the
you do. And being clear about your             policies and shocks, have to be an         country desk economists. Knowing
assumptions. Being very connected to           inseparable part of all macroeconomic      the value such information has for our
the most pressing immediate policy             and financial analysis. The basic          members will be a useful perspective
issues, we do early work that we know          representative agent tools and thinking    to have when I join an area department
is not the final word on the issue, but        are not adequate; it is good to see that   team, I think.
work that moves the discussion forward.        macro analysis has shifted towards
That means that you have to be very clear      models that incorporate heterogeneity      Any advice for aspiring
about your assumptions.                        across agents. Also becoming more          economists?
                                               mainstream is micro data analysis to
The economists I worked with were                                                         There are no set rules, and you have
                                               better understand the macro picture.
indeed very agile and were not afraid                                                     to chart your own course. Working
to do early-stage work. Three of them                                                     on what you are most interested in
                                               What are the key takeaways                 and with people you can learn from
produced some very nice work in the
                                               from your time working on the              is a great career strategy. Also, try to
initial several weeks on the size of the
                                               WEO and supporting the G20 for             maintain a longer-term vision of who
most affected contact-intensive sectors
                                               your new role as the mission chief         you want to be and what you want to
in the G20 and looked at scenarios of
                                               to Germany?                                contribute to. What exactly you do in
how much national income would be
lost—and the importance of tourism             As you know, a lot of attention gets       a given year during your first several
across the membership. One economist           devoted in the WEO process to make         years and how quickly you reach a
worked with an interdepartmental team          sure that the country forecasts are        given milepost is not as important
to use SIR models to study macro policy        mutually consistent. The German            as it may seem.
questions during the pandemic. Another         economy is large and tightly connected     Finally, be open to trying new things
economist is now looking at how many           through trade with many other              in the early years. The job you seem the
lives can be saved globally with more          economies, so forecasts for Germany’s      least equipped for may have the most
equitable vaccine distribution.                GDP and external sector matter for the     to offer in terms of what you can learn.
                                               regional and global growth forecasts.

IMF RESEARCH perspectives | IMF.org/researchbulletin                                                                                 04
Francisco Roch     Francisco Roldán
   froch@IMF.org      froldan@IMF.org

I
n response to the COVID-19
Figure 1. Update of World Economic Outlook June 2020
pandemic, most economies have
Global Great
implemented large fiscal stimulus WWI WWII Financial Crisis Lockdown
140
programs that pushed public debt
to historic highs (Figure 1). This
120
development has revived interest in
proposals for state-contingent debt Advanced economies
100
instruments as a strategy to reduce
the likelihood of future costly debt 80
crises. The idea has been around for a
while and is quite neat in theory: state- 60
contingent debt instruments allow a
sovereign issuer to reduce payments 40
when times are bad and, hence, offer
many benefits. These instruments 20 Emerging market economies
decrease default risk, reduce the
cyclicality of fiscal policy, and improve 0
risk sharing.
1880
1884
1888
1892
1896
1900
1904
1908
1912
1916
1920
1924
1928
1932
1936
1940
1944
1948
1952
1956
1960
1964
1968
1972
1976
1980
1984
1988
1992
1996
2000
2004
2008
2012
2016
2020
Despite these well-understood
advantages, state-contingent debt Sources: IMF, Historical Public Debt Database; IMF, World Economic Outlook; Maddison
instruments are rare in practice, and Project Database; and IMF staff calculations.
countries have not been able to issue
them at a reasonable premium. For refers to many standard economic miss some unknown unknowns—could
instance, the premium on the GDP models’ inability to explain the high affect the desirability of issuing state-
warrants that Argentina issued as part premium on a diversified portfolio contingent debt instruments.
of its 2005 debt restructuring, after of equities over that of “risk-free”
We evaluate prices and welfare
taking out default and liquidity risk, government securities—and helps
effects of state-contingent debt using
was estimated to be as wide as 1,200 explain why these instruments have
a standard quantitative model of
basis points at issuance and to have had limited success so far. The
sovereign debt and strategic default,
declined to a still-high 600 basis points. hindrance may well reflect not what
augmented with international lenders
Similar premiums are estimated for the investors know they don’t know but
with a preference for robustness to
GDP-linked bonds issued by Greece in rather what investors do not know
model misspecification. These lenders
2012 and by Ukraine in 2015 (Kim and that they do not know. Under rational
have in mind a statistical model to
others 2021). This is often interpreted expectations, lenders know that the
evaluate future outcomes, but do not
as a premium for “novelty”—investors realization of future GDP is uncertain,
trust it fully. Therefore, they consider
demand a premium because they are but they fully understand the single
alternative possible models and seek
not familiar with the instruments. But, probability distribution governing
actions that would perform well under
if so, why would this premium remain the possible outcomes. This notion of
all of these alternative models.
high even a decade and a half after risk, or uncertainty, within the model
issuance, giving investors plenty of time is the typical uncertainty considered For the commonly used threshold
to get familiar with the instruments in in macroeconomics. Alternatively, we state-contingent bond structure (for
question? Surprisingly, there is little consider investors who mistrust their example, the GDP-linked warrants
theoretical analysis of the reasons forecasting model and consider the issued by Argentina in 2005, Greece in
behind these premiums, and the possibility that their forecasts may be 2012, and Ukraine in 2015 pay only when
lack of indexation in sovereign debt biased in some unknown direction. GDP growth meets a certain threshold),
markets remains puzzling. They entertain different models that are there is an “ambiguity” premium in bond
statistically close to their baseline model spreads that can explain most of the
and could also fit the data reasonably residual labeled as novelty premium.
WHY ARE STATE-
well. This type of uncertainty applies As investors seek robust decision rules
CONTINGENT BONDS PRICED
for instance when data are limited or that perform well under all known and
SO UNFAVORABLY?
when investors fear that some of the unknown unknowns, they act as if the
In a recent IMF working paper, we probability of bad states is higher and
model ingredients are not correct but
propose a framework to rationalize demand compensation for holding
are only approximations. We analyze
the observed unfavorable prices of bonds that do not pay when times
how lenders’ concern about model
state-contingent debt instruments. are bad. This additional premium
misspecification—that models may
The framework is based on a resolution source leads to welfare losses for
of the equity premium puzzle—which the issuing sovereign.
IMF RESEARCH perspectives | IMF.org/researchbulletin 06
ROBUST INVESTORS HAVE A key insight from our research is that level of GDP the stipulated repayments
A DISTORTED VIEW OF the design of state-contingent bonds optimally designed for each type of
THE WORLD influences how robust lenders distort lender. Regardless of the degree of
When investors have concerns about their forecasts. Our results suggest robustness, optimally designed debt
model misspecification, they may that events that are very unlikely always promises higher payments
consider alternative probability models will probably remain unlikely after when GDP is high, effectively sharing
that are difficult to distinguish from disturbances that are statistically difficult the country’s risk with its lenders.
their main forecasting model with to detect. By contrast, likely events offer This feature is dampened as lenders
limited data. How large a distortion much more scope for the distortion become more robust. When lenders
they consider measures the lack of trust of their probability of occurrence. fully trust their model (and are no
in the main model. Now, depending The types of bonds countries have issued longer concerned with robustness),
on which actions they plan to take in the past stipulate non-repayment with they are willing to provide insurance to
(for example, purchasing the state- high probability (that is, the government the country by allowing zero payments
contingent bond of a certain country), would pay only in relatively good times) in a large range of (low) GDP values,
some of this unease will lead to worse and thus are particularly sensitive to compensated by high payments when
expected payoffs. To address the lack probability distortions. As a result, these the country does well. But when they
of trust in the model, they may then instruments are ultimately priced by do not trust their model and want to
want to use the worst-case forecast to models in which non-repayment is much guard against misspecification, lenders
price bonds. This would support an more likely, inducing the large spreads prefer bond structures that offer more
investment strategy that is robust to we see in the data. security. They value not having to stand
specification errors. by their forecast when they have little
DESIGN MATTERS faith in it. Moreover, when robustness is
For example, if robust investors are extreme, the government would like to
considering the purchase of a bond With rational expectations, modifying
minimize the contingency in stipulated
that pays only if the country’s GDP a bond structure in a way that keeps
repayments. But ex post default risk also
surpasses a particular threshold, expected repayments the same does
gives rise to contingency. Therefore,
they will look very closely at how they not affect its price. With robustness,
for bad states, the government
forecast GDP. When they price the bond however, variation in expected
promises as much as it can credibly
using the worst-case model, robust repayment enables different probability
commit to repay. In contrast to the
investors overestimate the probability distortions. These then feed into
commonly used threshold bond, the
of low-repayment scenarios. Under the ambiguity premiums and contribute to
optimal design generates substantial
worst-case distribution, GDP will fall higher spreads.
welfare gains, although these gains are
short of the threshold more often than The optimal design of state-contingent decreasing with the level of robustness.
under the baseline. In this sense, the debt depends on the investors’ degree
investors are endogenously pessimistic. of robustness. Figure 2 shows at each CONCLUSION
Robustness helps explain the prices
Figure 2. Optimal Debt Design of state-contingent debt. We link the
45 typical design of these instruments to
noncont. their prices: thresholds in good times,
40 with no payments whatsoever for a
35 Robustness large share of possible contingencies,
are particularly susceptible to the
(in % of GDP in baseline)
Stipulated repayments
30 High probability distortions (or endogenous
pessimism) of robust lenders.
25
Our model calibrated to data with
20 noncontingent debt can account only
for the prices of state-contingent bonds
15
issued by Argentina in its 2005 debt
10 restructuring. Our findings account
for the scant use of these instruments
5 Low in practice and shed light on their
0 optimal design. This provides valuable
-45 -36 -27 -18 -9 0 9 18 27 36 45 50 lessons as interest in these instruments
GDP (in % deviation from baseline forecast, over 5 years) peaks again with governments around
the world facing higher debt and
Sources: Authors’ calculations. an uncertain economic outlook due
Note: noncont. = noncontingent. to COVID-19.
IMF RESEARCH perspectives | IMF.org/researchbulletin 07
John Hooley       Mika Saito       Shirin Nikaein Towfighian
jhooley@IMF.org   msaito@IMF.org    snikaeintowfighian@IMF.org
Economists and policymakers often warn of the dangers of direct central bank
financing of governments, and history provides no shortage of cautionary
tales. Many hyperinflation episodes have been associated with central bank
financing of government debt: Weimar Germany (1922–23), Hungary (1945–46),
Greece (1941–45), and Latin America during the 1980s debt crisis, to name a
few. In recognition of the economic risks, many countries impose legal limits on
central bank lending to government, specified in their central bank legislation.

I
  n the wake of the COVID-19 pandemic, government                             In sub-Saharan Africa unsustainable fiscal deficit financing
  borrowing from their central banks to finance deficits or                   by central banks has been a particularly pressing problem
  debt has returned to the forefront of the policy debate as                  and led to stark episodes of hyperinflation in Angola, the
many countries face the challenge of additional budgetary                     Democratic Republic of the Congo, and Zimbabwe. The
pressure in an environment of high debt. Yet there                            incidence of central bank lending to government has also
has been limited empirical research on the incidence,                         been much higher in the region than elsewhere (Figure 1),
magnitude, and impact of central bank financing of                            amounting to 2 percent of GDP on average during 2001–
government deficits beyond the most extreme episodes of                       17, compared with less than ½ percent in other regions.
hyperinflation. Instead studies of central bank government                    Strikingly, in four sub-Saharan African countries, this ratio
relations have tended to focus on the much broader                            exceeded 10 percent of GDP. And after declining in the
question of central bank independence.                                        first part of the past decade, it has started to pick up again
                                                                              since 2014, coinciding with a rise in deficits and debt.

Figure 1. Central Bank Financing (Central Bank Financing is highest in sub-Saharan African countries.)

5.0                                             Central Bank Loans to Central Government
                                                         (Median, percent of GDP)
4.5
4.0
3.5
3.0
2.5
2.0
1.5
1.0
0.5
  0
        2001    2002     2003         2004   2005   2006    2007       2008   2009   2010     2011    2012   2013     2014     2015     2016     2017

                East Asia & Pacific            Europe & Central Asia            Latin America & Caribbean           Middle East & North Africa
                North America                  South Asia                       Sub-Saharan Africa

Sources: IMF, International Financial Statistics; IMF, World Economic Outlook; and IMF staff calculations.

IMF RESEARCH perspectives | IMF.org/researchbulletin                                                                                                09
Figure 2: Legal Limits in Sub-Saharan Africa (Legal limits have become stricter over time.)
20
Legal Limits, 2001–2017
(in percent of revenue)
18
16
14
12
10
8
2001 2002 2003 2004 2005 2006 2007 2008 2009 2010 2011 2012 2013 2014 2015 2016 2017
Mean Median
Sources: IMF, Central Bank Legislation Database; IMF, World Economic Outlook; national authorities; and IMF staff calculations.
Because of the prevalence of central bank lending to fluctuations in revenue in economies where alternative
government in sub-Saharan Africa, the question of whether market financing options may be sparse and shocks
(or how much) to restrict it has been a prominent feature of relatively frequent. The limits are set somewhat higher
debates on central bank reform. Moreover, COVID-19 has in sub-Saharan African countries than in other regions,
renewed pressure on some central banks to permit direct but still permit only modest and temporary central bank
financing of government as financing constraints have lending to government.
started to bite. To take a step toward filling the gap in the In practice, however, lending by central banks to
literature on these questions, recent IMF research revisits government in the region has not been modest and
the evidence for central bank lending to government for temporary, as intended in the law. We define “fiscal
fiscal purposes and its macroeconomic impact in the two dominance" as central bank lending above the legal limit
decades prior to the onset of the current crisis. The study (although the term is used widely, there no established
seeks to answer three main questions: definition), which appears to be a systemic phenomenon—
about 16 percent of revenue on average. Nevertheless,
What is the evidence for central bank the amount by which central bank lending exceeds legal
lending to government in practice, limits (or the magnitude of fiscal dominance) has fallen
and how does it relate to legal limits? over time, despite tighter limits.
We augment the IMF’s Central Bank Legislation Database
for our sample of African central banks to include
quantitative information on legal limits on central bank
lending to government, updated to 2017. This shows that
many sub-Saharan African countries have introduced (and
in some cases tightened) such limits over the past three
decades (Figure 2). The limits are typically applied to loans,
overdrafts, and advances extended in any given year,
defined as a percentage of fiscal revenue. Most limits allow
for some limited budgetary financing from the central
bank, usually with the aim of providing a lender-
of-last-resort facility to cover intra-year
IMF RESEARCH perspectives | IMF.org/researchbulletin 10Why do governments choose to finance Should we care?
deficits through central bank borrowing? In short, YES, because central bank deficit financing
The patterns of noncompliance suggest that legal limits matters for inflation. Empirical investigation of the impact
have teeth—a result confirmed in the empirical analysis. of central bank lending on monetary aggregates, the
Even though the limits were frequently breached, the exchange rate, and inflation finds a statistically significant
recourse to the central bank when deficits rose was contemporaneous impact on the exchange rate and a
indeed lower when legal limits were in place. The effect lagged impact on inflation. An increase in central bank
of legal limits is therefore analogous to a speed limit for credit to the government by 1 percentage point of GDP—
car drivers: the limit is often exceeded, but rarely hugely or about 5 percentage points of revenue—is associated
so, and drivers go more slowly than when there is a with a decline in the exchange rate of 1 percentage
(more stringent) limit. point contemporaneously and an increase in inflation by
Further, less central bank financing is used when more ½ percentage point a year later. Moreover, the impact on
financing options are available. On average, about 9 inflation seems to be mostly through the exchange rate
percent of a fiscal deficit is financed by the central bank. channel; there does not seem to be evidence of credit
But if the government is able to borrow from financial growth (the aggregate demand channel).
markets and issue bonds, then only about 3 percent of These findings suggest that fiscal dominance is a relevant
the fiscal deficit is covered by central bank financing. macroeconomic issue that policymakers should take
Finally, IMF programs that restrict lending are effective. seriously—even if the impact does not reach hyperinflation
If the government has an IMF-supported program with proportions, it can still generate significant inflation
a condition on domestic borrowing or central bank pressure. Although the central bank may sometimes
borrowing, then almost none of the deficit is covered need to provide additional financing in exceptional
by central bank financing. circumstances, including during the COVID-19 pandemic,
it should be on a temporary basis to avoid the risk of
runaway inflation and keep expectations anchored.
Moreover, additional financing should be allowed
through clearly defined escape clauses rather than
by eliminating or relaxing legal limits. Although legal
limits are no panacea, they do provide a useful defense
against fiscal dominance: countries borrow less from
central banks when they have stricter legal limits. Finally,
policies that foster development of financial markets can
also reduce the propensity of the government to turn to
the central bank.
IMF RESEARCH perspectives | IMF.org/researchbulletin 11The POWER of
GOVERNMENT SPENDING
when INTEREST RATES
are LOW
Giovanni Melina
gmelina@IMF.org
IMF RESEARCH perspectives | IMF.org/researchbulletin 12T
he interest-rate-growth differential (r − g) has deliver the intended objectives boils down to the extent
been under close scrutiny in the past few years. to which they are able to boost GDP, the relationship
This differential is essential to understanding long- captured by the concept of fiscal multiplier. This multiplier
term fiscal sustainability. Higher interest rates generate represents a measure of the effect of increases in fiscal
higher interest payments to service government debt and spending on a country's economic output and is defined
lead to greater debt accumulation. In contrast, higher GDP as the ratio between the change in GDP and the change
growth tends to lower the debt-to-GDP ratio because it in government spending.
increases its denominator.
A recent IMF study using data from 10 euro area
With interest rates persistently low, r − g has turned countries finds that the level of r − g affects the size of the
negative in many countries in the aftermath of the global government spending multiplier. According to textbook
financial crisis, bolstering arguments for fiscal stimulus macroeconomics, at every point in time, the debt stock
to boost economic activity. The evidence for advanced will grow by the existing debt stock multiplied by r − g,
economies hints that a negative r − g may persist over the net of the primary budget balance (with debt and the
long term. However, there is no guarantee, given that this primary balance expressed as fractions of GDP). Although
differential could quickly turn positive as a result of large a negative r − g does not guarantee debt sustainability,
adverse shocks, especially if government debt is high. government debt will tend to fall when r − g is negative
and will tend to grow when r − g is positive. In addition,
This debate could not be more timely, in the context the higher r − g, the higher the future primary budget
of the economic fallout of the COVID-19 pandemic: balance a government will need to stabilize its debt,
countries have increased, and will likely continue to a theoretical prediction confirmed by euro area data
increase, government expenditures to deal with the (Figure 1). Forward-looking private agents will incorporate
health emergency, mitigate the economic collapse, and this mechanism into their expectations and increase
accelerate the recovery. Whether fiscal expansions will their savings.
Figure 1. Dynamic Correlations between r – g and Cyclically Adjusted Primary Balances in the Euro Area
1.0
0.8
0.6
0.4
corr([r–g]t; CAPBt+h)
0.2
0
-0.2
-0.4
-0.6
-0.8
-1.0
h=0 h=1 h=2 h=3 h=4 h=5
Sources: IMF, Fiscal Monitor database; Di Serio, Fragetta, and Melina (2021); and Refinitiv Datastream.
Note: The figure reports dynamic correlations between r − g at time t and the IMF’s cyclically adjusted primary balance (fraction to potential
GDP) at time t + h, with h = 0, 1, ..., 5. In each box, the horizontal line (x) represents the median (average) correlation across 10 euro area
countries (Austria, Belgium, Finland, France, Germany, Ireland, Italy, The Netherlands, Portugal, Spain); the upper and lower edges of each box
represent the top and bottom quartiles of the correlations, respectively; and the top and bottom whiskers denote the maximum and minimum
correlation, respectively. CAPB = cyclically adjusted primary balance; corr = correlation.
IMF RESEARCH perspectives | IMF.org/researchbulletin 13Figure 2. Historical Evolution of Cumulated Five-Year Government Spending Multipliers in the Euro Area
2.0 10
8
1.5
6
Government spending multiplier
1.0
4
0.5 2
r-g
0
0
-2
-0.5
-4
-1.0 -6
2002 2003 2004 2005 2006 2007 2008 2009 2010 2011 2012 2013 2014 2015 2016 2017 2018 2019
Government spending multipliers r-g
Source: Di Serio, Fragetta, and Melina (2021).
Note: Multipliers are computed conditional on the economy being in a given quarter at the time of the government spending shock. r − g is
computed as a weighted average of national values of 10 euro area countries (Austria, Belgium, Finland, France, Germany, Ireland, Italy, The
Netherlands, Portugal, Spain), using national GDP as weights.
This behavior affects the size of the government spending These findings carry important policy implications,
multiplier, which is inversely correlated with the level of especially in the context of the EU Recovery Plan, which is
r − g (Figure 2). Statistical tests reveal that in the negative leading to ambitious government spending programs in
r − g regime, the multiplier is larger than in the positive member countries. With GDP growth expected to resume,
r − g regime with high probability. The difference in insofar as interest rates remain low, the resulting r − g
the multipliers across the two regimes increases at time should promote relatively high government spending
horizons beyond the first year. Over the medium term multipliers. However, this scenario may be reversed,
(five years), median cumulated multipliers range between and multipliers may become significantly more modest,
1.22 and 1.77 when r − g is negative and between 0.51 if adverse shocks keep r − g significantly above zero in
and 1.26 when r − g is positive. To put this in perspective, large member countries. For example, during the global
if euro area governments had spent €100 in the early financial crisis, r – g spiked in the euro area and then
2000s, when r – g was positive, this would have generated remained positive for several years. In such circumstances,
an average increase in GDP of €86. Spending the same it is even more important that fiscal spending prioritize
€100 in the late 2010s would have generated an average what is most productive. This policy has a high chance of
increase in GDP of €150—almost twice as much. maximizing the growth impact directly, but also indirectly
by curbing r – g and the expectations of necessary future
fiscal adjustments.
IMF RESEARCH perspectives | IMF.org/researchbulletin 14Ruchir Agarwal ragarwal@IMF.org Patrick Gaule patrickgaule@gmail.com
The COVID-19 pandemic is one of the greatest                                                 Third, the R&D response to COVID-19
                                                                                             suggests that global innovation can
challenges ever faced by modern medicine.                                                    be scaled up rapidly and sizably.
When China publicly shared the genetic sequence of                                           That is, even in the short term, the
                                                                                             aggregate supply elasticity of science
the novel coronavirus on January 12, 2020, scientists                                        and innovation can be very large. In the
quickly began working on vaccines and treatments to                                          initial months of the pandemic, up to
                                                                                             50 percent of new trials were directed
fight SARS-CoV-2. The odds for quick success looked                                          toward COVID-19. And, despite the
dim. On the vaccine front, the fastest any vaccine                                           large increase in COVID-19 R&D, overall
                                                                                             new clinical trials rose by 38 percent in
had previously been developed was in four years—                                             2020, with little crowding out of R&D
for mumps in the 1960s—and thus even predictions                                             effort for other diseases.
                                                                                             Fourth, public research institutions
of success by summer 2021 seemed highly optimistic.
                                                                                             were a key driver of the COVID-19 R&D
On the treatment front, limited progress had been                                            effort—accounting for 70 percent of all
                                                                                             COVID-19 clinical trials globally. These
made on the other known coronaviruses that cause
                                                                                             public institutions were 10 percentage
disease in humans despite decades of research.                                               points more likely to conduct a
                                                                                             COVID-19 trial than private firms. In
                                                                                             addition, US and Chinese vaccine
                                                                                             candidates were on average developed

T
                                                                                             two months faster than candidates from
       he scientific community                 in response to the large discrete shift
                                                                                             other countries. This crucial boost in
       responded with a massive                in global medical needs—and thus
                                                                                             speed may have resulted from more
       research and development (R&D)          the market size for pharmaceutical
                                                                                             early-stage incentives from the policy
effort. By December 2020, several              products—brought about by COVID-19.
                                                                                             response in these countries, including
vaccine candidates had excellent results       Four key takeaways emerge.
                                                                                             through programs such as Operation
in large trials, with two (developed by        First, R&D efforts typically do not           Warp Speed in the United States that
Pfizer/BionTech and Moderna) receiving         increase one to one as a disease              funded clinical trials and manufacturing
emergency use authorization in several         becomes “bigger.” The cross-sectional         capacity for various vaccine candidates.
countries. Researchers had also                relationship between the market size          Last but not least, several important
identified various treatments that could       of a disease (measured as the disease-        COVID-19 pharmaceutical innovations
modestly reduce mortality. While major         level mortality risk at the national level    were driven by public research
challenges remain in scaling up the            weighted by national income levels) and       institutions with no explicit monetary
production and distribution of vaccines        R&D effort (measured as new clinical          incentives—suggesting the role of
and tackling the new virus strains, the        trials) is established by matching data       intrinsic motivation and altruism among
pharmaceutical innovation response to          on worldwide clinical trials to 75 broad      researchers. For instance, several
COVID-19 has already turned out to be          disease categories with a non-negligible      key treatment findings came from
an unprecedented success in terms of           death burden. The estimated elasticity—       university labs during publicly funded
product discovery and development.             how much R&D effort increases                 clinical trials—with no obvious monetary
The COVID-19 experience demonstrates           when market size increases—is strictly        benefits (for example, the National
that drug development can potentially          less than 1 (about 0.5) across all            Institute of Health Research funded a
proceed rapidly—without compromising           disease categories and also within            clinical trial on dexamethasone).
safety—when there is a global                  subcategories (such as cancer or
                                                                                             This research hopes to inform ongoing
emergency and there are sufficient             infectious diseases). Put simply, R&D
                                                                                             work in innovation economics. Even
resources available for R&D. This raises       effort put into fighting a disease
                                                                                             after six decades of active research
the question, What lessons can we              increases less than the market size of
                                                                                             since a seminal 1960 National Bureau
draw from the response to COVID-19             that disease. We call this relationship the
                                                                                             of Economic Research conference, The
about the drivers of innovation, and           “law of diminishing effort.”
                                                                                             Rate and Direction of Inventive Activity,
how can it inform the global effort to         Second, the R&D response to COVID-19          many notable questions in innovation
scale up the fight against other deadly        is a major exception to this law: the         economics remain open. In this context,
diseases and other challenges, such as         number of COVID-19 trials is 7 to 20          there are three broad implications for
climate change?                                times greater than what is implied by the     the future of innovation economics.
Recent IMF research sheds light on this        historical relationship between market
question by examining how the entire           size and R&D effort.
landscape of clinical trials changed

IMF RESEARCH perspectives | IMF.org/researchbulletin                                                                                16
Market size alone greater good by many in the global
scientific community, past experience
may not suffice with related virus pathogens, and
better manufacturing technology—
Simply boosting the market size of
but government-led incentives and
pharmaceutical products (for example,
funding played an important role
through commitments to pay more
in the success story.
for successful innovations) may not
effectively scale up innovation to
fight major diseases—given the law of Scope to
diminishing effort. The diminishing
effort effect blunts the effectiveness of significantly scale up
the classic market size incentives favored
in economics. The law of diminishing
global innovation
effort could arise because of various The rapid and large R&D response to
mechanisms, such as (1) decreasing COVID-19 raises the distinct possibility
returns to scale as a result of a scarcity of of scaling up global innovation to fight
ideas or talent, (2) risk aversion among future challenges—including other
firms’ management, and (3) disease- deadly diseases and climate change.
specific ex post taxation (what we call However, scaling up global innovation
the “paradox of market size”). Future may require a more active role by
research should investigate the relative governments in providing early-stage
importance of these mechanisms and R&D incentives. Policymakers may also
examine whether these factors lead to need to gain better understanding and
market inefficiencies. eliminate barriers that currently prevent
researchers from harnessing their
intrinsic motivation to scale up research
Public sector helps during normal times. Such measures
the invisible hand are likely to be complementary to other
efforts to advance the global knowledge
Public research institutions, frontier, such as policy measures to
government-led incentives, and increase the quality of human capital.
nonmonetary incentives drive
Economists are naturally in favor
innovation. Current thinking in the
of market size as a driving force for
economics profession is still dominated
innovation. (“If the market size of
by a perspective that innovation is
the product is sufficiently large,
driven by private sector market-size
then innovation will happen.”)
factors. Consistent with a widespread
This research suggests, however,
belief in the economics profession and
that enhancing market size
among policymakers, enhancing market
alone may not be an effective
size has been seen as key to accelerated
pull when it comes to driving
COVID-19 innovation. For instance,
innovation in the face of large
in a survey of prominent economists
challenges. Policymakers
conducted by the University of Chicago
may want to complement
Initiative on Global Markets on June
the market size effect with
23, 2020, the questions were focused
early-stage incentives and
on how much acceleration in COVID-19
by harnessing the power of
innovation could be achieved by
public research institutions
enhancing the market size; meanwhile
and nonmonetary incentives.
early-stage incentives and the role of the
public sector were not even considered.
The COVID-19 experience invites us
to rethink the role of public research
institutions and the catalyzing role of
governments in promoting innovation
for the greater good. Various factors
played a role in the innovation success—
including an intrinsic pursuit of the
IMF RESEARCH perspectives | IMF.org/researchbulletin 17UNDERSTANDING
Lifelong Mortality
Adriana Lleras-Muney
alleras@econ.ucla.edu
Flavien Moreau
fmoreau@IMF.orgT
he COVID-19 crisis has models. In order to make progress, a countries—Belgium, Denmark,
demonstrated the importance recent IMF working paper proposes France, The Netherlands, Norway,
of health policies for our a simple health model that tracks and Sweden—(panel 1) and for France
economies. In fact, as declared lifetime cohort mortality rates. alone (panel 2). Although the level of
by the IMF’s managing director This model allows exploration of a mortality has changed substantially
during the 2021 Spring Meetings, variety of phenomena studied in the over time, the evolution of mortality
“vaccine policy is economic policy.” empirical literature and shows how rates by age is very similar across
Economists have responded by shocks affect population health at many countries and over time
integrating epidemiological insights various ages. (these patterns are similar though
to shed light on macroeconomic We start with a simple observation: not identical for men). Mortality
dynamics. Yet little is known about mortality has a strikingly regular curves also display an “adolescent
the deeper and long-lasting impact shape like a check mark—high at hump,” especially visible in cohorts
of COVID-19 on populations: what will birth, low during youth, and high born in the 19th century. Maternal
be the long-term effects on mortality and rising almost linearly with age mortality, as well as hormonal and
and on socioeconomic inequality? in late adulthood. Figure 1 shows other changes associated with the
There are no easy answers to these this pattern for selected cohorts transition to adulthood are thought
questions, which are nonetheless of women born between 1860 to explain this adolescent hump.
crucial inputs to many economic and 1940 for various European
Figure 1. Mortality Curves
1. Six European Countries
0
1860
-1
Log(mortality rate)
-2
-3
1940
-4
0 20 40 60 80
Age
1860 Belgium 1860 Denmark 1860 France 1860 Netherlands 1860 Norway 1860 Sweden
1940 Belgium 1940 Denmark 1940 France 1940 Netherlands 1940 Norway 1940 Sweden
2. French Cohorts
0
-1
Log (mortality rate)
-2
-3
-4
0 20 40 60 80
Age
1860 1880 1900 1920 1940
Sources: Human Mortality Database; authors’ calculations.
IMF RESEARCH perspectives | IMF.org/researchbulletin 19Figure 2. Observed and Estimated Cohort Survival Rates
100
90
80
Percentage of cohort survivors
70
60
50
40
30
20
10
0
0 10 20 30 40 50 60 70 80 90 100
Age
1816 Model 1860 Model 1900 Model 1940 Model
1816 Data 1860 Data 1900 Data 1940 Data
Sources: Human Mortality Database; authors’ calculations.
A simple model of the health What are the sources of these environmental shocks, such as
distribution of a population accounts increases in longevity? Starting in wars, that affect entire cohorts.
for these stylized facts on mortality. the 1830s, there was a constant and Wars not only lead to spikes in
In the model, people are born with rather dramatic decline in external mortality (see, for instance, the
an initial health level that evolves not causes of death, consistent with the sharp rise in mortality around age
only as a result of natural aging but elimination of maternal mortality—a 25 for the 1920 cohort in Figure
also in response to environmental major cause of death among women 1, panel 2) but also have long-
shocks and investments. People die of childbearing age in the past—and lasting detrimental health effects
when their health level falls below a a steep decline in violent deaths. among survivors. Such “scarring”
certain threshold. Health at birth starts to increase effects have been documented
steadily at the end of the 19th in at least 13 European countries
Rising life expectancy century, consistent with the timing after World War II. Compared with
of improvements in access to water less exposed survivors, those who
The model is able to track the and sanitation and a sharp decline
evolution of the mortality profiles were more exposed to the war
in epidemic and infectious disease experienced worse economic and
for all the individual cohorts since mortality, which greatly reduced the
1816. Survival curves over that period health outcomes several decades
number of infant deaths. later. The model can rationalize such
have become more rectangular,
which mirrors mortality curves and scarring effects and estimates that
denotes the fraction of a cohort that Disruption by World War I lowered life expectancy
survives a given age. This pattern major events by approximately 16 years for the
has accelerated over the decades male 1896 cohort, and World War II
Of course, not all deaths have direct lowered it by another 2 years.
(Figure 2). Survival to age 1 has
biological causes. Many deaths,
increased dramatically. The section Alarmingly, detrimental events in
like accidents and homicides, strike
of the survival curve from age 1 to utero (from war, famine, stress, and
individuals regardless of their health
age 60 has flattened considerably. so forth) can result in large and
status. And sometimes these events
In addition, a steep downward slope persistent declines in health visible in
are correlated as a result of large
has emerged among the oldest. infancy and old age and in elevated
IMF RESEARCH perspectives | IMF.org/researchbulletin 20mortality among survivors. Perhaps Socioeconomic factors also be expanded to consider the role
surprisingly, the empirical literature of behavior and policy. For instance,
Large and persistent gaps in
finds that the effects of various in the absence of financial frictions,
mortality and health across
shocks appear to fade initially only optimal health expenditures are
individuals open up during
to reappear later in life. Our model U-shaped over a person’s lifetime.
adulthood. These gaps result in
predicts this exact U-shaped pattern. With systematic data on health inputs
large life expectancy differences
By comparison, extreme weather or and shocks, as well as prices and
associated with different
pollution events can lead to a sudden budgets over the course of a life,
socioeconomic status, such as
increase in the number of deaths, these implications could be fruitfully
education, income, occupation,
followed by abnormally low mortality. further explored. The model can be
and race. We study such differences
Simulated effects of a temporary used to investigate other questions,
in our model by simulating what
increase in the health threshold at such as socioeconomic and gender
happens when a population is subject
age 60 results in very high mortality differences as well as the long-term
to persistent smaller investments in
the year of the shock. But mortality impact of COVID-19. For example,
health and find that they give rise
starts to drop before the shock it may not be possible to identify
to gaps in mortality similar to the
ends because the frailest already the effects of in utero shocks with
empirical pattern documented in
died in the first phase of the shock. health data for adolescents or young
US data.
Once the threshold is restored to its adults alone, and it may take decades
original (lower) level, mortality falls before the true toll of the pandemic
substantially because there are very
Concluding remarks surfaces in mortality data. In the
few individuals left close to this level. Health and mortality are important meantime, model-based forecasts
This holds true for a long time until inputs for economic models. could shed light on potential
the aging process naturally brings a We propose a basic model of health economic outcomes, such as
portion of the population closer to and mortality evolution that can productivity, inequality, and growth.
the threshold. Known in demography be easily estimated with observed
as “harvesting,” this phenomenon cohort mortality rates alone.
was, for instance, documented in Despite its simplicity, this model
France during the 2003 heat wave. speaks to many important mortality
patterns and can help us understand
the effects of different shocks. It can
IMF RESEARCH perspectives | IMF.org/researchbulletin 21IMF RESEARCH
perspectives
Learn more about IMF research at
IMF.org/external/research/
Visit IMF Economic Review, the official research journal
of the IMF, at http://bit.ly/Palgrave-IMFER
Find IMF publications by visiting IMF.org/pubs
View IMF research and data for free at eLibrary.IMF.org
Access the latest analysis and research from IMF staff
in response to the pandemic at IMF.org/covid19
NEXT ISSUE: FALL | WINTER 2021You can also read