IMF RESEARCHSpring | Summer 2020 - Volume 22, Number
←
→
Page content transcription
If your browser does not render page correctly, please read the page content below
IMF RESEARCH
Volume 22, Number 1   Spring | Summer 2020

                              resbulletin@IMF.org
CONTENTS
NOTE FROM THE GUEST EDITOR
The world has changed since we started working
on this issue of IMF Research Perspectives in
January 2020. COVID-19 has spread around the
globe, disrupting lives, overwhelming health
01
care systems, and impairing economic activity.
Inclusion in Economics:
Although it is still too early to grasp the full
Interview with Sole impact of the pandemic, some populations—
Martinez Peria the socially marginalized, individuals with underlying health
problems, and households with financial vulnerabilities—will likely
04
bear the brunt of it.
Good Jobs for Young People:
A time like this reminds us of the value of equity and equality,
A Policy Imperative to
and the dire consequences of lack thereof. The theme of this issue
Reduce Inequality is “An Economy for All”: we hope to provoke thoughts on improving
access to economic opportunities for different populations. Our
07
showcased research examines the future of employment for
Can You Put a Price on That?
women and for the young, discusses overcoming mommy guilt for
The Cost of Female Guilt
professional women, presents new evidence on wealth inequality,
at Work and explores the role of inequality in monetary policy. Two members
of the IMF’s Research Department sit down with us to share more
10
intimate views on what diversity and inclusion mean for economic
She, Robot: Women’s
research and inside the economics profession.
Employment in the Face
Research on economic equity and equality is more relevant now than
of Automation
ever as we work on overcoming COVID-19 and recovering from its
blow to the economy. Victor Hugo once said: “Great perils have
13
this beauty, that they bring to light the fraternity of strangers.” This
The Snowball Effect: crisis will bring us together to build an economy stronger and more
How the Rich Get Richer resilient, for all.
Go behind the scenes with the IMF Research Perspectives team
to see how they adapted to bring this issue to you in these
15
extraordinary times…~Sophia Chen
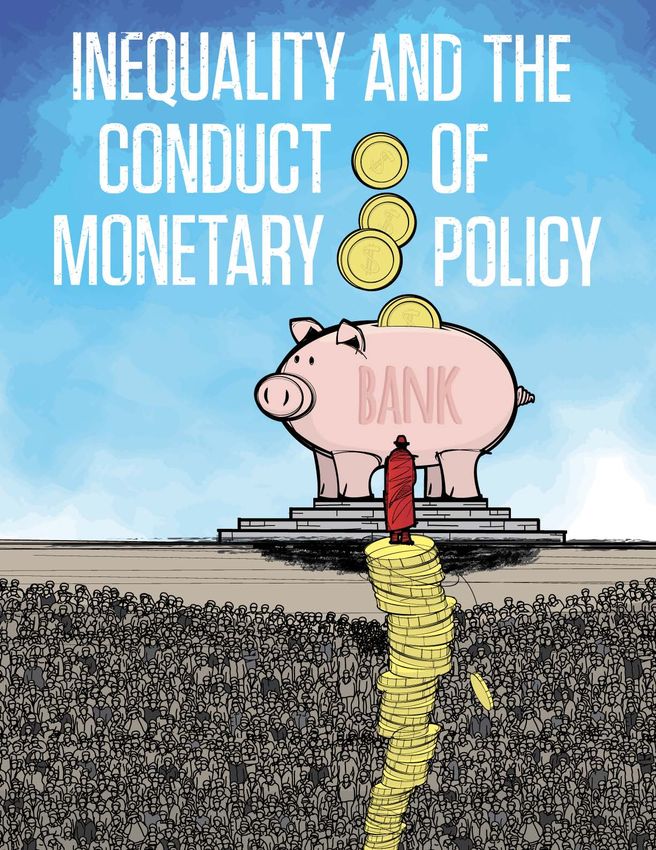
Inequality and the Conduct
of Monetary Policy
IMF RESEARCH
perspectives
17
Falling off the Ladder: EDITORS-IN-CHIEF CONTRIBUTORS
Deniz Igan Sophia Chen
Why So Few Female Chris Papageorgiou Burcu Hacibedel
Economics Professors? GUEST EDITOR
Priscilla Muthoora
Chie Aoyagi
Sophia Chen
Alistair Munro
20
ASSISTANT EDITOR Mariya Brussevich
Patricia Loo Era Dabla-Norris
The Perspective from Home EDITORIAL ASSISTANT
Salma Khalid
Davide Malacrino
Tracey Lookadoo
Niels-Jakob H. Hansen
COVER, DESIGN, AND LAYOUT Alessandro Lin
IMF CSF Creative Solutions Division Rui Mano
Şebnem Kalemli-Özcan
IMF Research Perspectives—the IMF online bulletin with news on research—is a
biannual publication in English and is available exclusively online free of charge.
The views expressed are those of the author(s) and do not necessarily
SIGN UP!
represent those of the IMF or IMF policy. Material from this publication may
be reprinted with proper attribution.
Editorial correspondence may be addressed to:
For new issues of IMF Research Perspectives and INTERNATIONAL MONETARY FUND
a variety of other IMF publications, sign up for an Attn: Editor, IMF Research Perspectives
electronic notification at IMF.org/external/cntpst. 700 19th Street, NW
Room HQ1 9-253
Individual issues are available at Washington, DC 20431 ISSN 2708-3535
USA DOI 10.5089/9781513548579.053
IMF.org/researchbulletin.
resbulletin@IMF.org i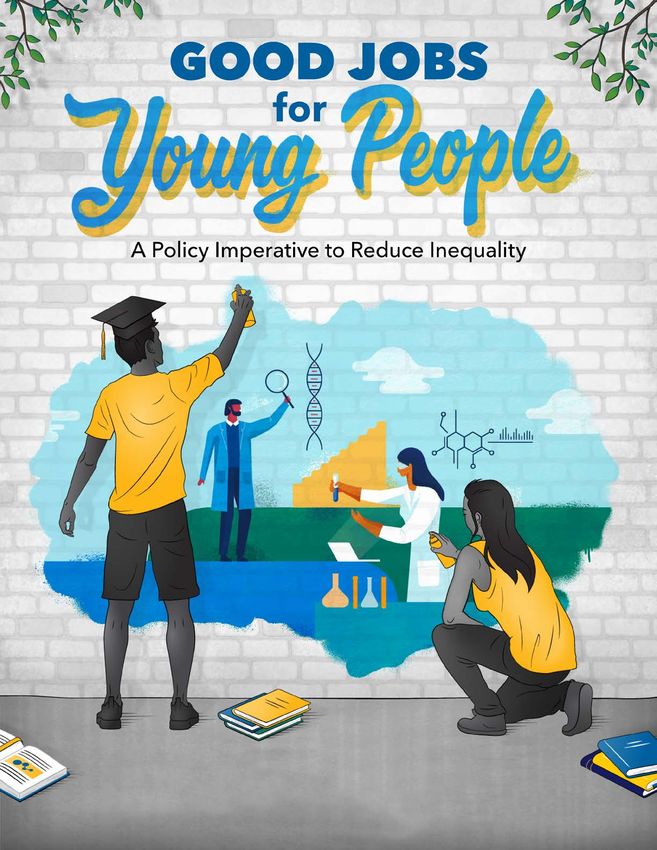
SOPHIA C: Inclusion is a truly multidimensional topic.
Sole Martinez Peria is Assistant                       Understanding inclusion requires thinking that crosses
Director of the IMF Research                           the traditional boundary between different fields.
                                                       This kind of thinking is not uncommon in your research,
Department. A former Research
                                                       Sole: you have written extensively at the intersection of
Manager at the World Bank, Sole                        finance and development, two views that have developed
played an active role in collecting                    mostly independently. What interests you in making the
                                                       connection between these two?
cross-country data and kick-starting
the Bank’s research on financial                       SOLE M: When I started my professional career at the
                                                       World Bank, I really was not thinking about financial
inclusion. In this interview, she talks                inclusion. However, I was in a group where many
with Sophia Chen about inclusion—                      colleagues were working on financial development.
                                                       They studied how the size of the financial sector mattered
what it means for economic research                    for growth. With colleagues Asli Demirgüç-Kunt and
and for the economics profession.                      Thorsten Beck, we started wondering whether what
IMF RESEARCH perspectives | IMF.org/researchbulletin                                                          01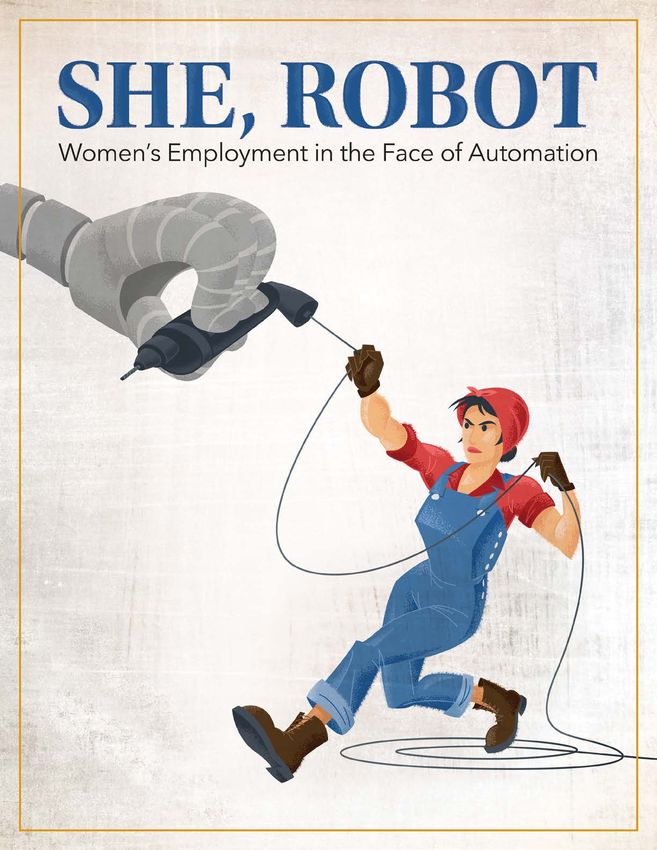
really matters is the breadth of the financial sector—            analyze it. It was a difficult task, but it was also rewarding.
the extent to which people have access to and use                 The research got significant attention, was published in
financial services. That is how I got interested in this topic.   good journals, and is well cited. Our work also inspired
                                                                  later efforts to produce other cross-country data sets on
SC: You recently wrote an article for the Oxford                  financial inclusion.
Research Encyclopedia on financial inclusion and human
development. What is financial inclusion, and why does it         SC: Do we see in the data that certain populations face
matter for human development?                                     high obstacles in access to finance?

SM: Financial inclusion has been defined as access to             SM: Yes. In subsequent research that we did with
and use of financial services by individuals. Theoretically,      Franklin Allen, Asli Demirgüç-Kunt, and Leora Klapper,
financial inclusion matters for human development                 we showed that poor individuals with low levels of
because it allows individuals to smooth their consumption         education, individuals residing in rural areas, and women
and investment (including in human capital) and to                have a harder time accessing financial services and
be more resilient to economic shocks. Evidence from               are also less likely to use them. These gaps in financial
research focused on India, Kenya, and Chile shows that            inclusion persist to this day, even with all the attention
when people have the ability to save, they can smooth             that has been given to the topic.
their consumption and make decisions to better deal with
economic shocks. This effect has been shown to be quite           SC: What does this mean for policies?
significant for women.
                                                                  SM: It means that policy needs to be specially targeted to
SC: As an empirical researcher you also worked on                 those groups so that the divide narrows rather than grows
compiling and collecting data sets; for example,                  over time. Interventions from governments or financial
to measure access to finance and the use of financial             institutions that try to design products to reach a broader
services. Can you also tell us about that experience?             set of users need to keep in mind the constraints that
                                                                  these groups face, whether it is having physical access
SM: At the World Bank, we discovered very quickly                 or digital access to financial services or the literacy that
that there were no data sets available to look at                 is required to understand how to appropriately use
financial inclusion. So we had to create our own data.            financial services.
We developed a survey that we sent out in 2003 to
central banks and bank regulatory authorities around              SC: Do you see new policy challenges in the post–
the world, asking them for information about how many             COVID-19 world?
branches banks had, how many ATMs, how many loans
                                                                  SM: I see challenges and opportunities. One of the
they made, and how many accounts they had, and so on
                                                                  challenges is that the crisis seems to be impacting those
(something similar to the Fund’s Financial Access Survey,
                                                                  that are more financially excluded, so the demand for
which started in 2010). We then spent a lot of time trying
                                                                  services and the desire by providers to serve them might
to collect and clean up the data before we could finally

                                                                  SOLE MARTINEZ
                                                                  PERIA INTERVIEW
                                                                  Sole Martinez Peria talks
                                                                  about inclusion—what it means
                      WATCH NOW                                   for economic research and for
                                                                  the economics profession.

IMF RESEARCH perspectives | IMF.org/researchbulletin                                                                           02
diminish. The crisis may also affect institutions that tend   boss for many years, so I had colleagues to bond with and
to reach out more to the poor or to women, such as            as role models. Nonetheless, I do see that the profession
microfinance institutions. They may be affected because       has a long way to go in closing the disparities between
there may be less donor funding or because their loan         men and women.
portfolio may deteriorate as a consequence of repayment
problems from their borrowers. But the crisis has created     SC: Do you have any influential teachers or mentors?
a lot of momentum for governments to facilitate access
                                                              SM: My first mentor was my graduate advisor at UC
to digital financial services (both to help with social
                                                              Berkeley, Maury Obstfeld. I have always admired him
distancing and also to allow for efficient disbursement
                                                              because he is a brilliant economist—someone who is not
of government transfers). If these efforts increase access
                                                              only knowledgeable about his fields of concentration but
to digital financial services, especially by vulnerable
                                                              who can also speak in depth about any topic. He is also
populations in hard-to-reach areas, they might be a
                                                              a role model because he is a very nice and caring person,
pathway to inclusion.
                                                              always very down-to-earth, no matter how high he rose in
SC: Now let’s shift the focus a bit. Inclusion is not only    his career, including being a former IMF Chief Economist.
a topic that economists study, it is also an obstacle the
                                                              SC: One last question, Sole: Do you have any advice for
economics profession has to overcome. For example,
                                                              those who are starting out in their career?
a recent professional survey shows that only 40 percent
of men and 20 percent of women are satisfied with the         SM: Whether you are a man or a woman, it is important
overall climate of the economics profession. Would you        to find a field that you are passionate about without
say that you are among the 20 percent or the 80 percent?      thinking too much about the fads that come and go in
                                                              the profession. It is important to find a job where you
SM: I have been lucky throughout my career. I have
                                                              can continue to grow and to develop your human capital,
never felt discriminated against or in any way affected
                                                              where you do not feel trapped and have outside options
by being a female economist. If anything, later on in my
                                                              in your career. Finally, for me, it was also very important
career, I think it has opened doors. But I do acknowledge
                                                              to find a job that allowed me to accomplish my personal
that, for example, when I was in grad school, it felt a bit
                                                              goals beyond those that relate to my career. I have
awkward to be in a class full of men, with few female
                                                              always felt that being a parent is the most influential job
students and even fewer female professors. When I
                                                              I will have. So I have made career choices that I felt were
started working at the World Bank, I was fortunate
                                                              compatible with my goal of trying to be a good parent.
enough to have several female colleagues and a female

     “...being
    a parent
is the most
 influential
   job I will
      have. ”
        WATCH NOW

IMF RESEARCH perspectives | IMF.org/researchbulletin                                                                    03
Burcu Hacibedel         Priscilla Muthoora
   bhacibedel@IMF.org       pmuthoora@IMF.org

Youth unemployment rates remain stubbornly high in most
                  countries and have been rising in advanced economies
                  hit hardest by the global financial crisis. Is there a risk of
                  a “lost generation”?

                                                       Youth unemployment, poverty, and inequality
                                                       Young people’s active participation in the labor force is
                                                       a common element of many successful stories of economic
                                                       development. At the same time, finding work has always
                                                       been more challenging for young people than for the rest of
                                                       the labor force, making them more likely to be unemployed
                                                       (Figure 1) and more vulnerable to fluctuations in economic
                                                       growth. Recent International Labour Organization figures
                                                       suggest that more than a third of the world’s unemployed
                                                       are young people, defined as those ages 15–24.
                                                       Less stable jobs and lower pay for young people can
                                                       increase the risk of youth poverty and widen intergenerational
                                                       inequality. This link has been documented by recent studies
                                                       at the IMF, highlighting the need to prioritize quality jobs
                                                       for young people. Since the global financial crisis, young
                                                       workers in Europe have faced more prevalent in-work poverty,
                                                       involuntary part-time employment, and temporary work
                                                       contracts than older workers. The rise in youth unemployment
                                                       after the crisis led to an increase in income inequality,
                                                       measured by the Gini coefficient, by an average 4 percentage
                                                       points for advanced economies. In Greece, Ireland, Italy,
                                                       Portugal, and Spain, where youth labor markets deteriorated
                                                       more, inequality is estimated to have increased by up to
                                                       8 percentage points.

                                                       FIGURE 1. Global Trends in Youth and Overall
                                                       Unemployment: 1992–2019

                                                        0.0
                                                              1991
                                                              1992
                                                              1993
                                                              1994
                                                              1995
                                                              1996
                                                              1997
                                                              1998
                                                              1999
                                                              2000
                                                              2001
                                                              2002
                                                              2003
                                                              2004
                                                              2005
                                                              2006
                                                              2007
                                                              2008
                                                              2009
                                                              2010
                                                              2011
                                                              2012
                                                              2013
                                                              2014
                                                              2015
                                                              2016
                                                              2017
                                                              2018
                                                              2019

                                                                                 Total           Youth

                                                       Source: International Labour Organization, Trends Econometric Models.

IMF RESEARCH perspectives | IMF.org/researchbulletin                                                                    05
New evidence from developing economies                              What can be done?
In recent research, we study a group of 71 low-income and           High and prolonged youth unemployment presents significant
emerging market economies over the period 1981–2014 to              risks to the future workforce, including inequality, poverty,
identify how good and bad economic times translate into             and social unrest. Targeted policy design has a key role to play
changes in inequality. For each country, good and bad times         to avoid this hysteresis effect. Advanced economies that have
are determined using two criteria. The first is whether a           the policy space and institutional capacity can use fiscal policy
country’s GDP per capita growth rate in any given year was          to encourage companies to hire young people, especially
positive (good times) or negative (bad times). The second           in bad times. This can help enhance integration of young
is the distance, measured in standard deviations, between           people into the labor force and prevent their permanent
a country’s per capita GDP growth rate in any given year            exclusion. Underlying issues such as skill mismatches could
and its period average per capita GDP growth rate. These            be integrated into countries’ broader structural policy
country-specific thresholds help distinguish normal from            agenda, prioritizing vocational training. In addition, reforms
extreme growth conditions, whether good or bad, for each            of unemployment and non–pension benefits could mitigate
country. Mediation analysis then helps identify and quantify        the long-term poverty risk.
the main mechanisms through which growth conditions                 For low-income and emerging market economies, however,
affect inequality. This methodology, borrowed from the              both the policy space and the institutional capacity may be
field of psychology, is relatively novel in macroeconomics.         more challenging. Targeted improvements in education
Its advantage is that it enables us to decompose observed           and active labor market policies could help, alongside
associations into components that uncover causal                    broad policies to improve the flexibility of the formal labor
mechanisms; that is, transmission channels.                         market, the business environment, and the quality of jobs.
The results suggest that reductions in unemployment during          Taking advantage of good times to implement these policies
good times explain about 41 percent of the reduction                and create quality jobs could shield young workers from the
in inequality for developing economies. In comparison,              long-term harm caused by bad times. To mitigate the adverse
28 percent of the increase in inequality during bad times           effects, policymakers could strengthen unemployment
happens because of unemployment. Changes in youth                   insurance systems—together with well-designed tax systems,
unemployment are a key driver: they explain 38 percent and          active labor market policies, and broader policies—to
27 percent of the variations in inequality in good and bad          curb informality.
times, respectively (Figure 2). In other words, unemployment
among young people is a key transmission channel of
economic conditions to inequality during economic growth
and downturns. This is consistent with other research showing
that youth unemployment is relatively more sensitive to
business cycle fluctuations than overall unemployment.

FIGURE 2. Youth Unemployment and Inequality in Good and Bad Times
The unemployment rate among young people is a key driver of inequality, in both good and bad economic times.
(Percentage effect of good and bad times on inequality explained by unemployment and youth unemployment)

                                                                                                                    Good Times
                                                                                                                    Bad Times

                       Total unemployment                            Youth unemployment                          Source: Authors’
                                     Low-Income and Emerging Market Economies                                    calculations.

IMF RESEARCH perspectives | IMF.org/researchbulletin                                                                                06

Men and women do not necessarily value the same aspects of a job in the same way.
Using a novel approach based on a choice experiment and a specially commissioned
online survey in Japan, recent research by IMF economist Chie Aoyagi and Professor
Alistair Munro finds that women have higher “willingness to pay” than men to avoid
extreme overtime and mandatory intra-firm transfer, and this higher willingness to pay
is driven in part by feelings of guilt.

A choice experiment approach                                   Given these trade-offs, Aoyagi and Munro focus on five
                                                               key attributes of jobs in Japan: salary, required overtime,
The authors use a series of hypothetical job choice            job security, mandatory intra-firm transfer (at the same
questions to reveal workers’ preference for jobs that          location), and mandatory relocation. The benchmark
may pay less but offer better work-life balance. Compared      levels for these attributes are selected to match what is
with the traditional approach to understanding worker          typically observed. For example, the median overtime
preferences by relating wages to job characteristics, choice   hours for full-time workers (15 hours a month) and the legal
experiments have several advantages. Because choices           overtime limit (45 hours a month) are used for the overtime
are made in hypothetical situations, the experimenter can      attribute. Job security has two levels: “high”, informed by
design the choices to directly identify preferences and        average tenure for regular workers and “medium,” informed
consider a wide range of job characteristics and policy        by average tenure for limited-regular workers whose
reforms. Moreover, choice experiments can be used              employment status lies somewhere between full-fledged
both for people who are employed and for those who             regular employment and irregular employment.
are currently out of the labor market.
                                                               The table shows an example choice set. Job A, Job B,
Jobs differ in many dimensions, and it is therefore tempting   and Job C are the three alternatives. Each alternative is
to design an experiment in which the choice set is highly      described by the five attributes. Each respondent answers
complex. However, complex experimental design could            two questions: which is the best job, and which is the worst
result in incomplete responses or inconsistent choices.        job out of the three alternatives?

                                     Job A                         Job B                             Job C
Annual Wage                          6 million yen                 7 million yen                     8 million yen
Overtime                             0 hours/month                 15–45 hours/month                 0 hours/month
Employment                           Medium                        High                              Medium
Transfer Possibility                 Some                          None                              None
Relocation                           None                          None                              Some
                                     Job A                         Job B                             Job C
Best Job
Worst Job

IMF RESEARCH perspectives | IMF.org/researchbulletin                                                                          08
Women’s willingness to pay Both men and women have a high willingness to pay to avoid the worst aspects of a job. For example, people with an annual wage of 3 million yen (the equivalent of 28,000 US dollars) are willing to pay 1.3 million yen—nearly half of their annual wage—in order to avoid extreme overtime of 45 hours or more. Workers in the highest wage group (8 million yen) are willing to pay 3.5 million yen to avoid such overtime. People are also willing to pay 0.9 to 2.8 million yen to avoid intra-firm transfer, depending on their wage level. Notably, women are on average willing to pay more to avoid long overtime, relocation, and intra-firm transfer. For example, among workers with no children, women are willing to pay 0.3 million yen more than men to avoid extreme overtime. They are also willing to pay 0.4 million yen more to avoid intra-firm transfer. The gender difference in willingness to pay is higher for workers with children. On average, mothers are willing to pay 0.7 million yen more than fathers to avoid extreme overtime. They are also willing to pay 0.5 million yen more to avoid intra-firm transfer. The role of guilt The difference in the responses to the wage trade-offs between fathers and mothers may be attributed to traditional gender roles: men are breadwinners, and must earn more when they have children, whereas women are the primary caregivers, and prioritize work flexibility. To test this hypothesis, Aoyagi and Munro ask the respondents how much guilt they would feel in situations typically experienced by working parents; for example, “I took paid leave for family reasons when my colleagues are working a lot of overtime” or “I missed my children’s event because of work.” Women report feeling more guilt as a result of such work- family conflicts, confirming the well-known phenomenon of “mommy guilt”. What is striking is that feelings of guilt affect the worker’s trade-off between wages and other job attributes. In other words, some of the gender differences in acceptable wage reduction can be attributed to the fact that women experience higher levels of guilt and hence accept flexible work arrangements with lower pay. Policy implications Japan faces a declining labor force given the rapidly aging population, so there is an urgent need to mobilize untapped human resources, including those of the educated female working-age population. To make stepping into the labor market attractive, employers and policymakers must answer an important question: how do you create a more inclusive work environment? A limited-regular contract can be an appealing option, especially—but not only—for women with children. Under a limited-regular contract, regular jobs would be limited regarding overtime and relocation. Moreover, to avoid job market segmentation unfavorable for women, direct managerial and cultural solutions may be needed to deal with mommy guilt. IMF RESEARCH perspectives | IMF.org/researchbulletin 09
Mariya Brussevich
                            mbrussevich@IMF.org

                       Era Dabla-Norris
                            edablanorris@IMF.org

                       Salma Khalid
                            skhalid@IMF.org

IMF RESEARCH perspectives | IMF.org/researchbulletin   10
An imaginary conversation between a worker and a machine RISK OF AUTOMATION
WORKER: Will you replace my job? The risk of automation for individual
workers can be quantified in two steps.
MACHINE: Perhaps.
The first step uses estimates for the
WORKER: How likely? risk of automation at the occupational
MACHINE: Well, it depends on your gender, age, and education. level, which depends on whether
workers in these occupations can be
replaced by state-of-the-art computer-
Automation is hardly a novel Programme for the International controlled equipment. The second
phenomenon; traditional sectors such Assessment of Adult Competencies step relates these automation risks to
as agriculture and manufacturing have (PIAAC) permits analysis of exposure to individual workers based on worker
experienced large substitutions of automation at the individual level. characteristics—such as gender, age,
labor with machine capital in the past. education, literacy, and numeracy
With acceleration in computerization THE GENDER ROUTINENESS GAP skills—and the characteristics of
of manual labor in recent years, The index of routine task intensity tasks they perform at work—such as
concerns are rising that a new wave of (RTI) evaluates the relative importance the use of technology, the use of
displacement by automation is upon us, of abstract skills, such as reasoning interpersonal skills, and the flexibility of
with female workers rather than their and interpersonal communication, work processes.
male counterparts on the front line. and nonroutine manual skills against
Using this approach, the authors find
Why would female workers be more routine tasks that are repetitive and
a large gender difference in the risk
vulnerable? Because women perform hence can be easily automated: RTIi =
of automation. Eleven percent of the
more routine tasks than men—tasks Routinei – Abstracti – Manuali. The RTI
female workforce is at a high risk of
that are more prone to automation. gap is the ratio of female-to-male RTI.
automation (defined as having at least
Moreover, women perform fewer tasks Women, on average, perform more a 70 percent estimated likelihood of
requiring analytical input or abstract routine and less abstract tasks than automation), relative to 9 percent of the
thinking, where technological change men across all countries, sectors, and male workforce, with 26 million female
can complement workers’ skills and occupations. Differences in occupa- jobs at stake in 30 countries. While
improve their productivity. tional distribution across genders younger cohorts of male and female
Recent IMF research has zoomed in on explain most of the RTI gap between workers have similar levels of exposure
how the threat of automation varies by women and men. For instance, women to automation, women older than 40
workers’ gender, age, and education are overrepresented in clerical occu- are at significantly higher risk than men.
in 30 advanced and emerging market pations, where RTI gaps are high, and Gender gaps in automation are also
economies. The worker-level microdata underrepresented among managers, highest for less educated workers and
from the Organisation for Economic legislators, and senior officials, where for clerical and sales workers (Figure 1).
Co-operation and Development’s RTI gaps are low.
FIGURE 1. Gender Gaps in High Risk of Automation by Generation and Educational Level
(Difference in automatability between females and males)
Note: The probability of automation is esti-
1.03 Older Generation mated using an expectation-maximization
Tertiary
Younger Generation algorithm that relates individual character-
(bachelor/master) 1.22 istics (age, education, and training, among
others) and job task characteristics to
Postsecondary 1.30 occupational-level risk of automation. Bars
or tertiary represent the gender difference in autom-
professional 1.20
atability = (share of females at high risk
for automation) / (share of males at high
1.57 ***
Upper secondary risk for automation). High automatability is
1.15 defined as probability of automation ≥ 0.7.
Individuals between ages 20 and 39 are
Lower secondary 1.47 *** defined as younger generation. Individuals
or less 1.34 ** between ages 40 and 65 are defined as
older generation. Statistical significance
levels on bars reflect t-tests of the differ-
0 0.5 1.0 1.5 2.0 ences between proportions of male and
female workers at high risk of replacement
Sources: Organisation for Economic Co-operation and Development, Programme for the by technology. Statistical significance
International Assessment of Adult Competencies; and IMF staff estimates. levels: *** p < 0.01; ** p < 0.05; * p < 0.1.
IMF RESEARCH perspectives | IMF.org/researchbulletin 11FIGURE 2. Gender Gap in High Risk of Automation across Sectors
Share of workers with high automatability Share of gender in sector
3.62% Accom. & Food* 4.07%
3.42% Admin. & Support* 2.97%
7.28% Construction* 1.94%
7.89% Education** 16.85%
4.49% Financial Services** 5.78%
5.49% Health 21.49%
6.53% Info. & Comm.** 3.45%
21.57% Manufacturing** 8.41%
7.06% Professional 6.46%
9.59% Public Admin. 9.85%
6.61% Transportation 2.96%
16.45% Wholesale & Retail*** 15.76%
0.4 0.3 0.2 0.1 0 0 0.1 0.2 0.3 0.4
MALES SECTOR FEMALES
Sources: Frey and Osbourne (2017); Organisation for Economic Co-operation and Development, Programme for the International
Assessment of Adult Competencies; and IMF staff estimates.
Note: The probability of automation is estimated using an expectation-maximization algorithm that relates individual characteristics (age,
education, and training, among others) and job task characteristics to occupational-level risk of automation. Bars represent, respectively,
the proportion of male and female workers at high risk of replacement by technology. High automatability is defined as probability of
automation ≥ 0.7. Dots (and associated percentages) reflect the proportion of the male and female labor force employed in each sector.
Statistical significance levels on the sectors reflect the t-test of the differences between proportions of male and female workers at high risk
of replacement by technology. Statistical significance levels: *** p < 0.01; ** p < 0.05; * p < 0.1.
At the sectoral level, more women in elementary and clerical occupations gender gaps in routinization and
accommodation and food services, toward professional jobs, providing thus risk of automation over the
retail trade, and transportation face more insulation from displacement by women’s life cycle. For instance,
a high risk of automation (Figure 2). technology. Moreover, job growth in a large part of gender inequality in
Women are also overrepresented aging economies is likely to be stronger the labor market can be explained by
in sectors relatively less exposed to in traditionally female-dominated a “childbearing penalty.” Thus, there
automation, such as education and sectors such as health and social may be an important role for policies
health care. However, even within services, where jobs require cognitive that smooth transitions of younger
less-automation-prone sectors, and interpersonal skills and thus are female workers and ensure adequate
women face a higher risk than men. less prone to automation. safety nets for older, displaced
These differences suggest that not workers (Brussevich and others 2018).
The overall positive trends displayed
only selection of men and women
by the intergenerational analysis
across sectors but also variation in
suggest that there is room for optimism
task composition performed within
about the future of work for women.
these sectors determine the likelihood
An important caveat, however, is in
of automation.
order. The data set does not allow
Reassuringly, since the 1990s, more tracking of workers over time, so these
women than men have shifted from results could also reflect widening
IMF RESEARCH perspectives | IMF.org/researchbulletin 12Davide Malacrino dmalacrino@IMF.org
Wealth distribution is extremely                              less common for authorities to collect     Finally, individual characteristics such
  concentrated in most countries.                               data on wealth, given how few countries    as financial sophistication, financial
  According to Saez and Zucman (2016),                          collect wealth taxes. Because of the       information, and entrepreneurial
  in 2012 the top 0.1 percent richest                           lack of direct wealth measurement,         talent are also important. These
  Americans held more than one-fifth of                         researchers have relied on imputation      characteristics, which people tend to
  the economy’s net worth, the highest                          methods to measure inequality. For         retain over time, make the return to
  share since the mid-1920s. A recent and                       example, the so-called capitalization      wealth persistent. The combination of
  growing body of research suggests that                        approach relies on imputing individual     higher returns for wealthier individuals
  the wealthiest individuals both have                          wealth through the capitalization          with the persistence of their higher
  disproportionately more wealth and                            of asset income from tax returns.          returns gives rise to a mechanism that
  receive higher returns from investing it.                     This is the method adopted by Saez         makes wealth more concentrated over
                                                                and Zucman in their recent book, The       time as the wealthy get wealthier. This
  In a recent paper,1 IMF economist
                                                                Triumph of Injustice. As pointed out       mechanism has been hypothesized
  Davide Malacrino and coauthors
                                                                in previous work by Malacrino and his      in previous theoretical work, but this
  Andreas Fagereng, Luigi Guiso,
                                                                coauthors, measures of wealth based on     research is the first to quantify this
  and Luigi Pistaferri show that
                                                                the capitalization approach can lead to    mechanism and show that it is likely to
  returns are positively correlated
                                                                misleading conclusions about the level     have empirical significance.
  with individuals’ wealth. They are
                                                                and the dynamics of wealth inequality
  also heterogeneous, persistent,                                                                          Returns persist over time for the same
                                                                if returns are heterogeneous and even
  and correlated across generations.                                                                       individual, but do they also persist
                                                                moderately correlated with wealth.         across generations? The answer is a
  These findings are based on 12 years
                                                                Why do rich people earn high returns?      qualified yes. Like wealth, which has
  of tax records on the wealth and capital
                                                                Conventional wisdom suggests that          a high degree of intergenerational
  income of all taxpayers in Norway from
                                                                it is because of risk compensation:        correlation—children of wealthy families
  2004 to 2015. These exhaustive records
                                                                richer people on average allocate a        are likely to have a lot of wealth as
  are available in Norway because of a
                                                                higher fraction of their assets to risky   adults—returns to wealth are also
  wealth tax that requires assets to be
                                                                investments. Their risk exposure is        correlated intergenerationally. But there
  reported—often by employers, banks,
                                                                rewarded with higher returns. However,     are important differences in how wealth
  or other third parties, thereby reducing
                                                                the authors find that there is more        returns accrue across generations.
  errors that arise from self-reporting.
                                                                to the story. Richer individuals enjoy     Returns to wealth display some degree
  Moreover, the data make it possible
                                                                pure returns to scale on their wealth.     of mean reversion: the children of the
  to match parents with their children,
                                                                Specifically, for a given portfolio        richest are likely to be very rich but
  hence offering a valuable opportunity
                                                                allocation, those who are wealthier        unlikely to get as high returns from
  to examine intergenerational patterns in
                                                                are more likely to get higher risk-        this wealth as their parents did. This
  returns to wealth.
                                                                adjusted returns, possibly because they    suggests that while money is perfectly
  Such thorough data on wealth                                  have access to exclusive investment        inheritable, exceptional talent is not.
  are extremely rare. Even though                               opportunities or better wealth             These results shed new light on the
  administrative data on income are                             managers (Figure 1).                       recent debate on wealth taxation. In the
  available in many countries, it is much
                                                                                                           presence of heterogeneous returns,
                                                                                                           a wealth tax could be more efficient
  Figure 1. Wealthier Individuals Get Higher Returns (Percent)
                                                                                                           than a capital income tax. Using wealth
                              1.6                                                                          instead of capital income as a tax base
Volatility-adjusted average

                              1.4                                                                          would reduce the burden on high-
 return to financial wealth

                              1.2                                                                          return investments and may motivate
                                                                                                           taxpayers to direct their savings toward
                              1.0
                                                                                                           more productive investment. This could
                              0.8                                                                          benefit society via positive effects
                              0.6                                                                          on employment and firm creation.
                              0.4                                                                          Incidentally, the introduction of a wealth
                                                                                                           tax would also provide more precise
                              0.2
                                                                                                           data on wealth, which could help
                               0
                                                                                                           explain the dynamics of inequality, its
                                    0   20               40              60               80     100
                                             Percentile financial wealth distribution in 2004              roots, and its relationship with other
                                                                                                           economic phenomena.
  Source: Fagereng and others (2020).
  Note: The figure shows the average return to individual financial wealth portfolios adjusted for
  their volatility for 2005–2015 against the financial wealth percentile in 2004.

  1
   Andreas Fagereng, Luigi Guiso, Davide Malacrino and Luigi Pistaferri. 2020. “Heterogeneity and Persistence in Returns to Wealth.”
  Econometrica 88 (1): 115-70.

  IMF RESEARCH perspectives | IMF.org/researchbulletin                                                                                             14
NIELS-JAKOB H. ALESSANDRO RUI HANSEN LIN MANO nhansen@IMF.org alessandro_lin@brown.edu rmano@IMF.org
Inequality—a rising concern                                        We study implications for monetary
and policy focus                                                   policy in two settings. In the first setting,
Rising disparity between the haves and the have-nots in            the central bank chooses the best
advanced economies and emerging markets, along with a              possible path of interest rates with full
declining labor share of income, has sparked public debate         information and with equal care about
about how to ensure that prosperity is more widely shared—in       all individuals. This setting is called
particular, because there is evidence that inequality itself       “optimal policy”. In the second setting,
could reduce growth.                                               the central bank does not consider
                                                                   inequality in its interest rate policy. It
Fiscal and structural policies are well understood to be           simply chooses the interest rate based
powerful mitigators of inequality. For example, taxes and          on the state of the economy, following a
transfers can partly offset market income inequality. Spending     so-called Taylor rule. This setting is useful
on education, health, and active labor market policies can         because it is closer to what central banks do.
promote social mobility not only for the current generation
but also for future generations. Structural reforms of labor and   Implications for
product markets can also affect income distribution through
their effect on aggregate employment and the distribution of
                                                                   monetary policy
labor market earnings and capital income.                          In the first setting, we find that a central
                                                                   bank should place some weight on observed
What about monetary policy?                                        inequality. This is because overall welfare
                                                                   improves when the central bank stabilizes the gap
Even though inequality remains outside central banks’              in consumption between the rich and the poor.
mandates, major central bankers are increasingly discussing        However, we find that this weight is generally small.
distributional issues. At the same time, recent advances in        Interestingly, a central bank pursuing such optimal
economic theory shed new light on the interplay of monetary        policy cares progressively less about inflation and
policy and inequality. It is now an accepted view within both      more about growth the higher the initial level of
academia and major central banks that wealth and income            inequality. This is because in an economy with high
inequality affect the effectiveness of monetary policy. This is    inequality, stabilizing inequality coincides with
because the poor, who tend to be more liquidity constrained        stabilizing growth since the poor depend more
than the rich, increase their consumption more in response         on wages the greater the inequality, and wages
to the income boost stemming from an interest rate cut. The        are more stable when growth itself is stable.
same rate cut thus stimulates aggregate consumption more in
an economy with a larger proportion of the poor.                   In the second setting, in which the central bank
                                                                   pursues a Taylor rule targeting output and inflation,
In recent IMF research, we investigate how the conduct of          interest rates should be set lower than otherwise
monetary policy is affected by inequality in a stylized model      because of inequality. A policy of lower interest
in which the economy is subject to technology shocks. In           rates leads to higher wages, which benefits the
this setting, a rich person—call her R—owns all the capital.       poor. Beyond lowering inequality, such a policy is
R’s income is thus composed of after-tax dividends and             also beneficial more generally because it improves
wages. In contrast, a poor person—call her P—receives only         inflation and growth outcomes by avoiding excessive
wages and a transfer from the government financed by the           tightening of the interest rate in response to a positive
dividend tax. In the model, capital income rises in response       productivity shock.
to positive productivity shocks, thereby exacerbating
inequality. Moreover, productivity shocks are biased toward
the rich: when productivity rises, R’s income goes up, while
P’s declines. These mechanisms are consistent with US micro-
and macroeconomic data and match the empirical effects of
technology shocks on consumption inequality.

IMF RESEARCH perspectives | IMF.org/researchbulletin                                                                           16
In all stages of academia, from the first days as a
PhD student to full professor, women in economics
have been and remain a minority. Perhaps even
more striking, the higher the rank, the lower the
representation of women—a phenomenon that appears
to be unique to the economics profession. We spoke
with Şebnem Kalemli-Özcan, assistant director of
the Research Department at the IMF, professor of
economics at the University of Maryland, College Park,
and associate chair of the Committee on the Status of
Women in the Economics Profession, to find out why
and learn what can be done about it.
LET’S START WITH SOME DATA,
AS ECONOMISTS OFTEN DO…
Women are underrepresented in all stages of economics
academia. The fraction of baccalaureate women who
majored in economics is in decline. Women made up
less than 40 percent of students entering economics
PhD programs, while they received just a third of the PhD
AS YOU KNOW, THE IMF HAS SET AMBITIOUS GOALS
degrees granted by US institutions in 2018. The numbers for
TO INCREASE WOMEN’S REPRESENTATION ON ITS
minority women are even worse: out of 148 American women
STAFF. WHAT DO THESE STATISTICS MEAN FOR
who received their PhDs in economics from a US institution
ACHIEVING SUCH GOALS?
in 2018, only seven are Black and four Hispanic. Furthermore, It is important to note that, compared to the field of
fewer than one in five full professors in economics microeconomics, women are especially under-represented in
departments are women. finance, macro, and international economics—three main fields
in the IMF’s hiring of PhD economists.
IS THE UNITED STATES AN OUTLIER? The underrepresentation matters because the diversity
Lack of data makes comprehensive comparisons difficult, of opinion enriches the profession. For example, men and
but the United States looks worse than Europe both in the women have different views on the inclusiveness of the
women’s share of entry-level and full professors. That is not economy. More than 70 percent of female economists agree
to say that women in Europe are doing great in climbing the or strongly agree with the statement that “the distribution of
ladder: women constitute 40 percent of entry-level professors income in the United States should be made more
but only 24 percent of full professors in European equal,” compared to only 40 percent of
economics departments. male economists.
IMF RESEARCH perspectives | IMF.org/researchbulletin 18Diverse teams also conduct more influential research: ECONOMISTS ARE OFTEN KNOWN FOR
a study of 2.5 million scientific papers written by US-based ADVOCATING EVIDENCE-BASED DECISION-
researchers from 1985 to 2008 found that papers with author MAKING AND POLICIES. WHAT IS THE
teams of different ethnicities and in different locations were PROFESSION DOING WITH THIS EVIDENCE?
published in higher-impact journals and cited more often. WHAT ACTIONS ARE BEING TAKEN?
The American Economic Association (AEA) has
NOW COMES THE DIFFICULT QUESTION: WHY ARE undertaken several initiatives, starting with a climate survey;
WOMEN UNDERREPRESENTED, ESPECIALLY AT raising awareness on the issue is the first step. Men are
HIGHER RANKS? satisfied more than women with the existing climate in
First and foremost, basic economic principles may create a the economics profession.
misperception: markets are efficient, so differences across AEA has also set up a task force on best practices to
groups must result from differences in preferences or abilities. have a diverse and inclusive profession focusing on five
Referee reports prepared by white male economists on areas: conducting research; organizing conferences,
gender research include statements such as “women are less seminars, and visitor programs; serving as colleagues;
famous because they have to take time off to take care of kids working with students; and leading departments and
and there are fundamental differences in the way males and workplaces. The main message here is that we all have a
females network,” “based on my observations of my wife and part in this, need to be aware and think about inclusivity all
her friends, women seem to prefer to stay home,” “women do the time.
not like math,” and “women prefer less math-intensive jobs
because they are more social.” These stereotypes and biases
ANY ADVICE FOR NEWCOMERS OR THOSE
are quite far from the truth but have real consequences. In
CONSIDERING A CAREER IN ECONOMICS?
undergraduate education, the share of women majoring in
math increased, while that in economics decreased. Women We are not going to solve these problems overnight, but there
who major in math prefer other STEM [science, technology, are a lot of things you can do, individually and collectively, that
engineering, and mathematics] fields to economics. will improve the situation. You might say or do things that hurt
or offend other people. The goal is to build relationships with
There is also increasing evidence of discrimination against
others where you can discuss openly and learn from others.
women in economics. Extensive work has shown that women
Diversity and inclusion are the responsibility of everyone.
get less credit for coauthored work, are evaluated more
harshly by students, and do more volunteer and service work. My suggestion for young economists is do not give up,
There is, perhaps more disturbingly, evidence that women keep up the good work, and never ever lose your integrity.
face a more hostile audience during their presentations at Be an effective bystander, meaning call it out when you see it.
seminars and such an aggressive professional environment Even if you cannot intervene directly due to shyness and
deters women from an early stage in their career. Last but not power imbalances, find someone to talk to. We can all be
least, there is an important childbirth penalty that lasts a long an ally, when everyone is one.
time, with 20 percent lower lifetime earnings and 26 percent
lower probability of advancing in one’s career.
Men Women
Satisfied with overall climate in economics 40% 20%
Feel valued within the field of economics 46% 25%
Ever been discriminated against or treated unfairly on the basis of sex 4% 48%
Experienced discrimination or unfair treatment in service assignments 9% 43%
Experienced discrimination or unfair treatment in course evaluations 8% 47%
Source: AEA climate survey.
IMF RESEARCH perspectives | IMF.org/researchbulletin 19The Perspective from
The COVID-19 pandemic has meant that this issue
of Research Perspectives was put together in the
same rooms where our families, pets, and grocery
lists were competing for our attention. We’ve been
impressed by one another’s resilience, so we thought
it would be worthwhile to share a few of the stories
and insights from those who contributed to this latest
issue. Maybe you’ll even pick up an idea or two about
how to dress your dog!
“My biggest challenge is working while “My biggest challenge
keeping track of my son’s distance learning while working from home
and keeping him entertained throughout the was getting my kids used to
day. I wouldn’t call this a solution, but I have distance learning. My older son adapted
adapted to having multiple ‘offices’ around quickly but it was harder for my younger son.
the house with toys around my ‘workstations.’” I got him motivated by reorganizing
~SOPHIA CHEN, CONTRIBUTOR his workspace so that he felt
comfortable and could focus. He is
doing fine now though he of course
“For me keeping all misses his friends from school.”
three kids engaged, ~SOLE MARTINEZ PERIA, CONTRIBUTOR
active, and safe at the
same time has been
the biggest challenge “Biggest challenge: Cooking and
while working from cleaning for four males—two
home. Solution? boys, a husband, and the dog.
Sometimes saying Solution: None so far. I’ve tried
yes to the mess makes to assign tasks to each but then
everyone happy.” I ended up redoing them all.”
~CHIE AOYAGI, CONTRIBUTOR ~ŞEBNEM KALEMLI-ÖZCAN, CONTRIBUTOR
IMF RESEARCH perspectives | IMF.org/researchbulletin 20“I had never learned how to “I started playing piano again. I played from
cook (excluding some basic five years old to pretty much until I had kids.
stuff). My mother didn’t like But then life got busy and I didn’t have the
to cook, so growing up I didn’t time. I started playing again under lockdown.”
have anyone to teach me. ~ŞEBNEM
Later in life I was always busy
studying or working. But since
the quarantine I’ve been forced to cook a lot “In the evenings, I’ll play Nintendo Switch with
more and have enjoyed learning new recipes coworkers – which we normally did on Fridays
and making things my kids enjoy.” ~SOLE before all of this happened. So it’s been nice to
bring back something that was normal for us
to do together and bring back some sense of
“Learning how to focus and block out normalcy.” ~SHARON
distractions by separating my work from
other things has been truly life-changing.
Being home and surrounded by food, projects, “I created and hosted an online obstacle
games, and pets means being constantly course through a Nintendo Switch game
distracted by something. I learned to focus called Animal Crossing: New Horizons. I took
on one thing at a time.” ~SHARON DUKE, DESIGNER the whole week prior to the event date to build
five obstacle courses. The players were divided
into teams of two. Throughout the competition,
“My mother was a Home Economics teacher seeing everyone working together, laughing,
so I grew up learning all the domestic skills, and cheering really put a smile on my face.
but lost them over the years. I’ve returned to We connected and bonded throughout that
sewing and crafting during this shut-in period, full hour with nothing but joy and happiness.”
and am having a lot of fun with it! I actually ~LANNY NGUYEN, DESIGNER
finished a blanket for my niece which I started
over three years ago.” ~LAURA SPOFFORD, DESIGNER
IMF RESEARCH perspectives | IMF.org/researchbulletin 21“I look forward to being able to travel to visit “I look forward to
my family in Argentina, and to go on vacations work interactions
with my husband and kids. We really enjoy again, conversing with
travelling together. I also miss my friends and colleagues, and just being
colleagues at work.” ~SOLE in a work environment
that promotes creativity.”
~DAVID HUNT, DESIGNER
“Everybody looks so different without showers
and haircuts.” ~STEFAN LIPSKY, DESIGNER
“My wife and I are both working from home.
From such a small apartment, funny situations
“Someone put a homemade PPE on her dog. are inevitable. At one point someone in her
When I looked with amazement while I was office told her a joke; her burst of laughter
walking my own dog, she offered to make one was heard in the meeting I was taking part in,
for my dog too.” ~ŞEBNEM making everyone laugh.” ~FABIO BOLZAN, DESIGNER
“I started trying out dessert recipes. I guess “I use the same device for my Zoom meeting
I need my sugar fix once in a while.” ~SOPHIA and my son’s distance learning. One time I was
kept in the Zoom waiting room for 15 minutes
and I found out that it was showing
“My newest hobby? Canine mind-reading my son’s name. The host wouldn’t
and weekday naps.” ~LAURA let me (him!) in.”~SOPHIA
“I learned patience - definitely something new “The microphone on my laptop
for me - and to value the small things in life works sporadically. On one
I didn’t pay attention to because I took them for occasion during a meeting, I went
granted. I’ll value things like seeing my friends to talk and everyone started
or colleagues in person much differently now.” laughing. Apparently, my mic
~STEFAN somehow made me sound like…”
~SHARON
“…she sounded like
Jabba the Hutt.” ~STEFAN
IMF RESEARCH perspectives | IMF.org/researchbulletin 22IMF RESEARCH
perspectives
Learn more about IMF research at
IMF.org/external/research/
Visit IMF Economic Review, the official research journal
of the IMF, at http://bit.ly/Palgrave-IMFER
Find IMF publications by visiting IMF.org/pubs
View IMF research and data for free at eLibrary.IMF.org
Access the latest analysis and research from IMF staff
in response to the pandemic at IMF.org/covid19
NEXT ISSUE: JANUARY 2021
IMF RESEARCH perspectives | IMF.org/researchbulletinYou can also read