Paper SCOR - Health impacts of air pollution - SCOR.COM
←
→
Page content transcription
If your browser does not render page correctly, please read the page content below
SCOR                                       July 2018

Paper                                        N°42

                   Health impacts of air pollution

By Mark LI
SCOR Global Life
and Léo MALLAT
SCOR
Health impacts of air pollution

                                 Mark LI and Léo MALLAT

                                           July 2018

Dr Mark Li
Chief Medical Officer of SCOR Global Life, Beijing

Mark Li, who joined SCOR in 2011, is responsible for underwriting, claims and medical issues for the
Life & Health division in Beijing. He has more than 15 years of experience in the Life & Health insu-
rance industry and is a Fellow of the Life Management Institute. As a practicing doctor, he worked
for 14 years at the Internal Medicine department of a Teaching Hospital.

Léo Mallat
Group Senior Risk Manager, SCOR

Léo Mallat joined SCOR’s Risk Division in 2014. Previously Advisor to the Chairman and Head of
Public Affairs, he is now in charge of developing the Group Recovery Plan. Trained in biology, ac-
tuarial science and public health law, he began his career as a researcher (CNRS, INSERM, Veolia
Environment) and has also represented the French Government on a health and environment wor-
king group at the WHO.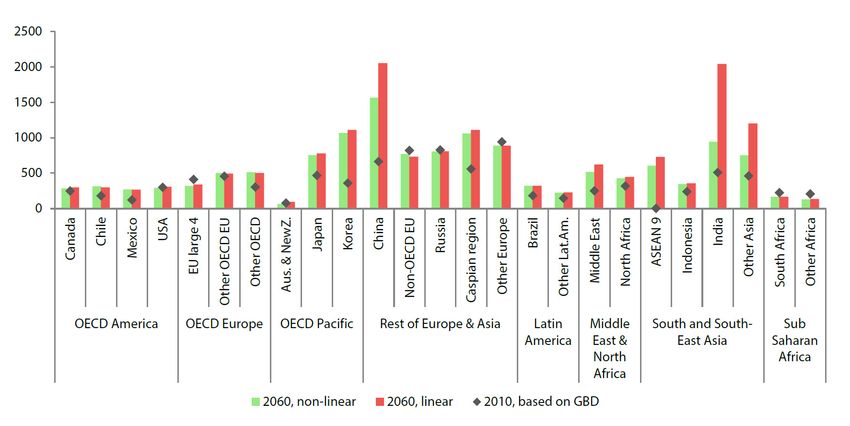
CONTENTS

       I. Air pollution: components and dynamics            p.5

             1.The different categories of air pollutants   p.5

             2. Dynamics and trends of air pollution        p.8

        II. Health effects of pollution						               p.12

		1. Short-term or long-term exposure                       p.12

		2. Respiratory diseases                                   p.16

		3. Cardiovascular diseases                                p.17

		4. Stroke                                                 p.17

		5. Cancer                                                 p.18

		6. Other health effects                                   p.19

		7. Reversibility of air pollution effects                 p.21

        III. Air pollution and the (re)insurance industry   p.22

		1.The cost of air pollution consequences on the economy   p.22

		2. A growing challenge for life (re)insurers              p.23

		3. Possible consequences for (re)insurance demand         p.25

        Conclusion								                                  p.26

        Appendix									 p.27

        Bibliography									 p.33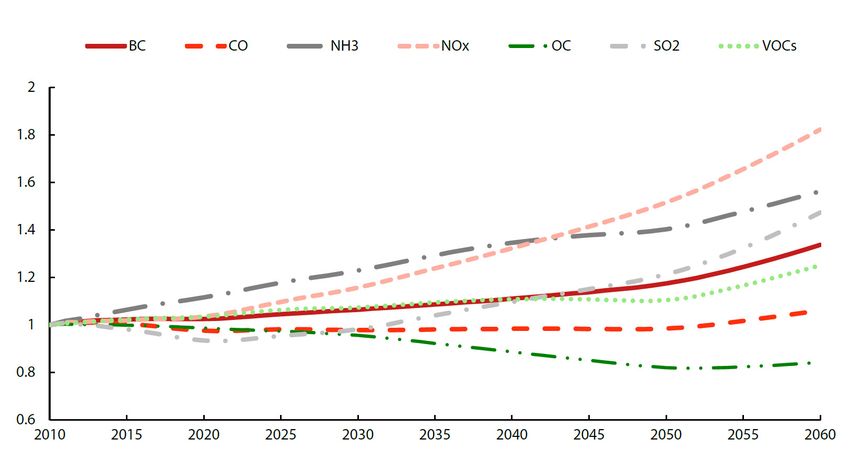
Abstract
     Air, water and food, in this order, are the core metabolic requirements for human
     life. A reduction in either the quality or quantity of any of these essential resources
     constitutes a major threat to human health.

     Due to the globalization of industrial production and energy needs, and to an
     increasing number of acute air pollution episodes in many cities worldwide, air
     pollution has become a growing concern over the past decade, with mounting
     evidence of its dramatic health impacts.

     Air pollution is today considered as the world’s most serious environmental health
     risk by the World Health Organisation (WHO). Numerous studies have consistently
     shown its deleterious effect on human health. It is estimated that polluted air was
     responsible for over 6 million deaths worldwide in 20161, twice as many as AIDS,
     tuberculosis and malaria combined. Ambient particulate matter, nitrogen dioxides
     and other pollutants have been associated with increased prevalence of a number of
     respiratory and cardiovascular diseases2, cancers and even appear to be correlated
     with neurodevelopmental disorders in children and neurodegenerative diseases
     in adult. Data on air quality indicators is becoming increasingly available and the
     science underlying the related health impact is also evolving rapidly3.

     As a global reinsurer with significant exposure to mortality risks, SCOR is monitoring
     the consequences of emerging risks that might have an impact on human life, such
     as air pollution, endocrine disruptors and anti-microbial resistance, to name a few.
     The (re)insurance industry has recognized that air pollution should be considered as
     an important emerging risk4.

     This paper presents the issue of air pollution and discusses the latest findings
     of fundamental research with regard to its consequences on human health. It is
     organized as follows: in the first section, the nature and dynamics of air pollution are
     described. In the second section, the consequences of air pollution on health are
     documented. In the last section, the consequences of air pollution on the (re)insurance
     industry are discussed.

1
 Global Burden of Disease Study, 2016 [1]
2
 Beelen et al., 2014 [2], Carey et al., 2013 [3], Cesaroni et al., 2013 [4], Turner et al., 2017 [5], Garcia et al., 2016 [6], Gakidou Emmanuela et al., 2017 [7]
3.
   Beelen et al., 2008 [8]
4.
   Risk Radar, CRO Forum https://www.thecroforum.org/wpcontent/uploads/2018/05/CRO-ERI_Emerging-Risk-RadarTrends_Apr2018_
FINAL.pdf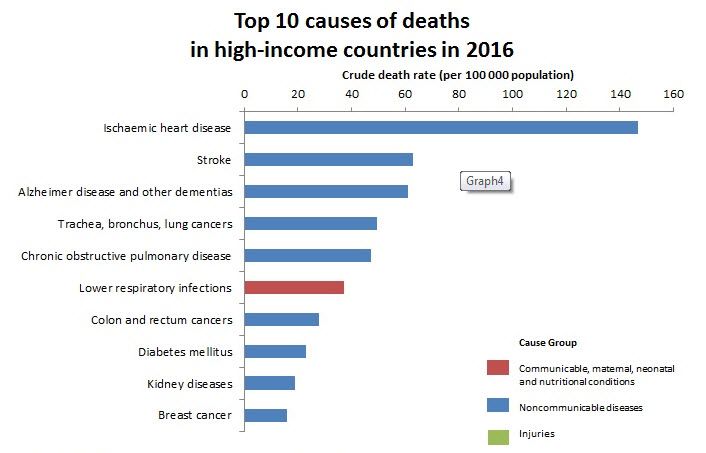
I. Air pollution: components and dynamics
            		                1. The different categories of air pollutants

The Earth’s atmosphere is composed mainly of dinitrogen (N2 : 78% by volume) and
dioxygen (O2 : 21% by volume). It can be polluted by gaseous, liquid and solid pollutants
either from natural sources or discharged in the atmosphere by human activities.
Natural sources include emissions from plants, from the biomass of the ocean, volcanic
gas and the re-suspension of dust in arid areas such as deserts. Anthropogenic sources
include combustion engines (both diesel and petrol), household and industry solid-
fuel combustion for energy production (coal, lignite, heavy oil and biomass), other
industrial activities (building, mining, manufacture of cement, smelting), agriculture,
with the use of entrants, and the erosion of roads by vehicles and abrasion of brakes
and tyres.

Man-made and natural discharge in the atmosphere can lead to both primary and
secondary pollutants.

Primary pollutants are directly released in the air, and include the following components :

   Particulate matter (PM10 and PM2.5);

   Carbon oxides (e.g. carbon monoxide);

   Oxides of sulphur;

   Ammonia;

   Light hydrocarbons;

   Volatile organic compounds;

   Metals (lead, mercury, cadmium).

Health impacts of air pollution - SCOR Paper #42 - July 2018                                  05
By contrast, secondary pollutants are formed in the atmosphere as a result of a
chemical reaction between gaseous precursors such as sulphur dioxide, oxides of
nitrogen, ammonia and non-methane volatile organic compounds. They include the
following elements:
Oxides of nitrogen5,
Ozone6.
a. Particulate matter (PM)
PM, or coarse particles7, consist of invisible solid and liquid particles with diameters of
either less than 10μm8 (PM10), or 2,5μm (PM2.5). They affect more people than any other
pollutant9, and can penetrate into the respiratory tract. PM2.5, being even smaller, can
reach the deepest areas of the breathing apparatus, such as the pulmonary alveoli10.
They include ultrafine particles having a diameter of less than 0.1µm. The chemical
compounds of PM include sulfates, nitrates, ammonium and other inorganic ions such
as sodium, potassium, calcium or magnesium, metals such as cadmium, copper, nickel
and zinc and biological components such as allergens or microbes11.
Figure 1: Schematic overview of the relative size of PM10, PM2.5 and ultrafine particles.
1 thousandth of 1 millionth of a 1 billionth of a
a meter meter meter
10 mm 100 µm 10 µm 2.5 µm 100 nm 10 nm
PM10 PM2.5 PM0.1
ants hairs cells bacteria viruses DNA
FINE
PARTICLES
COARSE ULTRAFINE PARTICLES
PARTICLES
1 mm 1 µm 1 nm
PM can be generated by industry, transport and agriculture, and due to their light
weight, can also be carried on air currents from one country to another. As an example,
two-thirds of the PM10 recorded in the Netherlands is estimated to have originated in
foreign countries12.
5
Amount of the loss divided by the value of the insured property
6
See paragraph c. Ozone.
7
WHO, 2013 [10]
8
One millionth of a metre.
9
WHO, 2018 [9]
10
Deng, X., Rui, W., Zhang, F. et al., 2013 [11]
11
WHO, 2013 [10]
12
Hendriks et al., [12]
06 Health impacts of air pollution - SCOR Paper #42 - July 2018The WHO 2005 Air Quality Guidelines (see Appendice, page 30) recommend
maintaining PM concentrations below the following levels:
› PM2.5: 10 µg.m-3 annual mean; 25 µg.m-3 24-hour mean;
› PM10: 20 µg.m-3 annual mean; 50 µg.m-3 24-hour mean.
According to the WHO, in 2016, 91% of the world population was living in places
where the air quality guidelines levels were not met.
b. Nitric oxides (NOx)
Nitric oxides include nitric oxide (NO) and nitrogen dioxide (NO2), the result of the
oxidation of nitric oxide by ozone. Nitrogen dioxide is a by-product of combustion
reactions, and typically appears during the burning of fossil fuels in power plants. In
cities, where it contributes to the formation of smog events13, most of the nitrogen
dioxide comes from motor vehicle exhaust.
Nitric oxide is an important molecule in human cells, but has a limited toxicity in the
concentrations at which it is found in the atmosphere. However, exposure to nitrogen
dioxide can decrease lung function and increase the risk of respiratory symptoms14.
c. Ammonia (NH3)
Ammonia is the most abundant alkaline gas in the atmosphere and the most commonly
produced chemical. It is a precursor for the nitrogen reaction chain and is produced
naturally from decomposition of organic matter, including plants, animals and wastes.
The largest source of NH3 emissions is agriculture, with both animal husbandry and
the use of fertilizers.
Being lighter than air, this gas usually rises and does not typically lead to immediate
impact on health. At high concentrations however, or in moist areas, ammonia leads
to throat and respiratory tract irritation.
d. Ozone
Ozone is known as the high altitude shield of the Earth, where it protects the
atmosphere against the harmful ultraviolet radiation emitted by the sun. However,
at lower altitudes ozone is a secondary pollutant resulting from a reaction between
nitric oxides and organic volatile compounds (as hydrocarbons present in petrol). This
photochemical process can only occur under the radiation of the sun, which explains
the summer-seasonality of ozone pollution events.
Ozone peaks have documented consequences on lungs15 and the respiratory tract16.
13
Wang et al., 2016 [13]
14
WHO, 2003 [14]
15
WHO, 2003 [14]
16
Anderson, H.R. et al., 2003 [15]
Health impacts of air pollution - SCOR Paper #42 - July 2018 07e. Sulphur dioxide
Sulphur dioxide (SO2) is a corrosive gas produced by the consumption of fuel
containing sulphur, such as coal and oil. It can also be discharged in the atmosphere
through natural processes, such as organic decomposition or volcanic eruptions.
Sulphur dioxide irritates the skin and mucous membranes (eyes, nose, throat and
lungs), and can affect the respiratory system.
Sulphur dioxide reacts with water in the air to form sulphuric acid, an important
component of the phenomenon of acid rain.
2. Dynamics and trends of air pollution
Air pollution is considered an emerging risk, and its dynamics depend on a broad
range of factors. A WHO global comparative analysis of air pollution17 concluded
that ambient air pollution increased by 8% between 2008 and 2013. In the absence
of more stringent policies, or disruptive technological changes, increasing
economic activity and energy demand will lead to a significant increase in global
emissions of air pollutants in the coming decades. This is because air pollution
mirrors the underlying baseline assumptions of economic growth, but at a slower
pace. The OECD has developed projections of emissions of pollutants over
time based on environmental-economic models (ENV Linkage models) where
some pollutants, in particular nitrous oxides, are expected to almost double by
2060. The figure below summarises the projected trends in emissions of the most
common pollutants, in particular black carbon (a component of fine particulate
matter – PM2.5), carbon monoxide, nitric oxides (NOx) and sulphur dioxide (SO2).
Figure 2: Emission projections over time indexed with respect to 201018
WHO, 2016 [18]
17
OECD, 2016 [16]
18
08 Health impacts of air pollution - SCOR Paper #42 - July 2018Pollution in ancient Rome.
Economic activities have always been associated with the discharge of pollutants
into the atmosphere. Residents of ancient Rome were already concerned about air
pollution, calling the city’s smoke cloud grave caelum (“heavy heaven”) and infamis
aer (“infamous air”)19. Philosopher and statesman Seneca even wrote, in A.D. 61
“No sooner had I left behind the oppressive atmosphere of the city and that reek of
smoking cookers which pour out, along with clouds of ashes, all the poisonous fumes
they’ve accumulated in their interiors whenever they’re started up, than I noticed the
change in my condition”.
The analysis of ancient Greenland ice provides evidence for the presence of lead in
the air at the time of the Roman Empire, due to a process of silver extraction, making
it the oldest report of international atmospheric pollution.
Finally, there are geographical discrepancies in both levels and trends of air pollution,
due to the uneven level of development and population concentration around the
globe. The concentration of pollutants, and in particular of PM, are already above
the levels recommended by the WHO Air quality guidelines in a number of regions,
such as in South and East Asia. Several studies have demonstrated that air pollution
negatively correlates with the level of income of countries, as Europe, the Americas
and the Western Pacific Region face low levels of pollution, while urban air pollution
averages in the Eastern Mediterranean and South East Asia can exceed WHO limits
by up to 5-10 times20.
Frontinus, De Aquis Urbis Romae, 1st Century AC. [17]
19
Beelen et al., 2008 [8]
20
Health impacts of air pollution - SCOR Paper #42 - July 2018 09Figure 3: Trend in PM2.5 or PM10 based on cities available in several versions of the database, by
region1 (Source: WHO, WHO’s urban ambient air pollution database-update 2016)21
Region Trend over the mean period 2008-20132
Africa (Sub-Saharan) NA
America, LMI
America, HI
Eastern Mediterranean, LMI
Eastern Mediterranean, HI
Europe, LMI
Europe, HI
South-East Asia
Western Pacific, LMI
Western Pacific, HI
World3
1
Criteria for inclusion: cities with measured PM2.5 or PM10 values in the three database
versions covering a period of 3 years or more, or in two versions and covering a period
of 4 years or more.
2
: No more than 5% change over the five-year period;
: More than 5% decrease over the five year period;
: More than 5% increase over the five-year period.
3
The mean for the World is based on weighting by regional urban population.
LMI: Low- and middle-income countries; HI: High-income; NA: Not available.
Results are based on 795 cities and are to be interpreted with caution, as 1) cities
included might not ensure representativeness, 2) yearly variations due for example to
climatic changes can be important and 3) a 5-year comparison does not necessarily repre-
sent trends, in particular when changes are limited.
21
WHO, 2016 [19]
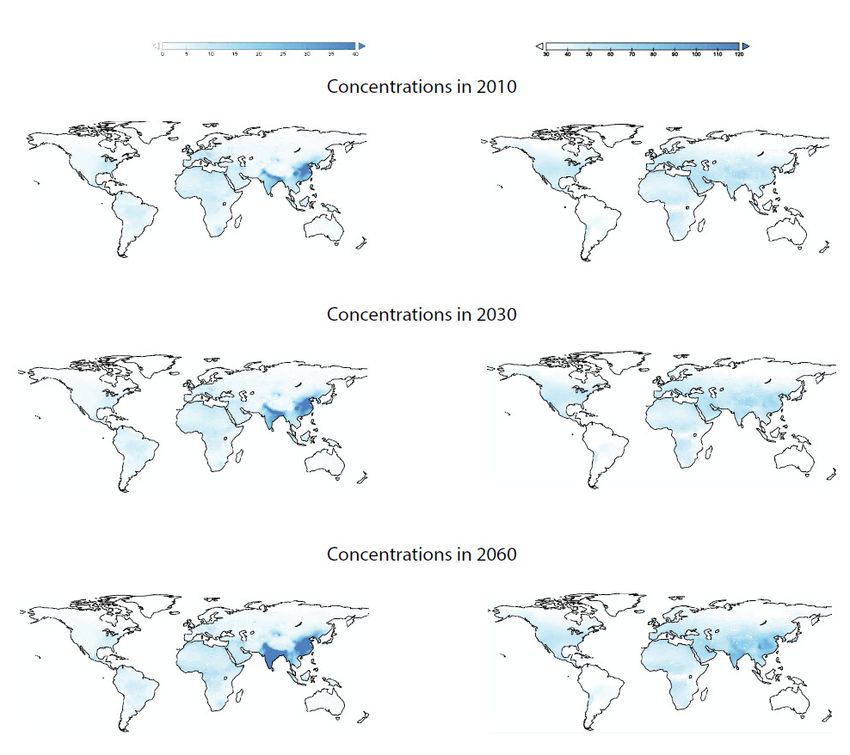
10 Health impacts of air pollution - SCOR Paper #42 - July 2018The figure below illustrates the expected disparities in projected pollution levels.
While concentrations are expected to grow overall, this growth should be more rapid
in South and East Asia. It is expected that in some high concentration areas, such as
large cities, pollution levels will permanently remain above recommended levels.
Figure 4: Projection of emissions of particulate matter and ozone.
Projected annual average PM2.5 (left) and maximal 6 month mean of daily maximal hourly ozone (right)22
OECD, 2016 [16]
22
Health impacts of air pollution - SCOR Paper #42 - July 2018 11II. Health effects of pollution
Numerous studies have found an association between air pollution and several adverse
health effects in the general population. These effects range from subclinical effects
to premature death, and include notably the following consequences:
Increased respiratory ailments (bronchiolitis, rhinopharyngitis, bronchial hypersecretions);
Degradated ventilator function (lower breathing capacity, asthma, coughing);
Eye irritation;
Increased cardiovascular morbidity;
Depleted immune system;
Impact on short-term mortality due to respiratory and cardiovascular diseases;
Impact on long-term mortality linked to the carcinogenic effect of pollutants.
Air pollution is a major cause of non-communicable diseases. It is estimated that at
least 3% of cardiopulmonary and 5% of lung cancer deaths are attributable to PM
globally. The most recent study on the Global Burden of Disease estimates that 7.5%
of deaths globally were attributable to ambient air pollution in 2016. In the same year,
27.5% of deaths due to Lower Respiratory Tract Infections and 26.8% of deaths due to
Chronic Obstructive Pulmonary Diseases were linked to air pollution. This chapter will
review the impact of air pollution on the major sources of deaths globally23.
1. Short-term or long-term exposure
The impact of environmental risk factors changes depending on the type of exposure.
Short-term peak and long-term chronic exposure do not follow the same dynamics
and do not lead to the same consequences. This section describes the differences
between the health effects of short-and long-term exposure to air pollution. Overall,
risk estimates of long-term exposure studies are higher than those of short-term
exposure studies.
See Appendix 1 for a chart of the top 10 causes of deaths globally in 2015.
23
12 Health impacts of air pollution - SCOR Paper #42 - July 2018a. Short-term exposure Scientific studies have consistently observed associations between adverse mortality and short-term elevations in ambient air pollution. The level of pollution varies on a daily basis following patterns which depend on human activities, meteorological conditions and the seasons. Several recent epidemiological studies have compared daily mortality to pollution exposure, in particular to PM. As an example, particle concentrations and mortality in six eastern US cities have been measured for eight years24. The strongest association was found with PM2.5: a 10 µg.m-3 increase in the two-day mean of PM2.5 concentration was associated with an average 1.5%25 increase in total daily mortality. Larger increases were found for deaths caused by chronic obstructive pulmonary disease (+3.3%) and ischaemic heart disease (+2.1%). Over the last decade, daily measures of ambient PM10 have been collected in Bangkok. The analysis indicates a statistically significant association between PM10 concentration and all of the alternative measures of mortality. The results suggest a 10 µg.m-3 increase in daily PM10 is associated with a 1-2% increase in natural mortality, a 1-2% increase in mortality associated with cardiovascular affections, and a 3-6% increase in respiratory mortality26. The association between daily pollution and daily mortality has been confirmed by hospital admission data. A US study has demonstrated an association between short- term increases in hospital admission rates and PM2.5 for all health outcomes except injuries27. The strongest association was for heart failure, which had a 1.28%28 increase in risk per 10 µg.m-3 increase in same-day PM2.5. This daily sensitivity of mortality has been confirmed for almost all pollutants. Mustafic et al.29 assessed and quantified the association between short-term exposure to major air pollutants (ozone, carbon monoxide, nitrogen dioxide, sulphur dioxide, and PM) on myocardial infarction risk30. In addition to daily mortality analysis, it has been demonstrated that, as in the case for the influenza virus, mortality associated with air pollution varies seasonally. This is because seasonal variation in meteorological conditions, sources of pollution and human behavioural patterns lead to seasonal differences in personal exposure31. In Europe and in the US, the effects of air pollution appear to be more apparent during the summer32. This sensitivity can be analysed at country level: while in China, mortality associated with air pollution is higher in summer and winter, autumn is the worst season in South Korea, and spring and autumn have the highest death rates associated with air pollution in Japan33. 24 Joel Schwartz et al., 1996 [20] 25 1.1% to 1.9% with a 95% confidence interval (CI). 26 Bart Ostro et al.,1999 [21] 27 Francesca Dominici et al., 2006 [22] 28 0.78%-1.78% with a 95% CI 29 Hazrije Mustafic et al., 2012 [23] 30 Resp., carbon monoxide: 1.048; 95% CI, 1.026-1.070; nitrogen dioxide: 1.011; 95% CI, 1.006-1.016; sulphur dioxide: 1.010; 95% CI, 1.003-1.017; PM10:1.006; 95% CI, 1.002-1.009; and PM2.5: 1.025; 95% CI, 1.015-1.036 31 Wan-Hsiang Hsu et al., 2017 [24] 32 Stafoggia et al., 2008 [25], Moolgavkar S. H.,et al., 1996 [26] 33 Kim et al, 2017 [27] Health impacts of air pollution - SCOR Paper #42 - July 2018 13
Under specific circumstances, the concentration of pollutants can increase more
     dramatically and lead to possibly even more severe consequences on human health.
     Historically, the London Smog of 1952 was the first catastrophic pollution event in
     Western Europe, causing thousands of deaths and disrupting the city’s transport
     system for several days. More recently, in November 2017, concentrations of PM2.5 in
     Mumbai reached the extreme level of 1,010 µg.m-3 during a smog episode that lasted
     several days. As pollutant concentrations are expected to rise globally in the future,
     the frequency of high-concentration events could increase, notably in association
     with global warming, continued urbanisation and internationalisation of industrial
     production.

14                                            Health impacts of air pollution - SCOR Paper #42 - July 2018

     The deadly London smog

     In 1952, London was brought to a standstill by a dense toxic smog that reduced
     visibility to a few feet and killed thousands of people, in what remains the worst
     air pollution crisis in European history.

     A wintry cold snap had gripped the British capital in November and December
     1952, with heavy snowfalls around the region, and temperatures far below seasonal
     averages. The people of London, trying to keep warm, burned large quantities of
     coal in their homes, causing smoke to pour from the chimneys of their houses.
     Under normal conditions, the smoke would rise into the atmosphere and be
     dispersed by the wind, but an anticyclone pushing the air downwards trapped the
     smoke at ground level. The anticyclone had the same effect on particles and gases
     emitted from factory chimneys and motor vehicles in the London area, along with
     pollution which the wind carried from industrial areas of the continent. Overall, it
     is estimated that during the period of the smog, 1,000 tonnes of particles, 2,000
     tonnes of carbon dioxide and in particular 370 tonnes of sulphur dioxide were
     emitted34.

     The smog lasted from the 5th to the 9th of December. It was so dense that in some
     sections of the city residents were unable to see their feet as they walked. Except
     for the underground train system, all transportation was crippled: drivers had
     to turn on their headlights and walk in front of buses with flashlights in broad
     daylight to inch ahead in the gloom, while boat traffic on the Thames, flights and
     trains were cancelled.

     This smog proved to be so deadly that undertakers ran out of coffins, and florists
     out of bouquets as the death rate in London’s East End increased ninefold in
     the aftermath of the smog. It killed 4,000 people directly, but mortality did not
     return to normal levels for several months after the episode (total mortality rates
     were 50% and 40% higher for January and February, respectively, compared to
     the previous year). Overall, the most recent studies estimate that this event was
     directly responsible of the death of 12,000 people, and that more than 100,000
     were made ill35. It led to several regulations such as the City of London Act of
     1954, the Clean Air Acts of 1956 and 1968, as reducing the level of air pollution
     had become a priority.

 Scott JA, 1963 [28]
34

 Stone R., 2002 [29]
35

Health impacts of air pollution - SCOR Paper #42 - July 2018                                15
b. Long-term exposure:
It is reasonable to expect that impact estimates could be different for different
time scales of exposure, that long-term repeated exposure could have greater,
more persistent effects than transient short-term exposure, and that long-term
average exposure could be different from the cumulative effect of transient short-
term exposure. The multicentre European Study of Cohorts for Air Pollution Effects
(ESCAPE) aimed to investigate the association between natural-cause mortality and
long-term exposure to several air pollutants. The study used data from 22 European
cohort studies from general population samples. The total study population consisted
of over 350,000 participants who contributed over 5 million person-years to the at-risk
database (with an average follow-up period of 13.9 years). Long-term exposure to
fine particulate air pollution was associated with natural-cause mortality, even within
concentration ranges well below the present European annual mean limit value36,37.
In addition, a prospective longitudinal cohort study investigated very long-term (38
years) mortality risks of air pollution in England. This study modelled air pollution
concentrations in 1971, 1981, 1991 and 2001 in relation to mortality up to 2009 in 367,658
members of the longitudinal survey, a 1% sample of the English Census. Pollutants
such as SO2 remained associated with increased mortality decades after exposure.
While PM10 exposure in 2001 was significantly associated with belated respiratory
and cardiovascular mortality, adjusting it for past pollutant exposures in 1971, 1981
and 1991 made cardiovascular and respiratory associations lose significance. This
large national study suggests that air pollution exposure has long-term effects on
mortality that persist decades after exposure, and that historic air pollution exposures
influence current estimates of associations between air pollution and mortality38.
Furthermore, there is emerging evidence suggesting possible links between long-
term PM2.5 exposure and neurodevelopment, cognitive function39, cellular aging40 and
neurodegenerative diseases41 (Parkinson, Alzheimer’s) as well as other chronic disease
conditions, such as diabetes.
2. Respiratory diseases
As described in the introduction to this chapter, it is estimated that ambient air
pollution is responsible for 27.5% of deaths due to lower respiratory tract infections.
In addition to respiratory infections, multiple sources have demonstrated that
exposure to air pollution early in life might contribute to the development of asthma
throughout childhood and adolescence. Ulrike Gehring, et al.42, based on a cohort
study of 14,126 participants from Germany, Sweden, and the Netherlands with 14-16
years of follow-up, showed an association between PM2.5 and incidence of asthma.
Reductions in levels of air pollution could therefore help prevent the development of
asthma in children.
36
A significantly increased hazard ratio (HR) for PM2.5 of 1.07 (95% CI 1.02-1.13) per 5 μg/m3 was recorded.
37
Beelen et al., 2014 [2]
38
WHO, 2003 [14], Anna Hansell et al., 2016 [30]
39
Lett et al., 2017 [31]
40
Ward-Caviness et al., 2016 [32]
41
Liu et al, 2016 [33]
42
Ulrike Gehring et al., 2015 [34]
16 Health impacts of air pollution - SCOR Paper #42 - July 20183. Cardiovascular diseases
Alongside respiratory disorders, cardiovascular diseases have also been widely
documented as being associated with air pollution.
In particular, the progression of coronary artery calcium and common carotid artery
intima-media thickness has been associated with long-term exposure to ambient air
pollution43. In a prospective 10-year cohort study, researchers repeatedly measured
coronary artery calcium in 6,795 participants aged 45-84 years in the USA. For each
5 μg.m-3 increase in PM2.5, coronary calcium progressed by 4.1 Agatston units per year
(95% CI 1.4–6.8).
Particulate matter has also been associated with the short-term risk of mortality from
ischaemic heart disease, haemorrhagic stroke and ischaemic stroke44. A cohort study
in China concluded that an increase in PM2.5 of 10 μg.m-3 led to a 9.7% increase in the
risk of mortality from ischaemic heart disease, a 4.4% increase in the risk of mortality
from haemorrhagic stroke, and a 13.5% increase in the risk of mortality from ischaemic
stroke45. Other studies have assessed the association between air pollution and acute
decompensated heart failure including hospitalisation and heart failure mortality,
and concluded that increases in PM concentration were associated with heart failure,
hospitalisation or death46.The strongest correlations were seen on the day of exposure,
with more persistent effects for PM2.547.
In conclusion, both short- and long-term exposure to air pollution have been shown
to be linked to significant increases in both the development of and mortality from a
number of cardiovascular diseases.
4. Stroke
Air pollution has also emerged as a significant contributor to the global stroke
burden, especially in low-income and middle-income countries48. A study based
on data from the Global Burden of Disease Study 2013, estimated the population-
attributable fraction of stroke-related disability-adjusted life-years (DALYs) associated
with potentially modifiable environmental, occupational, behavioural, physiological,
and metabolic risk factors in different age and sex groups, in high, middle and low-
income countries. The environmental factor of air pollution was the second-largest
contributors to DALYs. Globally, 29.2%49 of the burden of stroke was attributed to air
pollution.
43
Joel Schwartz et al., 1996 [20], Peng Yin et al., 2015 [35]
44
Anoop S V Shah et al., 2013 [36]
45
Resp. HR 1.097, 95% CI 1.079–1.116, HR 1.044, 95% CI 1.031–1.057, HR 1.135, 95% CI 1.113–1.158.
46
PM2.5, 2.12% per 10 μg/m3, 95% CI 1.42-2.82; PM10, 1.63% per 10μg.m-3, 95% CI 1.20-2.07
47
IARC of WHO, 2013 [37]
48
Anoop S V Shah et al., 2015 [38]
49
95% UI 28.2–29.6
Health impacts of air pollution - SCOR Paper #42 - July 2018 17This association was confirmed notably by a systematic review and meta-analysis of 2,748
articles, accounting for a total of 6.2 million events across 28 countries and concluding that
increases in PM2.5 and PM10 concentration were associated with admission and mortality
for stroke relative risk 1.011 per 10 μg.m-3 and 1.003 per 10 µg.m-3, respectively50.
5. Cancer
The IARC, the World Health Organisation agency specialized in cancer, has classified
outdoor air pollution as carcinogenic to humans since 2013. Particulate matter, a major
component of outdoor air pollution, was evaluated separately and was also classified
as carcinogenic to humans. The IARC report is based on an independent review of
more than 1,000 scientific papers including large epidemiological studies of millions
of people living in Europe, North and South America, and Asia51. It demonstrated
an increased risk of lung cancer with increased levels of exposure to PM and air
pollution. It also noted a positive correlation with the risk of bladder cancer. Although
the composition of air pollution and levels of exposure can vary dramatically between
locations, the conclusions of the working group apply to all regions of the world.
The IARC also specifically reviewed the risk of cancer due to outdoor air pollution
in China. Epidemiologic data from China, although limited, associated several
air pollutants with an increased risk of lung cancer. This association has also been
replicated via in vivo experimentation on animals exposed to polluted outdoor air or
extracted PM. Numerous studies from China, especially genetic biomarker studies
in exposed populations, concurred that the polluted air in China is genotoxic and
carcinogenic to humans52.
Lung cancers take time to develop and could be associated with chronic long-term
exposure to air pollution rather than with short-term peaks. Indeed, the incidence of
lung cancer has been positively associated with increments in 2-year mean PM2.553.
It has also been found that this risk is more pronounced for women than for men54.
The association is less significant in rural areas than in urban areas55 and is stronger
in elderly people (>75 years of age) compared to younger people (30–65 years
old)56,which could be explained notably by differences in the duration of exposure to
carcinogenic pollutants.
In Europe, a prospective analysis by the European Study of Cohorts for Air Pollution
Effects, based on data from 17 European cohorts focused on the incidence of lung
cancer cases during a 12.8-year follow-up period57. The meta-analyses demonstrated
a statistically significant association between the risk of lung cancer and both PM10 and
PM2.558.
50
Yuming Guo et al., 2016 [39]
51
Dana Loomis et al., 2014 [40]
52
Wang et al., 2016 [42]
53
Ole Raaschou-Nielsen et al., 2013 [43]
54
A significantly increased hazard ratio (HR) for PM2.5 of 1.07 (95% CI 1.02-1.13) per 5 μg/m3 was recorded.
55
RR 1·037, 95% CI 0·998–1·078 and RR 1.060, 95%CI 1.044–1.075, respectively; P=0·03.
56
RR 1.111, 95% CI 1.077-1.146, RR 1.074, 95% CI 1.052-1.096, respectively; P=0.07.
57
Valery L Feigin et al., 2013 [44]
58
Hazard ratio [HR] of 1.22, 95% CI 1.03–1.45 per 10 μg.m-3, 1.18, 95% CI 0.96-1.46 per 5.μm-3.
18 Health impacts of air pollution - SCOR Paper #42 - July 2018From an individual standpoint, smoking has a bigger effect on the risk of developing
lung cancer than air pollution. However, while only a portion of the population
is exposed to smoking, almost everyone breathes polluted air at some point. This
explains why air pollution is considered a significant driver for lung cancer in the
overall population. In the UK, the Institute for Cancer Research estimates that 7.8% of
lung cancers are linked to air pollution in the UK.
6. Other health effects
a. Infant health
The epidemiologic impact of pollution on the population also apply to infants. Recent
studies have underlined specific risks that air pollution could represent for infants, and
even on the intrauterine growth.
The relationship between intrauterine growth retardation (IUGR) and exposure to
PM10 has been documented59. An analysis of the highly polluted district of Teplice
(Northern Bohemia) led to an investigation on the possible role of the carcinogenic
fraction of polycyclic aromatic hydrocarbons (c-PAHs), which are usually bound to
fine particles. The results indicated that exposure to c-PAHs in early gestation may
influence foetal growth. The particulate matter–IUGR association observed earlier may
be at least partly explained by the presence of c-PAHs on particle surfaces. In 2011, a
study was performed on 74,178 women who had had single baby deliveries between
February 1994 and June 2011. For these births, information was available on infant
birthweight, gestational age, and sex. The study concluded that a 5 µg.m-3 increase in
the concentration of PM2.5 during pregnancy was associated with an increased risk of
low birthweight at term60,61. An increased risk during pregnancy62 was also recorded
for concentrations below the present European Union annual PM2.5 limit of 25 µg.m-3.
PM10 was also associated with increased risk of low birthweight at term. The population
attributable risk estimated for a reduction in PM2.5 concentration to 10 µg.m-3 during
pregnancy corresponded to a decrease of 22% (95% CI 8–33%) in cases of low
birthweight at term.
In addition, post-neonatal infant mortality was compared with levels of PM10
concentration during the two months after birth63. After controlling for maternal
race, maternal education, marital status, month of birth, maternal smoking during
pregnancy, and ambient temperatures, the study results demonstrated an association
between PM pollution and post-neonatal infant mortality for respiratory causes and
sudden infant death syndrome.
59
Marie Pedersen et al., 2013 [46]
60
Adjusted odds ratio [OR] 1.18, with 95% CI 1.06–1.33.
61
Ulrike Gehring et al., 2015 [34]
62
OR for 5 μg.m-3 increase in participants exposed to concentrations of less than 20 μg.m-3 1.41, 95% CI 1.20–1.65.
63
C. Arden Pope III et al., 2006 [47]
Health impacts of air pollution - SCOR Paper #42 - July 2018 19b. Neurodegenerative and neurodevelopmental consequences
of air pollution
Recent studies have demonstrated that long-term exposure to air pollution is associated
with age-related diseases. Firstly, all the aforementioned diseases (cardiovascular,
cancer, respiratory diseases) are themselves associated with ageing64. Secondly,
exposure to air pollution has been associated with DNA damage65, epigenetic
alterations66 and oxidative stress. One possible explanation for this correlation is that
air pollution, in particular particulate matter and nitric oxides, could be associated
with the reduction of telomere length, a core parameter of the biological process of
ageing67. Studies have therefore investigated the relationship between air pollution
and cognitive ageing and have demonstrated that the former could accelerate the
latter and with it the risk of Alzheimer’s disease and other forms of dementia68.
c. Other human physiological functions
In addition to the impact on the diseases mentioned in the previous paragraphs,
several studies have provided evidence to suggest further consequences of air
pollution on human health. A recent Chinese study demonstrated that increased
concentrations of PM10, SO2, and NO2 were significantly associated with deteriorations
in many categories of physiological function, such as increase in heart rate and
blood pressure (heart function), increase in urine creatinine and urea (renal function),
decrease in haemoglobin and white blood cell (haematopoietic function), increase
in cholesterol, low-density lipoprotein, high-density lipoprotein, and the ratio of low-
density lipoprotein to high-density lipoprotein (metabolic endocrine function), increase
in serum albumin, glutamic-pyruvic transaminase, and total bilirubin (liver function),
and increase in C-reactive protein (inflammatory response function)69. Generally,
elderly people, women, and overweight people appear to be more susceptible to air
pollution than young people, men, and people of normal weight. This study illustrates
the fact that air pollution could systemically damage a number of human physiological
functions.
64
Fries et al., 1980 [48]
65
Risom et al., 2005 [49]
66
Bind et al., 2014 [50]
67
Ward-Caviness et al., 2016 [51]
68
Underwood, 2017 [52]w
69
Jan Dejmek et al., 2000 [45]
20 Health impacts of air pollution - SCOR Paper #42 - July 20187. Reversibility of air pollution effects There is consistent evidence to suggest that lower air pollution levels following a sustained, long-term exposure results in health benefits for the population, with rapid improvement in population health (a few years after the reduction in pollution). A few examples are summarized below. These examples of successful intervention show that decreased levels of particulate air pollution can substantially diminish total respiratory and cardiovascular death rates70. A cohort of adults living in six cities in the United States was followed from 1974 to 2009 in order to estimate the effects of air pollution on mortality. Overall, PM2.5 concentration had decreased to below 15 µg.m-3. The main finding was that a 2.5 µg.m-3 decrease in the annual average level of PM2.5 was associated with a 3.5% reduction in all-cause mortality71. A copper smelter strike in 1967-68 in four US states, and the closure and reopening of a steel mill in Utah Valley in 1986-87, are two examples of unplanned events that had a positive impact on health by decreasing air pollution concentration in specific areas. Furthermore, the reported 3.2% drop in daily numbers of deaths was associated with a simultaneous fall in PM10 levels of approximately 15 µg.m-3 while the steel mill was closed, the strongest association being with respiratory deaths72. A Swiss Study on Air Pollution and Lung Diseases in Adults assessed lung diseases in adults from eight Swiss communities in 1991 and again in 2002. Falling levels of regional PM10 were associated with a declining prevalence of various respiratory symptoms, including chronic cough, bronchitis, common cold, nocturnal dry cough and conjunctivitis symptoms73. 70 WHO, 2013 [10] 71 WHO, 2013 [10] 72 WHO, 2013 [10] 73 WHO, 2013 [10] Health impacts of air pollution - SCOR Paper #42 - July 2018 21
III. Air pollution and the (re)insurance industry
                              1. The cost of air pollution: consequences on the economy

     In addition to having an impact on the liabilities of (re)insurance companies, air
     pollution could have an impact on their assets, through a more global impact on
     the economy. Indeed, economic activity generates air pollution, which through its
     biophysical effects (morbidity and mortality) imposes economic costs. The World Bank
     stated in a recent report that “premature deaths due to air pollution in 2013 cost the
     global economy about $225 billion in lost labour income, or about $5.11 trillion in
     welfare losses worldwide. This is about the size of the gross domestic product of India,
     Canada, and Mexico combined – and a sobering wake-up call”74.
     These costs can be market-based, and materialise through concrete economic
     transactions that have a monetary cost, such as lost labour productivity, admissions to
     hospitals and disease treatment, diminished agricultural yields or decreased tourism
     revenues. They can also be non-market based, i.e. not give rise to concrete monetary
     transactions, in which case they can be inferred from the sum of money that economic
     agents would be ready to pay to avoid their detrimental consequences (death and
     suffering).

     Computing the aggregate market-based cost of pollution requires the combination
     of at least three different models: one that translates economic activity into air
     pollution, another that quantifies the biophysical effects of air pollution (number and
     geographical extent of deaths and diseases) and one that models the effect of death
     and disease on economic activity.
     Needless to say, such a chain of models gives a necessarily simplified representation
     of reality, because it requires numerous assumptions that (i) reflect our ignorance and
     (ii) make the mathematical system manageable.
     The OECD has recently proposed a model of the market-based costs of outdoor air
     pollution that takes into account lost labour productivity, increased expenditure on
     health and diminished agricultural yields. Estimated at 0.3% of world GDP, these costs
     are expected to grow much faster than GDP and reach 1% of GDP in 2060. The bulk of
     the cost would be accounted for by lost labour productivity and health expenditures.
     These market costs tend to be concentrated in Eastern Europe and Asia. China, for
     example, would incur an economic loss equivalent to 2.5% of GDP in 2060. More
     developed OECD countries would suffer relatively less, with the impact on the USA for
     example, being less than 0.5% of GDP.

      World Bank, 2016 [53]
     74

22                                              Health impacts of air pollution - SCOR Paper #42 - July 2018
Non-market costs do not stem from concrete economic transactions, so their cost is
purely virtual; it is evaluated on a willingness-to-pay basis. If people could pay to avoid
the suffering and risk of death from air pollution, how much would they be ready to
pay for it? This amount is estimated through direct valuation studies that aggregate
individual willingness-to-pay to arrive at the aggregated value of a statistical life or life
in good health.
Based on such measures, the OECD estimates that the non-market based cost of
premature deaths would rise sevenfold by 2060, from USD 3 trillion in 2015 to EUD
18-25 trillion in 2060. The cost of morbidity, estimated at USD 2 trillion in 2060, should
also be added to this figure . Taken together, this adds up to USD 20-27 trillion in 2060,
which is several orders of magnitude higher than the amount of market-based costs
(USD 3.3 trillion in 2060). This should not come as a surprise given that the bulk of the
cost is accounted for by the value of lost lives, which is necessarily higher than that of
lost agricultural crops or industrial output in people’s own subjective valuation used to
derive willingness-to-pay measures.
Microeconomic studies have also successfully established that local non-market
based costs of air pollution can be very high. For example, Jha and Muller (2017)75
demonstrated that non-market costs of higher mortality induced by US powerplant
coal stockpiles in a 25-mile radius are four times higher than the market cost of coal
paid by powerplants. Barreca et al. (2017) show that the non-market based costs of
higher mortality induced by coal powerplants are high and increase markedly with the
length of exposure to the pollutants76.
2. A growing challenge for life (re)insurers
As described in the numerous studies reviewed in this publication, air pollution has
already had significant adverse effects on mortality and morbidity. The current forecasts
for the development of air pollution in the coming decades indicate that its global
impact will be even more severe in the future. This has significant consequences for
human life and will therefore affect the insurance and reinsurance industries, which will
have to adapt their policies and services to meet a growing threat.
Akshaya Jha, Nicholas Z. Muller 2017 [54]
75
Barreca et al., 2017 [55]
76
Health impacts of air pollution - SCOR Paper #42 - July 2018 23The first consequence is that air pollution increases mortality and morbidity of critical
conditions on both the short and long term. Claims and premiums already reflect the
impact of pollution in areas where air quality has been steady in recent years. Due to
the projected increase in air pollution, however, the long-term trend will most likely
lead to an increase in claims. On the other hand, the consequences of short-term smog
events, which could occur more frequently as global levels of pollution rise, will have
to be understood and might pose a particular threat to local (re)insurers. Actuaries,
underwriters and risk management need to form a view on how much the levels of air
pollution will affect future claims, and how these losses will be distributed between
trend and short-term risk. Insurers and reinsurers will have to anticipate the possible
lag between cause and effect in particular cases associated with long-term exposures
in order to produce appropriate pricing. Last, discrepancies among local levels of
air pollution could lead to significant variations in pricing assumptions. The OECD
projected the number of premature deaths from exposure to ozone and particulate
matter by 2060 in several areas of the world, taking into account the increase in
pollutant concentrations, in urbanisation and aging population. The below figure
highlight the geographical disparities mentioned in the first chapter of this report.
The highest number of deaths is expected to take place in non OECD economies, but
small increases can also be expected in OECD countries, as Japan or Korea.
Figure 5: Premature deaths from exposure to particulate mater and ozone by 206077
OECD , 2016 [16]
77
24 Health impacts of air pollution - SCOR Paper #42 - July 2018To manage a cause of aggravated risk, insurance companies often have recourse
to medical selection, to propose a bespoke premium for a given policyholder risk.
In the case of air pollution, as everyone must breathe outside air, such a process
would be challenging to implement. One could even argue that behaviours normally
associated with improved risk profile, such as the regular practice of sports, could
see its benefits lowered if the activity is taking place in an area where there are high
levels of air pollution. The latest findings indicate that the benefits of sports outweigh
the consequences of air pollution, even in polluted areas78. On the other hand, other
studies have demonstrated that outside air pollution discourages physical activity,
possibly leading to other negative side effects79.
3. Possible consequences for (re)insurance demand
In addition to the consequences on health, air pollution could directly impact insurers’
businesses, because it could lead to an increase in demand for coverage as the threat
of these potential illnesses becomes better known by people and governments. This
demand could lead (re)insurers to develop appropriate products and services.
Some local initiatives demonstrate this trend, as in the case in China, where the
Ministry of Environmental Protection and the China Insurance Regulatory Commission
(CIRC) released a draft regulation in 2017 for mandatory pollution cover on specific
industries. Indeed, companies in eight categories of businesses (including oil and gas,
chemicals, pharmaceutical engineering) will now have to buy environmental insurance
cover for the costs of pollution in a liability policy. This will lead to the development of
new types of coverage for (re)insurers.
As described in the first chapter, air pollution is expected to increase more dramatically
in less developed countries. In spite of substantial increases in premium growth rates
in recent years, insurance penetration is still lower in these countries, leading to the
so-called insurance protection gap80. The fact that air pollution could have more
severe consequences in these regions of the world increases both the need to close
the protection gap and the challenge it could create, in terms of the magnitude of
potential losses for the (re)insurance industry.
78
Silva-Renno et al., 2017 [56]
79
An et al., 2017 [57]
80
Kai-Uwe Schanz and Shaun Wang (ed.), 2014 [58]
Health impacts of air pollution - SCOR Paper #42 - July 2018 25Conclusion
Air pollution will be a rising concern in the coming years, with significant consequences
on the (re)insurance industry. Beyond its future impact, this emerging risk already
significantly affects mortality and morbidity of several critical conditions including
cardiopulmonary illnesses, cancer, stroke, etc. This report could incentivise (re)insurers
to follow several recommendations, summarized below:
Add air pollution to the list of emerging risks to be monitored by risk management;
Identify the current exposure of mortality and morbidity portfolios to air pollution,
and develop extreme scenarios to assess the potential impact of a severe pollution event;
Draw the attention of public authorities to the need to provide high standards database
and forecasts of air pollution levels;
Promote awareness on the impact of air pollution and the best prevention measures
that can be taken;
Acknowledge that some sectors or lines of business such as thermal coal pose greater
environmental risks and support endeavours to disengage from these industries
on both the asset management and the underwriting sides.
26 Health impacts of air pollution - SCOR Paper #42 - July 2018Appendix
I. Top 10 causes of death globally (WHO)81
WHO [59]
81
Health impacts of air pollution - SCOR Paper #42 - July 2018 27II. Methodology
Epidemiological, toxicological, and clinical studies have shown PM mass comprises
fractions with varying types and degrees of health effects, suggesting a role for both
the chemical composition and physical properties.
Epidemiological studies: For coarse particles, there was only limited
epidemiological data. The availability of epidemiological data has significantly
increased since 2005. Taking into account the newest evidence on the effects of coarse
PM on cardiorespiratory health, the EPA (United States Environmental Protection
Agency) has integrated scientific assessment for PM and concluded that, in general,
short-term epidemiological studies reported positive associations between mortality
and cardiovascular and respiratory hospital admissions. Black carbon (BC) is the
most strongly light-absorbing component of PM and it is emitted directly into the
atmosphere in the form of fine and ultrafine particles. Two-pollutant models in time-
series studies suggested that the effect of BC particles was more robust than the
effect of PM mass82.
Evidence was also judged sufficient for an association between long-term BC
concentration and all-cause and cardiopulmonary mortality83. Fine PM and sulphur
oxide-related pollution were associated with all-cause, lung cancer, and cardiopulmonary
mortality. Each 10 µg.m-3 elevation in fine PM air pollution was associated with
approximately a 4%, 6%, and 8% increased risk of all-cause, cardiopulmonary, and
lung cancer mortality, respectively84. A link between ultrafine particles or total number
concentrations and cardiovascular disease hospital admission was observed in
European multicentre studies. The link between ultrafine particles or total number
concentrations and natural cause mortality appeared to be more robust in time-series
analyses85.
Toxicological studies: For coarse particles, as their inhalability and, therefore, their
deposition efficiency in the respiratory tract is substantially lower, the interpretation of
the risk of coarse versus fine PM has to be considered in that context. Intratracheal
exposure in rats and mice as well as in vitro studies suggest that similar effects can be
observed for coarse and fine PM in the bioassays of lung cells, and that coarse PM can
be even more hazardous than fine PM. Again, given that the deposition efficiency and
pattern of coarse and fine PM differ greatly, the health outcomes in a population can
differ at equal mass exposure86.
82
C Arden Pope III et al., 2002 [60]
83
C Arden Pope III et al., 2002 [60]
84
Mills NL et al., 2011, [61]
85
C Arden Pope III et al., 2002 [60]
86
C Arden Pope III et al., 2002 [60]
28 Health impacts of air pollution - SCOR Paper #42 - July 2018Another study found inhalation of ultrafine carbon particles (38 nm, 180 μg.m-3 for
24 hours) caused increased heart rate and decreased heart-rate variability in rats, but
there was no inflammatory response and no change in the expression of genes having
thrombogenic relevance87. In spontaneously hypertensive rats exposed to similar
ultrafine carbon particles (172 μg.m-3 for 24 hours), blood pressure and heart rate
increased with a lag of 1-3 days. Inflammatory markers in lavage fluid, lung tissue, and
blood were unaffected, but mRNA expression of hemeoxygenase-1, endothelin-1,
endothelin receptors, tissue factor, and plasminogen activator inhibitor in the lung
showed a significant induction88.
There have been advances in the understanding of the action of ultrafine particles,
which have the ability to translocate from the alveolar space into tissues and to spread
systemically, reaching many organs, including the heart, liver, kidneys and brain.
Specific toxicological action includes impairment of phagocytosis and breakdown of
defence mechanisms, crossing tissues and cell membranes, injury to cells, generation
of reactive oxygen species, oxidative stress, inflammation, production of cytokines,
depletion of glutathione, mitochondrial exhaustion, and damage to protein and DNA,
most of which also occur with larger size PM89.
Clinical studies: Graff et al. (2009) arrived at the conclusion that, in humans (2
hours, 90 µg.m-3), exposure to coarse PM produces a mild, measurable physiological
response in healthy young volunteers that is similar in scope and magnitude to that
of volunteers exposed to fine PM, suggesting that both size fractions are comparable
in inducing cardiopulmonary changes in acute exposure settings90. The effects of
ultrafine carbon particles were observed in both heart-rate variability and cardiac
repolarisation, but there were no changes in soluble markers of either systemic
inflammation or coagulation. In a more recent study, no vascular impairment or effect
on blood clotting was observed in volunteers exposed for 2 hours to 70 μg.m-3 of
ultrafine carbon particles91. In another clinical study, the removal of very high particle
numbers by filters prevented the otherwise occurring arterial stiffness and increases of
blood clotting92. Similar observations were made in health subjects and patients with
coronary heart disease who were wearing a very simple, yet highly efficient face mask
while walking in highly polluted areas in Beijing, China93.
87
Swapna Upadhyay et al., 2008 [62]
88
Brauner EV et al., 2008 [63]
89
C Arden Pope III et al., 2002 [60]
90
C Arden Pope III et al., 2002 [60]
91
Volker Harder et al., 2005 [64]
92
Jeremy P Langrish et al., 2009 [65]
93
Joel D Kaufman et al., 2016 [66]
Health impacts of air pollution - SCOR Paper #42 - July 2018 29III. WHO Air quality guidelines
The 2005 "WHO Air quality guidelines" offer global guidance on thresholds and limits
for key air pollutants that pose health risks. Small PM pollution have health impacts
even at very low concentrations – indeed no threshold has been identified below
which no damage to health is observed. Therefore, the WHO 2005 guideline limits
aimed to achieve the lowest concentrations of PM possible94.
Guideline values:
> PM2.5, 10 µg.m-3 annual mean, 25 µg.m-3 24-hour mean;
> PM10, 20 µg.m-3 annual mean, 50 µg.m-3 24-hour mean.
Long-term exposure: An annual average concentration of 10 µg.m-3 was chosen as
the long-term guideline value for PM2.5. This represents the lower end of the range over
which significant effects on survival were observed in the American Cancer Society’s
(ACS) study. Besides the guideline value, three interim targets (IT) are defined for PM2.5
(see Table 2). These have been shown to be achievable with successive and sustained
abatement measures. Countries may find these interim targets particularly helpful in
gaug¬ing progress over time in the difficult process of steadily reducing population
exposure to PM.
Anoop S V Shah et al., 2015 [38]
94
30 Health impacts of air pollution - SCOR Paper #42 - July 2018You can also read