Creating Jobs - Cutting Pollution - the roadmaP for a Cleaner, stronger eConomy

Page created by Billy Ellis
 
CONTINUE READING
Creating Jobs - Cutting Pollution - the roadmaP for a Cleaner, stronger eConomy
Creating Jobs – Cutting Pollution
The roadmap for a cleaner, stronger economy

                               australian council of trade unions
Creating Jobs - Cutting Pollution - the roadmaP for a Cleaner, stronger eConomy
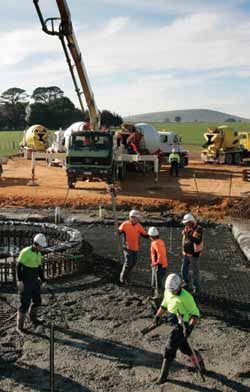
Photo above & back cover: Workers prepare the foundation for a wind turbine at Waubra windfarm. Photo courtesy of Acciona Energy.
  Photos: Front & back cover courtesy of the CFMEU National Office. This report has been produced with the support of Szencorp Pty Ltd

 FLOOR ONE, 60 LEICESTER STREET MELBOURNE VIC 3053
 email acf@acfonline.org.au
 web acfonline.org.au
 tel 03 9345 1111

australian council of trade unions

LEVEL 6/365 QUEEN STREET MELBOURNE VIC 3000
email help@actu.asn.au
web actu.org.au
tel 1300 362 223 (local call cost)
Creating Jobs - Cutting Pollution - the roadmaP for a Cleaner, stronger eConomy
Contents
                                   Foreword                             2
                                   Executive summary                    3
                                   Regional jobs results                9
                                   Introduction                         11
                                   The research                         14
                                   Results                              15
                                   Regional results - case studies      16
                                   Creating jobs by cutting pollution   22
                                   Appendices                           27

                                                                               Creating Jobs – Cutting Pollution: THE ROAD MAP FOR A CLEANER, STRONGER ECONOMY

Disclaimer: The macro –
economic scenarios, as well
as the combinations of clean
energy technologies and
policies utilised in the NIEIR
report represent just some of
the possible pathways to a
cleaner economy and world in
the 2010–30 period. As such,
their use in the NIEIR report
should not be construed as a
specific endorsement of all such
approaches by ACF or
the ACTU.

                                                                                         1
Creating Jobs - Cutting Pollution - the roadmaP for a Cleaner, stronger eConomy
Foreword

                                                                                  A
                                                                                          ction to reduce pollution can go hand-in-     saving jobs or saving the environment. On a global
                                                                                          hand with job creation and a prosperous       scale, action has also been stalled by those claiming
                                                                                          and environmentally healthy Australia.        Australia is in danger of doing “too much, too soon”.

                                                                                  As this report Creating Jobs – Cutting Pollution      The real debate, however, is about the cost to
                                                                                  demonstrates, Australia could create more             Australian jobs, our economy and planet if we do
                                                                                  than 770,000 extra jobs by 2030 by taking strong      “too little, too late”.
                                                                                  action now to reduce pollution.
                                                                                                                                        The choice is simple: invest and innovate now to
                                                                                  The jobs identified are not just “green collar”       secure our long-term future or pay the price in
                                                                                  jobs, but new jobs in traditional industries such     extra economic costs, job losses and an increasingly
                                                                                  as agriculture, mining, manufacturing and the         damaged environment if Australia doesn’t act.
                                                                                  services sector.
                                                                                                                                        Creating Jobs – Cutting Pollution, commissioned by
                                                                                  Using extensive economic modelling, the report        the Australian Council of Trade Unions (ACTU) and
                                                                                  shows that every region of Australia – even those     the Australian Conservation Foundation (ACF) from
                                                                                  dependent on coal, electricity generation, or heavy   the National Institute of Economic and Industry
                                                                                  industry – can benefit from more jobs – but only if   Research, follows the 2008 report, Green Gold Rush,
                                                                                  we act decisively now.                                which found that ambitious environmental and
                                                                                                                                        industry policy could create an additional 500,000
                                                                                  While action must include a price on pollution, a     jobs in six sectors by 2030.
                                                                                  range of other policy tools must also be utilised
Creating Jobs – Cutting Pollution: THE ROAD MAP FOR A CLEANER, STRONGER ECONOMY

                                                                                  for the best possible outcome.                        Creating Jobs – Cutting Pollution again demonstrates
                                                                                                                                        in more detail that strong action to clean up pollution
                                                                                  Failure to grasp the challenge will put a brake on    will create jobs across all regions, generating higher
                                                                                  Australia’s economic growth and limit the potential   and cleaner living standards as well as a healthier
                                                                                  for new job creation.                                 environment as we shift to a cleaner economy.

                                                                                  Too often, public discussion about improving our
                                                                                  environment lapses into a false choice between

                                                                                                                                        Don Henry         Sharan Burrow

              2
Creating Jobs - Cutting Pollution - the roadmaP for a Cleaner, stronger eConomy
Executive summary

    C      limate change is a major risk to Australia’s future prosperity.
           We’ve known pollution is bad for our health and environment
           for a long time. Now greenhouse pollution is threatening our
    wellbeing: the core of our quality of life. Rising global temperatures place
    our water supply at risk, change weather patterns, affect our health and
    harm our environment. And all this impacts on our economy.

    But risks to our economy are not solely related to health and physical
    impacts of pollution. We currently risk missing the next global wave
                                                                                                             This report
    of innovation in clean energy technologies and industries as the world                                   clearly shows
    moves to take advantage of new markets.
                                                                                                             that there will
    Already, China and California are staking their claim on the global
    solar industry, Asia is rapidly becoming a leader in affordable electric                                 be more jobs
    vehicle manufacture and Europe leads the globe in wind generation
    technologies, staking their claim in what is shaping up to be a US$2.3
                                                                                                             in all regions
    trillion clean energy industry by 2020.1                                                                 of Australia
    What will be Australia’s role in clean energy industries?                                                whilst the
    It is critical to decide now how best to avert the worst health,                                         nation takes
    environmental and economic impacts caused by pollution, and capture
    the economic opportunities available to those early moving countries.
                                                                                                             strong action
    In light of these challenges and opportunities, ACF and the ACTU
                                                                                                             to clean up
    commissioned economic modelling to assess how best to protect jobs                                       pollution.
    across all regions of Australia, along with the environment. This report
    clearly shows that there will be more jobs in all regions of Australia
    whilst the nation takes strong action to clean up pollution.

    The modelling
    The National Institute of Economic and Industry Research conducted
    integrated economic modelling based on two scenarios – Weak Action

                                                                                                                               Creating Jobs – Cutting Pollution: THE ROAD MAP FOR A CLEANER, STRONGER ECONOMY
    and Strong Action.2

    The Weak Action scenario is a “markets only” approach. It assumes a
    price on greenhouse pollution (using an emissions trading scheme) as
    the sole instrument to reduce Australia’s pollution levels. Under this
    scenario, Australia imports vast amounts of international permits to
    achieve reductions in greenhouse pollution, while domestic greenhouse
    pollution levels remain stable.

    The Strong Action scenario is a “markets plus” approach. It assumes
    a price on greenhouse pollution (using an emissions trading scheme)
    along with a targeted suite of complementary policies to reduce
    greenhouse pollution domestically, without reliance on imported
    international permits.

1   Berger, R., (2009) Clean Economy, Living Planet: Building strong clean energy technology industries,
    WWF-Netherlands, Amsterdam, November 2009
                                                                                                                                         3
2   The full NIEIR technical report is available via www.acfonline.org.au
Creating Jobs - Cutting Pollution - the roadmaP for a Cleaner, stronger eConomy
These policies are targeted geographically across Australia to capitalise on competitive advantage
                                                                                  and mitigate negative impacts on vulnerable regions. Policies include:

                                                                                  		   • Energy efficiency strategies for households, industry and commercial buildings. Across
                                                                                  		    Australia, there are opportunities to improve the energy efficiency of our homes, buildings
                                                                                  		     and factories, to save money on electricity bills while cutting pollution. These strategies
                                                                                  		     require a large and skilled labour force.

                                                                                  		   • Rapid expansion of clean energy infrastructure. A cleaner economy involves a massive
                                                                                  		     investment in renewable energy projects across Australia where our renewable resources
                                                                                  		     are in abundance. Whether wind, tides, waves, sun, biomass or geothermal, these projects
                                                                                  		     are likely to be placed in rural and regional Australia providing new employment and a
                                                                                  		     diversification of economic activity.

                                                                                  		   • Cleaner vehicle fleet and public transport infrastructure plan. Australia has started an
                                                                                  		     investment program to strengthen and clean up our automotive manufacturing industry.
                                                                                  		     This is the first component that can be complemented and ramped up with expanded,
                                                                                  		     environmentally appropriate biofuel production and a significant investment in public
                                                                                  		     transport infrastructure servicing our population centres.

                                                                                  		   • Targeted regional investment and industry planning. With the policies above, the Government
                                                                                  		     can target investments to those regions vulnerable to the impacts of a changing climate and
                                                                                  		     assist in the transition of pollution-intensive industries to a cleaner economy.

                                                                                  These two scenarios, Strong Action and Weak Action, explore different approaches for achieving
                                                                                  the Australian Government’s current conditional policy of a reduction in pollution of 25 per cent
                                                                                  by 2020, with results projected out to 2030.

                                                                                  The results
                                                                                  A stronger economy…
                                                                                  The results of the modelling are clear: a Strong Action response to reducing Australia’s pollution
                                                                                  – that includes both a pollution price and a suite of targeted policies – results in far superior
Creating Jobs – Cutting Pollution: THE ROAD MAP FOR A CLEANER, STRONGER ECONOMY

                                                                                  outcomes for jobs across all Australian regions, and a stronger economy including economic
                                                                                  welfare, gross domestic product, and national debt.

                                                                                  Importantly, these conclusions hold true across any pollution reduction target range. Whether
                                                                                  Australia adopts a five per cent greenhouse pollution reduction target, a 25 per cent or a 40 per
                                                                                  cent target, jobs and the economy will be better off where government implements both a price
                                                                                  on pollution and a suite of policy measures, rather than relying solely on a price on pollution.

                                                                                  Weak Action (as opposed to Strong Action) will allow our near neighbours to out-compete us on
                                                                                  global markets and result in jobs leaching abroad to countries with smarter, more modernised
                                                                                  clean energy economies.

                                                                                  with more jobs…
                                                                                  Strong Action results in 770,000 more jobs than Weak Action by 2030.

         4
Consistent with other studies that have modelled deep cuts in
    pollution across the Australian economy3, this study finds 3.7 million
    jobs will be created across the Australian economy by 2030 under
    Strong Action (compared with 3.0 million under Weak Action). The
    growth is in part a continuation of business as usual, but is then
    supplemented by the effects of policies underlying Strong Action.

    Modelling results show that under both Weak Action and Strong Action
    scenarios, employment across the economy is approximately 1.5 per
    cent higher than would otherwise occur.

                        Total
                         TotalEmployment
                               EmploymentGrowth
                                         Growth2009—2030
                                                2009 - 2030
     Million Jobs

                                                                                                                 Photo courtesy of Pacific Hydro.

    across all regions…
    Strong Action versus Weak Action:
    Importantly, jobs results are better across all regions of Australia under
    Strong Action compared to Weak Action.3 This applies from the earliest
    years of reductions in pollution right through to 2030. In total, additional
    jobs under Strong Action compared to Weak Action number 771,164.

                                                                                                                                                    Creating Jobs – Cutting Pollution: THE ROAD MAP FOR A CLEANER, STRONGER ECONOMY
    For full regional results of Strong Action vs Weak Action employment
    outcomes, refer table on page 9.

    2009 versus 2030:
    When comparing employment growth from 2009 to 2030, all regions
    except one show a growth in jobs numbers under Strong Action to reduce
    pollution.

3   CSIRO report between 2.65 and 3.3 million additional jobs would be created by 2025 under deep emissions
    reductions of 60 to 100 per cent by 2050. As reported in the same CSIRO report, Treasury’s 2007
    Intergenerational Report projects around 2.5 million jobs would be created over the 20 years to 2025.
    Hatfield-Dodds, S., G. Turner, H. Schandl and T. Doss (2008), Growing the green collar economy: Skills
    and labour challenges in reducing our greenhouse emissions and national environmental footprint. Report to
                                                                                                                                                              5
    the Dusseldorp Skills Forum, June 2008. CSIRO Sustainable Ecosystems, Canberra
All regions   In one region of Australia, the NSW Far West, jobs decline by 13 per cent
                                                                                                     or 5,400 jobs. However, this coincides with a continuing structural decline
                                                                                      of Australia   in the region for the wool and mining industries. Importantly, it helps to
                                                                                                     highlight where government action should be directed to mitigate the
                                                                                  have better jobs   decline, in particular through the support of renewable energy or biofuel
                                                                                  outcomes under     production if appropriate.4

                                                                                     Strong Action   Consistent with the findings of this report, the jobs outcomes are still
                                                                                                     better under Strong Action than Weak Action in the NSW far west region
                                                                                     compared to     (Weak Action results in 18 per cent or 7,237 fewer jobs) indicating that a
                                                                                                     comprehensive response to reducing pollution will still deliver better
                                                                                      Weak Action.   results for jobs in the region.

                                                                                                     Results in all other regions show more new jobs being created under
                                                                                                     Strong Action than Weak Action.

                                                                                                     In total jobs grow by 28 per cent under Weak Action and 36 per cent under
                                                                                                     Strong Action between 2009 to 2030.

                                                                                                     The table below gives full results of 2009 to 2030 employment outcomes
                                                                                                     and highlights jobs outcomes across a selection of Australian regions.
                                                                                                     Full definition of regions is provided in the appendix to the report.

                                                                                                           Region                   Total jobs                 Total jobs                 Total jobs
                                                                                                                                     % change                     actual                 additional jobs
                                                                                                                                from 2009 to 2030             increase from               created from
                                                                                                                                  (Strong Action)              2009 to 2030              Strong Action
                                                                                                                                                             (Strong Action)              compared to
                                                                                                                                                                                          Weak Action
                                                                                                     ACT                                 39%                      74,589                     9,496
                                                                                                     NSW Illawarra and
                                                                                                     Hunter                              28%                     111,582                    31,449

                                                                                                     NSW Far West                       -13%                      -5,410                     1,828
                                                                                                     NSW Sydney Outer
                                                                                                                                         68%                     102,447                    17,680
Creating Jobs – Cutting Pollution: THE ROAD MAP FOR A CLEANER, STRONGER ECONOMY

                                                                                                     South West
                                                                                                     NT Darwin                           73%                      55,185                     3,120
                                                                                                     QLD South East
                                                                                                     West Moreton                       125%                     126,107                    12,436

                                                                                                     QLD Resource
                                                                                                     Region (includes
                                                                                                                                         14%                       6,614                     4,228
                                                                                                     western QLD and
                                                                                                     Cape York)
                                                                                                     SA Adelaide                         21%                     131,360                    40,757
                                                                                                     TAS Hobart &
                                                                                                                                         22%                      25,665                     7,353
                                                                                                     South
                                                                                                     VIC Gippsland
                                                                                                     (including La Trobe                 29%                      29,680                    10,193
                                                                                                     Valley)
                                                                                                     VIC Melbourne
                                                                                                                                         48%                     301,019                    26,282
                                                                                                     Central
                                                                                                     WA Pilbara
                                                                                                                                         37%                      21,968                     5,404
                                                                                                     Kimberley

              6
                                                                                                 4   Modelling for this report did not assume any such investment in the NSW Far West.
and all sectors...
Jobs grow across all sectors of the economy under Strong Action to reduce pollution. This evidence
supports the conclusion of previous work that the “green jobs story is not about shutting down
dirty industries, but re-skilling to enable them to become clean industries”.

   Increase in employment by sector: Jobs created by 2030 under Strong Action compared to Weak Action

                          Industry                                 Additional jobs with Strong Action
Primary industry (agriculture, mining, forestry and
fisheries)                                                                      +102,422

Manufacturing                                                                   +140,684
Construction                                                                    +115,532
Services                                                                        +412,525
Total                                                                           +771,163

Australians will be better off…
The living standards of Australians (as measured by household and government consumption
rates) will be higher under the comprehensive policies of Strong Action. In fact, compared to
Weak Action, Australians will be nearly 10 per cent better off in economic welfare terms in the
period to 2030.

The economy will be stronger…
In terms of Gross Domestic Product (GDP), the economy as a whole will be better off when Strong
Action is taken. Both scenarios demonstrate solid growth in GDP across the 2010 to 2030 period,
but the economy is stronger under the Strong Action scenario with an average 3.2 per cent GDP in
the 2010–2030 period compared with 2.8 per cent under Weak Action.

           Average annual GDP growth across time period (per cent)             Total annual GDP growth for
                                                                                  2010–2030 (per cent)

                                                                                                             Creating Jobs – Cutting Pollution: THE ROAD MAP FOR A CLEANER, STRONGER ECONOMY
                                 Weak           Strong
                                                                                       Weak     Strong
                      3.50%
        3.20%
          3.2%            3.5%          3.30%
                                         3.3%               3.0%       3.20%                  3.2%
                                                           3.00%
   3.2%
  3.20%            2.9%
                  2.90%              2.6%           2.6%                               2.8%
                                                                   2.80%
                                     2.60%            2.60%

    2010 – 15
    2010–15         2015-20
                    2015–20           2020-25
                                      2020–25            2025-30
                                                         2025–30   2010-30      2010                 2030

                                                                                                                       7
Australia will have less debt…
                                                                                      Under Weak Action, Australia’s balance of payments deteriorates over time due to the high reliance on
                                                                                      importing international carbon permits and the continued high level of oil imports, which comes with
                                                                                      the failure to invest in a cleaner vehicle fleet and public transport infrastructure.

                                                                                      Strong Action results in significant additional benefits to Australians through:

                                                                                      		    • lower imports of international permits (cumulative savings of $240 billion by 2030);
                                                                                      		    • lower imports of oil (cumulative savings of $181 billion by 2030); and
                                                                                      		    • improved energy efficiency (cumulative savings of $53 billion to households alone by 2030).

                                                                                      Importing permits costs almost $50 billion each year by 2030 under Weak Action – a direct leakage from
                                                                                      Australia’s economy that misses an opportunity for investment in domestic pollution abatement.

                                                                                      Strong Action creates a cumulative increase in consumption opportunities of $650 billion above
                                                                                      Weak Action.

                                                                                      A price on pollution is essential…
                                                                                      An additional scenario was undertaken to model a reduction in greenhouse pollution by 25 per cent
                                                                                      without a price on pollution. The results show that Australia would see a reduction in benefits of
                                                                                      $126 billion by 2030 compared to a scenario with a price on pollution.

                                                                                      Without a price on pollution, increases in taxation or interest rates would have to replace the
                                                                                      revenue-raising role of the pollution price. The incentive effects of pollution pricing, in stimulating
                                                                                      modernisation and design, would also be lost.

                                                                                      A price on pollution is therefore critical to maximise benefits to Australians. International evidence
                                                                                      shows the early introduction of mandatory pollution pricing is indispensable in supporting action to
                                                                                      reduce pollution.5

                                                                                      Conclusions
Creating Jobs – Cutting Pollution: THE ROAD MAP FOR A CLEANER, STRONGER ECONOMY

                                                                                      Our economy and our standard of living will suffer if we do not reduce the pollution from our
                                                                                      economy with a range of policy measures across industry including a price on pollution.

                                                                                      For any national greenhouse pollution reduction target, whether five per cent, 25 per cent, or
                                                                                      40 per cent, a suite of targeted policy measures is necessary for the best economic and
                                                                                      environmental outcomes.

                                                                                      A targeted investment program to reduce Australia’s pollution and build our competitiveness in
                                                                                      a global clean energy economy delivers more jobs, lower debt, savings for households from lower
                                                                                      energy costs, a higher standard of living and a healthier and more resilient environment.

                                                                                      Australia has a history of losing competitiveness and key industries to other countries. History could
                                                                                      easily be repeated by choosing the “too little, too late” option. Business as usual will inevitably leave
                                                                                      us stuck in the past.

                                                                                      We must take decisive action now to capture the current opportunities to create jobs and clean energy
                                                                                      industries to ensure a prosperous economy, healthy planet and resilient Australia.

                                                                                  5    Countries with a price on carbon or developing a price on carbon include: 27 European Union member states, New Zealand, Japan, South Korea and the
              8
                                                                                       United States, alongside separate efforts by 24 US States and 4 Canadian provinces. Additional carbon taxes are in place across Scandinavia and Ireland.
Regional Jobs Results

Regional Employment Results 2009 to 2030
                                           Employment Results by Region

                                                      Weak Action               Strong Action       Additional
                                 Industry
                                                                                                    jobs with
                               employment                      Change       Change       Change
                                              Change 2009                                            Strong
                                   2009                         2009 to   2009 to 2030    2009 to
                                              to 2030 (no.)                                           Action
                                                               2030 (%)      (no.)       2030 (%)
Australian Capital Territory     189,278         65,093             34      74,589          39        9,496
Sydney Central                   819,600         202,988            25      232,533         28       29,545
Sydney Eastern Beaches           88,327          19,758             22      23,723          27        3,965
Sydney Northern Beaches          103,283         18,581             18      23,750          23        5,169
Sydney Old West                  104,892         25,558             24      31,734          30        6,176
Sydney Outer North               152,866         25,516             17      36,800          24       11,284
Sydney Outer South West          150,851         84,767             56      102,447         68       17,680
Sydney Outer West                216,175         81,405             38      100,999         47       19,594
Sydney Parramatta-
                                 347,377         97,352             28      116,853         34       19,501
Bankstown
Sydney South                     135,561         22,012             16      29,952          22        7,940
NSW Central Coast                109,955         28,345             26      33,060          30        4,715
NSW Central West                 121,415          -2,656            -2       8,247          7        10,903
NSW Far West                     40,950           -7,237            -18      -5,410         -13       1,827
NSW Hunter                       282,545         42,013             15      64,320          23       22,307
NSW Illawarra                    157,122         38,120             24      47,262          30        9,142
NSW Mid North Coast              114,293         16,797             15      23,160          20        6,363
NSW North                        82,226          -11,600            -14      1,372          2        12,972
NSW Richmond Tweed               97,592          15,180             16      20,441          21        5,261
NSW Riverina                     105,591          -2,925            -3       7,374          7        10,299
NSW Southern Tablelands          91,215          10,306             11      19,030          21        8,724
NT Darwin                        75,205          52,065             69      55,185          73        3,120
NT Lingiari                      43,961           -1,500            -3       3,433          8         4,933
SEQ Brisbane City                741,226         253,611            34      289,852         39       36,241
SEQ Brisbane South               150,730         68,102             45      82,092          54       13,990

                                                                                                                 Creating Jobs – Cutting Pollution: THE ROAD MAP FOR A CLEANER, STRONGER ECONOMY
QLD Cairns                       109,155         21,120             19      29,760          27        8,640
QLD Darling Downs                105,103         29,959             29      39,272          37        9,313
QLD Fitzroy                      102,729         39,978             39      50,052          49       10,074
QLD Mackay                       90,229          31,298             35      40,974          45        9,676
QLD North                        117,020         23,993             21      40,892          35       16,899
QLD Resource region              48,267           2,386             5        6,614          14        4,228
QLD Wide Bay Burnett             106,308         30,118             28      42,242          40       12,124
SEQ Gold Coast                   248,086         94,652             38      109,543         44       14,891
SEQ Moreton Bay                  112,180         39,431             35      48,570          43        9,139
SEQ Sunshine Coast               140,701         56,581             40      64,384          46        7,803
SEQ West Moreton                 100,587         113,670            113     126,107        125       12,437
Adelaide Inner                   307,041         42,674             14      53,468          17       10,794
Adelaide North                   212,965         36,138             17      57,818          27       21,680
Adelaide South                   99,264          11,791             12      20,074          20        8,283
SA Mallee South East             47,017           3,166             7       11,399          24        8,233
SA Mid North Riverland           57,541           1,604             3        7,482          13        5,878
SA Spencer Gulf                  51,499           -305              -1       4,282          8         4,587
TAS Hobart-South                 118,099         18,313             16      25,665          22        7,352
TAS North                        62,409          10,320             17      17,194          28        6,874
TAS North West                   48,012           8,872             18      15,238          32        6,366                9
Employment Results by Region continued...
                                                                                                                                              Weak Action                        Strong Action            Additional
                                                                                                                        Industry
                                                                                                                                                          Change          Change            Change        jobs with
                                                                                                                      employment      Change 2009
                                                                                                                                                           2009 to      2009 to 2030         2009 to       Strong
                                                                                                                          2009        to 2030 (no.)
                                                                                                                                                          2030 (%)         (no.)            2030 (%)        Action

                                                                                  Melbourne Central                     632,659          274,737            43              301,019              48         26,282
                                                                                  Melbourne East                        253,366          69,404             27                87,500             35         18,096
                                                                                  Melbourne North                       211,781          93,384             44              120,236              57         26,852
                                                                                  Melbourne North East                  181,403          61,589             34                75,662             42         14,073
                                                                                  Melbourne Outer South East            172,404          50,730             29                66,590             39         15,860
                                                                                  Melbourne South East                  311,515          87,326             28              115,180              37         27,854
                                                                                  Melbourne West                        214,755          139,419            65              166,291              77         26,872
                                                                                  VIC Ballarat                          67,373           24,777             37                32,016             48         7,239
                                                                                  VIC Bendigo                           96,025           36,250             38                45,011             47         8,761
                                                                                  VIC Geelong                           99,947           31,040             31                34,378             34         3,338
                                                                                  VIC Gippsland                         103,927          19,487             19                29,680             29         10,193
                                                                                  VIC Mallee Wimmera                    62,509            -3,561             -6               5,795              9          9,356
                                                                                  VIC North East                        101,790          17,812             17                24,819             24         7,007
                                                                                  VIC West                              71,905           16,024             22                26,541             37         10,517
                                                                                  Perth Central                         487,045          131,837            27              151,809              31         19,972
                                                                                  Perth Outer North                     182,548          53,106             29                67,595             37         14,489
                                                                                  Perth Outer South                     174,116          40,073             23                56,061             32         15,988
                                                                                  WA Gascoyne Goldfields                64,600            7,985             12                13,856             21         5,871
                                                                                  WA Peel South West                    111,886          42,244             38                51,781             46         9,537
                                                                                  WA Pilbara Kimberley                  58,947           16,564             28                21,968             37         5,404
                                                                                  WA Wheatbelt Great Southern           60,349           12,877             21                24,061             40         11,184
                                                                                  TOTAL                               10,527,297        2,980,518           28%             3,751,682         36%          771,164

                                                                                                                                      Job increases by State
                                                                                                         Industry                 Weak Action                            Strong Action                   Additional
                                                                                                       employment                                                                                         Jobs in
                                                                                                                       Change 2009 to      Change 2009      Change 2009 to            Change 2009 to
                                                                                                           2009                                                                                           Strong
                                                                                                                         2030 (no.)         to 2030 (%)       2030 (no.)                 2030 (%)
                                                                                                                                                                                                          Action

                                                                                  ACT                     189,278          65,093               34%                74,589                  39%             9,496
                                                                                  NSW                    3,321,836        704,280               21%               917,647                  28%            213,367
                                                                                  Northern
                                                                                                          119,166          50,565               42%                58,618                  49%             8,053
                                                                                  Territories
                                                                                  Queensland             2,172,321        804,899               37%               970,354                  45%            165,455
                                                                                  South Australia         775,327          95,068               12%               154,523                  20%             59,455
                                                                                  Tasmania                228,520          37,505               16%                58,097                  25%             20,592
Creating Jobs – Cutting Pollution: THE ROAD MAP FOR A CLEANER, STRONGER ECONOMY

                                                                                  Victoria               2,581,359        918,418               36%               1,130,718                44%            212,300
                                                                                  Western
                                                                                                         1,139,491        304,686               27%               387,131                  34%             82,445
                                                                                  Australia
                                                                                  Total                  10,527,297      2,980,518              28%               3,751,682                36%            771,164

                                                                                                                                   Job increases by Capital City
                                                                                                         Industry                 Weak Action                           Strong Action                    Additional
                                                                                                       employment                                                                                      Jobs in Strong
                                                                                                                       Change 2009 to      Change 2009      Change 2009 to            Change 2009 to
                                                                                                           2009                                                                                           Action
                                                                                                                         2030 (no.)         to 2030 (%)       2030 (no.)                 2030 (%)

                                                                                  Adelaide                619,270          90,603               15%               131,360                  21%             40,757
                                                                                  Brisbane                891,956         321,713               36%               371,944                  42%             50,231
                                                                                  Canberra
                                                                                                          189,278          65,093               34%                74,589                  39%             9,496
                                                                                  (All ACT)
                                                                                  Darwin                  75,205           52,065               69%                55,185                  73%             3,120
                                                                                  Hobart (and
                                                                                                          118,099          18,313               16%                25,665                  22%             7,352
                                                                                  South TAS)
                                                                                  Melbourne              1,977,883        776,589               39%               932,478                  47%            155,889
                                                                                  Perth                   843,709         225,016               27%               275,465                  33%             50,449
                                                                                  Sydney                 2,118,932        577,937               27%               698,791                  33%            120,854
                                                                                  Capital City
                                                                                                         6,834,332       2,127,329              33%               2,565,477                39%            438,148
10                                                                                Totals
Introduction

    C
            limate change is a major risk to Australia’s future prosperity.
            We’ve known pollution is bad for our health and environment
            for a long time. Now greenhouse pollution is threatening our
    wellbeing: the core of our quality of life. Rising global temperatures
    place our water supply at risk, change weather patterns, affect our
    health and harm our environment. And all this impacts on our
    economy.

    It is clear that action must be taken to reduce the rising levels of
    pollution. We need to shift from a pollution-dependent economy to a
    cleaner economy, and create new jobs for Australians in the process.

    More than 120 countries, including the world’s largest polluters, China
    and the US, support the need to reduce pollution via the Copenhagen
    Accord that aims to prevent global temperatures from increasing by
    more than two degrees Celsius.

    This ACF/ACTU report takes the next step and looks at the best way
    to restructure our economy to meet that challenge while maintaining a
    prosperous economy and healthy planet.

    The report considers the impact of action to reduce Australia’s
    greenhouse pollution by 25 per cent by 2020, focusing on jobs across all
    regions of Australia, household welfare and GDP impacts.                                                    Photo courtesy of the CFMEU National Office.

    The economic modelling underpinning this research, undertaken by
    National Institute of Economic and Industry Research (NIEIR)6, looked
    at how to best undertake the necessary restructuring of the economy to
    deliver a cleaner economy.

    The world is taking action
    The Federal Government has committed to adopting a minimum five
    per cent reduction in greenhouse pollution and move to a 25 per cent

                                                                                                                                                          Creating Jobs – Cutting Pollution: THE ROAD MAP FOR A CLEANER, STRONGER ECONOMY
    target below the year 2000 levels as part of an ambitious international
    agreement capable of stabilising greenhouse pollution gases at 450ppm
    carbon dioxide equivalent (CO2-e) or lower. The Federal Opposition
    has said it will also adopt a 25 per cent target in the context of an
    international agreement. The Greens’ policy is for a target of at least
    40 per cent.

    A 25 per cent reduction in greenhouse pollution is the minimum amount
    that would allow the Government to stand by its recent commitment
    to ensure that global temperatures do not rise more than two degrees
    Celsius, the threshold for avoiding the worst impacts of a changing
    climate.7

6   The full NIEIR report is available via www.nieir.com.au
7   The Stern Review reported the probability of exceeding a 2 degree temperature rise was in the range of 26
    to 78 per cent if CO2-e is stablised at 450ppm.(Stern Review (2006), The Economics of Climate Change, HM
                                                                                                                                                                    11
    Treasury, London.)
Clean energy       Growing evidence that the world is moving towards dangerous changes
                                                                                                      in climate has motivated many countries to take action.
                                                                                   will be one of
                                                                                    the world’s       		   • Governments from around the world have supported the
                                                                                                             Copenhagen Accord to keep temperatures from rising more than
                                                                                           largest

                                                                                                             two degrees Celsius – more than 120 countries now support
                                                                                                             the Accord;
                                                                                      industries,     		   • Fifty-five countries, accounting for over 78 per cent of global
                                                                                                      		     greenhouse pollution emissions, have submitted targets to the
                                                                                         totalling    		     United Nations to limit their pollution ;8
                                                                                     as much as

                                                                                                           • Targets to cut greenhouse pollution by 2020 have been made by
                                                                                                             Japan (25 per cent), the EU (20-30 percent), the UK (34 per cent),
                                                                                  US$2.3 trillion.    		     and Norway (40 per cent); the United States has pledged a 17 per
                                                                                                      		     cent reduction from 2005 levels by 2020 and 30 per cent by 2025;
                                                                                                      		   • Major developing countries, including Mexico, China, India,
                                                                                                      		     Indonesia and Brazil, have demonstrated that they are on target to
                                                                                                      		     significantly reduce their greenhouse pollution below business as
                                                                                                      		     usual by the 2020s.9

                                                                                                      Many countries see reducing pollution as an opportunity, not just a
                                                                                                      necessary cost.

                                                                                                      Globally, governments committed US$432 billion for green stimulus
                                                                                                      investments in 2009 (including more than US$128 billion in the US).10

                                                                                                      North Asian economies, China in particular, are spending hundreds of
                                                                                                      billions of dollars annually to gain a competitive advantage in a wide
                                                                                                      range of energy efficient and lower pollution intensity technologies such
                                                                                                      as renewable energy, public transport and electric vehicles.

                                                                                                      Worldwide investment in clean energy totalled US$162 billion in 2009,
                                                                                                      but only US$1 billion of this investment was in Australia. China ranked
                                                                                                      number one for clean energy investment out of the G20 countries with
                                                                                                      $34.6 billion. Australia was ranked 14th, behind Turkey, Mexico, Canada
Creating Jobs – Cutting Pollution: THE ROAD MAP FOR A CLEANER, STRONGER ECONOMY

                                                                                                      and others.11

                                                                                                      The opportunity is further evidenced by projections that, in 2020, clean
                                                                                                      energy will be one of the world’s largest industries, totalling as much as
                                                                                                      US$2.3 trillion.12

                                                                                                      Already, some nations are staking their place in the clean energy
                                                                                                      economy. Critically, strong government commitments have delivered
                                                                                                      certainty underpinning private sector advances in these industries. A
                                                                                                      2009 study provided evidence that developed countries that ratified the
                                                                                                      Kyoto Protocol – and subsequently set a legally binding target to reduce

                                                                                                 8     UNFCCC Press release 1 February 2010, Accessed: http://unfccc.int/files/press/news_room/press_releases_
                                                                                                       and_advisories/application/pdf/pr_accord_100201.pdf
                                                                                                 9     EcoFys, Climate Analytics and Potsdam Institute for Climate Impact Research (2009), Climate Action
                                                                                                       Tracker, 6 November 2009.
                                                                                                 10    HSBC (2009), The Green Rebound: clean energy to become an important component of global recovery
                                                                                                       plans,19 January 2009.
                                                                                                 11    Pew Charitable Trusts (March 2010) Who’s Winning the Clean Energy Race? http://www.pewglobalwarming.
                                                                                                       org/cleanenergyeconomy/g20.html 
                                                                                                 12    Berger, R. (2009), Clean Economy, Living Planet: Building strong clean energy technology industries,WWF-
12
                                                                                                       Netherlands, Amsterdam, November 2009
their greenhouse pollution – saw a rise of 33 per cent in green technology patents. The US and
     Australia, however, being the developed nations that didn’t initially ratify Kyoto, conversely had no
     change in their share of total green technology patents over the same time period, indicating that we
     in Australia are already falling behind the rest of the world.13

     Even ahead of a formal international treaty beyond the Kyoto Protocol, a coalition of countries is
     emerging that is taking aggressive action to reduce pollution.

     Against this background, it is clear Australia needs to decide the most effective way to reduce its
     pollution in order to remain competitive in a global clean energy economy.

     Actions to reduce pollution
     Policies to reduce pollution in developed countries are generally underpinned by a price on pollution.
     Most are combined with additional complementary measures to support an effective and equitable
     transition to a cleaner economy and to provide incentives to build the clean energy industries
     required.

     This research compared a price on pollution only (Weak Action scenario) against a price on pollution
     combined with a suite of additional and targeted complementary measures (Strong Action). These
     scenarios are set out in the following section, and in more detail in the NIEIR technical report.

     Pricing pollution
     The world has woken up to the fact that pollution has a cost. To date that cost has been passed on as a
     liability to future generations. Policies to set a price on pollution are crucial to providing a substantial
     incentive to change the way we produce and use goods and services.

     Emissions trading schemes are the most commonly accepted way to do this and already operate in
     32 countries. ACF and ACTU believe a good pollution pricing scheme should invest a significant
     proportion of revenues from the sale of permits into clean energy development and cleaner industry
     innovation hubs. Wise re-investment of pollution permit revenue will help Australia make the shift
     to the clean energy future, securing national prosperity for coming generations. During early years,
     schemes need to provide appropriate compensation for lower income households and pollution

                                                                                                                                                            Creating Jobs – Cutting Pollution: THE ROAD MAP FOR A CLEANER, STRONGER ECONOMY
     intensive trade-exposed industries as the economy is restructured.

     Additional measures to reduce pollution
     The following seven key policy drivers were modelled alongside an emissions trading scheme to
     test the impacts on jobs and economic indicators under the Strong Action scenario.14 Many of these or
     similar policies are already being implemented in countries as diverse as China, the US, EU member
     countries, South Korea and many others:

     		   • Household energy efficiency strategy – roll out a new, comprehensive national residential
     		     retrofitting program that reduces pollution and household bills, and results in thousands of safe
     		     new jobs with the appropriate training and enforced standards;
     		   • Commercial building and industrial energy efficiency strategy – use existing and expanded
     		     programs to achieve significant savings from energy efficiency in buildings, large and small
     		     industry, and community organisations with additional transitional financial incentives;

13    Dechezleprêtre, A. et al.(2009), Invention and Transfer of Climate Change Mitigation Technologies on a Global Scale: A Study Drawing on Patent Dat,
      CERNA and Mines ParisTech, Paris, February 2009, cited by Gordon, K.,Wong, J.L. and McLain, J.T. (2010) Out of the Running? How Germany, Spain,
      and China Are Seizing the Energy Opportunity and Why the United States Risks Getting Left Behind, Center for American Progress, Washington, March
      2010. Accessed: http://www.americanprogress.org/issues/2010/03/pdf/out_of_running.pdf
                                                                                                                                                                      13
14    More detail is provided in the full NIEIR technical report available via www.acfonline.org.au
• Rapid expansion of low pollution-intensive energy infrastructure – with incentives such
                                                                                       		      as an expanded renewable energy target, an effective emissions trading scheme, investment
                                                                                       		      in a smart grid and funding for research, development and deployment of clean energy;
                                                                                       		    • Targeted regional investment and industry planning – including investment in clean
                                                                                       		      industry and innovation hubs particularly focused on regional areas together with
                                                                                       		      substantial up-skilling of the workforce;
                                                                                       		    • Investment in a cleaner vehicle fleet – including expansion of hybrid and electric cars
                                                                                       		      and shifting more freight to cleaner energy transport and environmentally appropriate
                                                                                       		      biofuel production;
                                                                                       		    • Federally led clean energy transport infrastructure plan – Federal Government investment
                                                                                       		      into clean energy powered public and active transport infrastructure;
                                                                                       		    • A national land sector initiative – to reduce pollution arising from land use and build
                                                                                               climate change resilience in Australian ecosystems through improved land
                                                                                       		      management practices.

                                                                                       The research
                                                                                       The economic modelling undertaken for this research examined the costs and benefits for Australia
                                                                                       of two comparative scenarios over the 2010–2030 period.

                                                                                       Comprehensive dynamic input-output economic modelling was undertaken by the National
                                                                                       Institute of Economic and Industry Research (NIEIR) in Melbourne. The modelling provides a
                                                                                       macro-economic assessment based on evidence of how businesses and households respond to
                                                                                       policies from bottom-up modelling.

                                                                                       The research modelled two comparative scenarios:

                                                                                       		    • Weak action – Australia signs up to a 25 per cent reduction by 2020 and adopts a price on
                                                                                       		      pollution, but takes little further action. The approach relies heavily on market forces, with a
                                                                                       		      large import of international permits resulting in order to reach the target. Domestic
                                                                                       		      greenhouse pollution levels remain above 1990 levels.
                                                                                       		    • Strong action – Australia takes strong and early action to reduce greenhouse pollution by
                                                                                       		      25 per cent by 2020. A price on pollution is introduced, along with a suite of additional
                                                                                       		      measures including industrial development, energy efficiency strategies, clean transport
Creating Jobs – Cutting Pollution: THE ROAD MAP FOR A CLEANER, STRONGER ECONOMY

                                                                                       		      programs, green up-skilling and land sector initiatives. Import of international permits is
                                                                                       		      not required. The additional measures are purposefully directed to offset negative
                                                                                       		      macro-economic aspects of the Weak Action scenario.

                                                                                       Pollution reduction in the scenarios
                                                                                                                                                                       Domestic pollution levels in the Weak Action
                                                                                              Weak Action            Strong Action                                     scenario stabilise at around today’s level by
                                                                                            4% 4%         7.7%          7.7%           7.7%          6.6%              2030. The target of 25 per cent by 2020 is met
                                                                                                                                                                       by importing pollution permits.
                                                                                                          7.70%         7.70%          7.70%         6.0%

                                                                                            2006                                                                       In the Strong Action scenario, Australia
                                                                                                              -8%
                                                                                                                                                                       reduces domestic greenhouse pollution by 25
                                                                                                           2015                                                        per cent below 1990 levels by 2020 and 50 per
                                                                                                                            25%
                                                                                                                                                                       cent by 203015, as shown to the left.
                                                                                                                          2020
                                                                                                                                           -39%
                                                                                                                                         2025            -50%
                                                                                                                                                       2030

14
                                                                                  15    The reduction levels assume the inclusion of emissions from land use, land use change and forestry.
The model presented regional projections from the Weak Action and
Strong Action scenarios to compare the impact of alternative approaches
to pollution reduction on the Australian economy. National figures from
the models were allocated to the regions based on current patterns of
expenditure, pollution intensity and investment in reducing pollution
along with existing and projected capacity for renewable energy and
industry demand. Regional development initiatives were modelled for
regions adversely affected by pollution pricing, including effects from
domestic markets and foreign drivers such as loss of export markets.

The results of this modelling are presented in the following section.

Results
Australia creates more economic wealth and more jobs by taking
Strong Action to reduce pollution than by Weak Action.

The modelling shows that a stronger economy, higher employment
and higher living standards result from a comprehensive package of
policy measures to reduce domestic pollution combined with a price on
pollution. Importantly, reduction of domestic pollution, rather than a
reliance on international permits, is critical to strong economic outcomes
for Australia.

Importantly, these conclusions hold true across any target range –
whether Australia adopts a five per cent greenhouse pollution reduction
target or a 25 per cent or a 40 per cent target. Jobs and the economy will
be better off where government implements both a price on pollution
and a suite of policy measures, rather than relying solely on a price on
pollution.

The modelling also shows that policies to reduce pollution without
a price on pollution result in lower effectiveness, efficiency and

                                                                             Creating Jobs – Cutting Pollution: THE ROAD MAP FOR A CLEANER, STRONGER ECONOMY
employment.

Simply put, the cost to Australia of not putting a price on pollution now,
at the start of the second decade of the 21st century, is very substantial
and decidedly negative.

More jobs
The study finds there will be 3.7 million new jobs created by 2030 under
Strong Action compared to 3.0 million under Weak Action. The growth is
in part a continuation of business as usual, but is then supplemented by
the effects of policies underlying Strong Action.

This is 770,000 more jobs by 2030 through Strong Action to reduce
domestic pollution with a pollution price and suite of additional
measures than through Weak Action.

The creation of more jobs applies from the earliest years of pollution
reduction right through to 2030.

Specifically, the Weak Action scenario delivers 2,980,518 jobs above and
beyond today’s levels by 2030. Strong Action results in 3,751,682 jobs
                                                                                       15
above current levels by 2030.
All regions of Australia have more jobs with Strong Action

                                                                                       Strong Action versus Weak Action:
                                                                                       All regions have higher employment under Strong Action than Weak Action. Regional impacts
                                                                                       on employment will be positive if the government sets proactive policies that act in harmony
                                                                                       to generate economic activity from reductions in greenhouse pollution and develops targeted
                                                                                       industry development policies that are carefully designed to assist those regions most susceptible
                                                                                       to pollution pricing.

                                                                                       For full regional results of Strong Action vs Weak Action employment outcomes, refer to table on
                                                                                       page 9.

                                                                                       Jobs in 2009 versus jobs in 2030:
                                                                                       When comparing employment growth from 2009 to 2030, all regions except one see a growth in
                                                                                       jobs numbers under Strong Action to reduce pollution.

                                                                                       In one region of Australia, the NSW Far West, there will be 13 per cent or 5,400 fewer jobs.
                                                                                       However, this coincides with a continuing structural decline in the region for the wool and mining
                                                                                       industries. Importantly, it helps to highlight where government action should be directed to
                                                                                       mitigate the decline, in particular through the support of renewable energy or biofuel production if
                                                                                       appropriate.16

                                                                                       Consistent with the findings of this report, the jobs outcomes are better under Strong Action than
                                                                                       Weak Action in this region (Weak Action results in 18 per cent or 7,237 fewer jobs) indicating that a
                                                                                       comprehensive response to cutting pollution still delivers the better results for jobs in the region.

                                                                                       Results in all other regions show more jobs being created under Strong Action.

                                                                                       In total jobs grow by 28 per cent under Weak Action and 36 per cent under Strong Action between
                                                                                       2009 to 2030. For full regional results of 2009 to 2030 employment outcomes, refer to table on page 9.

                                                                                       Case studies
                                                                                         Case Study 1: Illawarra and the Hunter Valley – NSW
Creating Jobs – Cutting Pollution: THE ROAD MAP FOR A CLEANER, STRONGER ECONOMY

                                                                                                                                                                                   Jobs growth in Illawarra
                                                                                         (Maitland, Newcastle and Wollongong) Jobs growth in this region occurs in all
                                                                                                                                                                                     & the Hunter Valley
                                                                                         sectors, with mining jobs continuing to grow and a significant increase in the services
                                                                                         sector. There were 439,667 jobs in the area in 2009. There will be 18 per cent more in
                                                                                                                                                                                         2009 - 2030
                                                                                         2030 under the Weak Action scenario and 25 per cent more under Strong Action.             Weak           Strong
                                                                                                                                                                                                      111,582
                                                                                         There will be 30,000 more jobs under the Strong action than the Weak action.
                                                                                         These jobs primarily grow from policies including:
                                                                                              • household and industry energy efficiency improvement
                                                                                              • transport infrastructure investment and benefits                                                      801,33
                                                                                              • industry policies to maximise local content of expenditure on reduction of
                                                                                                pollution in order to stimulate production of transport equipment and
                                                                                                construction materials
                                                                                              • employment created from higher living standards

                                                                                           Additional jobs created from Strong Action compared to Weak Action in 2030
                                                                                          Agriculture, mining, forestry                                                1,577
                                                                                          and fisheries
                                                                                          Manufacturing                                                                6,257
                                                                                          Construction                                                                 6,795
                                                                                          Services                                                                    16,821
                                                                                          Total                                                                       31,450       2009           2030

16
                                                                                  16   Modelling for this report did not assume any such investment in the NSW Far West.
Case Study 2: Fitzroy – Queensland                                                                         Jobs growth in
(Gladstone and Rockhampton) Jobs growth in this region occurs across all sectors, including key         Fitzroy Queensland
sectors for the region. There were 102,729 jobs in the area in 2009. This is set to increase by 39           2009 - 2030
per cent under Weak Action and 49 per cent under Strong Action.
                                                                                                     Weak           Strong
The additional 10,000 jobs under the Strong Action scenario are predominantly due to benefits
from policies including:
     • cleaner electricity production (gas)                                                                             50,052
     • biodiesel production and enhanced agriculture supply
     • enhanced industrial capacity in chemicals to support expansion
       of Australian manufacturing industry                                                                             39,978

         Additional jobs created from Strong Action compared to Weak Action in 2030
 Agriculture, mining, forestry                                                        1,836
 and fisheries
 Manufacturing                                                                        1,651
 Construction                                                                         2,207
 Services                                                                             4,379
 Total                                                                                10,073         2009            2030

Case Study 3: Bendigo – Victoria
Includes Greater Bendigo. Jobs continue to grow in the key sectors of the region. With jobs          Jobs growth in Bendigo VIC
totalling 96,025 in 2009, Weak Action shows a 38 per cent improvement and Strong Action                     2009 - 2030
a 49 per cent improvement by 2030.
                                                                                                      Weak          Strong
The additional 9,000 jobs under a Strong Action scenario are predominantly due to benefits
from policies including:
     • clean energy infrastructure investment
                                                                                                                         45,011
     • biomass agriculture on marginal farming land
     • land management to minimise emissions
     • commercial services activities supporting expansion of agriculture and
                                                                                                                         36,250
       renewable energy in wider Victorian region

         Additional jobs created from Strong Action compared to Weak Action in 2030
 Agriculture, mining, forestry                                                        1,513
 and fisheries
 Manufacturing                                                                        1,383
 Construction                                                                         1,561
 Services                                                                             4,304
 Total                                                                                8,761           2009           2030

                                                                                                                                  Creating Jobs – Cutting Pollution: THE ROAD MAP FOR A CLEANER, STRONGER ECONOMY

Case Study 4: Western Sydney – NSW Outer West                                                          Jobs growth in Western
There are 20,000 more jobs under Strong Action scenario for Western Sydney, with an                   Sydney NSW 2009 - 2030
additional 12,000 jobs in the services sector. Manufacturing continues to play a key role
in this region, with an additional 5,000 jobs. There were 216,175 jobs in this region in 2009.        Weak          Strong
The modelling shows 38 per cent more jobs under the Weak Action scenario and
47 per cent under Strong Action in 2030.                                                                                100,999

The main drivers of employment growth are:
     • employment created from higher expenditures stemming from higher living standards
                                                                                                                         81,405
     • general energy efficiency programs (industrial, commercial and residential)
     • strengthening of manufacturing
     • research and development activities

         Additional jobs created from Strong Action compared to Weak Action in 2030
 Agriculture, mining, forestry                                                     640
 and fisheries
 Manufacturing                                                                    5,256
 Construction                                                                     1,525
 Services                                                                        12,174
 Total                                                                           19,594               2009           2030

                                                                                                                                            17
All sectors of the economy have more jobs
                                                                                       Additional jobs are not confined to one or two sectors. Indeed, all sectors of the Australian
                                                                                       economy continue to grow if comprehensive action is taken to reduce pollution. This evidence
                                                                                       supports the conclusion of previous work that “the green jobs story is not about shutting down dirty
                                                                                       industries, but re-skilling to enable them to become clean industries.”17

                                                                                       The table on page 7 shows increases in employment by sector under Strong Action, on top of
                                                                                       Weak Action in 2030.

                                                                                       These sectoral job increases are to be found in all regions of Australia. State and capital city totals
                                                                                       are included in the tables below and full regional results are shown in the Appendix.

                                                                                                                                                 Job increases by State
                                                                                                                                                                                                    Additional Jobs
                                                                                                              Agri/Mining         Manufacturing          Construction          Service
                                                                                                                                                                                          Total       in Strong
                                                                                                              employment           employment            employment           industry
                                                                                                                                                                                                        Action
                                                                                       ACT                         449                  847                      869           7,331      9,496          9,496
                                                                                       NSW                       26,551                33,199               28,791            124,828    213,367        213,367
                                                                                       NT                         2,912                 737                  1,840             2,563      8,053          8,053
                                                                                       QLD                       28,083                23,982               20,940            92,448     165,455        165,455
                                                                                       SA                        10,425                13,443               10,229            25,359     59,455          59,455
                                                                                       TAS                        3,742                2,260                 6,816             7,775     20,592          20,592
                                                                                       VIC                       18,308                53,533               27,015            113,442    212,300        212,300
                                                                                       WA                         11,951               12,683               19,031            38,779     82,445          82,445
                                                                                       Australia                 102,422              140,684               115,532           412,525    771,164        771,164

                                                                                                                                              Job increases by Capital City

                                                                                                              Agri/Mining         Manufacturing          Construction          Service               Additional Jobs
                                                                                                                                                                                          Total
                                                                                                              employment           employment            employment           industry             in Strong scenario

                                                                                       Adelaide                   1,593                11,640                4,343            23,182     40,757          40,757
                                                                                       Brisbane                   1,429                8,376                 5,245            35,181     50,231          50,231
                                                                                       Canberra
Creating Jobs – Cutting Pollution: THE ROAD MAP FOR A CLEANER, STRONGER ECONOMY

                                                                                                                   449                  847                      869           7,331      9,496          9,496
                                                                                       (All ACT)
                                                                                       Darwin                      157                  333                      310           2,320      3,120          3,120
                                                                                       Hobart (and
                                                                                                                   839                  640                  2,045             3,829      7,352          7,352
                                                                                       South Tas)
                                                                                       Melbourne:                 3,808                44,578               12,739            94,763     155,889        155,889
                                                                                       Perth:                     1,681                9,784                 7,871            31,113     50,449          50,449
                                                                                       Sydney:                    3,110                21,171               10,745            85,827     120,854        120,854
                                                                                       Capital City
                                                                                                                 13,066                97,369               44,167            283,546    438,148        438,148
                                                                                       Totals

18
                                                                                  17   Dusseldorp Skills Forum and Australian Conservation Foundation, Op. cit
Industry policies to promote ‘cleantech’ industries in Australia                By 2030,
Australia must take advantage of the high-wage, high-skill jobs that
can be won by designing appropriate industry development policies to            Australian
complement the necessary first step of putting a price on pollution now.        households are
This report shows public and private incentives must build on existing          more than $153
efforts to tap the full potential of a cleaner economy future.
                                                                                million better
Current initiatives include:
                                                                                off every year.
		   • The $5.1 billion Clean Energy Initiative, that includes a significant
		     contribution to renewable energy and carbon capture and storage
		     research, under two ‘flagship’ initiatives. Additional funding has
		     been directed to establish Renewables Australia to support leading
		     edge technology research and bring it to market.

		   • The Commercialisation Australia program provides $196 million
		     over four years (and more than $80 million a year thereafter) for
		     researchers, entrepreneurs and start up firms with new
		     technologies.

		   • A $1.4 billion per annum tax credit scheme where firms with a
		     turnover of less than $20 million (over 99 per cent of cleantech
		     firms in Australia are in this category) will be eligible for a 45 per
		     cent refundable tax credit to undertake their research and
		     development and build their businesses.

These resources are an important start but will need to be supplemented
in the years ahead.

Just as the government developed a 10 year $6.2 billion dollar plan
for the automotive manufacturing industry (which included the green
car initiative), cleantech industry development strategies are now also
required. Agencies like Austrade, Enterprise Connect and the Industry

                                                                                                  Creating Jobs – Cutting Pollution: THE ROAD MAP FOR A CLEANER, STRONGER ECONOMY
Capability Network need to work together to help develop the supply
chains for cleantech industries, attract investment from offshore into
new manufacturing and services businesses here in Australia and help
our new cleantech firms win international business opportunities in
global markets.

Higher standards of living for Australians
Australians’ living standards will be higher under the comprehensive
policies of Strong Action. This was measured by household and
government consumption rates as an indicator of welfare.

Under Strong Action, Australians are nearly 10 per cent better off in the
2010 to 2030 period. By 2030, Australian households are more than $153
million better off every year.

                                                                                                            19
Stronger economy
                                                                                            Both scenarios demonstrate solid growth in GDP, but the economy is
                                                                                            more robust under Strong Action with its comprehensive suite of policies
                                                                                            to reduce pollution. This difference kicks in quickly and is most apparent
                                                                                            in the 2020s. From 2010 to 2030, the average GDP under the Strong Action
                                                                                            scenario is 3.2 per cent versus 2.8 per cent under the Weak Action scenario.

                                                                                            Improved savings and lower debt for Australia
                                                                                            The economy remains healthier under Strong Action due to improved
                                                                                            balance of payments, largely as a result of increased investment to reduce
                                                                                            pollution in the domestic economy rather than relying on importing
                                                                                            pollution permits (as is the case under the Weak Action scenario).

                                                                                            In total, foreign debt is more than $180 billion lower by 2030 under Strong
                                                                                            Action than it is under Weak Action.
                                            Photo courtesy of the CFMEU National Office.
                                                                                            By 2030, the reliance on imported permits under the Weak Action scenario
                                                                                            costs almost $50 billion each year – a direct leakage from Australia’s
                                                                                            economy with little domestic benefit in terms of preparing Australia
                                                                                            for a clean energy future. Strong Action creates a cumulative increase in
                                                                                            consumption opportunities.

                                                                                            Predicted growth under Strong Action is not far short of the 1990s average
                                                                                            of 3.5 per cent.18 The accelerated benefits of pollution reduction under
                                                                                            Strong Action come from:

                                                                                            		   • lower imports of permits (cumulative savings of $240 billion
                                                                                            		     by 2030);
                                                                                            		   • lower imports of oil (cumulative savings of $181 billion by 2030);
                                                                                            		     and
                                                                                            		   • improved energy efficiency (cumulative savings of $53 billion to
                                                                                            		     households alone by 2030).
Creating Jobs – Cutting Pollution: THE ROAD MAP FOR A CLEANER, STRONGER ECONOMY

                                                                                            It is also worth remembering the economic impact of climate change.
                                                                                            In his 2006 review, former World Bank chief economist Sir Nicholas Stern
                                                                                            estimated that the “costs and risks” of uncontrolled climate change are
                                                                                            equivalent to a loss in global GDP of at least 5 per cent and up to 20 per
                                                                                            cent or more, “now and forever.”19

                                                                                            These findings apply to any national target
                                                                                            The conclusions for the Strong Action versus Weak Action scenarios hold
                                                                                            true across any national greenhouse pollution reduction target range.
                                                                                            Whether Australia chooses a five per cent, a 25 per cent or 40 per cent cut
                                                                                            in greenhouse pollution, employment growth and welfare outcomes will
                                                                                            be stronger where the government implements a suite of complementary
                                                                                            policy measures plus a price on pollution, rather than relying solely on a
                                                                                            price on pollution.

                                                                                       18    Based on figures from ABS catalogue number 5206.0.
20
                                                                                       19    Stern Review (2006), The Economics of Climate Change, HM Treasury, London, Executive Summary
We must put a price on pollution
     The research provides further evidence of the inefficiency of reducing pollution without a price on
     pollution. An additional scenario was run which compared action to achieve a 25 per cent domestic
     reduction with and without a price on pollution. This showed the failure to set a price on pollution
     would cost $96 billion in lost consumption by 2020, extending to $126 billion by 2030. Failure to
     introduce a price on pollution increases the cost of adjustment. The full outcomes are given in the
     table below.

     Acting without a price on pollution requires more real resource expenditure to achieve the same
     greenhouse pollution reduction target. General taxation increases or interest rate increases would
     need to replace the revenue-raising role of the price on pollution. The incentive effects of placing a
     price on pollution, in stimulating modernisation and design, would be lost.

     Accumulated loss in consumption expenditures with no price on pollution (in $2007 billions)
        2015                                      -55
        2020                                      -96
        2025                                     -117
        2030                                     -126

     Comparisons with other studies
     This research shows that higher GDP growth is possible than that modelled by Treasury20 and
     Professor Garnaut. This is most apparent when comprehensive targeted policies are undertaken to
     reduce pollution and support industries alongside the introduction of a price on pollution.

     NIEIR and treasury scenarios
                                         2020                            2010-20                             2030                           2020-30
       Scenario          CO2-e* price           Domestic              GDP growth            CO2-e* price           Domestic              GDP growth
                          per tonne           emissions (Mt)              rate               per tonne           emissions (Mt)         rate(per cent)
                           ($2007)                                     (per cent)             ($2007)
     Treasury
     CPRS -5                   38                    600                    2.7                    60                   580                    2.3

                                                                                                                                                           Creating Jobs – Cutting Pollution: THE ROAD MAP FOR A CLEANER, STRONGER ECONOMY
     Treasury
     CPRS -15                  55                    530                    2.7                    75                   500                    2.2

     Garnaut -10
                               38                    600                    2.7                    55                   580                    2.3

     Garnaut -25
                               65                    500                    2.6                    90                   490                    2.2

     NIEIR
     Weak                      55                    585                    3.0                   158                   579                    2.7
     Action
     NIEIR
     Strong                    87                    410                    3.3                   159                   273                    3.1
     Action

     * C02-e stands for carbon dioxide equivalent, the standard measure of major greenhouse pollution gases including carbon dioxide, methane and others
     Source:Treasury 2008 (approximate – some numbers can only be read from graphs) and NIEIR calculations.

                                                                                                                                                                     21
20   Treasury (2008) Australia’s Low Pollution Future: The Economics of Climate Change Mitigation, Commonwealth of Australia, Canberra.
The pollution pricing in this study is based on assumptions from other international studies
                                                                                       considering comparable scenarios. The scenarios assume import parity carbon dioxide equivalent
                                                                                       (CO2-e) pricing by 2030.

                                                                                       The relative difference results in more investment in capacity and capital improvements to reduce
                                                                                       pollution rather than increased international debt through importing permits.

                                                                                       The UK Department of Energy and Climate Change, for example, states a desired median CO2-e
                                                                                       price for 2030 of US$130, and a high of US$192 in 2009 prices for investment evaluation purposes.21
                                                                                       Under a 50 per cent CO2-e reduction target, the International Energy Agency indicates a minimum
                                                                                       pollution price of US$200 and as much as US$500 by 2050.22

                                                                                       The pollution price profile adopted here is therefore well within the range of current scenario
                                                                                       assumptions for aggressive CO2-e reduction, as AU$159 a tonne CO2-e domestic price reached in
                                                                                       the models by 2030 is equivalent to $US136 a tonne.

                                                                                       Creating jobs by cutting pollution
                                                                                       The results from the modelling make it clear that pollution pricing is essential, but not enough.

                                                                                       Allowing businesses to trade-off between domestic pollution reductions and the importation of
                                                                                       permits has major ramifications for the Australian economy. Cutting pollution within Australia
                                                                                       results in substantial investment in domestic industry and positive employment outcomes across
                                                                                       all regions of Australia. It produces better economic results for Australia by spending on pollution
                                                                                       reductions at home, rather than investment occurring offshore.

                                                                                       The key to achieving better outcomes across all regions is a careful reallocation of resources
                                                                                       towards complementary industrial and pollution reduction programs. The benefits of this
                                                                                       reallocation, as shown in the previous section, are substantial.

                                                                                       Benefits of Strong Action
                                                                                       By acting in a coordinated manner under Strong Action, Australia reaps the benefit of smart and
                                                                                       strategic investment of revenues from its emissions trading scheme, as well as the dividend from
Creating Jobs – Cutting Pollution: THE ROAD MAP FOR A CLEANER, STRONGER ECONOMY

                                                                                       the current “once in a generation” mining boom.

                                                                                       The modelling shows that Australia generates excellent returns on investment through Strong
                                                                                       Action. Every $100 invested in import replacement effort (money that would have gone overseas in
                                                                                       the form of international permit imports under Weak Action) returns $180. Importantly, this is an
                                                                                       investment in a competitive, clean energy economy for Australia, rather than buying international
                                                                                       permits – an investment in the pollution reductions of another country.

                                                                                       These positive results can be achieved across sectors and across Australia. Even in coal-dependent
                                                                                       regions like the Hunter and La Trobe Valleys, jobs in all sectors grow under Strong Action.

                                                                                       While this research is based on economic models, the policies modelled are being adopted right
                                                                                       now across the globe. The level of resource investment in the Strong Action scenario mirror the
                                                                                       strategies currently being implemented in North Asian economies, many of the EU member states
                                                                                       and many US states.

                                                                                       The Strong Action scenario delivers lower imports of oil and improved energy efficiency which
                                                                                       lowers costs for households and businesses.

                                                                                  21   UK Department of Energy and Climate Change (2009), Carbon Appraisal in UK Policy Appraisal: A Revised Approach - A brief guide to the new
                                                                                       carbon values and their use in economic appraisal
                                                                                  22   IEA (2008), Energy Technology Perspectives: Scenario and Strategies to 2050. Other IEA studies quote estimates of around US$180 a tonne of CO2
22
                                                                                       by 2030.
You can also read