Forecasting Tropical Cyclones: Overview and Issues for Congress - Updated August 11, 2020 - Congress.gov
←
→
Page content transcription
If your browser does not render page correctly, please read the page content below
Forecasting Tropical Cyclones:
Overview and Issues for Congress

Updated August 11, 2020

                             Congressional Research Service
                              https://crsreports.congress.gov
                                                     R46416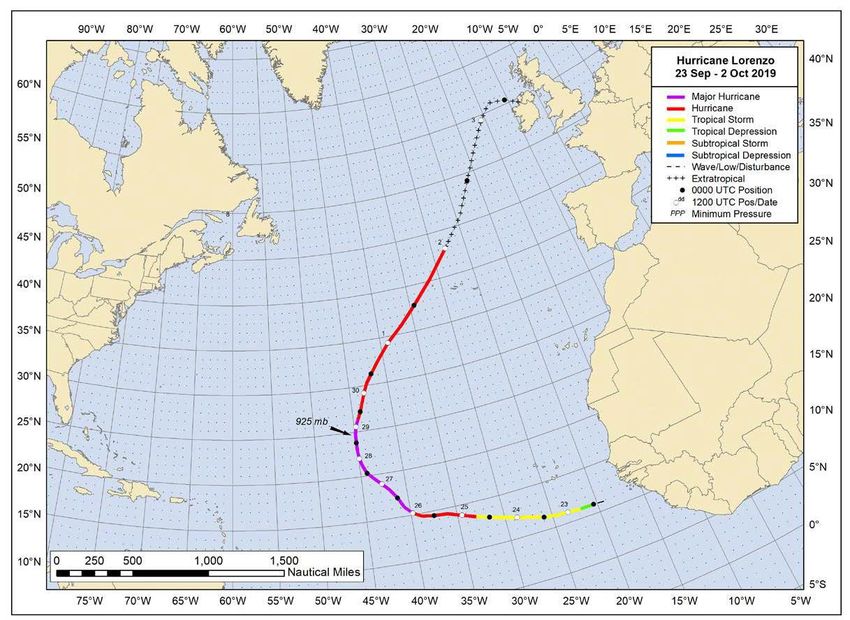
SUMMARY
R46416
Forecasting Tropical Cyclones:
August 11, 2020
Overview and Issues for Congress
Eva Lipiec
Timely tropical cyclone forecasts can provide early and accurate warnings to parts of the Analyst in Natural
U.S. coastline vulnerable to tropical cyclone impacts. Recent hurricane seasons have Resources Policy
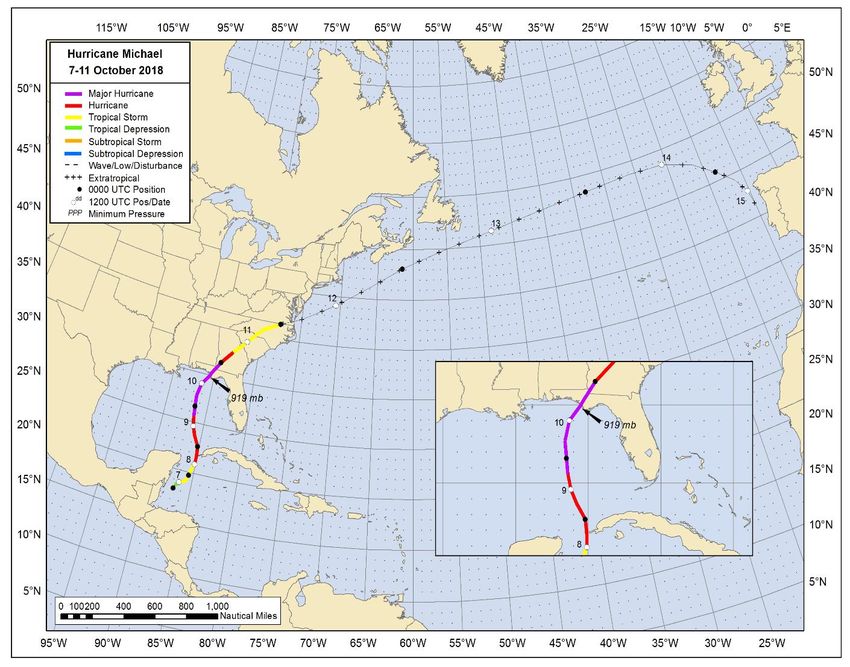
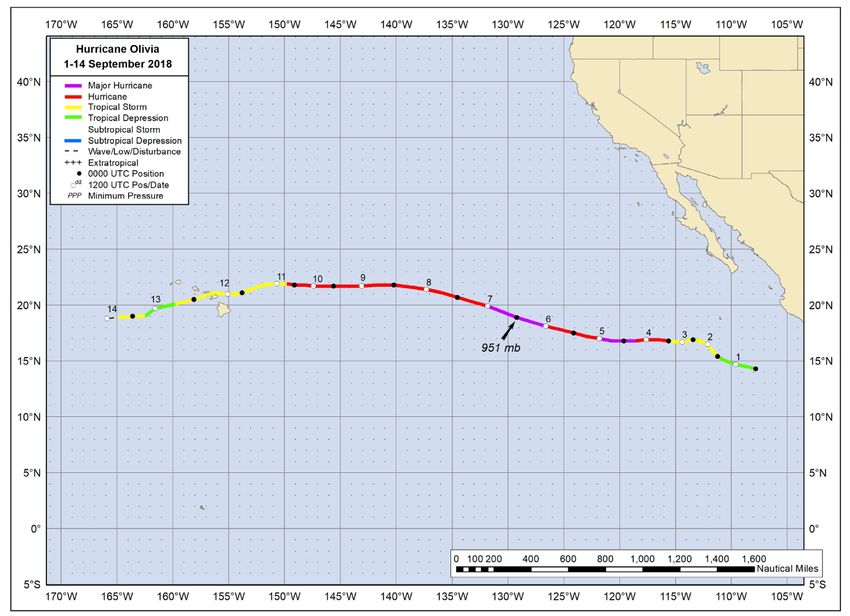
included several major hurricanes—such as Dorian in 2019 and Florence, Lane,
Michael, and Olivia in 2018—which resulted in multiple deaths and billions of dollars
of damage in the southeastern United States and Hawaii, among other places. The
National Oceanic and Atmospheric Administration (NOAA) is the federal agency responsible for tropical cyclone
forecasts, including track, intensity, storm surge, and rainfall forecasts. NOAA defines tropical cyclones as
tropical depressions, tropical storms, hurricanes, and major hurricanes, and the agency makes tropical cyclone
forecasts using data from multiple observational tools—satellites, reconnaissance aircraft, ships, radar, and buoys,
among others.
Each year, NOAA releases outlooks for three ocean regions—Atlantic, eastern Pacific, and central Pacific.
Although the outlooks typically cover all types of tropical cyclones, the agency uses the term “hurricane” in the
outlook title. The north Atlantic and eastern Pacific outlooks include the predicted number of named storms (with
winds 39 miles per hour or greater), hurricanes, and major hurricanes. The central Pacific outlook forecasts the
total number of tropical cyclones expected.
In May 2020, NOAA released its 2020 hurricane season outlooks for the Atlantic, eastern Pacific, and central
Pacific regions. NOAA predicted an above-normal season in the Atlantic, with 13 to 19 named storms, 6 to 10
hurricanes, and 3 to 6 major hurricanes. (Some nonfederal entities predicted a near-normal to above-normal
Atlantic hurricane season.) In August 2020, NOAA updated its Atlantic outlook, calling for 19 to 25 named
storms, 7 to 11 hurricanes, and 3 to 6 major hurricanes. In its May outlook, the agency anticipated that the eastern
and central Pacific regions would most likely experience a near-normal season. The forecasts included 11 to 18
named storms, 5 to 10 hurricanes, and 1 to 5 major hurricanes in the eastern Pacific and between 2 and 6 tropical
cyclones in the central Pacific. The agency does not release an updated outlook for the eastern and central Pacific
regions.
In 2017, Congress enacted the Weather Research and Forecasting Act (P.L. 115-25), which included provisions
regarding hurricane forecasting and warnings. Members of Congress continue to be interested in the potential
impacts of climate change on tropical cyclones and the challenges in accurately forecasting certain aspects—such
as intensity, storm surge, and precipitation—of tropical cyclones. Some Members also may consider potential
impacts on tropical cyclone forecasting due to shifts in the NOAA’s and private sector’s roles in the weather
enterprise. Some stakeholders advocate for retaining the current distribution of responsibilities; other stakeholders
believe changes in responsibility are already occurring and should, in some cases, continue or expand. Members
also may continue to consider the potential for interference from fifth-generation telecommunications (5G)
technology on NOAA and other federal satellite sensors. For instance, some stakeholders have argued that
interference could impact the quality of data used for hurricane forecasting, among other activities. Others have
rejected interference claims altogether, among other views.
Congressional Research Service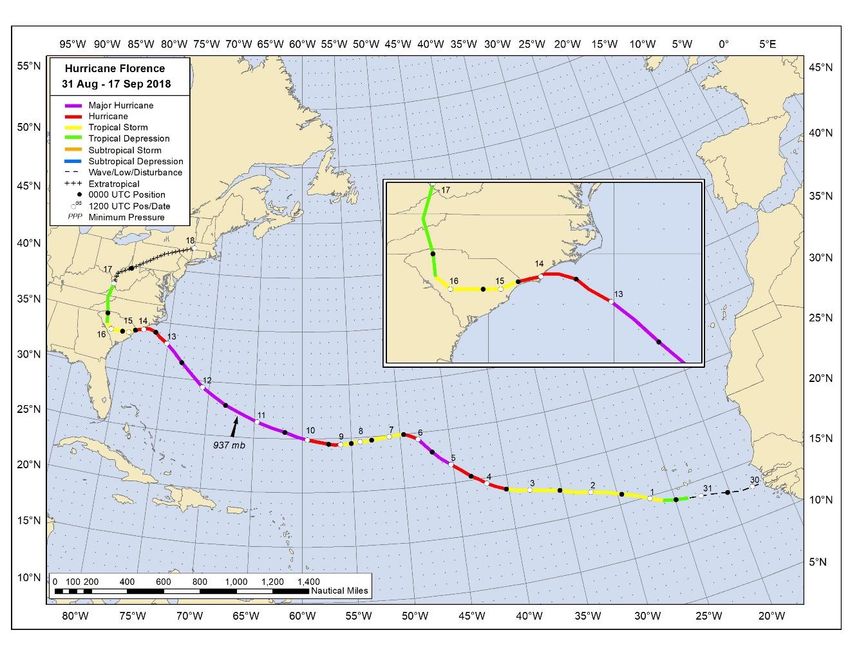
Forecasting Tropical Cyclones: Overview and Issues for Congress
Contents
Forecasting Tropical Cyclones .......................................................................................... 1
Collecting Data ......................................................................................................... 2
Analyzing the Data .................................................................................................... 3
Forecasts and Warnings .............................................................................................. 4
NOAA’s Seasonal Hurricane Outlooks ............................................................................... 6
2020 Hurricane Season Outlooks ................................................................................. 7
Issues for Congress ......................................................................................................... 9
Impacts of Climate Change on Tropical Cyclones ........................................................... 9
Forecasting Certain Aspects of Tropical Cyclones......................................................... 10
NOAA Interactions with the Private Sector Weather Enterprise....................................... 14
Potential 5G Technology Interference with Satellite Sensors........................................... 17
NOAA’s Use of the 23.8 Gigahertz Frequency........................................................ 17
Federal Frequency Management ........................................................................... 18
NOAA and Other Stakeholder Concerns—Selected Timeline .................................... 18
Figures
Figure 1. 96 Hour Track Error vs. Consistency .................................................................... 4
Figure 2. Storm Surge and Storm Tide................................................................................ 6
Figure 3. NHC Official Average Track Errors Comparison .................................................. 11
Figure 4. NHC Official Average Intensity Errors Comparison .............................................. 12
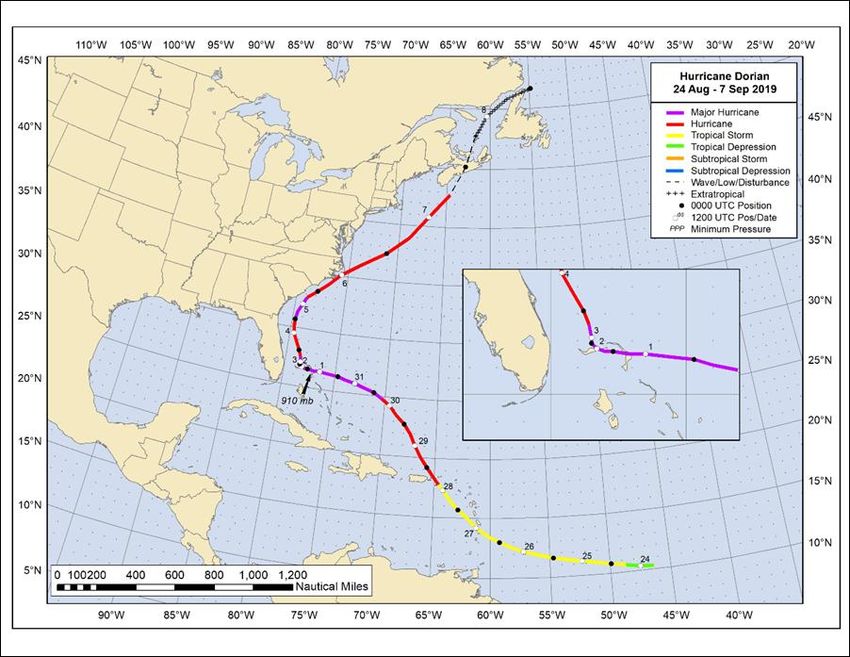
Figure A-1. Hurricane Dorian’s Track .............................................................................. 26
Figure A-2. Hurricane Humberto’s Track.......................................................................... 28
Figure A-3. Hurricane Lorenzo’s Track ............................................................................ 30
Figure B-1. Hurricane Florence’s Track............................................................................ 34
Figure B-2. Hurricane Michael’s Track............................................................................. 37
Figure B-3. Hurricane Lane’s Track ................................................................................. 41
Figure B-4. Hurricane Olivia’s Track ............................................................................... 43
Tables
Table 1. Seasonal Means and Ranges for Atlantic Named Storms ........................................... 7
Table 2. Seasonal Means for Eastern Pacific Named Storms .................................................. 7
Table 3. 2020 Atlantic Hurricane Season Seasonal Outlooks .................................................. 8
Table 4. 2020 Eastern Pacific Hurricane Season Seasonal Outlook.......................................... 9
Table A-1. 2019 Atlantic Hurricane Season: Comparison Between Seasonal Outlook and
Actual Storms ............................................................................................................ 23
Congressional Research Service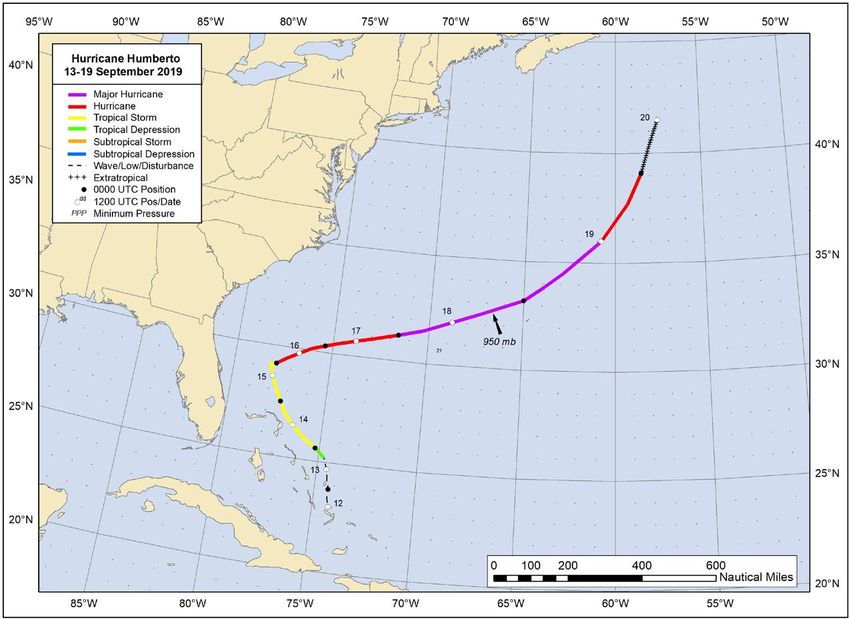
Forecasting Tropical Cyclones: Overview and Issues for Congress

Table A-2. NHC Official Track Forecast Errors for Hurricane Dorian Compared with the
  2014-2018 Average..................................................................................................... 26
Table A-3. NHC Official Intensity Forecast Errors for Hurricane Dorian Compared with
  the 2014-2018 Average................................................................................................ 27
Table A-4. NHC Official Track Forecast Errors for Hurricane Humberto Compared with
  the 2014-2018 Average................................................................................................ 29
Table A-5. NHC Official Intensity Forecast Errors for Hurricane Humberto Compared
  with the 2014-2018 Average......................................................................................... 29
Table A-6. NHC Official Track Forecast Errors for Hurricane Lorenzo Compared with the
  2014-2018 Average..................................................................................................... 31
Table A-7. NHC Official Intensity Forecast Errors for Hurricane Lorenzo Compared with
  the 2014-2018 Average................................................................................................ 31
Table A-8. 2019 Eastern Pacific Hurricane Season: Comparison Between Seasonal
  Outlook and Actual Storms .......................................................................................... 32
Table B-1. 2018 Atlantic Hurricane Season: Comparison Between Seasonal Outlook and
  Actual Storms ............................................................................................................ 33
Table B-2. NHC Official Track Forecast Errors for Hurricane Florence Compared with
  the 2013-2017 Average................................................................................................ 35
Table B-3. NHC Official Intensity Forecast Errors for Hurricane Florence Compared with
  the 2013-2017 Average................................................................................................ 35
Table B-4. NHC Official Track Forecast Errors for Hurricane Michael Compared with the
  2013-2017 Average..................................................................................................... 38
Table B-5. NHC Official Intensity Forecast Errors for Hurricane Michael Compared with
  the 2013-2017 Average................................................................................................ 38
Table B-6. 2018 Eastern Pacific Hurricane Season: Comparison Between Seasonal
  Outlook and Actual Storms .......................................................................................... 39
Table B-7. NHC Official Track Forecast Errors for Hurricane Lane Compared with the
  2013-2017 Average..................................................................................................... 41
Table B-8. NHC Official Intensity Forecast Errors for Hurricane Lane Compared with the
  2013-2017 Average..................................................................................................... 42
Table B-9. NHC Official Track Forecast Errors for Hurricane Olivia Compared with the
  2013-2017 Average..................................................................................................... 44
Table B-10. NHC Official Intensity Forecast Errors for Hurricane Olivia Compared with
  the 2013-2017 Average................................................................................................ 44
Table B-11. 2018 Central Pacific Tropical Cyclone Season:
  Comparison Between Seasonal Outlook and Actual Storms .............................................. 45

Appendixes
Appendix A. 2019 Hurricane Season Outlooks and Overviews ............................................. 23
Appendix B. 2018 Hurricane Season Outlooks and Overviews ............................................. 33

Contacts
Author Information ....................................................................................................... 45

Congressional Research Service
Forecasting Tropical Cyclones: Overview and Issues for Congress

Congressional Research Service
Forecasting Tropical Cyclones: Overview and Issues for Congress
he potential for widespread destruction to parts of the U.S. coastline underscores the value
T of timely hurricane—or more broadly, tropical cyclone—forecasts as a means for
providing early and accurate warnings to affected communities. The National Oceanic and
Atmospheric Administration (NOAA) is the federal agency responsible for tropical cyclone
forecasting, including track, intensity, storm surge, and rainfall forecasts. The agency reports on
how accurate the forecasts are compared with the actual events, calculates damages, and more.
A variety of terms can be used to describe these types of storms (see text box below). This report
uses the terms storm and tropical cyclone and provides a description of how NOAA’s National
Hurricane Center (NHC) forecasts tropical cyclone tracks, intensities, and effects. The report also
discusses potential issues for Congress, including challenges with tracking and forecasting
tropical cyclones and the potential impacts of climate change on tropical cyclones . The report
then provides an overview of forecasts for the 2020 hurricane season. The report includes two
appendices (Appendix A and Appendix B) with information about the 2019 and 2018 hurricane
seasons.
Tropical Cyclones, Storms, and Hurricanes
The National Oceanic and Atmospheric Administration (NOAA) defines a tropical cyclone as a “rotating, organized
system of clouds and thunderstorms that originates over tropical or subtropical waters and has a closed low -level
circulation.” Cyclones rotate counterclockwise in the Northern Hemisphere and clockwise in the Southern
Hemisphere. Tropical cyclones that form between 5 o and 30 o North latitude typically move westward. According
to NOAA, tropical cyclones include the following:
Tropical Depression—a tropical cyclone with maximum sustained winds of 38 miles per hour (mph) or less.
Tropical Storm—a tropical cyclone with maximum sustained winds of 39 to 73 mph.
Hurricane—a tropical cyclone with maximum sustained winds of 74 mph or higher. Hurricanes are called
typhoons in the western North Pacific Ocean and cyclones in the Indian Ocean and South Pacific Ocean.
Major Hurricane—a tropical cyclone with maximum sustained winds of 111 mph or higher, corresponding to
a category 3, 4, or 5 on the Saffir-Simpson Hurricane Wind Scale.
Source: National Hurricane Center, “Tropical Cyclone Climatology,” at https://www.nhc.noaa.gov/climo/.
Forecasting Tropical Cyclones
NHC, part of NOAA’s National Weather Service (NWS), is responsible for forecasting tropical
cyclones, including hurricanes in the Atlantic and Pacific Oceans. 1 NHC provides estimates of the
path or track, intensity or wind speed, size, and structure of the storm, as well as predictions of
storm surge, precipitation, and tornadoes associated with these storms.2 NOAA may use this
information to issue a hurricane watch or a hurricane warning and public advisories. 3
1
National Oceanic and Atmospheric Administration (NOAA) National Hurricane Center (NHC), “About the National
Hurricane Center,” at https://www.nhc.noaa.gov/aboutintro.shtml.
2
University of Rhode Island Graduate School of Oceanography (URI GSO), “ National Hurricane Center Forecast
Process,” at http://www.hurricanescience.org/science/forecast/forecasting/forecastprocess/. Hereafter URI GSO,
“National Hurricane Center Forecast Process.”
3
A hurricane watch is an announcement that hurricane conditions—sustained winds 74 miles per hour (mph) or
greater—are possible within a specified coastal area, usually issued 48 hours in advance of the onset of tropical storm
force winds. A hurricane warning is issued when hurricane conditions are expected somewhere within the specified
coastal area. URI GSO, “National Hurricane Center Forecast Process.”
Congressional Research Service 1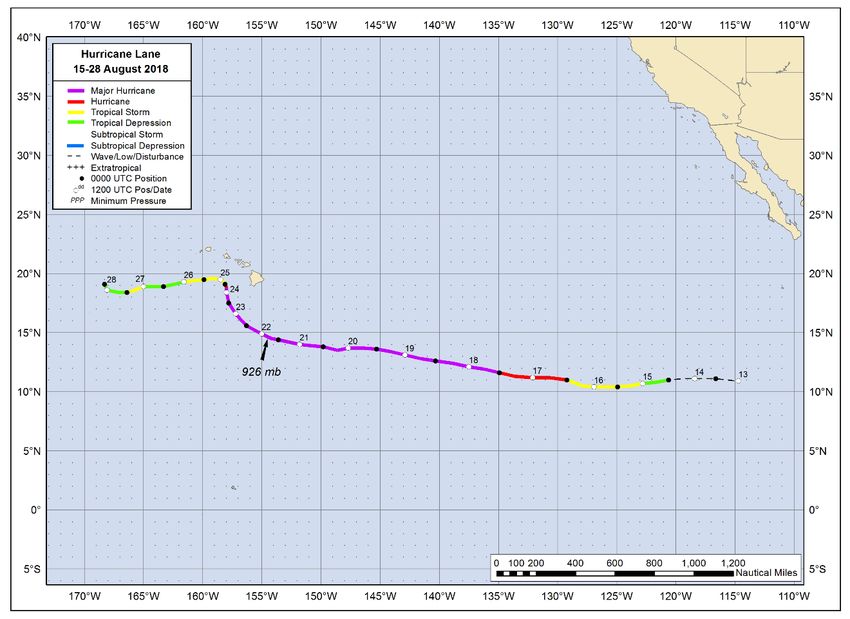
Forecasting Tropical Cyclones: Overview and Issues for Congress

Collecting Data
Storm forecasts involve many components and use a broad array of resources and capabilities
within NOAA and NWS, all of which are coordinated and interpreted by NHC. 4 The process
begins with observations; satellites, aircraft, ships, buoys, radar, and other sources provide data
used to create storm-track and intensity predictions. Most Atlantic hurricanes, for example, begin
to form west of Africa over the ocean. 5 NOAA weather satellites, including two Geostationary
Operational Environmental Satellites (GOES; known as GOES-East and GOES-West) and polar-
orbiting weather satellites, provide remote-sensing observations in the Atlantic and Pacific
basins. 6
NOAA and U.S. Air Force aircraft, known as “Hurricane Hunters,” fly directly into and above the
storm to collect real-time data if a tropical cyclone is judged to pose a threat to the U.S.
coastline. 7 The Chief, Aerial Reconnaissance Coordination, All Hurricanes (CARCAH) unit
coordinates all tropical cyclone operation reconnaissance in accordance with the National
Hurricane Operations Plan. 8 Data collected from the Hurricane Hunters and other aircraft (e.g.,
the National Aeronautics and Space Administration [NASA] Global Hawk) are checked at the
CARCAH and provided to NHC forecasters. 9 Land-based radars begin to provide NHC with
precipitation and wind-velocity data once the storm is approximately 280 miles from the coast.
Automated Surface Observation Systems instruments provide additional ground-based
measurements when the storm is close to shore or makes landfall. 10 Information from other
systems, such as ships and buoys, is also included in forecasts.

4
  Although the entire federal hurricane forecast effort is broader than NOAA, this report focuses on NHC’s. T he
National Hurricane Operations Plan outlines various agency responsibilities across the federal government. See Office
of the Federal Coordinator for Meteorology (OFCM), National Hurricane Plan, at https://www.ofcm.gov/publications/
nhop/nhop2.htm. Hereafter OFCM, National Hurricane Operations Plan.
5 For more information about why hurricanes may threaten the U.S. East Coast and not the U.S. West Coast, see “Why

Do Hurricanes Hit the East Coast of the U.S. but Never the West Coast?,” Scientific American, October 21, 1999, at
https://www.scientificamerican.com/article/why-do-hurricanes-hit-the-east-coast-of-the-u-s-but-never-the-west-coast/.
6
  URI GSO, “National Hurricane Center Forecast Process.” Generally, Geostationary Operational Environmental
Satellite-West (GOES-West) covers the east and central Pacific Ocean and GOES-East covers most of the Atlantic
Ocean. T he Japanese Himawari 8 satellite covers the west and central Pacific Ocean, and the Japan Meteorological
Agency shares the satellite’s images with NOAA and the public. URI GSO, “Geostationary Satellites,” at
http://www.hurricanescience.org/science/observation/satellites/geostationary/; email correspondence with NOAA
Office of Legislative Affairs, January 24, 2020; and NOAA, “Full Disk: Himawari-8,” at https://www.goes.noaa.gov/
f_himawari-8.html.
7
  NOAA Hurricane Hunters are specially equipped aircraft that collect data during hurricanes. T he NOAA fleet
includes two Lockheed WP-3D Orion four-engine turboprop aircraft and one Gulfstream IV-SP jet aircraft. T he WP-3D
aircraft fly directly into hurricanes during the storms and collect in -situ data on winds and atmospheric pressures,
among other measurements. T he IV-SP jet flies at higher altitudes and collects critical information on the “steering”
winds that affect the hurricane track, among other data. NOAA, Office of Marine and Aviation Operations, “ NOAA
Hurricane Hunters,” at https://www.omao.noaa.gov/learn/aircraft-operations/about/hurricane-hunters. T he 53 rd Weather
Reconnaissance Squadron, a component of the 403 rd Wing of the U.S. Air Force located at Keesler Air Force Base in
Biloxi, MS, flies 10 WC-130J Hercules aircraft into hurricanes during weather reconnaissance missions. 403 rd Wing,
“53 rd Weather Reconnaissance Squadron ‘Hurricane Hunters,’” at http://www.403wg.afrc.af.mil/About/Fact-Sheets/
Display/Article/192529/53rd-weather-reconnaissance-squadron-hurricane-hunters/.
8 T he Chief, Aerial Reconnaissance Coordination, All Hurricanes (CARCAH) is a subunit of the 53 rd Weather

Reconnaissance Squadron, U.S. Air Force. OFCM, National Hurricane Operations Plan.
9
 National Aeronautics and Space Administration (NASA), Armstrong Flight Research Center, “ Global Hawk,” at
https://www.nasa.gov/centers/armstrong/aircraft/GlobalHawk/index.html.
10URI GSO, “ Automated Surface Observation Systems (ASOS),” at http://www.hurricanescience.org/science/
observation/landbased/automatedsurfaceobssystems/.

Congressional Research Service                                                                                      2
Forecasting Tropical Cyclones: Overview and Issues for Congress

Analyzing the Data
NHC gathers observational data as a tropical cyclone approaches the U.S. coastline and uses the
data to generate a series of forecast computer model simulations. 11 Tropical cyclone forecast
model simulations typically predict the track (the path) and intensity (the wind speeds) over a
period of three to five days. 12 Available observational data provide a baseline for the model,
which then uses mathematical equations to produce forecasts.
Tropical cyclone forecast models vary. They may differ in how they process information, such as
when observations are fed into the model, which equations they use, how they make forecasts
from the solutions to the equations, and other factors. These differences explain why NHC
forecasts may differ from those of other countries or institutions (e.g., the European Center for
Medium-Range Forecasts produces Atlantic forecasts, as do some research institutions within the
United States, such as the National Center for Atmospheric Research). 13
NHC forecasters analyze the model results and use their experience and expertise to adjust model
forecasts. NHC measures forecast skill by comparing the adjusted forecasts, model-only forecasts,
and a baseline forecast. 14 For example, NHC-adjusted forecasts of Atlantic tropical cyclone tracks
at the 96-hour mark have been more accurate than specific model-only forecasts for the last three
years (Figure 1). 15 NHC-adjusted forecasts have also been more consistent than model-only
forecasts in the last three years, meaning the NHC forecast “holds steady more than the models”
between predictions made every 12 hours, avoiding large track shifts or storm speed changes
(Figure 1). 16

11
   URI GSO, “ Hurricane Forecast Models,” at http://www.hurricanescience.org/science/forecast/models/. Hereafter
URI GSO, “ Hurricane Forecast Models.”
12 Hurricane intensity generally is measured as highest sustained wind speeds. However, that measurement does not

take into consideration the storm-surge or precipitation-caused flooding, both of which may be among the most
dangerous elements of a hurricane.
13
   T he European Centre for Medium-Range Weather Forecasts (ECMWF) is an independent, intergovernmental
organization supported by 34 countries. It produces global numerical weather forecasts using weather models.
ECMWF, “Advancing Global NWP T hrough International Collaboration,” at https://www.ecmwf.int/; and URI GSO,
“ Hurricane Forecast Models.”
14
   According to NOAA, the baseline model “makes forecasts based on a combination of what past storms with similar
characteristics—like location, intensity, forward speed, and the time of year—have done ... and a continuation of what
the current storm has been doing.... T his model contains no information about the current state of the atmosphere and
represents a ‘no-skill’ level of accuracy.” NOAA, “Skill or Luck? How NHC’s Hurricane T rack Forecasts Beat the
Models,” April 9, 2020, at https://noaanhc.wordpress.com/2020/04/09/skill-or-luck-how-nhcs-hurricane-track-
forecasts-beat-the-models/. Hereafter NOAA, “Skill or Luck?”
15   NOAA, “Skill or Luck?”
16
     NOAA, “Skill or Luck?”

Congressional Research Service                                                                                           3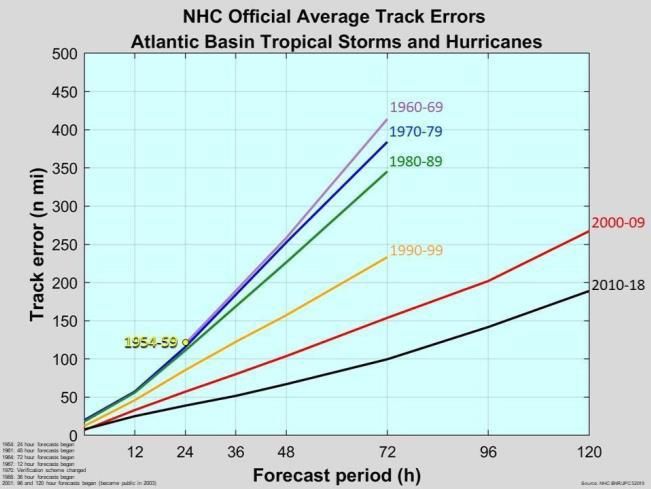
Forecasting Tropical Cyclones: Overview and Issues for Congress

                            Figure 1. 96 Hour Track Error vs. Consistency
                                          2017-2019 in the Atlantic basin

       Source: National Oceanic and Atmospheric Administration (NOAA), “Skill or Luck? How NHC’s Hurricane
       Track Forecasts Beat the Models,” April 9, 2020, at https://noaanhc.wordpress.com/2020/04/09/skill-or-luck-
       how-nhcs-hurricane-track-forecasts-beat-the-models/.
       Notes: n mi = nautical miles; ECMWF = European Centre for Medium Range Weather Forecasts, GFS = U.S.
       Global Forecast System, NHC = National Hurricane Center, UKMET = United Kingdom Meteorological Office
       model.
       According to NOAA, these three models are “the three best individual track models.”

Forecasts and Warnings
The NWS, as delegated by the Secretary of Commerce, has statutory authority for weather
forecasting and for issuing storm warnings.17 Using the results from hurricane forecast models,
different components inside and outside of NHC contribute to the hurricane forecast process.
These components include the Hurricane Specialist Unit (HSU), the Tropical Analysis and
Forecast Branch (TAFB), and the Hurricane Liaison Team (HLT). 18 Of these, the HSU produces

17
     15 U.S.C. §313.
18
  T he T ropical Analysis and Forecast Branch (T AFB) and Hurricane Specialist Unit (HSU) are within NHC; the
Hurricane Liaison T eam (HLT ) is within the Federal Emergency Management Agency (FEMA). HLT is comprised of
federal, state, and local emergency managers, FEMA personnel, and National Weather Service (NWS) forecasters and
hydrologists. On or before the beginning of hurricane season, the NHC director is to request that FEMA activate HLT ,
which remains active throughout the hurricane season. If a tropical cyclone in the Atlantic or eastern Pacific basin

Congressional Research Service                                                                                       4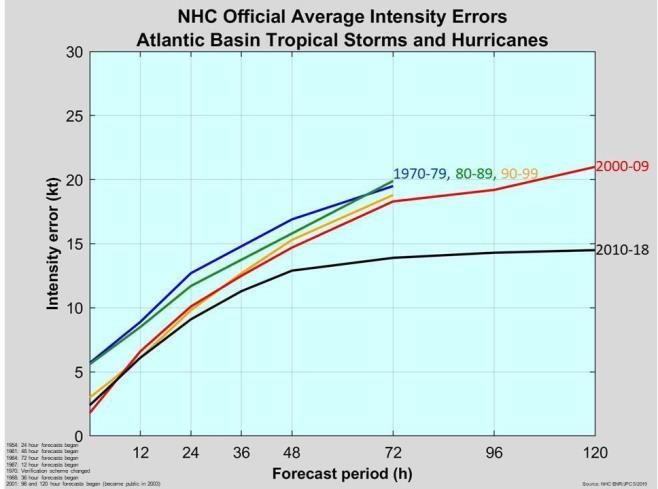
Forecasting Tropical Cyclones: Overview and Issues for Congress
the final, official public forecast products, issued every six hours after a storm forms and more
frequently if a hurricane watch or hurricane warning is issued. 19 The HSU also provides briefings
on tropical storms to emergency managers and to the public, and it cooperates with
meteorological services in other countries (e.g., Mexico). The TAFB supports the HSU by
providing tropical cyclone position and intensity estimates, conducting media interviews, and
assisting in tropical cyclone operations. 20
Forecasts and warnings generally are coordinated between the NWS national centers and the local
forecast offices. When NHC issues its forecast, local NWS Weather Forecast Offices use the
information for their own forecasts, which take into consideration local conditions , and help
disseminate the forecast through established local networks.
Other forecast models are designed specifically to forecast storm surge. The NHC Storm Surge
Unit models and predicts storm-surge vulnerability over the U.S. Atlantic and Gulf Coasts,
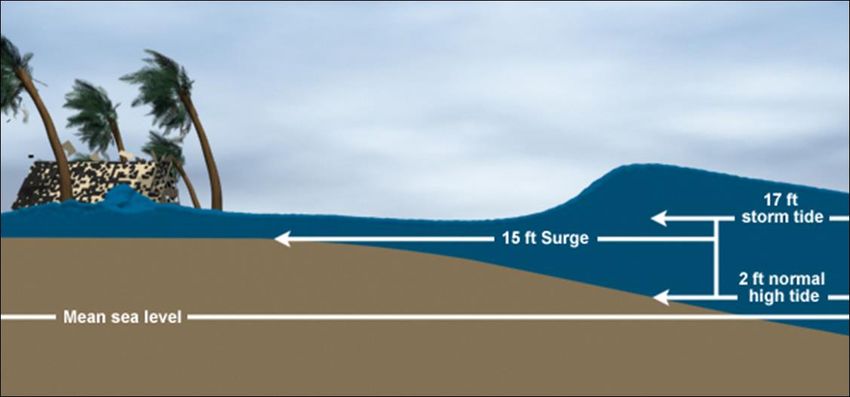
Hawaii, Puerto Rico, the U.S. Virgin Islands, and the Bahamas. 21 Storm surge is defined as an
abnormal rise in sea level generated by a storm, above the predicted astronomical tide. 22 It
generally refers to the difference between the measured level of the sea surface during the storm
compared with what the sea level would have been without a storm (Figure 2). Storm surge can
combine with other factors to create significant flood conditions, such as when it combines with
extreme precipitation or the astronomical high tide (also known as a storm tide, Figure 2). 23 For
example, Superstorm Sandy’s landfall coincided with an astronomical high tide, which produced
a storm tide that inundated the coastline of New Jersey and New York. 24
threatens the United States or its territories, NHC can request that NWS meteorologists or hydrologists be assigned to
HLT until the storm threat has passed. One of HLT ’s main functions is to communicate the threat level to federal, state,
and local officials. Neither HLT nor NHC assumes responsibility for issuing evacuations; state or local officials are
responsible for those decisions. NOAA NHC, “About the National Hurricane Center,” at https://www.nhc.noaa.gov/
aboutintro.shtml; and NOAA NWS, National Weather Service Instruction 10-603, September 21, 2016, at
http://www.nws.noaa.gov/directives/sym/pd01006003curr.pdf.
19 For more on hurricane watches and hurricane warnings, see footnote 3.
20 URI GSO, “National Hurricane Center Forecast Process.”
21
NOAA NHC, “ Storm Surge Unit,” at https://www.nhc.noaa.gov/surge/ssu.php.
22
NOAA NHC, “Storm Surge Overview,” at https://www.nhc.noaa.gov/surge/. Hereafter NOAA, “Store Surge
Overview.”
23
NOAA, “Store Surge Overview.”
24Eric S. Blake et al., National Hurricane Center Tropical Cyclone Report – Hurricane Sandy, February 12, 2013, at
https://www.nhc.noaa.gov/data/tcr/AL182012_Sandy.pdf.
Congressional Research Service 5Forecasting Tropical Cyclones: Overview and Issues for Congress
Figure 2. Storm Surge and Storm Tide
Source: National Hurricane Center, “Storm Surge Overview,” at https://www.nhc.noaa.gov/surge/. (Modified by
CRS.)
Note: The 17-foot storm tide (top arrow) indicates the sum of the 2-foot normal astronomical high tide and the
15-foot storm surge.
NOAA’s Seasonal Hurricane Outlooks25
NOAA releases its seasonal outlooks for the Atlantic, eastern Pacific, and central Pacific prior to
the start of each respective hurricane season.26 The Atlantic and central Pacific hurricane seasons
each run from June 1 to November 30, and the eastern Pacific hurricane season runs from May 15
through November 30; however, tropical cyclones may form outside of these time frames.27
NOAA typically provides an update to the Atlantic outlook in August of each year but does not do
so for the Pacific regions. NOAA includes several disclaimers when issuing its seasonal hurricane
outlook. For example, NOAA does not make a seasonal hurricane landfall forecast, and it does
not predict levels of hurricane activity for any particular area. 28
NOAA provides information about seasonal means and ranges for Atlantic named storms (Table
1) and seasonal means for eastern Pacific named storms (Table 2). 29 For the central Pacific
Ocean, a shorter observational record of hurricanes and major hurricanes limits the statistical
25
NOAA’s outlooks typically cover all types of tropical cyclones, but the agency uses the term “hurricane” in outlook
titles.
26NOAA, NWS Climate Prediction Center (CPC), “Expert Assessments,” at https://www.cpc.ncep.noaa.gov/products/
expert_assessment/. T he Eastern Pacific hurricane region covers the eastern Pacific Ocean east of 140 oW north of the
equator, and the Central Pacific hurricane region covers the areas between 140 oW and 180 o.
27
According to NOAA, “ When the Weather Bureau organized its new hurricane warning network in 1935 it scheduled
a special telegraph line to connect the various centers to run from June 15 th through November 15 th. T hose remained the
start and end dates of the ‘official’ season until 1965, when it was decided to start at the beginning of the month of June
and run until the end of November.” NOAA Atlantic Oceanographic and Meteorological Laboratory
28
NOAA, NWS CPC, “NOAA 2020 Atlantic Hurricane Season Outlook,” press release, May 21, 2020, at
https://www.cpc.ncep.noaa.gov/products/outlooks/hurricane.shtml. Hereafter NOAA 2020 Atlantic Hurricane Season
Outlook, May 2020
29 NOAA typically names a storm once it reaches tropical storm strength (e.g., sustained winds of 39 or more mph).
Congressional Research Service 6Forecasting Tropical Cyclones: Overview and Issues for Congress
information available. NOAA uses available information to predict that four to five tropical
cyclones, on average, develop or move across the central Pacific region each year. 30
Table 1. Seasonal Means and Ranges for Atlantic Named Storms
1981-2010
Mean Mean
Number of Range of Mean Number of Range of
Season Named Named Number of Range of Major Major
Type Storms Storms Hurricanes Hurricanes Hurricanes Hurricanes
Above 16.5 12-28 9.7 7-15 4.8 3-7
Normal
Near 12.3 10-15 6.3 4-9 2.3 1-4
Normal
Below 6.7 4-9 3.3 2-4 1.0 0-2
Normal
All Seasons 12.1 4-28 6.4 2-15 2.7 0-7
Sources: National Oceanic and Atmospheric Administration (NOAA), National Weather Service, Climate
Prediction Center, “Background Information: North Atlantic Hurricane Season,” at
https://www.cpc.ncep.noaa.gov/products/outlooks/archives/hurricane2017/August/NorATL_Background.shtml;
and email correspondence with NOAA Office of Legislative and Intergovernmental Affairs, May 14, 2020.
Notes: According to NOAA, climatological averages for weather data are typically computed over a 30 -year
time period (currently 1981-2010). The 30-year averages are updated every 10 years. The next update is
expected to occur after the 2020 season.
NOAA typically names a storm once it reaches tropical storm strength (e.g., sustained winds of 39 or more
miles per hour).
Table 2. Seasonal Means for Eastern Pacific Named Storms
1981-2010
Season Type Mean Number of Mean Number of Mean Number of
Named Storms Hurricanes Major Hurricanes
All Seasons 15 8 4
Source: Email correspondence with NOAA, Office of Legislative Affairs, May 14, 2020.
Notes: According to NOAA, climatological averages for weather data are typically computed over a 30 -year
time period (currently 1981-2010). The 30-year averages are updated every 10 years. The next update is
expected to occur after the 2020 season.
2020 Hurricane Season Outlooks
NOAA issued its initial 2020 Atlantic hurricane season outlook in May 2020 (Table 3) and
indicated that an above-normal season had the highest chance (60%) of occurring. 31 In August,
the agency updated its outlook and indicated that the likelihood of an above-normal season has
increased to 85%. 32
30
Email correspondence with NOAA Office of Legislative Affairs, January 24, 2020.
31
NOAA 2020 Atlantic Hurricane Season Outlook, May 2020.
NOAA, “‘Extremely active’ hurricane season possible for Atlantic Basin,” August 6, 2020, at https://www.noaa.gov/
32
media-release/extremely-active-hurricane-season-possible-for-atlantic-basin.
Congressional Research Service 7Forecasting Tropical Cyclones: Overview and Issues for Congress
Table 3. 2020 Atlantic Hurricane Season Seasonal Outlooks
NOAA Seasonal Outlook NOAA Seasonal Outlook
(May 2020) (August 2020) Actual
Named Storms: 13-19 Named Storms: 19-25 Named Storms: NA
Hurricanes: 6-10 Hurricanes: 7-11 Hurricanes: NA
Major Hurricanes: 3-6 Major Hurricanes: 3-6 Major Hurricanes: NA
Source: NOAA, “Busy Atlantic hurricane season predicted for 2020,” May 21, 2020, at https://www.noaa.gov/
media-release/busy-atlantic-hurricane-season-predicted-for-2020; and NOAA, “‘Extremely active’ hurricane
season possible for Atlantic Basin,” August 6, 2020, at https://www.noaa.gov/media-release/extremely-active-
hurricane-season-possible-for-atlantic-basin.
Notes: NA = not available.
For comparison, the 1981 to 2010 seasonal averages include 12 named storms, 6 hurricanes, and
3 major hurricanes. 33 For the sixth year in a row, a tropical cyclone formed before the June 1 start
of the hurricane season—Tropical Storm Arthur formed on May 16, 2020, and Tropical Storm
Bertha formed on May 27, 2020. 34
Several nonfederal entities also have published their outlooks for the season. For example, the
private weather forecasting company AccuWeather published its 2020 Atlantic hurricane outlook
in March 2020, predicting 14 to 18 named storms, 7 to 9 hurricanes, and 2 to 4 major
hurricanes. 35 Accuweather released an updated outlook in May, predicting 14 to 20 named storms,
7 to 11 hurricanes, and 4 to 6 major hurricanes. 36 The Department of Atmospheric Science at
Colorado State University (CSU) issued its forecast in early April 2020. CSU predicted above-
normal activity, with 16 named storms, 8 hurricanes, and 4 major hurricanes in the Atlantic. 37
CSU has released several updates, the most recent in August, which predicted 24 named storms,
12 hurricanes, and 5 major hurricanes. 38 In late April 2020, the Penn State Earth System Science
Center released its 2020 forecast, predicting 15 to 24 named storms.39 All three forecasts rely, in
part, on information collected and shared by NOAA.
33According to NOAA, climatological averages for weather data are typically computed over a 30 -year time period
(currently 1981 to 2010). T he 30-year averages are updated every 10 years, with the next update expected to occur after
the 2020 season. Email correspondence with NOAA Office of Legislative and Intergovernmental Affairs, May 14,
2020.
34
NHC, “Arthur Graphics Archive,” at https://www.nhc.noaa.gov/archive/2020/ART HUR_graphics.php; and NHC,
“Bertha Graphics Archive,” at https://www.nhc.noaa.gov/archive/2020/BERT HA_graphics.php.
35 Jillian MacMath, “AccuWeather’s 2020 Atlantic hurricane season forecast is out,” AccuWeather, March 25, 2020, at
https://www.accuweather.com/en/hurricane/accuweathers-2020-atlantic-hurricane-season-forecast/705233.
AccuWeather’s forecast also estimated two to four “high-impact storms affecting the United States.”
36 John Roach, “AccuWeather increases number of hurricanes predicted for ‘very active’ 2020 Atlantic season,”
AccuWeather, May 25, 2020, at https://www.accuweather.com/en/hurricane/accuweather-issues-2020-atlantic-
hurricane-season-forecast-update/735844.
37
Phil Klotzbach et al., “Extended range forecast of Atlantic seasonal hurricane activity and landfall strike probability
for 2020,” April 2, 2020, at https://tropical.colostate.edu/media/sites/111/2020/04/2020-04.pdf. Unlike the NOAA
hurricane forecasts, Klotzbach, et al.’s outlook includes an estimate of landfall probability —for 2020 the researchers
predict an above-average probability for major hurricanes to make landfall along the conterminous United States and
the Caribbean.
38
Philip J. Klotzbach, Michael M. Bell, and Jhordanne Jones, Forecast of Atlantic Seasonal Hurricane Activity and
Landfall Strike Probability for 2020, Colorado State University Department of Atmospheric Science, August 2020, at
https://tropical.colostate.edu/Forecast/2020-08.pdf.
39 Penn State Earth System Science Center, “T he 2020 North Atlantic Hurricane Season: Penn State ESSC Forecast,”
Congressional Research Service 8Forecasting Tropical Cyclones: Overview and Issues for Congress
NOAA also released its 2020 outlooks for the eastern and central Pac ific hurricane seasons in
May 2020. 40 NOAA anticipated that both basins would most likely experience a near-normal
(40% chance of occurring) to a below-normal (35%) season, with an above-normal season less
likely to occur (25%). 41 See Table 4 for the eastern Pacific outlook. NOAA predicted the central
Pacific would experience two to six tropical cyclones. NOAA does not publish updates to its
eastern and central Pacific region outlooks. On average, the eastern Pacific basin experiences 15
named storms, 8 hurricanes, and 4 major hurricanes each year, and the central Pacific averages 4
to 5 tropical cyclones each year.
Table 4. 2020 Eastern Pacific Hurricane Season Seasonal Outlook
NOAA Seasonal Outlook
(May 2020)
Named Storms: 11-18
Hurricanes: 5-10
Major Hurricanes: 1-5
Source: NOAA, “NOAA’s 2020 Hurricane Season Outlooks,” at https://www.cpc.ncep.noaa.gov/products/
Epac_hurr/Slide1.JPG.
Issues for Congress
Congress has considered and may continue to consider issues around federal activities related to
tropical cyclone forecasting and impacts. Some issues, including the effects of climate change on
tropical cyclones and forecasting certain aspects of these storms, are directly linked to federal
tropical cyclone activities. Other issues, such as federal government interactions with the private
sector weather enterprise and potential fifth-generation (5G) interference with satellite sensors,
may affect the existing weather data structure, potentially leading to indirect impacts on federal
tropical cyclone activities.
Impacts of Climate Change on Tropical Cyclones
As of February 2020, NOAA has identified several potential changes related to tropical cyclones,
including that
all else equal, coastal inundation levels associated with tropical cyclones should
increase with sea level rise;42
tropical cyclone rainfall rates will likely increase in the future;
April 2020, at http://www.essc.psu.edu/essc_web/research/Hurricane2020.html.
40
NOAA, “NOAA’s 2020 Hurricane Season Outlooks,” at https://www.cpc.ncep.noaa.gov/products/Epac_hurr/
Slide1.JPG. Hereafter NOAA’s 2020 Hurricane Outlooks, Slide 1.
41
NOAA’s 2020 Hurricane Outlooks, Slide 1.
42
NOAA Geophysical Fluid Dynamics Laboratory (GFDL), “Global Warming and Hurricanes,” last revised February
5, 2020, at https://www.gfdl.noaa.gov/global-warming-and-hurricanes/. Hereafter NOAA GFDL, “Global Warming
and Hurricanes,” 2020. According to the report, the average rate of global sea level rise over the 21 st century will very
likely exceed that observed during 1971-2010 for a range of future emission scenarios. NOAA’s terminology for its
likelihood statements (for the assessed likelihood of an outcome or result) generally follows the conventions used by
the Intergovernmental Panel on Climate Change. In this case, very likely denotes a greater than 90% probability of
occurring and likely denotes a greater than 66% probability of occurring.
Congressional Research Service 9Forecasting Tropical Cyclones: Overview and Issues for Congress
tropical cyclone intensities (wind speeds) globally will likely increase on average;
and
the global proportion of tropical cyclones that reach very intense (category 4 and
5) levels will likely increase. 43
NOAA continues to support research into the effects of climate change on tropical cyclones under
its current authorities. Members of Congress may consider whether additional federal resources
should be allocated to study the potential impacts of climate change on certain aspects of tropical
cyclones, such as storm surge and precipitation. At the House Science, Space, and Technology
Committee hearing entitled “Weathering the Storm: Improving Resiliency through Research” in
Houston, TX, on July 22, 2019, several participants spoke of work being done at federal and
nonfederal organizations and the need to better understand how storm surge and precipitation may
change with climate change. 44
For example, NOAA’s Assistant Administrator for Weather Services and Director of NWS Dr.
Louis Uccellini stated that NWS has been accommodating “that background, the changing
background state, into storm surge and potential impacts of intense storms,” and the agency needs
“to account for [the changing background state] with respect to [NWS] watches and warnings.”45
Representative Sheila Jackson Lee noted that “we need to focus our time understanding how
impactful climate change is.” University of Houston Director of the Hurricane Resilience
Research Institute Dr. Hanadi Rifai, noted that “much more effort” is needed to further develop
storm surge models into “robust predictive platforms” that incorporate climate change, among
other factors. 46
Forecasting Certain Aspects of Tropical Cyclones
The ability to forecast the potential path a storm may take, also known as its track, has improved
steadily since the 1960s (Figure 3). For example, track errors in the current decade are less than
half of what they were in the 1990s. 47 According to NOAA, the 2019 five-day track forecast was
better than the 1970s 36-hour forecast.48 Accuracy over an extended forecast time frame has
improved. In the 1990s, forecasts were available only on a three-day time frame; today forecasts
typically extend out to five days. 49 Some stakeholders argue that after years of significant
advances, improvements in track forecasting may be slowing. 50 The slowdown, these researchers
43 NOAA GFDL, “Global Warming and Hurricanes,” 2020.
44U.S. Congress, House Committee on Science, Space, and T echnology, Subcommittee on Environmen t, Field
Hearing: Weathering the Storm: Improving Hurricane Resiliency through Research , 116 th Cong., 1 st sess., July 22,
2019 (Washington, DC: GPO, 2019), pp. 85-86, 94. Hereafter House Committee hearing, Improving Hurricane
Resiliency through Research, 2019.
45
House Committee hearing, Improving Hurricane Resiliency through Research, 2019, p. 85.
46
House Committee hearing, Improving Hurricane Resiliency through Research, 2019, pp. 29-30, 94.
47Forecast errors indicate the difference between the forecast track and the actual t rack in nautical miles (n mi). T he
forecast period is shown in hours (h).
48
Written testimony of Assistant Administrator for Weather Services and Director of the NWS, Dr. Louis Uccellini in
U.S. Congress, House Committee on Science, Space, and T echnology, Subcommittee on Environment, Field Hearing:
Weathering the Storm: Improving Hurricane Resiliency through Research , 116 th Cong., 1 st sess., July 22, 2019.
Hereafter, Uccellini, written testimony, 2019.
49
In other words, five-day forecasts today are as good as three-day forecasts were 25 years ago.
50 Christopher W. Landsea and John P. Cangialosi, “ Have we reached the limits of predictability for tropical cyclone
track forecasting?,” Bulletin of the American Meteorological Society, vol. 99, no. 11 (November 2018), pp. 2237-2243.
Hereafter Landsea and Cangialosi, “Limits of Predictability,” 2018.
Congressional Research Service 10Forecasting Tropical Cyclones: Overview and Issues for Congress
contend, may be due to the limit of predicting how the most minor meteorological factors may
change over the course of a forecast.51
Figure 3. NHC Official Average Track Errors Comparison
by decade for Atlantic basin tropical storms and hurricanes
Source: Written testimony of Assistant Administrator for Weather Services and Director of the National
Weather Service Dr. Louis Uccellini, in U.S. Congress, House Committee on Science, Space, and Technology,
Subcommittee on Environment, Field Hearing: Weathering the Storm: Improving Hurricane Resiliency through
Research, 116 th Cong., 1 st sess., July 22, 2019.
Notes: Forecast errors indicate the difference between the forecast track and the actual track in nautical miles
(n mi); forecast period shown in hours (h). The National Hurricane Center (NHC) issues official forecasts every
6 h; each forecast has projections valid 12, 24, 36, 48, 72, 96, and 120 h after the forecast’s initial time.
Forecasting a storm’s wind speeds, also known as its intensity, is considered to be more difficult
than forecasting its track. The last decade brought advances in intensity forecasting (Figure 4).
The largest incremental improvements since the 1970s occurred between 2010 and 2018,
especially at the three-day and longer forecasts. 52 Some researchers identify the need for
51 Landsea and Cangialosi, “Limits of Predictability,” 2018.
52
T he 2010 to 2018 average intensity error for Atlantic basin tropical storms and hurricanes was close to 15 knots,
which corresponds roughly to a difference of one hurricane category on the Saffir -Simpson Hurricane Wind Scale.
NOAA encourages communities that may be affected by these storms to prepare for a storm one category stronger th an
what is forecasted to account for the expected average intensity error. NOAA NHC, “T he State of Hurricane
Forecasting,” March 9, 2018, at https://noaanhc.wordpress.com/2018/03/09/the-state-of-hurricane-forecasting/.
Congressional Research Service 11Forecasting Tropical Cyclones: Overview and Issues for Congress
improved models, enhanced observations, and better understanding of a storm’s inner core to
further improve the accuracy of intensity forecasts. 53 The increased accuracy and extended time
frame provide useful information to local, state, and federal emergency managers faced with
decisions about evacuating coastlines and staging emergency equipment and supplies.
Figure 4. NHC Official Average Intensity Errors Comparison
by decade for Atlantic basin tropical storms and hurricanes
Source: Written testimony of Assistant Administrator for Weather Services and Director of the National
Weather Service Dr. Louis Uccellini, in U.S. Congress, House Committee on Science, Space, and Technology,
Subcommittee on Environment, Field Hearing: Weathering the Storm: Improving Hurricane Resiliency through
Research, 116 th Cong., 1 st sess., July 22, 2019.
Notes: Intensity errors expressed as wind speed measured in knots (kts). Forecast period shown in hours (h).
The National Hurricane Center (NHC) issues official forecasts every 6 h, and each forecast has projections valid
12, 24, 36, 48, 72, 96, and 120 h after the forecast’s initial time.
Track and intensity forecasts do not consider storm surge or precipitation-caused flooding, both of
which may be among the most dangerous elements of a storm. The amount of rainfall produced
by a storm may not necessarily be related to the intensity of the hurricane. 54 For example, record
levels of precipitation and subsequent flooding during Hurricane Harvey continued even after the
53
Mark DeMaria, “T ropical Cyclone Intensity Analysis and Forecasting,” paper presented at the WMO RA -IV
Workshop on Hurricane Forecasting and Warning, Miami, FL, March 7, 2017, at https://severeweather.wmo.int/
T CFW/RAIV_Workshop2017/19c_TC_Intensity_Forecasting_MarkDeMaria.pdf.
54 NOAA NHC, “Hurricane Preparedness-Hazards,” at https://www.nhc.noaa.gov/prepare/hazards.php.
Congressional Research Service 12Forecasting Tropical Cyclones: Overview and Issues for Congress
storm made landfall and was downgraded from a hurricane to a tropical storm. 55 Improving the
ability to accurately forecast the timing, amount, and location of high rainfall periods could
advance the value of tropical cyclone forecasting. Research in both areas is ongoing. 56
Congress has directed or supported agency efforts in tropical cyclone-related research and
applications. Most recently, Congress enacted the Weather Research and Forecasting Innovation
Act of 2017 (WRFIA; P.L. 115-25, 15 U.S.C. 8514), which aimed to improve weather forecasting
and prediction, among other activities. 57 WRFIA Section 104 required the Under Secretary of
Commerce for Oceans and Atmosphere to maintain a project to improve hurricane forecasting
with a goal to
“develop and extend accurate hurricane forecasts and warnings in order to reduce loss of
life, injury, and damage to the economy,” with a focus on
(1) improving the prediction of rapid intensification and track of hurricanes;
(2) improving the forecast and communication of storm surges from hurricanes; and
(3) incorporating risk communication research to create more effective watch and warning
products.58
Section 104 also required the development of a project plan to reach the congressional goals .
NOAA released the project plan in 2019. 59 The plan lists several strategies the agency plans to use
to achieve the goals, including the following:
advance an operational Hurricane Analysis and Forecast System (a multiscale
model and data package capable of providing analyses and forecasts of the inner
core structure of tropical cyclones out to seven days);
improve probabilistic guidance that quantifies uncertainty for all tropical cyclone
hazards, such as wind and storm surge;
enhance communication of risk and uncertainty with “iterative, collaborated
physical, social, and behavioral science research”;
support dedicated high performance computing allocation to eliminate
competition with other high-priority computing needs across NOAA’s programs;
enhance research to operations including the acceleration of research and new
observing systems and platforms to operations; and
55
T om Di Liberto, “Reviewing Hurricane Harvey’s catastrophic rain and flooding,” NOAA, September 18, 2017, at
https://www.climate.gov/news-features/event-tracker/reviewing-hurricane-harveys-catastrophic-rain-and-flooding.
56
For example, researchers discuss recent research st udies and forecast challenges related to tropical cyclones in Kevin
Cheung et al., “Recent Advances in Research and Forecasting of T ropical Storm Rainfall,” Tropical Cyclone Research
and Review, vol. 7, no. 2 (May 2018).
57
For example, §107 requires the Assistant Administrator for Oceanic and Atmospheric Research to undertake
Observing System Simulation Experiments, or such other assessments as the Assistant Administrator considers
appropriate, to quantitatively assess the relative value and benefits of observing capabilities and systems over a variety
of topics (e.g., the impact of observing capabilities on hurricane track and intensity forecasting) and §413 of the act
requires the Under Secretary of Commerce for Oceans and Atmosphere to acquire backup capabilities for Hurricane
Hunter aircraft.
58
15 U.S.C. §8514.
59NOAA, Report to Congress: Hurricane Forecast Improvement Program , 2019, at https://repository.library.noaa.gov/
view/noaa/22034.
Congressional Research Service 13Forecasting Tropical Cyclones: Overview and Issues for Congress
broaden expertise and expand interaction with the nonfederal community through
the Scientific Review Committee, a grants and contracts program, and outreach
and education.
The plan includes objectives for each strategy. It is unclear how NOAA has specifically
implemented each of the strategies and objectives and how much progress has been made in
reaching the goals established in P.L. 115-25. For example, the agency has continued to develop
and release a variety of tropical cyclone-related storm surge products for the public. 60 NOAA
plans to release additional products in 2020, including storm surge watch/warning graphics for
Puerto Rico and the U.S. Virgin Islands and experimental peak storm surge forecast graphics for
the U.S. East and Gulf Coasts, Puerto Rico and the U.S. Virgin Islands. 61 In another instance,
NOAA indicated in an annual report required under WRFIA that the U.S. Weather Research
Program currently supports several tropical cyclone projects, primarily focused on storm
development and intensity. 62 In both cases, it is unclear if these new products or projects are in
response to congressional direction in WRFIA or were planned or in development before
WRFIA’s enactment.
Congress continues to consider tropical cyclone forecasting in the 116 th Congress. For example,
the House Science, Space, and Technology Committee held a hearing on July 22, 2019 (see the
section entitled “Impacts of Climate Change on Tropical Cyclones”). Several participants noted
potential areas of storm forecasting improvement, including short- and long-term forecasting and
predicting storm surge and rainfall flooding. 63 In S.Rept. 116-127, the appropriations committee
“encourage[d] NWS to reduce errors in tracking and intensity forecasts of hurricanes by
identifying technology and methods available to significantly improve hurricane forecasting.”64
NOAA Interactions with the Private Sector Weather Enterprise
NOAA recognizes that the “nation’s environmental information enterprise,” including the
weather enterprise, is conducted by many parties (i.e., the government, private sector entities, and
the academic and research community), and the agency has the “responsibility” to foster growth
of the enterprise to serve the public interest and the nation’s economy. 65 Under statute, the
Secretary of Commerce is responsible for
forecasting of weather, the issue of storm warnings, the display of weather and flood
signals for the benefit of agriculture, commerce, and navigation, ... the distribution of
meteorological information in the interests of agriculture and commerce, and the taking of
such meteorological observations as may be necessary to establish and record the climatic
60 For example, NOAA has released experimental storm surge watch/warning graphics for the U.S. Atlantic and Gulf
Coasts since 2017. NHC, “Prototype Storm Surge Watch/Warning Graphic,” at https://www.nhc.noaa.gov/
experimental/surgewarning/.
61
Michael Brennan, “National Hurricane Center Product Changes for 2020,” online video presentation, April 29, 2020,
at https://www.youtube.com/watch?v=oWfh_iJcfv0&feature=youtu.be.
62
NOAA, Report to Congress: United States Weather Research Program Annual Project Report, 2020, at
https://repository.library.noaa.gov/view/noaa/23647.
63House Committee hearing, Improving Hurricane Resiliency through Research, 2019, pp. 10 and 92.
64U.S. Congress, Senate Committee on Appropriations, Departments of Commerce and Justice, Science, and Related
Agencies Appropriations Bill, 2020, report to accompany S. 2584, 116 th Cong., 1 st sess., S.Rept. 116-127, September
26, 2019 (Washington, DC: GPO, 2019), p. 54.
65NOAA, “ Policy on Partnerships in the Provision of Environmental Information ,” NAO 216-112, last reviewed
January 31, 2019, at https://www.corporateservices.noaa.gov/ames/administrative_orders/chapter_216/216-112.html.
Hereafter NOAA, NAO 216-112.
Congressional Research Service 14You can also read