How (In)accurate Are Demand Forecasts in Public Works Projects?
←
→
Page content transcription
If your browser does not render page correctly, please read the page content below
How (In)accurate Are
This article presents results from the first
statistically significant study of traffic
forecasts in transportation infrastructure
Demand Forecasts in
projects. The sample used is the largest
of its kind, covering projects in
nations worth U.S.$ billion. The study
Public Works Projects?
shows with very high statistical signifi-
cance that forecasters generally do a poor
job of estimating the demand for trans-
portation infrastructure projects. For
out of rail projects, passenger forecasts
The Case of Transportation
are overestimated; the average overestima-
tion is %. For half of all road projects, Bent Flyvbjerg, Mette K. Skamris Holm, and Søren L. Buhl
the difference between actual and fore-
casted traffic is more than ±%. The
result is substantial financial risks, which
are typically ignored or downplayed by
espite the enormous sums of money being spent on transportation
D
planners and decision makers to the det-
riment of social and economic welfare. infrastructure, surprisingly little systematic knowledge exists about the
Our data also show that forecasts have not costs, benefits, and risks involved. The literature lacks statistically valid
become more accurate over the -year answers to the central and self-evident question of whether transportation infra-
period studied, despite claims to the con-
trary by forecasters. The causes of inaccu-
structure projects perform as forecasted. When a project underperforms, this is
racy in forecasts are different for rail and often explained away as an isolated instance of unfortunate circumstance; it is
road projects, with political causes playing typically not seen as the particular expression of a general pattern of underper-
a larger role for rail than for road. The formance in transportation infrastructure projects. Because knowledge is wanting
cure is transparency, accountability, and in this area of research, until now it has been impossible to validly refute or con-
new forecasting methods. The challenge
firm whether underperformance is the exception or the rule.
is to change the governance structures
for forecasting and project development.
In three previous articles (Flyvbjerg, Holm, et al., , , ), we
Our article shows how planners may help answered the question of project performance as regards costs and cost-related
achieve this. risks. We found that projects do not perform as forecasted in terms of costs:
almost out of projects fall victim to significant cost overrun. We also inves-
Bent Flyvbjerg is a professor of planning tigated the causes and cures of such inaccurate cost projections (see Flyvbjerg,
at Aalborg University, Denmark. He is Bruzelius, et al., ). In this article we focus on the benefit side of investments
founder and director of the university’s
and answer the question of whether projects perform as forecasted in terms of
research program on large-scale infra-
structure planning. His latest books are demand and revenue risks. We compare forecasted demand with actual demand
Megaprojects and Risk (Cambridge Uni- for a large number of projects. Knowledge about cost risk, benefit risk, and com-
versity Press, , with Nils Bruzelius pound risk is crucial to making informed decisions about projects. This is not to
and Werner Rothengatter), Making Social say that costs and benefits are or should be the only basis for deciding whether to
Science Matter (Cambridge University build. Clearly, forms of rationality other than economic rationality are at work
Press, ), and Rationality and Power
in most infrastructure projects and are balanced in the broader frame of public
(University of Chicago Press, ). Mette
K. Skamris Holm is a former assistant decision making. But the costs and benefits of infrastructure projects often run
professor of planning at Aalborg Univer- in the hundreds of millions of dollars, with risks correspondingly high. Without
sity. She now works as a planner with knowledge of such risks, decisions are likely to be flawed.
Aalborg Municipality. Søren L. Buhl As pointed out by Pickrell () and Richmond (), estimates of the
is an associate professor of mathematics financial viability of projects are heavily dependent on the accuracy of traffic
at Aalborg University. He is associate
statistician with the university’s research
demand forecasts. Such forecasts are also the basis for socioeconomic and envi-
program on large-scale infrastructure ronmental appraisal of transportation infrastructure projects. According to the
planning. experiences gained with the accuracy of demand forecasting in the transportation
sector, covering traffic volumes, spatial traffic distribution, and distribution be-
Journal of the American Planning Association,
Vol. , No. , Spring .
tween transportation modes, there is evidence that demand forecasting—like cost
© American Planning Association, Chicago, IL. forecasting, and despite all scientific progress in modeling—is a major source of
Journal of the American Planning Association, Spring , Vol. , No.
uncertainty and risk in the appraisal of transportation small samples used in existing studies; it does not hold for
infrastructure projects. the project population. When we enlarge the sample of
Traffic forecasts are routinely used to dimension the projects by a factor – to a more representative one, we
construction of transportation infrastructure projects. find a different picture. Road traffic forecasts are not gen-
Accuracy in such forecasts is a point of considerable im- erally overestimated, although they are often very inaccu-
portance for the effective allocation of scarce funds. For rate, whereas forecasts of rail patronage are generally over-
example, Bangkok’s U.S.$ billion Skytrain was hugely estimated, often dramatically so.
overdimensioned because the passenger forecasts were . We follow common practice and define the inaccuracy
times higher than actual traffic. As a result, station plat- of a traffic forecast as actual minus forecasted traffic in per-
forms are too long for the shortened trains that now oper- centage of forecasted traffic. Traffic is measured as number
ate the system, a large number of trains and cars are idly of passengers for rail, and number of vehicles for roads
parked in the train garage because there is no need for them, Actual traffic is counted for the first year of operations (or
terminals are too large, etc. The project company has ended the opening year). Forecasted traffic is the traffic estimate
up in financial trouble, and even though urban rail is prob- for the first year of operations (or the opening year) as esti-
ably a good idea for a congested and air-polluted city like mated at the time of decision to build the project. Thus
Bangkok, overinvesting in idle capacity is hardly the best the forecast is the estimate available to decision makers
way to use resources, and especially not in a developing when they made the decision to build the project in ques-
nation where capital for investment is scarce. Conversely, tion. If no estimate was available at the time of decision to
a U.K. National Audit Office () study identified a num- build, then the closest available estimate was used, typically
ber of road projects that were underdimensioned because a later estimate, resulting in a conservative bias in our
traffic forecasts were too low. This, too, led to multimillion- measure for inaccuracy.
dollar inefficiencies, because it is much more expensive to We measured inaccuracy of traffic forecasts in a sample
add capacity to existing, fully used roads than it is to build of transportation infrastructure projects with compar-
the capacity up front. For these and other reasons, accuracy able data for forecasted and actual traffic. The sample
in traffic forecasts matters. comprises a project portfolio worth approximately U.S.$
Nevertheless, rigorous studies of accuracy are rare. billion in actual costs ( prices). The portfolio includes
Where such studies exist, they are characteristically small- rail projects and road projects completed between
N research; that is, they are single-case studies or they and . The project types are urban rail, high-speed
cover a sample of projects too small or too uneven to allow rail, conventional rail, bridges, tunnels, highways, and free-
systematic, statistical analyses (Brooks & Trevelyan, ; ways. The projects are located in countries on conti-
Fouracre et al., ; Fullerton & Openshaw, ; Kain, nents, including both developed and developing nations:
; Mackinder & Evans, ; National Audit Office, Brazil, Chile, Denmark, Egypt, France, Germany, Hong
, ; Pickrell, ; Richmond, ; Walmsley & Kong, India, Mexico, South Korea, Sweden, Tunisia, the
Pickett, ; Webber, : World Bank, ). Despite U.K., and the U.S. Projects were selected for the sample
their value in other respects, with these and other studies, based on the availability and quality of data. As far as we
it has so far been impossible to give statistically satisfying know, this is the largest sample of transportation infrastruc-
answers to questions about how accurate traffic forecasts ture projects that has been established with comparable
are for transportation infrastructure projects. data on forecasted and actual traffic. For a full description
The objective of the present study has been to change of the sample, data, and methods of testing for inaccuracy,
this state of affairs by establishing a sample of transpor- please see Flyvbjerg ().
tation infrastructure projects that is sufficiently large to
permit statistically valid answers to questions of accuracy.
In addition, it has been a practical objective to give plan- Are Rail or Road Forecasts More
ners the tools for carrying out realistic and valid risk assess-
Accurate?
ment of projects as regards travel demand. Existing studies
almost all conclude there is a strong tendency for traffic Figures and show the distribution of inaccuracy of
forecasts to be overestimated (Fouracre et al., , pp. & traffic forecasts for the projects in the sample split into
; Mackinder & Evans, , p. ; National Audit Office, rail and road projects. Perfect accuracy is indicated by zero;
, app. .; Pickrell, , p. x; Thompson, , pp. a negative figure indicates that actual traffic is that many
–; Walmsley & Pickett, , p. ; World Bank, ). percent lower than forecasted traffic; a positive figure indi-
We will show that this conclusion is a consequence of the cates that actual traffic is that many percent higher than
Flyvbjerg: How (In)accurate Are Demand Forecasts in Public Works Projects?
forecasted traffic. The most noticeable attribute of Figures higher than forecasted traffic (sd=., % confidence
and is the striking difference between rail and road interval of . to .).
projects. Rail passenger forecasts are much more inaccurate
(inflated) than are road traffic forecasts. Here it would be interesting to compare toll roads
Tests show that of the rail projects included in the with non-toll roads, but unfortunately the present data do
statistical analyses, two German projects should be consid- not allow this.
ered as statistical outliers. These are the two projects repre- We see that the risk is substantial that road traffic fore-
sented by the two rightmost columns in the rail histogram casts are wrong by a large margin, but the risk is more bal-
in Figure and the two uppermost plots in the rail box- anced than for rail passenger forecasts. Testing the differ-
plot diagram shown in Figure . Excluding statistical out- ence between rail and road, we find at a very high level of
liers, we find the following results for the remaining rail statistical significance that rail passenger forecasts are less
projects (results including the two statistical outliers are accurate and more inflated than road vehicle forecasts
given in brackets): (p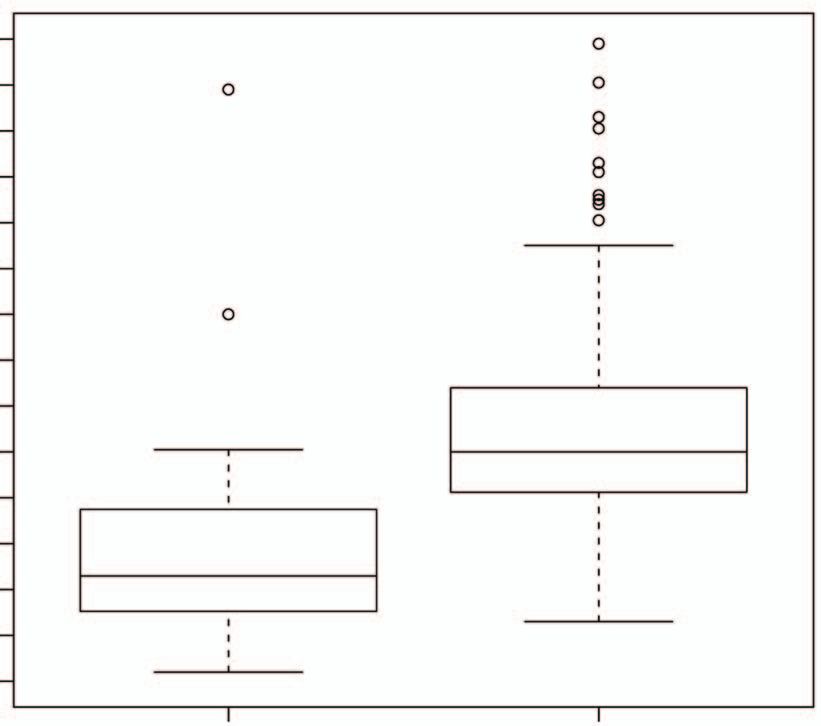
Journal of the American Planning Association, Spring , Vol. , No.
Percentage of
Projects
− −
Inaccuracy (%) for rail projects
Percentage of
Projects
− −
Inaccuracy (%) for road projects
Figure . Inaccuracies of traffic forecasts in transportation infrastructure projects, -, split into rail and road projects.Flyvbjerg: How (In)accurate Are Demand Forecasts in Public Works Projects?
Inaccuracy (%)
−
−
Rail projects (passengers) Road projects (vehicles)
Figure . Inaccuracies of traffic forecasts in transportation infrastructure projects, -.
Rail projects Road projects
Average inaccuracy (%) −. (sd=.) [−. (sd=.)] . (sd=.)
Percentage of projects with inaccuracies larger than ±% []
Percentage of projects with inaccuracies larger than ±% []
Percentage of projects with inaccuracies larger than ±% []
Note: Figures in brackets include two statistical outliers.
Table . Inaccuracy in forecasts of rail passenger and road vehicle traffic for transportation infrastructure projects, -. Journal of the American Planning Association, Spring , Vol. , No.
stages (Mierzejewski, ; Zhao & Kockelman, ). traffic has been consistently overestimated during the
The data presented above provide the empirical basis on -year period studied. The U.S. Federal Transit Admin-
which planners may establish risk assessment and manage- istration (FTA) has a study underway indicating that rail
ment, and below we propose methods and procedures for passenger forecasts may have become more accurate re-
doing so. cently (Ryan, ). According to an oral presentation of
the study at the annual Transportation Research Board
meeting in , of new rail projects, % achieved
actual patronage less than % of forecast patronage. This
Have Forecasts Become More Accurate is a percentage point improvement over the rail projects
Over Time? in our sample, where % of rail projects achieved actual
patronage less than % of that forecasted (see above). It is
Figures and show how forecast inaccuracy varies over also an improvement over the situation Pickrell () de-
time for the projects in the sample for which inaccuracy picted. It is unclear, however, whether this reported
could be coupled with information about year of decision improvement is statistically significant, and despite the
to build and/or year of project completion. Statistical tests improvement, the same pattern of overestimation contin-
show there is no indication that traffic forecasts have become ues. Ryan’s () preliminary conclusion thus dovetails
more accurate over time, despite claims to the contrary with ours: “Risk of large errors still remains” (slide ). A
(American Public Transit Association, , pp. , ). For report from the FTA study is underway.
road projects (Figure ), forecasts even appear to become For road projects, inaccuracies are larger towards the
more inaccurate toward the end of the -year period end of the period, with highly underestimated traffic.
studied. Statistical analyses corroborate this impression. However, there is a difference between Danish and other
For rail projects (Figure ), forecast inaccuracy is inde- road projects. For Danish road projects, we find at a very
pendent of both year of project commencement and year high level of statistical significance that inaccuracy varies
of project conclusion. This is the case whether the two with time (pFlyvbjerg: How (In)accurate Are Demand Forecasts in Public Works Projects?
Inaccuracy (%) Inaccuracy (%)
Denmark Denmark
Other EU Other EU
− −
Year of commencement Year of conclusion
Figure . Inaccuracy over time in forecasts of vehicle traffic in road projects (N=).
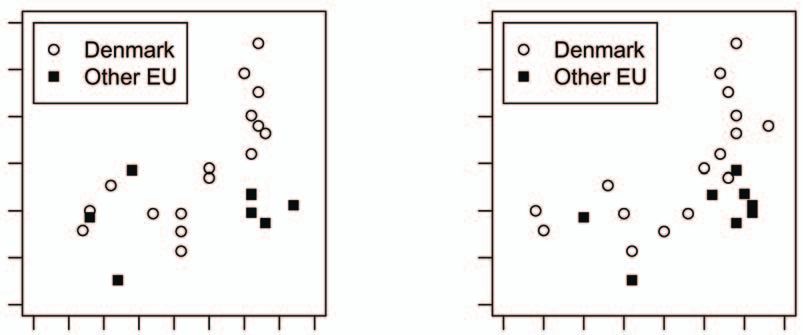
of the s to the second half of the s, inaccuracy of sis of data from the past. The so-called energy crises of
Danish road traffic forecasts increased fold, from to and and associated increases in petrol prices plus de-
% (see Figure ). creases in real wages had a profound, if short-lived, effect
The Danish experience with increasing inaccuracy on road traffic in Denmark, with traffic declining for the
in road traffic forecasts is best explained by what Ascher first time in decades. Danish traffic forecasters adjusted and
() calls “assumption drag” (pp. , –), that is, calibrated their models accordingly, on the assumption
the continued use of assumptions after their validity has that they were witnessing an enduring trend. The assump-
been contradicted by the data. More specifically, traffic tion was mistaken. When during the s the effects of
forecasters typically calibrate forecasting models on the ba- the two oil crises and related policy measures tapered off,
Inaccuracy (%) Inaccuracy (%)
− −
Year of commencement Year of conclusion
Figure . Inaccuracy over time in forecasts of vehicle traffic for Danish road projects (N=). Journal of the American Planning Association, Spring , Vol. , No.
traffic boomed again, rendering forecasts made on s passenger forecasts are not significantly dependent on esti-
assumptions inaccurate. mated number of passengers, neither directly (p=.) nor
We conclude that accuracy in traffic forecasting has taking logarithms (p=.).
not improved over time. Rail passenger forecasts are as For road projects, based on cases, inaccuracies in
inaccurate—that is, inflated—today as they were years vehicle forecast are not significantly dependent on costs,
ago. Road vehicle forecasts even appear to have become neither directly (p=.) nor logarithmically (p =.).
more inaccurate over time, with large underestimations to- Based on cases, inaccuracies in vehicle forecast are sig-
wards the end of the -year period studied. If techniques nificantly dependent on estimated number of vehicles,
and skills for arriving at accurate traffic forecasts have im- both directly (p=.) and even stronger taking loga-
proved over time, our data do not show it. This suggests rithms (pFlyvbjerg: How (In)accurate Are Demand Forecasts in Public Works Projects?
In order to arrive at a more systematic analysis of Figure shows the stated causes for inaccuracies in
causes of inaccuracies in traffic forecasts, we identified such traffic forecasts for rail and road, respectively. For each
causes for transportation infrastructure projects. For a transportation mode and stated cause, a column shows the
number of projects we were able to identify causes of inac- percentage of projects for which this cause was stated as a
curacies but not the numerical size of inaccuracies. This reason for inaccuracy.
explains why we have more projects () in this part of Again the results are very different for rail and road.
our analysis than in the previous part (). Causes of in- For rail projects, the two most important stated causes
accuracies are stated causes that explain differences between are “uncertainty about trip distribution” and “deliberately
actual and forecasted traffic for the first year of operations slanted forecasts.” Trip distribution in rail passenger mod-
or the opening year. For the projects on which we collected els, while ideally based on cross-sectional data collected
data, project managers were asked to account for the factors from users of transportation systems, is often adapted to
that would explain why actual traffic was different from fit national or urban policies aimed at boosting rail traffic.
forecasted traffic. For the other projects the stated causes Here, too, it is difficult for forecasters and planners to gain
are a mixture of this type of statement by managers sup- acceptance for realistic forecasts that run counter to idealis-
plemented by statements by researchers about what caused tic policies. But such policies frequently fail, and the result
such differences. For these projects, the data do not allow an is the type of overestimated passenger forecast that we have
exact distinction between manager statements and researcher documented above as typical for rail passenger forecasting
statements, though such a distinction would be desirable. (Flyvbjerg, Bruzelius, et al., , ch. ). As regards delib-
A problem with using stated causes is that what people erately slanted forecasts, such forecasts are produced by rail
say they do is often significantly different from what they promoters in order to increase the likelihood that rail proj-
actually do. Identifying revealed causes for inaccuracy in ects get built (Wachs, ). Such forecasts exaggerate pas-
traffic forecasting is therefore an important area for further senger traffic and thus revenues. Elsewhere we have shown
research. For the time being, we have to make do with that the large overestimation of traffic and revenues docu-
stated causes. mented above for rail goes hand-in-hand with an equally
Percentage of projects
Rail Road
gen Trip
n
pm e
ent
dis Trip
on
ing
del
ted ately
st
liab y/
y
cha n
nge
ide Not
fied
her
s
ilit
tio
sig
eca
dev nd u
a
uti
mo
vic g del
ast
Ot
nti
De
era
slan liber
for
trib
rec
La
elo
e re
n
Fo
De
eni
Op
ser
Figure . Stated causes of inaccuracies in traffic forecasts (N= rail projects and road projects). Journal of the American Planning Association, Spring , Vol. , No.
large underestimation of costs (Flyvbjerg, Holm, et al., management as something planners could and should do to
, ). The result is cost-benefit analyses of rail proj- improve planning and decision making for transportation
ects that are inflated, with benefit-cost ratios that are useful infrastructure projects. Today, the benefit risks generated
for getting projects accepted and built. by inaccurate travel demand forecasts are widely ignored or
For road projects, the two most often stated causes for underestimated in planning, just as cost risks are neglected
inaccurate traffic forecasts are uncertainties about “trip gen- (Flyvbjerg, Holm, et al., ).
eration” and “land-use development.” Trip generation is When contemplating what planners can do to reduce
based on traffic counts and demographic and geographic inaccuracy, bias, and risk in forecasting, we need to distin-
data. Such data are often dated and incomplete, and fore- guish between two fundamentally different situations: ()
casters quote this as a main source of uncertainty in road Planners consider it important to get forecasts right, and
traffic forecasting. Forecasts of land use development are () planners do not consider it important to get forecasts
based on land use plans. The land use actually implemented right, because optimistic forecasts are seen as a means to
is often quite different from what was planned, however. getting projects started. We consider the first situation in
This, again, is a source of uncertainty in forecasting. this section and the second in the following one.
The different patterns in stated causes for rail and If planners genuinely consider it important to get fore-
road, respectively, fit well with the figures for actual fore- casts right, we recommend they use a new forecasting meth-
cast inaccuracies documented above. Rail forecasts are sys- od called “reference class forecasting” to reduce inaccuracy
tematically and significantly overestimated to a degree that and bias. This method was originally developed to compen-
indicates intent and not error on the part of rail forecasters sate for the type of cognitive bias in human forecasting that
and promoters. The stated causes, with “deliberately slant- Princeton psychologist Daniel Kahneman found in his
ed forecasts” as the second to largest category, corroborate Nobel prize-winning work on bias in economic forecasting
this interpretation, which corresponds with findings by (Kahneman, ; Kahneman & Tversky, ). Reference
Wachs (); Flyvbjerg, Holm, and Buhl (); and the class forecasting has proven more accurate than convention-
U.K. Department for Transport (, pp. –). Road al forecasting. For reasons of space, we present here only an
forecasts are also often inaccurate, but they are substan- outline of the method, based mainly on Lovallo and Kahne-
tially more balanced than rail forecasts, which indicates a man () and Flyvbjerg (). In a different context we
higher degree of fair play in road traffic forecasting. This are currently developing what is, to our knowledge, the first
interpretation is corroborated by the fact that deliberately instance of practical reference class forecasting in planning
slanted forecasts are not quoted as a main cause of inac- (U.K. Department for Transport, ).
curacy for road traffic forecasts, where they are replaced Reference class forecasting consists in taking a so-called
by more technical factors like trip generation and land use “outside view” on the particular project being forecast. The
development. This is not to say that road traffic forecasts outside view is established on the basis of information from
are never politically manipulated. It is to say, however, that a class of similar projects. The outside view does not try to
this appears to happen less often and less systematically for forecast the specific uncertain events that will affect the
road than for rail projects. It is also not to say that road particular project, but instead places the project in a statis-
projects generally have a stronger justification than rail tical distribution of outcomes from this class of reference
projects—just that they have less biased forecasts. projects. Reference class forecasting requires the following
three steps for the individual project:
What Planners Can Do to Reduce . Identifying a relevant reference class of past proj-
Inaccuracy, Bias, and Risk in ects. The class must be broad enough to be statis-
tically meaningful but narrow enough to be truly
Forecasting
comparable with the specific project.
The results presented above show that it is highly risky . Establishing a probability distribution for the
to rely on travel demand forecasts to plan and implement selected reference class. This requires access to
large transportation infrastructure investments. Rail pas- credible, empirical data for a sufficient number of
senger forecasts are overestimated in out of cases, with projects within the reference class to make statis-
an average overestimation above %. Half of all road tically meaningful conclusions.
traffic forecasts are wrong by more than ±%. Forecasts . Comparing the specific project with the reference
have not become more accurate over the past years. This class distribution in order to establish the most
state of affairs points directly to better risk assessment and likely outcome for the specific project.Flyvbjerg: How (In)accurate Are Demand Forecasts in Public Works Projects?
Daniel Kahneman relates the following story about influence the project’s future course. Instead, it examined
curriculum planning to illustrate reference class forecasting the experiences of a class of similar projects, laid out a
in practice (Lovallo & Kahneman, , p. ). We use rough distribution of outcomes for this reference class, and
this example because similar examples do not exist yet in then positioned the current project in that distribution.
the field of city planning. Some years ago, Kahneman was The resulting forecast, as it turned out, was much more
involved in a project to develop a curriculum for a new sub- accurate.
ject area for high schools in Israel. The project was carried Similarly—to take an example from city planning—
out by a team of academics and teachers. In time, the team planners in a city preparing to build a new subway would
began to discuss how long the project would take to com- first establish a reference class of comparable projects. This
plete. Everyone on the team was asked to write on a slip of could be the urban rail projects included in the sample for
paper the number of months needed to finish and report this article. Through analyses the planners would establish
the project. The estimates ranged from to months. that the projects included in the reference class were indeed
One of the team members—a distinguished expert in comparable. Second, if the planners were concerned about
curriculum development—was then posed a challenge by getting patronage forecasts right, they would then establish
another team member to recall as many projects similar to the distribution of outcomes for the reference class regard-
theirs as possible and to think of these projects in a stage ing the accuracy of patronage forecasts. This distribution
comparable to their own. “How long did it take them at would look something like the rail part of Figure . Third,
that point to reach completion?” the expert was asked. After the planners would compare their subway project to the
a while he answered, with some discomfort, that not all the reference class distribution. This would make it clear to
comparable teams he could think of ever did complete their the planners that unless they had reason to believe they are
task. About % of them eventually gave up. Of those re- substantially better forecasters and planners than their col-
maining, the expert could not think of any that completed leagues who did the forecasts and planning for projects in
their task in less than years, nor of any that took more the reference class, they are likely to grossly overestimate
than . The expert was then asked if he had reason to be- patronage. Finally, planners may then use this knowledge
lieve that the present team was more skilled in curriculum to adjust their forecasts for more realism.
development than the earlier ones had been. The expert said The contrast between inside and outside views has
no, he did not see any relevant factor that distinguished been confirmed by systematic research (Gilovich et al.,
this team favorably from the teams he had been thinking ). The research shows that when people are asked sim-
about. His impression was that the present team was slightly ple questions requiring them to take an outside view, their
below average in terms of resources and potential. The wise forecasts become significantly more accurate. However,
decision at this point would probably have been for the most individuals and organizations are inclined to adopt
team to break up, according to Kahneman. Instead, the the inside view in planning major initiatives. This is the
members ignored the pessimistic information and pro- conventional and intuitive approach. The traditional way
ceeded with the project. They finally completed it years to think about a complex project is to focus on the project
later, and their efforts were largely wasted—the resulting itself and its details, to bring to bear what one knows about
curriculum was rarely used. it, paying special attention to its unique or unusual features,
In this example, the curriculum expert made two trying to predict the events that will influence its future.
forecasts for the same problem and arrived at very different The thought of going out and gathering simple statistics
answers. The first forecast was the inside view; the second about related cases seldom enters a planner’s mind. This is
was the outside view, or reference class forecast. The inside the case in general, according to Lovallo and Kahneman
view is the one that the expert and the other team mem- (, pp. –). And it is certainly the case for travel
bers adopted. They made forecasts by focusing tightly on demand forecasting. Despite the many forecasts we have
the case at hand, considering its objective, the resources reviewed, we have not come across a single genuine refer-
they brought to it, and the obstacles to its completion. ence class forecast of travel demand. If our readers have
They constructed in their minds scenarios of their coming information about such forecasts, we would appreciate
progress and extrapolated current trends into the future. their feedback for our ongoing work on this issue.
The resulting forecasts, even the most conservative ones, Planners’ preference for the inside view over the out-
were overly optimistic. The outside view is the one pro- side view, while understandable, is unfortunate. When
voked by the question to the curriculum expert. It com- both forecasting methods are applied with equal skill, the
pletely ignored the details of the project at hand, and it outside view is much more likely to produce a realistic
involved no attempt at forecasting the events that would estimate. That is because it bypasses cognitive and organ- Journal of the American Planning Association, Spring , Vol. , No.
izational biases such as appraisal optimism and strategic However, the literature is replete with things planners
misrepresentation and cuts directly to outcomes. In the and planning “must” strive to do, but which they don’t.
outside view, planners and forecasters are not required to Planning must be open and communicative, but often it is
make scenarios, imagine events, or gauge their own and closed. Planning must be participatory and democratic, but
others’ levels of ability and control, so they cannot get any often it is an instrument of domination and control. Plan-
of these things wrong. Surely the outside view, being based ning must be about rationality, but often it is about power
on historical precedent, may fail to predict extreme out- (Flyvbjerg, ; Watson, ). This is the “dark side” of
comes, that is, those that lie outside all historical prece- planning and planners identified by Flyvbjerg () and
dents. But for most projects, the outside view will produce Yiftachel (), which is remarkably underexplored by
more accurate results. In contrast, a focus on inside details planning researchers and theorists.
is the road to inaccuracy. Forecasting, too, has its dark side. It is here that “plan-
The comparative advantage of the outside view is most ners lie with numbers,” as Wachs () has aptly put it.
pronounced for nonroutine projects, understood as proj- Planners on the dark side are busy not with getting fore-
ects that planners and decision makers in a certain locale casts right and following the AICP Code of Ethics but with
have never attempted before—like building an urban rail getting projects funded and built. And accurate forecasts
system in a city for the first time, or a new major bridge or are often not an effective means for achieving this objec-
tunnel where none existed before. It is in the planning of tive. Indeed, accurate forecasts may be counterproductive,
such new efforts that the biases toward optimism and stra- whereas biased forecasts may be effective in competing for
tegic misrepresentation are likely to be largest. To be sure, funds and securing the go-ahead for construction. “The
choosing the right reference class of comparative past proj- most effective planner,” says Wachs (), “is sometimes
ects becomes more difficult when planners are forecasting the one who can cloak advocacy in the guise of scientific or
initiatives for which precedents are not easily found, such technical rationality” (p. ). Such advocacy would stand
as the introduction of new and unfamiliar technologies. in direct opposition to AICP’s ruling that “the planner’s
However, most large-scale transportation projects are both primary obligation [is] to the public interest” (American
nonroutine locally and use well-known technologies. Such Planning Association, , B.). Nevertheless, seemingly
projects are, therefore, particularly likely to benefit from rational forecasts that underestimate costs and overestimate
the outside view and reference class forecasting. The same benefits have long been an established formula for project
holds for concert halls, museums, stadiums, exhibition approval (Flyvbjerg, Bruzelius, et al., ). Forecasting is
centers, and other local one-off projects. here mainly another kind of rent-seeking behavior, result-
ing in a make-believe world of misrepresentation that
makes it extremely difficult to decide which projects de-
When Planners Are Part of the serve undertaking and which do not. The consequence, as
even one of the industry’s own organs, the Oxford-based
Problem, Not the Solution
Major Projects Association, acknowledges, is that too many
In the present section, we consider the situation where projects proceed that should not. We would like to add
planners and other influential actors do not find it impor- that many projects don’t proceed that probably should,
tant to get forecasts right and where planners, therefore, do had they not lost out to projects with “better” misrepre-
not help to clarify and mitigate risk but instead generate sentation (Flyvbjerg, Holm, et al., ).
and exacerbate it. Here planners are part of the problem, In this situation, the question is not so much what
not the solution. This situation may need some explica- planners can do to reduce inaccuracy and risk in forecast-
tion, because it might sound to many like an unlikely state ing, but what others can do to impose on planners the
of affairs. After all, it may be agreed that planners ought to checks and balances that would give planners the incentive
be interested in being accurate and unbiased in forecasting. to stop producing biased forecasts and begin to work ac-
It is even stated as an explicit requirement in the AICP cording to their Code of Ethics. The challenge is to change
Code of Ethics and Professional Conduct that “A planner the power relations that govern forecasting and project
must strive to provide full, clear and accurate information development. Better forecasting techniques and appeals to
on planning issues to citizens and governmental decision- ethics won’t do here; institutional change with a focus on
makers” (American Planning Association, , A.), and transparency and accountability is necessary.
we certainly agree with the Code. The British Royal Town Two basic types of accountability define liberal democ-
Planning Institute () has laid down similar obligations racies: () public sector accountability through transparency
for its members. and public control, and () private sector accountability viaFlyvbjerg: How (In)accurate Are Demand Forecasts in Public Works Projects?
competition and market control. Both types of accountabil- casts. An example of a professional penalty would be
ity may be effective tools to curb planners’ misrepresenta- the exclusion from one’s professional organization for
tion in forecasting and to promote a culture that acknowl- violating its code of ethics. An example of a criminal
edges and deals effectively with risk. In order to achieve penalty would be punishment as the result of prosecu-
accountability through transparency and public control, the tion before a court or similar legal body, for instance
following would be required as practices embedded in the where deceptive forecasts have led to substantial mis-
relevant institutions: management of public funds (Garett & Wachs, ).
Malpractice in planning should be taken as seriously as
• National-level government should not offer discre- it is in other professions. Failure to do this amounts to
tionary grants to local infrastructure agencies for the not taking the profession of planning seriously.
sole purpose of building a specific type of infrastruc-
ture, for instance rail. Such grants create perverse in- In order to achieve accountability in forecasting via
centives. Instead, national government should simply competition and market control, the following would be
offer “infrastructure grants” or “transportation grants” required, again as practices that are both embedded in and
to local governments and let local political officials enforced by the relevant institutions:
spend the funds however they choose, but ensure that
every dollar they spend on one type of infrastructure • The decision to go ahead with a project should, where
reduces their ability to fund another. at all possible, be made contingent on the willingness
• Forecasts should be made subject to independent peer of private financiers to participate without a sovereign
review. Where large amounts of taxpayers’ money are guarantee for at least one third of the total capital
at stake, such review may be carried out by national or needs. This should be required whether projects pass
state accounting and auditing offices, like the General the market test or not; that is, whether projects are
Accounting Office in the U.S. or the National Audit subsidized or not or provided for reasons of social
Office in the U.K., who have the independence and justice or not. Private lenders, shareholders, and stock
expertise to produce such reviews. Other types of inde- market analysts would produce their own forecasts or
pendent review bodies may be established, for instance would critically monitor existing ones. If they were
within national departments of finance or with rele- wrong about the forecasts, they and their organizations
vant professional bodies. would be hurt. The result would be more realistic fore-
• Forecasts should be benchmarked against comparable casts and reduced risk.
forecasts, for instance using reference class forecasting • Full public financing or full financing with a sovereign
as described in the previous section. guarantee should be avoided.
• Forecasts, peer reviews, and benchmarkings should be • Forecasters and their organizations must share finan-
made available to the public as they are produced, in- cial responsibility for covering benefit shortfalls (and
cluding all relevant documentation. cost overruns) resulting from misrepresentation and
• Public hearings, citizen juries, and the like should be bias in forecasting.
organized to allow stakeholders and civil society to • The participation of risk capital should not mean that
voice criticism and support of forecasts. Knowledge government gives up or reduces control of the project.
generated in this way should be integrated in planning On the contrary, it means that government can more
and decision making. effectively play the role it should be playing, namely as
• Scientific and professional conferences should be the ordinary citizen’s guarantor of safety, environmen-
organized where forecasters would present and defend tal quality, risk management, and a proper use of
their forecasts in the face of colleagues’ scrutiny and public funds.
criticism.
• Projects with inflated benefit-cost ratios should be If the institutions with responsibility for developing
reconsidered and stopped if recalculated costs and and building major transportation infrastructure projects
benefits do not warrant implementation. Projects with would effectively implement, embed, and enforce such
realistic estimates of benefits and costs should be measures of accountability, then the misrepresentation
rewarded. in transportation forecasting, which is widespread today,
• Professional and occasionally even criminal penalties might be mitigated. If this is not done, misrepresentation is
should be enforced for planners and forecasters who likely to continue, and the allocation of funds for transpor-
consistently and foreseeably produce deceptive fore- tation investments is likely to be wasteful. Journal of the American Planning Association, Spring , Vol. , No.
Conclusions Failing to do so amounts to not taking the profession of
planning seriously.
We conclude that the patronage estimates used by
planners of rail infrastructure development are highly, sys- Acknowledgments
tematically, and significantly misleading (inflated). This The authors wish to thank Daniel Kahneman, Dan Lovallo, Don Pick-
results in large benefit shortfalls for rail projects. For road rell, James Ryan, Martin Wachs, the JAPA editors, and four anonymous
projects the problem of misleading forecasts is less severe referees for their valuable help. Research for the article was supported by
and less one sided than for rail. But even for roads, for half the Danish Transportation Council and Aalborg University, Denmark.
the projects the difference between actual and forecasted
traffic is more than ±%. On this background, planners Notes
and decision makers are well advised to take with a grain of . All projects that we know of for which comparable data on forecasted
salt any traffic forecast that does not explicitly take into ac- and actual traffic were obtainable were considered for inclusion in the
count the uncertainty of predicting future traffic. For rail sample. This was projects, of which were then rejected because
of unclear or insufficient data quality. More specifically, of the proj-
passenger forecasts, a grain of salt may not be enough.
ects rejected, were rejected because inaccuracy had been estimated in
The risks generated from misleading forecasts are typi- ways different from and incomparable to the way we decided to estimate
cally ignored or downplayed in infrastructure planning, to inaccuracy; projects were rejected because inaccuracies for these proj-
the detriment of social and economic welfare. Risks, there- ects had been estimated on the basis of adjusted data for actual traffic
fore, have a doubly negative effect in this particular type of instead of using original, actual count data as we decided to do. All
planning, since it is one thing to take on a risk that one has projects for which valid and reliable data were available were included in
the sample. This covers both projects for which we ourselves collected
calculated and is prepared to take, much as insurance com- the data, and projects for which other researchers in other studies did
panies and professional investors do, while it is quite an- the data collection. Our own data collection concentrated on large
other matter—one that moves risk-taking to a different European projects, because too few data existed for this type of project
and more problematic level—to ignore risks altogether. to allow comparative studies. We collected primary data on the accuracy
This is especially the case when risks are of the magnitude of traffic forecasts for projects in Denmark, France, Germany, Swed-
en, and the U.K. and were thus able to increase by many times the
we have documented here, with many demand forecasts
number of large European projects with reliable data for both actual and
being off by more than % on investments that measure estimated traffic, allowing for the first time comparative studies for this
in hundreds of millions of dollars. Such behavior is bound type of project where statistical methods can be applied. Other projects
to produce losers among those financing infrastructure, be were included in the sample from the following studies: Webber ();
they tax payers or private investors. If the losers or, for fu- Hall (); National Audit Office (, ); Fouracre, Allport, and
ture projects, potential losers, want to protect themselves, Thomson (); Pickrell (); Walmsley and Pickett (); Skamris
(); and Vejdirektoratet (). Statistical tests showed no differences
then our study shows that the risk of faulty forecasts, and
between data collected through our own surveys and data collected from
related risk assessment and management, must be placed at the studies carried out by other researchers.
the core of planning and decision making. Our goal with . The figures mentioned here should be interpreted with caution. With-
this article has been to take a first step in this direction by out a published report for the FTA study, it is difficult to evaluate the
developing the necessary data and approach. assumptions behind the study and thus the validity and comparability of
The policy implications of our findings are clear. First, its results. When the study report has been published, such evaluation
should be possible.
the findings show that a major planning and policy prob-
. We find that the estimated quantities are better than the actual
lem—namely misinformation—exists for this highly expen- quantities as a measure for project size in the evaluation of inaccuracy,
sive field of public policy. Second, the size and perseverance because the estimates are what is known about size at the time of deci-
over time of the problem of misinformation indicate that it sion to build (and the time of making the forecasts), and using actual
will not go away by merely pointing out its existence and quantities would result in the mixing of cause and effect.
appealing to the good will of project promoters and plan- . As in the other parts of our analyses, we include here both projects for
which we ourselves collected primary data and projects for which other
ners to make more accurate forecasts. The problem of mis- researchers did the data collection as part of other studies, which we then
information is an issue of power and profit and must be used as secondary sources. Again, our own data collection concentrated
dealt with as such, using the mechanisms of transparency on large European projects, because data were particularly wanting for
and accountability we commonly use in liberal democracies this project type. By means of a survey questionnaire and meetings with
to mitigate rent-seeking behavior and the misuse of power. project managers, we collected primary data on causes of inaccurate
traffic forecasts for projects, while we collected secondary data for
To the extent that planners partake in rent-seeking behavior
projects from the following studies: Webber (), Hall (), Nation-
and misuse of power, this may be seen as a violation of their al Audit Office (), Fouracre et al. (), Pickrell (), Wachs
code of ethics—that is, malpractice. Such malpractice (), Leavitt et al. (), U.K. Department for Transport (),
should be taken seriously by the responsible institutions. Skamris (), and Vejdirektoratet ().Flyvbjerg: How (In)accurate Are Demand Forecasts in Public Works Projects?
. The closest we have come to an outside view on travel demand Gordon, P., & Wilson, R. (). The determinants of light-rail transit
forecasts is Gordon and Wilson’s () use of regression analysis on demand: An international cross-sectional comparison. Transportation
an international cross section of light-rail projects to forecast patronage Research A, A(), –.
in a number of light-rail schemes in North America. Hall, P. (). Great planning disasters. Harmondsworth, UK: Penguin
. The lower limit of a one-third share of private risk capital for such Books.
capital to effectively influence accountability is based on practical expe- Kahneman, D. (). New challenges to the rationality assumption.
rience. See more in Flyvbjerg, Bruzelius, and Rothengatter (, pp. Journal of Institutional and Theoretical Economics, , –.
–). Kahneman, D., & Tversky, A. (). Prospect theory: An analysis of
decisions under risk. Econometrica, , –.
Kain, J. F. (). Deception in Dallas: Strategic misrepresentation in
References rail transit promotion and evaluation. Journal of the American Planning
American Planning Association. (). AICP code of ethics and profes- Association, (), –.
sional conduct (adopted October , amended October ). Retrieved Leavitt, D., Ennis, S., & McGovern, P. (). The cost escalation of rail
November, , from http://www.planning.org/ethics/conduct.html projects: Using previous experience to re-evaluate the CalSpeed estimates
American Public Transit Association. (). Off track: Response of the (Working Paper No. ). Berkeley: University of California, Berkeley,
American Public Transit Association to the UMTA report “Urban rail Institute of Urban and Regional Development.
transit projects: Forecast versus actual ridership and costs.” Washington, Lovallo, D., & Kahneman, D. (, July). Delusions of success: How
DC: Author. optimism undermines executives’ decisions. Harvard Business Review,
Ascher, W. (). Forecasting: An appraisal for policy-makers and plan- –.
ners. Baltimore: Johns Hopkins University Press. Mackinder, I. H., & Evans, S. E. (). The predictive accuracy of Brit-
Brooks, J. A., & Trevelyan, P. J. (). Before and after studies for ish transportation studies in urban areas (Supplementary Report ).
inter-urban road schemes. In Planning and Transport Research and Crowthorne, UK: Transportation and Road Research Laboratory.
Computation Co. Ltd., Highway planning and design: Proceedings of Maldonado, J. (). Strategic planning: An approach to improving airport
seminar N held at the PTRC summer annual meeting, University of planning under uncertainty. Unpublished master’s thesis, Massachusetts
Warwick, England from – July (pp. –). London: PTRC Institute of Technology, Cambridge, MA.
Education and Research Services Ltd. Mierzejewski, E. A. (). A new strategic urban transportation planning
Flyvbjerg, B. (). The dark side of planning: Rationality and Real- process. University of South Florida, Center for Urban Transportation
rationalität. In S. Mandelbaum, L. Mazza, & R. Burchell (Eds.), Explor- Research.
ations in planning theory (pp. –). New Brunswick, NJ: Center for National Audit Office. (). Department of transport: Expenditure on
Urban Policy Research Press. motorways and trunk roads. London: Author.
Flyvbjerg, B. (). Rationality and power: Democracy in practice. National Audit Office. (). Department of Transport, Scottish Devel-
Chicago: University of Chicago Press. opment Department and Welsh Office: Road planning. London: Her
Flyvbjerg, B. (, December). Delusions of success: Comment on Majesty’s Stationary Office.
Dan Lovallo and Daniel Kahneman. Harvard Business Review, –. National Audit Office. (). Department of Transport: Contracting for
Flyvbjerg, B. (). On measuring the inaccuracy of travel forecasts: roads. London: Author.
Methodological considerations. Manuscript submitted for publication. National Audit Office. (). PFI: Construction performance (Report
Flyvbjerg, B., Bruzelius, N., & Rothengatter, W. (). Megaprojects by the Comptroller and Auditor General HC Session –).
and risk: An anatomy of ambition. Cambridge, UK: Cambridge Univer- London: Author.
sity Press. Pickrell, D. H. (). Urban rail transit projects: Forecast versus actual
Flyvbjerg, B., Holm, M. K. S., & Buhl, S. L. (). Cost underesti- ridership and cost. Washington, DC: U.S. Department of Transportation.
mation in public works projects: Error or lie? Journal of the American Richmond, J. E. D. (). New rail transit investments: A review.
Planning Association, (), –. Cambridge, MA: Harvard University, John F. Kennedy School of
Flyvbjerg, B., Holm, M. K. S., & Buhl, S. L. (). How common and Government.
how large are cost overruns in transport infrastructure projects? Transport Royal Town Planning Institute. (). Code of professional conduct.
Reviews, (), –. Retrieved November, , from http://www.rtpi.org.uk/about-the
Flyvbjerg, B., Holm, M. K. S., & Buhl, S. L. (). What causes cost -rtpi/codecond.pdf
overrun in transport infrastructure projects? Transport Reviews, (), –. Ryan, J. (, January ). Predicted and actual ridership for recent new
Fouracre, P. R., Allport, R. J., & Thomson, J. M. (). The per- starts projects (P–). Presentation at the rd Annual TRB Meeting,
formance and impact of rail mass transit in developing countries (TRRL Session , Washington, DC.
Research Report ). Crowthorne, UK: Transportation and Road Skamris, M. K. (). Large transportation projects: Forecast versus actual
Research Laboratory. traffic and costs (Report No. ). Aalborg: Aalborg University, Depart-
Fullerton, B., & Openshaw, S. (). An evaluation of the Tyneside ment of Development and Planning.
Metro. In K. J. Button & D. E. Pitfield (Eds.), International railway Thompson, L. S. (, March–April). Trapped in the forecasts: An
economics: Studies in management and efficiency (pp. –). Aldershot, economic field of dreams. TR News, .
UK: Gower. U.K. Department for Transport. (). Comparison of forecast and
Garett, M., & Wachs, M. (). Transportation planning on trial: The observed traffic on trunk road schemes. London: Author.
Clean Air Act and travel forecasting. Thousand Oaks, CA: Sage. U.K. Department for Transport. (). Procedures for dealing with
Gilovich, T., Griffin, D., & Kahneman, D. (Eds.). (). Heuristics optimism bias in transport planning: Guidance document. London:
and biases: The psychology of intuitive judgment. Cambridge, UK: Cam- Author. Available at http://www.dft.gov.uk/stellent/groups/dft
bridge University Press. _localtrans/documents/page/dft_localtrans_.hcspYou can also read