Assessing the impact of outreach strategies in cities coping with climate risks - geosci-commun.net
←
→
Page content transcription
If your browser does not render page correctly, please read the page content below
Research article
Geosci. Commun., 2, 25–38, 2019
https://doi.org/10.5194/gc-2-25-2019
© Author(s) 2019. This work is distributed under
the Creative Commons Attribution 4.0 License.

Assessing the impact of outreach strategies in cities
coping with climate risks
Rosa Vicari, Ioulia Tchiguirinskaia, and Daniel Schertzer
Laboratory HM&Co, U. Paris Est/École des Ponts ParisTech, Champs-sur-Marne, 77455, France

Correspondence: Rosa Vicari (rosa.vicari@enpc.fr)

Received: 10 May 2018 – Discussion started: 18 May 2018
Revised: 22 November 2018 – Accepted: 10 December 2018 – Published: 21 January 2019

Abstract. The resilience of our cities to weather extremes      urban systems to be comprehended. The early engineering
relies both on physical environmental factors and on socio-     interpretation of resilience was concerned with the capacity
economic factors. The latter includes communication pro-        of a stable system to absorb stress and to continue to main-
cesses among the members of an urban community. This            tain its function. The “social–ecological resilience” approach
paper presents a study that aims at appraising how public       departed from the mainstream interpretation of resilience
outreach campaigns influence urban resilience. According to     by pointing at renewal, re-organisation, innovation, develop-
this research, seizing the added value of science outreach      ment and adaptation as important capacities of a resilient sys-
efforts calls for an assessment method that takes into con-     tem (Gunderson and Holling, 2002; Carpenter, 2003; Walker
sideration the interactions between communication processes     and Meyers, 2004; Bellwood et al., 2004; Berkes et al., 2003;
and other urban resilience drivers. The paper begins by pre-    Adger, 2006; Folke, 2006; Folke et al., 2010). This approach
senting examples of methods to assess urban resilience to       presupposes the use of resilience metrics as an empirical ba-
weather extremes. We then propose an approach to compre-        sis to translate the concept of social–ecological resilience
hend the impact of communication activities on resilience       into practice (e.g. Carpenter et al., 2001). Once different ur-
in the context of urban flood resilience strategies. We use     ban components and functions are identified as “resilience
five guiding criteria to define “resilience communication in-   drivers”, specific variables are chosen to measure the impact
dicators” and we present two communication assessment ex-       of each of them on urban resilience.
periments based on these criteria. These experiments were          In this study, we propose to explore how urban resilience
undertaken to assess communication activities addressed to      assessment can take into account the interactions between
non-specialist audiences and tailored for a flood resilience    science outreach and other resilience drivers. With this gen-
project in the Paris region. Different research methods were    eral scope, we examine the following:
tested through these experiments, with the goal of compre-
hending their strengths and weaknesses in the framework of        i. the variables that are available in the context of a flood
urban resilience strategies.                                         resilience project (RainGain) and that can be adopted
                                                                     as indicators of the impact of communication on urban
                                                                     resilience to climate risks;
                                                                 ii. the strengths and weaknesses of different methods that
1   Introduction
                                                                     can be employed to monitor these indicators.
Cities are complex systems, with multiple functions and in-     After outlining the concept of social–ecological resilience
teracting components, where climate pressures contribute to     and discussing the worth of resilience metrics in Sect. 2,
their complexity (Ruth and Coelho, 2007). In this paper,        we give an overview of different assessment frameworks that
we refer to the social–ecological resilience as a theoretical   consider communication impact in Sect. 3. We propose to de-
frame, since it allows the complex interactions among so-       fine indicators that can measure the impact of communication
cial, economic, physical and environmental components of        on urban resilience and are tailored to the operational con-

Published by Copernicus Publications on behalf of the European Geosciences Union.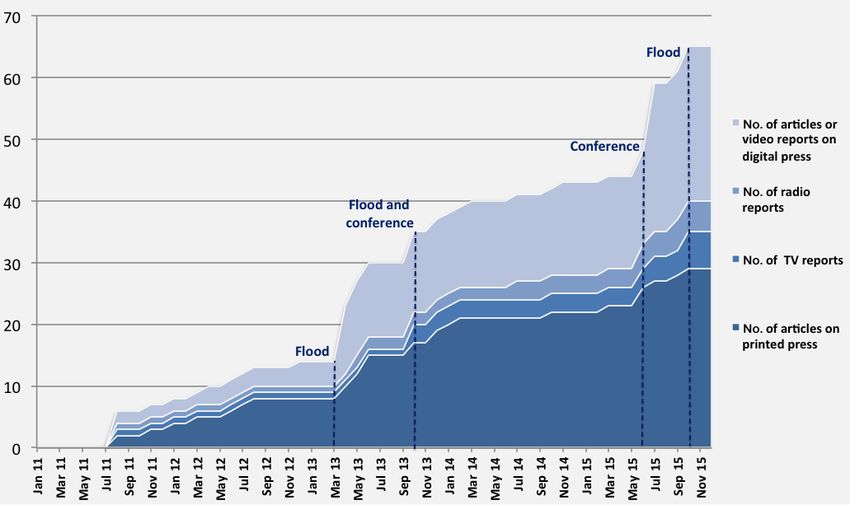
26                               R. Vicari et al.: Assessing the impact of outreach strategies in cities coping with climate risks

text of climate-resilient strategies involving science outreach          age citizen participation and share responsibilities with them
efforts. Some examples of flood resilience strategies imple-             (Tanguy, 2015). In Sect. 4, we discuss some cases of recent
mented in the Paris region are recalled in Sect. 4 and used              resilience strategies implemented in the Paris region that en-
as a basis to outline guiding criteria for selection of relevant         tail public engagement activities. These examples illustrate
communication indicators that we define as “resilience com-              how public outreach and citizens’ perceptions are gaining
munication indicators” (RCIs). These indicators are based on             importance, as a consequence of the implementation of the
quantitative variables since numerical data allow the corre-             subsidiarity principle.
lations between communication and other resilience drivers                  Going beyond theory and implementing resilience requires
to be explored. In Sect. 5 we present three experiments un-              resilience metrics: relevant indexes allow decision-makers to
dertaken in the framework of the European project Interreg               compare the costs of resilience enhancement actions with the
NWE IVB1 RainGain to test different assessment methods:                  economic, environmental, social and sanitary costs of non-
the media monitoring, a questionnaire and interviews.                    action. Resilience metrics also help to set up clear objectives
                                                                         at the beginning of a project, to evaluate and improve man-
                                                                         agement capacities, and to increase transparency and stake-
2    Social–ecological resilience, from theory to
                                                                         holders’ involvement during and after a project. According
     implementation
                                                                         to Carpenter et al. (2001), resilience metrics allow testing
                                                                         hypotheses on the dynamics of systems and enable cross-
According to the social–ecological resilience perspective,
                                                                         system comparisons.
“resilience” can be defined as the “the capacity of a system to
                                                                            A first necessary step to design resilience metrics is to
absorb disturbance and reorganise while undergoing change
                                                                         identify the disturbance and the system we are interested
so as to still retain essentially the same function, structure,
                                                                         in. Even though the interplay with other scales and other
identity, and feedbacks” (Walker et al., 2004, p. 2). “Trans-
                                                                         shocks or stresses should not be ignored, answering the ques-
formability” and “adaptability” (Folke et al., 2010) are con-
                                                                         tion “resilience of what, to what?” (Carpenter et al., 2001)
sidered essential characteristics of a resilient system. This ap-
                                                                         is an essential basis to establish resilience indicators. The
proach puts the accent on uncertainty, non-linear dynamics,
                                                                         same relevant variables can be then compared in different
and the interplay between gradual change and rapid change
                                                                         systems (e.g. different cities) or in the same system at dif-
(Walker and Meyers, 2004). The trajectory followed by a sys-
                                                                         ferent moments. In this paper, the focus is on cities facing
tem after a perturbation cannot be described as reaching “sta-
                                                                         climate risks: in the next sections we present examples of re-
ble states” or “equilibria”, but rather with the concepts of
                                                                         silience assessment frameworks that are adequate to urban
“regimes” or “attractors” (Carpenter, 2003).
                                                                         areas coping with extreme weather (Sect. 3); we then dis-
   These dynamics involve interactions across different time
                                                                         cuss the role of communication in flood resilience strategies
and space scales (Schertzer and Lovejoy, 2004; Tchiguirin-
                                                                         implemented in the Paris region and we outline guidelines
skaia et al., 2014), as well as throughout different socio-
                                                                         to define what we call RCIs for cities facing climate risks
economic and physical environmental dimensions of a sys-
                                                                         (Sect. 4); we finally compare different communication as-
tem (Kirch, 2005; Millennium Ecosystem Assessment (MA),
                                                                         sessment techniques that have been tested in the framework
2005). This multi-dimensional perspective is particularly
                                                                         of RainGain, a European research project on urban flood re-
suited to studying the complexity of urban systems and the
                                                                         silience (Sect. 5).
influence of communication processes on resilience. Cities
                                                                            The resilience assessment approaches presented in the
have multiple components and functions, including the com-
                                                                         next section are quite heterogeneous in terms of the concept
munication factors that can be defined as part of the social
                                                                         of resilience they refer to, the system and disturbances they
dimension and that obviously have interdependencies with
                                                                         consider, the selection of indicators and variables, and the
the economic, physical and environmental dimensions.
                                                                         degree of the on-site implementation. All these techniques
   By the 2000s, increasing attention among academics, as
                                                                         propose a number of indicators to monitor social factors that
well as practitioners, has been devoted to the implementa-
                                                                         are related to communication.
tion of resilience. Putting the concept of social–ecological
resilience into practice involves relevant changes in pol-
icy and decision-making. Indeed, the social–ecological re-               3   Communication indicators in the literature on
silience approach emphasises the need to apply the principle                 resilience assessment techniques
of subsidiarity2 , i.e. to decentralise risk management, encour-
                                                                         According to Charrière et al. (2017), impact assessment of
     1 INTERREG IVB North-West Europe “is a financial instrument
                                                                         risk communication is quite a new practice. The emergent
of the European Union’s Cohesion Policy. It funds projects which
support transnational cooperation” (Interreg NWE IVB: http://4b.         where they will have their effect. Hence, central authority should
nweurope.eu/, last access: 20 November 2018).                            have a subsidiary function and cover those decisions and tasks that
    2 Subsidiarity is the principle that decisions should be taken and   cannot be managed at local level (Oxford English Dictionary: https:
tasks should be performed as close as possible to the citizen or to      //en.oxforddictionaries.com/, last access: 20 November 2018).

Geosci. Commun., 2, 25–38, 2019                                                                  www.geosci-commun.net/2/25/2019/
R. Vicari et al.: Assessing the impact of outreach strategies in cities coping with climate risks 27
recognition of the importance of communication can also be gramme)”, “Communication capacity (% Households with
observed in the literature on resilience indicators. This sec- telephone service available)’, “Social capital-disaster volun-
tion presents three examples of resilience assessment frame- teerism (Red Cross training workshop participants per 10 000
works that consider communication processes and infrastruc- people)”. Other important communication infrastructure –
ture, a feature that has recently gained importance among the such as mobile phones, the Internet, TV and radio – as well
available indicators for cities coping with weather extremes as public outreach are not considered.
(for a review, see Vicari, 2018).
3.3 Disaster Resilience Scorecard for Cities
3.1 Resilience Alliance In 2010, the United Nations secretariat of the Interna-
The “Resilience Alliance” (RA) (Resilience Alliance: https: tional Strategy for Disaster Reduction launched the cam-
//www.resalliance.org/, last access: 14 October, 2018; Re- paign “Making Cities Resilient” (Making Cities Resilient:
silience Alliance, 2010; Haider et al., 2012) is an interna- https://www.unisdr.org/campaign/resilientcities/, last access:
tional, multidisciplinary research organisation that has de- 28 September 2018). Following the adoption of the “Sendai
veloped guidelines to assess resilience of social–ecological Framework for Disaster Reduction” (UN/ISDR, 2015)3 , the
systems and to implement sustainable development strate- goals and priorities of the campaign were updated, as well as
gies. RA outlines an assessment framework that is consis- the resilience assessment tool dedicated to cities: the “Dis-
tent with the social–ecological approach. According to this aster Resilience Scorecard for Cities” (DRSC) (UN/ISDR,
method, multiple spatial and temporal interacting scales must 2017). This methodology is aimed at monitoring the im-
be considered to comprehend, for instance, how resilience plementation of the Sendai Framework at local government
at the level of a neighbourhood can affect the resilience of level through “Ten Essentials for Making Cities Resilient”.
a city. Furthermore, for each quantitative variable, a thresh- Two kinds of evaluations are foreseen to monitor the progress
old should be defined. If the threshold is crossed, the effects towards these essentials: a preliminary evaluation that in-
on other social and ecological variables must be identified. cludes 47 qualitative and quantitative indicators with a grad-
Communication is evaluated in terms of “information shar- uated 3-point scale, and a detailed evaluation involving the
ing”, a factor that characterises social relations among stake- participation of stakeholders, which includes 117 indicators
holders. According to the RA method, social relations and with a 0–5 score.
information flows need to be monitored since they affect the Among the three selected assessment frameworks, the
governance system. This specific factor is analysed by com- DRSC is the method that proposes the widest number and
paring different social network structures: e.g. a highly cen- variety of indicators that can be related to communication
tralised network or a network composed of two isolated sub- processes. Examples of indicators are “Use of mobile and e-
groups. The RA approach focuses on institutional relations mail ‘systems of engagement’ to enable citizens to receive
and does not offer any tool to investigate the intensity or qual- and give updates before and after a disaster”, “Extent to
ity of information exchange. which data on the city’s resilience position is shared with
the community organisations and public”, “Consultation in
plan making”, “Accessibility of education and training to all
3.2 The Disaster Resilience Of Place model and the linguistic groups in the city”, and “Communication service
Baseline Indicators for Communities days at risk of loss”. These indicators are monitored in terms
The “DROP” (Disaster Resilience Of Place) model and the of presence/absence of efforts, frequency of activities, audi-
related “BRIC” (Baseline Resilience Indicators for Commu- ence diversity and size (e.g. how many of the listed groups
nities) (Cutter et al., 2008, 2010, 2014) focus on resilience of stakeholders are involved in plan consultation?), and ex-
to natural hazards at community level and on the relation- posure (e.g. how many media channels are used for public
ship between resilience and vulnerability. The model is a relations and education campaigns?).
conceptual basis to identify resilience indicators that can be
used at different spatial scales. It outlines a composite re-
silience index, with sub-indexes corresponding to different
3 The Sendai Framework is a 15-year agreement adopted in
dimensions of the urban system. These indexes are exclu-
sively quantitative variables, and a method is proposed to March 2015 by UN member states to ensure “the substantial
reduction of disaster risk and losses in lives, livelihoods and
normalise different ranges of values to a unique scale. Social
health and in the economic, physical, social, cultural and envi-
factors that are related to communication and are examined ronmental assets of persons, businesses, communities and coun-
by Cutter et al. (2014) concern public engagement, educa- tries” (Sendai Framework: https://www.unisdr.org/we/coordinate/
tion, training and communication infrastructure. Examples sendai-framework, last access: 22 October 2018). The Sendai
of indicators are “English language competency (% Popu- Framework succeeds to the Hyogo Framework for Action (HFA)
lation proficient English speakers)”, “Local disaster train- 2005–2015: Building the Resilience of Nations and Communities
ing (% Population in communities with Citizen Corps pro- to Disasters.
www.geosci-commun.net/2/25/2019/ Geosci. Commun., 2, 25–38, 201928 R. Vicari et al.: Assessing the impact of outreach strategies in cities coping with climate risks
3.4 General remarks on communication evaluation and vides helpful hints for this study. As highlighted by Neresini
next steps and Pellegrini (2008), the evaluation of a communication ac-
tivity presupposes that the communication goal is taken into
The proposed approach draws on the three assessment meth- account. For instance, assessing a communication campaign
ods we have presented in this section. Indeed, as proposed aimed at disseminating knowledge on flood resilience is dif-
by the RA method (Sect. 3.1), we aim to detect possible cor- ferent from assessing a campaign that promotes public en-
relations between social processes (e.g. communication) and gagement in flood resilience strategies. In the specific case
environmental processes. In accordance with the first two ap- of the communication activities examined in Sect. 5, the goal
proaches (Sect. 3.1 and 3.2), we also consider that quantita- was to raise awareness of flood resilience issues and solutions
tive variables are adequate to establish RCIs. In fact, quanti- in the Paris region, as well as to gain the support of the lo-
tative variables facilitate the observation of space–time vari- cal population for the project implementation. Since this re-
ability, as well as the investigation of correlations between search focuses on communication indicators, we assume that
communication processes and other resilience drivers. We communication activities – planned and implemented in the
also consider the frequency of communication activities, the framework of a resilience strategy or project – enhance re-
exposure, the audience size and composition as relevant vari- silience if they contribute to achieving the strategy or project
ables, similarly to what is outlined in the DRSC approach goals.
(Sect. 3.3). As stated by Neresini and Pellegrini (2008), we consider
At the same time, the aim of our study goes beyond a de- that the methodological principles developed in the sphere of
scription of the state of communication processes and infras- social research can be applied to communication evaluation.
tructure in an urban area exposed to risks. We propose a dy- In this paper we refer to the research process and techniques
namic perspective, with the RCIs outlined in the next section adopted in the field of “social impact assessment” (SIA)
and tested in Sect. 5. The RCIs are tailored to appraise how (Inter-organisational Committee on Guidelines and Princi-
specific communication activities contribute to achieving lo- ples for Social Assessment, 1994; Social Analysis at the
cal resilience goals. These indicators require a rich and de- World Bank: http://www.worldbank.org/socialanalysis, last
tailed selection of communication variables that are activity access: 25 September 2018), an approach aimed to monitor
driven; i.e. they allow the detection of resilience changes that and better take into account the effects of social variables
occur even in a brief time, and the causes related to a past or in territorial development. In particular, the experiments pre-
ongoing communication activity. sented in this paper (Sect. 5) are based on three investigation
The audience knowledge and its behavioural change, due techniques that are used in SIA: research based on secondary
to communication activities, have been investigated by re- sources, a questionnaire and interviews. The first two tech-
searchers in the fields of risk communication and of public niques aim to monitor a selection of RCIs, and the last one is
understanding of science. The first series of works explore employed for exploratory research.
the impact of risk communication on the audience percep- As we mention above, it is necessary to keep in mind the
tions and behaviour. Rohrmann (1992) and Lundgren and objective of a communication activity when evaluating it. In
McMakin (2004) discuss the importance of evaluating the the next section, we recall that a communication objective
success of risk communication strategies. Other authors (e.g. also depends on the territorial context where an activity is
Terpstra et al., 2009; Maidl and Buchecker, 2015) evaluate implemented. The study that is summarised in the next sec-
the impact of specific risk communication activities such as tion, and the experiments that are presented in Sect. 5 were
interactive workshops, focus groups and one-way communi- all carried out in the context of Paris region and its flood re-
cation. silience challenges.
The second set of studies describe different approaches
and techniques to evaluate science outreach. Godin and
Gingras (2000), Bauer (2008), and Neresini and Pelle- 4 Assessing the impact of communication on urban
grini (2008) discuss the methodological principles of science resilience to extreme weather
outreach assessments. Examples of evaluation experiments
are described by Scheufele et al. (2005), who designed a na- In the last 5 years in the Paris region, public authorities have
tional telephone survey on nanotechnology, and by Wagoner made increasing efforts to facilitate access to information on
and Jensen (2015), who assessed adolescents’ learning at the climate risk management, encourage citizens’ participation
zoo by combining questionnaire data with responses with de- and share responsibilities with them. Unlike the strategies re-
tailed verbally administered questions. leased by public authorities before 2014, recent strategic doc-
Our research specifically investigates resilience commu- uments (EPBT SGL, 2014; MEDDE, 2014; OECD, 2014;
nication and tests what we define as resilience communica- DRIEE, 2015; DRIEE/DBSN, 2015; Mairie de Paris and Pre-
tion indicators: quantitative indicators to comprehend how fecture de Police, 2015; Mairie de Paris, Direction des Es-
a communication activity influences urban resilience to cli- paces Verts et de l’Environnement, Agence d’Écologie Ur-
mate risks. Nevertheless, the above-mentioned literature pro- baine, 2015; Mairie de Paris and 100 Resilient Cities, 2017)
Geosci. Commun., 2, 25–38, 2019 www.geosci-commun.net/2/25/2019/R. Vicari et al.: Assessing the impact of outreach strategies in cities coping with climate risks 29
define in a detailed manner the communication objectives the number of distributed messages that are consistent
and the profile of the target audiences and propose innova- with the key campaign messages, percentage of the tar-
tive outreach and public engagement activities. Furthermore, get audience that had a good understanding of the mes-
they refer to risk culture development as a priority: instead of sages, percentage of the audience who gained knowl-
focusing on emergency warning, as in the past, recent docu- edge through the campaign, percentage of the target au-
ments treat outreach and public engagement as opportunities dience that took action to contribute to the campaign
to raise awareness and educate urban communities with long- goal achievement. Each rate can be broken down by dif-
term effects. ferent sub-groups of audiences.
This trend results from a political will to apply the prin-
ciple of subsidiarity and decentralise risk management (Tan-
guy, 2015) that have led public authorities to pay attention to iii. Participatory communication. This is the percentage of
the citizens’ perceptions. The communication between pub- the target audience who contributed to disseminating
lic authorities and citizens, especially a two-way dialogue, information and percentage of citizen information that
is becoming a keystone of resilience strategies since it facili- contributed to changing risk management. Data on pub-
tates mutual understanding, identification of shared goals and lic engagement can be easily collected in the case of
cooperation. projects involving the use of social media (Grandi and
With communication that has become a key part of re- Neri, 2014; Topping and Illingworth, 2016) or mobile
cent resilience plans, since 2014 the French government apps for “citizen science” (Keating et al., 2017; Koole
has called attention to the need for communication impact et al., 2015).
assessment in flood risk management strategies (MEDDE,
2014; DRIEE, 2015). A hypothesis of relevant communi-
cation variables and indicators has been outlined by Vicari iv. Comparison. This allows the observation of how com-
et al. (2016). In this previous scoping study, the variables munication impacts change over time, in different lo-
draw on an analysis of 12 strategies, developed by local na- cations and from one segment of the population to the
tional and international institutions, from 2003 to 2017, to other.
cope with flood risk in Paris. On the basis of these variables,
we have outlined RCIs. The study consisted of the following
steps: v. The interplay with other resilience drivers. Examples
of correlations between communication and other ur-
– identifying communication activities proposed in the ban system components are (a) policy-makers that have
public authorities’ strategic documents, and specifying been influenced by the media coverage of a flood (e.g. a
the communication context, objectives and target audi- debate on insurance issues or alarm dysfunction), (b) an
ences; information campaign that has contributed to decreasing
damages and injuries, and (c) a new transport connec-
– detecting communication variables that are adequate to tion that has increased the attendance rate and variety
the context, objectives, audiences and activities of each of participants to a conference. This criterion allows the
communication strategy (outlined through the previous connection between RCIs and other resilience indica-
step); tors to be established and communication assessment to
– identifying the recurrent communication variables that be integrated into a wider resilience assessment frame-
can be exploited as relevant indicators to assess the im- work.
pact of communication on resilience.
The next section presents three different kinds of experi-
The result of this analysis is five recurring categories of vari- ments that were carried out in the framework of the Rain-
ables that are listed below. According to the study, the follow- Gain project. Each experiment takes into account some of
ing categories can serve as guiding criteria to include relevant the five guiding criteria listed above. More specifically, the
RCIs in a wider urban resilience assessment: first experiment “Media coverage monitoring” explores the
i. Intensity. This is measured by the number of tweets, intensity of communication (criterion i); it compares differ-
retweets, followers, comments, attendees, unique web- ent time periods (criterion iv) and highlights the correlations
site visitors, visit duration, number of press news items, between communication and another resilience driver, i.e. a
readerships, etc. Each rate can be broken down by dif- meteorological event (criterion v). The second experiment
ferent sub-groups of audiences. “Questionnaire administered to the visitors of an exhibition”
explores the quality of communication (criterion ii) and com-
ii. Quality (Did it reach the adequate target audience? pares different sub-groups of audiences (criterion iv). The
Was the message correctly received? Does the response third experiment “Interviews” is aimed at providing data for
match with what was expected?). This is measured by preliminary research and support monitoring of RCIs.
www.geosci-commun.net/2/25/2019/ Geosci. Commun., 2, 25–38, 201930 R. Vicari et al.: Assessing the impact of outreach strategies in cities coping with climate risks
5 The RainGain project: experiences in – a periodic search on Google News of press news items
communication assessment for an urban that include the key word “RainGain”;
resilience project
– feedback from the researchers that were interviewed by
The HM&Co (Hydrology Meteorology and Complexity) lab- the press on the RainGain project;
oratory of École des Ponts ParisTech has coordinated several – data on the audience size of printed press were collected
research projects aimed at enhancing urban resilience to ex- on each newspaper website.
treme weather. HM&Co research projects also involve devel-
oping and strengthening a network of stakeholders through From July 2011 to December 2015, we have counted a total
dissemination and public engagement activities. HM&Co number of 65 news items on the RainGain project, published
has striven in this direction by first being involved in the by the French, Dutch and Belgian press. These news items
participatory workshops addressed to the stakeholders of the include 29 articles on printed press, 6 TV reports, 5 radio
ERANET Crue SUCAs and FP7 SMARTeST projects. After reports, 25 Web articles and online video reports.
these first experiences, HM&Co has coordinated a 4-year- Figure 1 shows that during specific months the number of
long communication strategy in the framework of the Rain- news items has rapidly increased. Two kinds of events have
Gain project. The main communication objective was “to dis- occurred when the increase rate was high:
seminate and make available the tools and methodologies de-
veloped in the project, so that its target groups are informed, – The RainGain communication activities (a press release
educated, involved and mobilised so that vulnerability to ur- in March 2013 and two conferences in October 2013
ban pluvial flooding is reduced and resilience is enhanced” and May 2015). These are social and endogenous causes
(Interreg NWE IVB RainGain, 2011). of news rate increase, since they are the outcome of the
The frequency of communication activities and their im- work of the project team;
pact, in terms of audience size, have been monitored since – Flood events in The Netherlands (October 2013) and in
the beginning of the communication plan. This has enabled France (October 2015) that are environmental and ex-
the RainGain project team to adjust the communication activ- ogenous causes. The impact of a flood event on media
ities during the project implementation when problems were coverage is an example of correlation between an envi-
revealed. Indeed, precise target values have been established ronmental factor and a social factor.
as part of the communication strategy, in agreement with the
European Commission evaluators in charge of the Interreg Data on the number of press articles were compared to the
NWE IVB funding programme. During the execution of the data on the newspaper audience size. We refer to audience
plan, the project partners and the funding programme staff size as the readership that has been estimated by the news-
periodically compared the target values to the attained val- paper editor or by companies specialised in media measure-
ues, in order to appraise whether sufficient efforts and re- ment. These estimates are not precise as measurements of im-
sources were devoted to specific activities. The design of the mediate audience (i.e. a public who is face-to-face with the
experiments, the data collection and the analysis of the re- speaker), but provide an approximate metric of the potential
sults were carried out through a participatory process, in- dissemination of a news item. Figure 2 displays a compari-
volving the international project team (the communication son between the temporal evolution of the cumulative num-
officer, the scientists and the practitioners), and external staff ber of articles and the cumulative audience size of printed
(from the EC Interreg Programme, École des Ponts and Terre press. The difference between the two cumulative curves is
et Avenir association) who provided third-party advice. variable. Indeed, different newspapers have different impacts
in terms of audience size. Hence, the impact of an article is
variable according to the newspaper that publishes it. This
5.1 Media coverage monitoring is particularly true when we compare the impact of a local
newspaper to the impact of a national newspaper. The audi-
Among the communication values that were monitored dur- ence size is also variable in the case of TV, radio and digital
ing the RainGain project, the media coverage has reached press.
remarkable results that have far surpassed the target values. The frequency of press news items and the audience size
The data presented in this section were collected from differ- are two RCIs that allow identification of the population that
ent sources: has received a specific message. This is a necessary step to
evaluate the communication effects on citizens’ perceptions
– feedback from the Communication Department of and urban community resilience. The RCIs employed in this
École des Ponts that constantly monitors, through Ar- experiment also allow observation of how the resonance of a
gus de la Presse (Argus de la Presse: http://www. message evolves over time (Figs. 1 and 2) and identification
argus-presse.fr/, last access: 20 November 2018), of possible correlations with other resilience drivers (e.g. a
whether the media mention “École des Ponts”; meteorological event, as is shown in Fig. 1). With respect to
Geosci. Commun., 2, 25–38, 2019 www.geosci-commun.net/2/25/2019/R. Vicari et al.: Assessing the impact of outreach strategies in cities coping with climate risks 31
Figure 1. Cumulative number of news items (printed press, digital press, TV and radio) concerning the RainGain project and published
from July 2011 to November 2015. The number of news items rose rapidly during specific events: (1) dissemination of a press release on the
project (March 2013); (2) a flood event in the Netherlands, followed by a project conference in France (October 2013); organisation of an
international scientific conference related to the project (May–June 2015); (3) a flood event in south-eastern France (October 2015).
Figure 2. A comparison between the temporal evolution of the cumulative number of articles and the cumulative audience size of printed
press. The differences between the two cumulative curves are due to the fact that different newspapers have different impacts in terms of
audience size; hence, the impact of an article is variable according to the newspaper that publishes it. In order to highlight this variability we
have overlapped the first and the last values of the two curves.
the resilience goals of the project, the experiment has shown 5.2 Questionnaire administered to the visitors of an
that press relations allowed increased media attention on ur- exhibition
ban flood-prone areas and on emerging scientific and tech-
nological solutions. We finally should observe that an aggre- The experiment presented in this section illustrates how RCIs
gated analysis of press news items does not give any insight based on a questionnaire can capture the quality of com-
into the quality of the communication contents. munication and how the audience has interpreted and per-
ceived a message. Indeed, even if a communication activity
reaches a wide public, the communication impact on urban
resilience will vary according to the way the message is per-
ceived. Questionnaire questions, such as those presented in
this experiment, provide variables (e.g. frequency of correct
www.geosci-commun.net/2/25/2019/ Geosci. Commun., 2, 25–38, 201932 R. Vicari et al.: Assessing the impact of outreach strategies in cities coping with climate risks
questions, frequency of high risk perception) that can be used trol group (with a total number of 18 respondents). We have
as RCIs to assess the respondent’s interpretation and percep- used the Fisher’s exact test to compare the answers by the
tion. experimental group with those of the control group.
An exhibition dedicated to the RainGain project was held Figure 3a shows that the number of respondents who vis-
at École des Ponts in April–May 2014. It included five panels ited the exhibition and have ticked the correct option for the
(84 cm × 120 cm) with texts and images on the project and question “what is the spatial scale of the weather data pro-
the weather radar that was going to be installed beside the vided by the radar?” is 23 % higher than in the control group.
school, at the end of 2014. The subject of the exhibition was As it appears in Fig. 3b, the wrong responses to the question
very technical: only professionals in the field of weather fore- “what are the advantages of X band weather radars compared
casts and flood risk management are knowledgeable about it to C band and S band radars?” are 20 % less frequent among
and have access to other sources of information on the topic. the exhibition visitors. According to the results presented in
The questionnaire was distributed to the workers and stu- Fig. 3c, the number of respondents who visited the exhibition
dents of the school 1 month after the end of the exhibition. and have provided a wrong response to the question “why is
The questionnaire aimed at exploring how the exhibition con- it important to measure precipitations at small scale?” is 15 %
tents were interpreted, memorised after several weeks, and lower than in the control group. The discrepancy between the
whether it changed the visitors’ perception of RainGain (Per- visitors’ results and the control group results is between 15 %
soz, 2014). A total of 37 respondents were recruited on a and 23 % and it provides an approximate indication of the im-
voluntary basis among the 513 workers and 827 students pact of the exhibition in terms of knowledge dissemination.
of École des Ponts (all domiciled in the Paris region). They An unexpected result concerns the responses of the re-
were invited through internal mailing to complete an online spondents who read the brochure at the exhibition in Fig. 3a
questionnaire (see Supplement S1, for a detailed list of the and c. In Fig. 3a the rate of correct responses of the respon-
questions). The sample was expected to be small, since no dents who read the brochure is lower (60 %) than in the ex-
monetary incentive was provided for questionnaire participa- perimental group (73 %). Figure 3c shows that the rate of
tion and there was no examiner who could individually reach wrong answers by the respondents who read the brochures is
each potential respondent to solicit his answers. We were also surprisingly high (40 %): it is close to the rate of wrong an-
aware that questionnaires give limited insights into the cog- swers by the respondents who never heard about the project
nitive processes that shape individual and social perceptions. (42 %). We could assume that the respondents who picked
However, rather than obtaining results that can be generalised the brochure spent little time reading the exhibition panels
to a wider population, our main objective was to test if quan- and that part of the brochure information was not didactic or
titative research can be employed to evaluate the quality of suitable enough for the general public.
communication. Indeed, this method and the research tech- Figure 3c highlights another interesting result: the lowest
nique presented in the previous experiment have a common rate of wrong answers corresponds to the group of respon-
characteristic: they provide numerical data that are adequate dents who did not attend the exhibition but heard about the
to integrate communication assessment in a wider urban re- project by word of mouth. We can suppose that face-to-face
silience assessment. communication can strongly reinforce transmission of highly
The questionnaire included questions on the professional technical information.
background of the respondents. These questions allowed six To sum up, the answer rates, displayed in Fig. 3, show that
experts from the sample to be excluded, in order to obtain the exhibition had a modest positive effect on the respon-
a relative homogeneity in terms of background knowledge. dents’ awareness about a flood resilience project, the back-
As a result, the final sample consisted of 31 respondents ground environmental issues and the solutions being devel-
(see Supplement S1 for demographic data). Other questions oped. We suppose that this effect was reinforced by word
were aimed at identifying the source of information through of mouth communication, but was also weakened by the
which the respondents learnt about the project. On the ba- brochure.
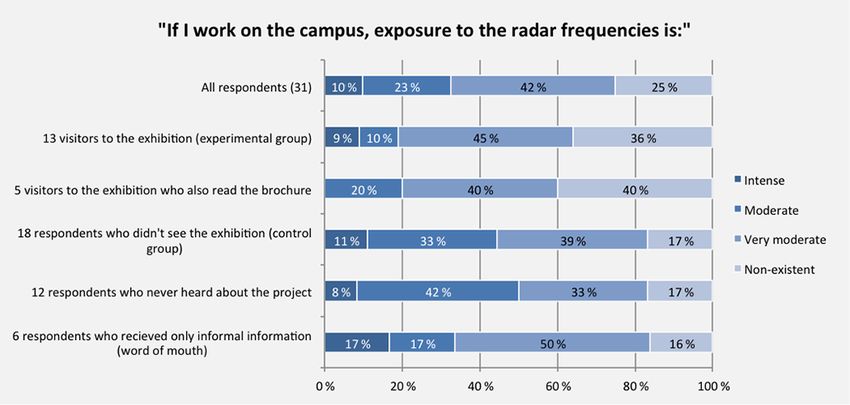
sis of these questions the sample was divided into four sub- Figure 4 presents the answers to a questionnaire question
sets: (1) 13 visitors to the exhibition; (2) five visitors who aimed at evaluating the risk perception and project accep-
also read the brochure distributed at the exhibition; (3) six re- tance of the respondents who visited the exhibition. The re-
spondents who received only informal information (by word sults show that the exhibition and the brochure, i.e. formal
of mouth4 ); (4) 12 participants who never heard about the and official information, helped to reassure the respondents
project. In order to perform a comparative experiment, sub- on security issues and encouraged them to support the im-
set no. 1 was considered the experimental group (with 13 plementation of the flood resilience project. Word of mouth
respondents); subsets nos. 3 and 4 were considered the con- communication did not have such a positive effect as formal
information, but neither did it compromise the achievement
4 We use the term “by word of mouth” to refer to information of the project goals.
that was passed from person to person – working or studying at the
school – by oral and informal communication.
Geosci. Commun., 2, 25–38, 2019 www.geosci-commun.net/2/25/2019/R. Vicari et al.: Assessing the impact of outreach strategies in cities coping with climate risks 33 Figure 3. The answers to three of the questionnaire questions on the RainGain exhibition held in April–May 2014. 100 % corresponds to the total number of respondents included in each subset: 31 respondents in the first row, 13 respondents in the second row, 5 respondents in the third row, and so on. www.geosci-commun.net/2/25/2019/ Geosci. Commun., 2, 25–38, 2019
34                              R. Vicari et al.: Assessing the impact of outreach strategies in cities coping with climate risks

   The Fisher Exact test5 was applied to the results of the four      Table 1. Questions to the audience of the video “Jeannine presents
questions: p values are not significant, as these are always          the radar” (Mulard, 2015).
greater than 0.05 (the conventionally accepted significance
level). Hence, the test confirms that, because of the small size           a. What was unclear in the video and why?
of the sample, the differences between the answers by the ex-              b. Which aspects of the project would you like to
perimental group and of the control group are not statistically            learn more about?
significant.
                                                                           c. What are the strengths and weaknesses of this video?

5.3   Interviews

While questionnaires with closed-ended questions allow the            the speaker. They have also found the images of the radar
results to be quantified, interviews can reveal more insights         installation interesting. However, the respondents, who were
into the reactions and reasoning of the respondents. These re-        all engineering school students, expected more information
search techniques do not provide quantitative variables that          about the radar functioning and its concrete applications.
can be used as RCIs. Nevertheless, this is a helpful evaluation       They were curious about the extent of the implementation of
method to be adopted for exploratory studies. Two assess-             the project (“is the radar already operational?”, “how many
ments based on open-ended questions were conducted during             new radars will be installed in Europe?”, “you should in-
the RainGain project in relation to outreach activities.              clude a map with the pilot sites in the video.”) and the radar
   One of the achievements of RainGain has been the in-               functioning (“does the radar allow predicting the rainfall vol-
auguration of a new high-resolution weather radar at École            ume?”, “it would have been nice to see some radar images.”).
des Ponts during the international conference “Researchers            They also wondered about the researchers and engineers that
& water managers preparing cities for a changing climate”             operate the radar, the services that can be developed with
(8 and 9 June 2015). The promotion of this event has in-              these new weather data (“is it used only for weather fore-
volved a wide range of outreach activities and means. One             casts?”, “is it possible to use it for Roland-Garros?”). These
of the pieces of promotional content, which was produced              results will be used to design new questionnaires addressed
on this occasion, is a short video (Mulard et al., 2015). It          to students from an engineering school. In particular, it ap-
shows the installation of the radar, highlights the importance        pears relevant to include questions that make the link with
of this device in terms of research and innovation, and invites       their professional interests and that are accurately tailored to
the audience to attend the conference. The video is mainly            their background knowledge.
addressed to the students and workers of École des Ponts,                A similar assessment, based on three open-ended ques-
since the school is located in front of the radar site. Jean-         tions (Table 2; see Supplement S2 for the respondents’ an-
nine Courtot, the manager of the school café and a charis-            swers), was undertaken in November 2015 to evaluate the
matic and well-known figure on the campus, was involved as            impact of a workshop on RainGain (held during the Provin
the speaker of the video. While the video was broadcast on            Climate Forum). The respondents were all the participants of
YouTube and on the school screens, two women and two men              the workshop: 18 pupils (10 girls and 8 boys), all aged be-
were interviewed (they were all university students, aged be-         tween eight and nine years and resident in the Paris region,
tween 20 and 23 years and domiciled in the Paris region).             who had been invited by the forum organisers. We chose the
The questions, displayed in Table 1, aimed to appraise what           snapshot interviews (Fogg Rogers et al., 2015) as an inves-
kind of information the audience expected, how they inter-            tigation method since it is an alternative technique that is
preted the video contents, and how they reacted to the inter-         appropriate for a young audience and the context of a fo-
view questions. The respondents were selected from the list           rum. The assessment highlighted that the audience enjoyed
of students invited to the conference and they participated in        and well remembered a manual activity on rainfall observa-
the interview on a voluntary basis.                                   tion in which they were active participants. It also revealed
   The video was appreciated by the respondents who found             that the third question was misunderstood. Its purpose was
it “catchy” thanks to its dynamic pacing and the charisma of          to assess the clarity and exhaustiveness of the communica-
                                                                      tion contents, but the respondents interpreted it as a question
    5 We have computed a 2 × 2 contingency table, for each ques-
                                                                      testing their learning capacities. This result suggests that the
tionnaire question, with the frequencies of (a) the correct answers   questions addressed to a young audience should be formu-
by the experimental group, (b) the correct answers by the con-        lated in such a way that the respondents do not feel like they
trol group, (c) the wrong answers by the experimental group and       are being examined.
(d) the wrong answers by the control group. We then applied the
Fisher’s exact test because in all the 2 × 2 contingency tables
at least one value is N = 5. The test uses the following formula
where the “a”, “b”, “c” and “d” are the individual frequencies
of the 2 × 2 contingency table, and “N” is the total frequency:
p = ((a + b) ! (c + d) ! (a + c) ! (b + d) !)/a ! b ! c ! d ! N !

Geosci. Commun., 2, 25–38, 2019                                                               www.geosci-commun.net/2/25/2019/
R. Vicari et al.: Assessing the impact of outreach strategies in cities coping with climate risks 35
Figure 4. Answers to a questionnaire question evaluating the risk perception of the visitors after the RainGain exhibition. 100 % corresponds
to the total number of respondents included in each subset: 31 respondents in the first row, 13 respondents in the second row, 5 respondents
in the third row, and so on.
Table 2. Questions to the participants of the RainGain workshop, estimation of the population that was reached. Furthermore,
conceived and held by Auguste Gires in the framework of the Provin it shows that a correlation between a physical environmental
Forum (November 2015). process (a flood event) and a social process (press communi-
cation) can be quantified. Nevertheless, aggregated analysis
a. What did you like in this workshop? does not allow investigation of the quality of the contents
b. What did you learn that you did not know before? that have spread through the press: for instance, whether the
representation of scientific innovation by the press is positive
c. Is there anything you did not understand or you would like or negative and whether links between science and urban re-
to learn more about?
silience are highlighted by the media. Computer-assisted text
mining tools are a possible methodological path to be fol-
lowed.
6 Conclusions and perspectives Such big data exploration techniques would also allow
time and cost constraints that were encountered with the
The increasing awareness of the role that citizens can play questionnaire experiment to be overcome, the results of
as active actors of urban resilience makes it necessary to de- which should be validated with a larger sample. However,
velop relevant indicators of the communication impact. This thanks to this experiment it has been possible to (1) design
study highlights that quantitative metrics are a promising tool RCIs aimed at evaluating how a message has been inter-
for communication assessment in the framework of resilience preted and perceived by a non-specialist audience, (2) test
strategies and shows, at the same time, that aggregated anal- their implementation in the operational context of a resilience
ysis has its limits. communication campaign, and (3) compare the experimental
The experiments carried out during the RainGain project group response with the control group response in order to
have brought out valuable RCIs. A preliminary study of normalise the response ratings to different questions.
Paris flood resilience strategies and the related communica- The questionnaire did not provide in-depth understanding
tion plans has allowed us to identify five recurring categories of the respondents’ reasoning and reactions. On the contrary,
of communication variables. Each category constitutes help- qualitative assessment methods, such as interviews, allow for
ful guidance to define RCIs. At this stage of the research, we moving beyond an aggregated analysis and for zooming into
are cautious in generalising the validity of the RCI guiding an individual perspective. Nevertheless, for the purposes of
criteria because they refer to the resilience communication this research, qualitative research methods are adequate for
strategies adopted in a unique region to cope with a specific preliminary studies. The interview outcomes show that these
climate risk. Nevertheless, this work paves the way for future results can be used to develop the content of the question-
developments. The same applies to the following conclusions naire and ensure that questions are formulated in an appro-
that are the result of a limited number of small-scale experi- priate fashion.
ments. The methods tested through these three experiments ap-
The media monitoring experiment highlights that news pear to be complementary and endorse the following conclu-
item frequency and audience size are two RCIs that allow the
www.geosci-commun.net/2/25/2019/ Geosci. Commun., 2, 25–38, 201936 R. Vicari et al.: Assessing the impact of outreach strategies in cities coping with climate risks
sions: assessment aimed to investigate the impact of com- Bellwood, D. R., Hughes, T. P., Folke, C., and Nyström, M.: Con-
munication on resilience cannot rely on a unique technique, fronting the coral reef crisis, Nature, 429, 827–833, 2004.
and quantitative analysis is paramount in this context. Indeed, Berkes, F., Colding, J., and Folke, C.: Navigating Social-ecological
data in numerical form facilitate the study of interactions Systems: Building Resilience for Complexity and Change, Cam-
between the communication processes and other resilience bridge University Press, Cambridge, UK, 2003.
Carpenter, S. R.: Regime Shifts in Lake Ecosystems: Pattern and
drivers, such as meteorological events. Investigating these in-
Variation, Ecology Institute, Oldendorf/Luhe, Germany, 2003.
teractions is a necessary basis to integrate communication in- Carpenter, S., Walker, B., Marty Anderies, J., and Abel, N.: From
dicators in a wider urban resilience assessment. metaphor to measurement: Resilience of what to what?, Ecosys-
As a follow-up to this study, we envisage comparing the tems, 4, 765–781, https://doi.org/10.1007/s10021-001-0045-9,
present results with those obtained by investigating the qual- 2001.
ity of digital media contents and the socio-semantic dynam- Charrière, M. K. M., Junier, S., Bogaard, T. A., Mostert,
ics that occur through the Web. From a resilience assessment E., Malet, J.–P., and van de Giesen, N.: The impact of
perspective, the advantage of digital communication datasets an exhibition on risk awareness of the general public in
is that they allow extracting numerical data on social rela- mountainous areas, Int. J. Disast. Risk Re., 25, 36–59,
tions. Moreover, thanks to computer-aided exploration tech- https://doi.org/10.1016/j.ijdrr.2017.07.011, 2017.
niques it is possible to consider both the global trend and Cutter, S. L., Barnes, L., Berry, M., Burton, C., Evans, E., Tate, E.,
and Webb, J.: A place – based model for understanding com-
the individual behaviour. The RCIs employed in the media
munity resilience to natural disasters, Global Environ. Chang.,
monitoring and questionnaire experiments could be tested on 18, 598–606, https://doi.org/10.1016/j.gloenvcha.2008.07.013,
larger scales thanks to big data exploration techniques. At the 2008.
same time, the methods discussed in this paper can be used to Cutter, S. L., Burton, C. G., and Emrich, C. T.: Disaster resilience
detect possible biases induced by the Web. This emphasises indicators for benchmarking baseline conditions, J. Homel.
again the need to use complementary techniques to assess Secur. Emerg., 7, 51, https://doi.org/10.2202/1547-7355.1732,
communication impact on urban resilience. 2010.
Cutter, S. L., Ash, K. D., and Emrich, C. T.: The geographies of
community disaster resilience, Global Environ. Chang., 29, 65–
Data availability. Underlying research data can be found in the 77, https://doi.org/10.1016/j.gloenvcha.2014.08.005, 2014.
Supplement to this article. DRIEE: Plan de Gestion des Risques d’Inondation
2016–2021 – Bassin Seine–Normandie, Direction Ré-
gionale et Interdépartementale de l’Environnement
Supplement. The supplement related to this article is available et de l’Énergie, Paris, France, 156 pp., available at:
online at: https://doi.org/10.5194/gc-2-25-2019-supplement. http://www.driee.ile-de-france.developpement-durable.gouv.fr/
IMG/pdf/PGRI_2015_WEB_240416.pdf (last access: 14 Jan-
uary 2019), 2015.
DRIEE/DBSN: CPiER Plan Seine, Direction Régionale et Interdé-
Author contributions. This research was carried out by RV and
partementale de l’Environnement et de l’Énergie, Paris, France,
supervised by IT and DS.
19 pp., available at: https://www.iledefrance.fr/sites/default/files/
cpierv30_signe-2_0.pdf (last access: 14 January 2019), 2015.
EPBT SGL: Programme d’Actions de Prévention des Inondations
Competing interests. The authors declare that they have no con- de la Seine et de la Marne Franciliennes (PAPI), Établissement
flict of interest. Public Territorial de Bassin Seine Grands Lacs, Paris, France,
28 pp., available at: http://seinegrandslacs.fr/sites/default/files/
dossier_synthese_papi.pdf (last access: 14 January 2019), 2014.
Acknowledgements. The authors gratefully acknowledge partial Fogg Rogers, L., Grand, A., and Sardo, M.: Integrating public en-
financial support of the chair “Hydrology for resilient cities” gagement into our research, Science in Public Conference 2015,
endowed by Veolia and of the Interreg NWE IVB RainGain project. Bristol, UK, 9–10 July 2015.
Folke, C.: Resilience: the emergence of a perspective for social–
Edited by: Mathew Stiller-Reeve ecological systems analyses, Global Environ. Chang., 16, 253–
Reviewed by: three anonymous referees 267, 2006.
Folke, C., Carpenter, S. R., Walker, B., Scheffer, M., Chapin, T.,
and Rockström, J.: Resilience thinking: Integrating resilience,
References adaptability and transformability, Ecol. Soc., 15, 20, http://www.
ecologyandsociety.org/vol15/iss4/art20/, 2010.
Adger, W. N.: Vulnerability, Global Environ. Chang., 16, 268–281, Godin, B. and Gingras, Y.: What is scientific and technological cul-
https://doi.org/10.1016/j.gloenvcha.2006.02.006, 2006. ture and how is it measured? A multidimensional model, Public
Bauer, M.: Survey research on public understanding of science, in: Underst. Sci., 9, 43–58, 2000.
Routledge Handbook of Public Communication of Science and Grandi, R. and Neri, F.: Sentiment analysis and city branding, in:
Technology, edited by: Bucchi, M. and Trench, B., Routledge, New Trends in Databases and Information Systems, Advances
London, UK, 111–129, 2008.
Geosci. Commun., 2, 25–38, 2019 www.geosci-commun.net/2/25/2019/You can also read