BURNING THE GAS 'BRIDGE FUEL' MYTH: WHY GAS IS NOT CLEAN, CHEAP, OR NECESSARY - Oil Change ...
←
→
Page content transcription
If your browser does not render page correctly, please read the page content below
MAY 2019

BURNING THE GAS
‘BRIDGE FUEL’ MYTH:
WHY GAS IS NOT CLEAN, CHEAP, OR NECESSARY
Endorsed by
This report was researched and written by Lorne Stockman (Oil Change International) with contributions
from Kelly Trout (Oil Change International) and Barb Blumenthal (New Jersey Conservation Foundation).

It was copy edited by Jaye Berman.

This publication is part of an Oil Change International series of reports on gas and climate.
See www.priceofoil.org/gas

The authors are grateful for feedback from the following reviewers:
Amy Mall of Natural Resources Defense Council, Andy Gheorghiu of Food & Water Europe, Antoine Simon of Friends
of the Earth Europe, Aaron Mintzes and Bruce Baizel of Earthworks, Cara Bottorff of the Sierra Club, Kassie Siegel
and Shaye Wolf of the Center for Biological Diversity, Mitch Jones of Food and Water Watch, Nancy LaPlaca,
Regulatory Consultant, Tim Donaghy of Greenpeace USA, Tom Gilbert of the New Jersey Conservation Foundation
and Tom Hadwin.

Design: paul@hellopaul.com
Front cover: Gas from a newly drilled well is flared off in Bradford County, Pennsylvania, U.S. ©Les Stone/Greenpeace.
Back cover: The Hornsdale Power Reserve battery and wind farm in South Australia. ©David Clark

May 2019

Published by Oil Change International (www.priceofoil.org) and endorsed by:
350.org, Center for Biological Diversity, Chesapeake Climate Action, Clean Virginia, Earthworks,
Food & Water Europe, Food & Water Watch, Friends of the Earth Europe, Friends of the Earth USA,
Greenpeace USA, NC WARN, New Jersey Conservation Foundation, New York Communities for Change,
Rainforest Action Network and Sierra Club.

Oil Change International is a research, communications, and advocacy organization focused on
exposing the true costs of fossil fuels and facilitating the coming transition towards clean energy.

Oil Change International
714 G Street SE Suite #202
Washington, DC 20003 U.S.
www.priceofoil.org
CONTENTS
LIST OF ABBREVIATIONS                                                    1

INTRODUCTION – THE BRIDGE FUEL MYTH                                      2
 Five Reasons Gas Is Not a Bridge to a Safe Climate                      2

NOT CLEAN, NOT CHEAP, NOT NECESSARY                                      4
 Methane Leakage                                                         4
 1. Gas Breaks the Carbon Budget                                         6
 2. Coal-to-Gas Switching Doesn’t Cut It                                 7
 		 Power Sector Climate Goals Cannot Be Met with More Gas               7
 		 Not Just Power: Business-as-Usual Gas Production Drastically
 		  Overshoots Climate Models                                           8
 		 Carbon Capture and Storage (CCS): A Dangerous Bet                    8
 3. Low-Cost Renewables Can Displace Coal and Gas                       10
 		 Falling Costs                                                        11
 		 Disruption                                                           11
 4. Gas Is Not Essential for Grid Reliability                           14
 		 CCGT – The Wrong Technology for the Energy Transition               14
 		 Batteries Challenge Gas ‘Peakers’                                   14
 		 Power Market Design Is Key to the Clean Energy Transition           16
 5. New Gas Infrastructure Locks In Emissions                           17

CONCLUSION                                                              18

LIST OF ABBREVIATIONS
°C    Degrees Celsius                                   IEA        International Energy Agency
BECCS Bioenergy with carbon capture and storage         IPCC       Intergovernmental Panel on Climate Change
CCGT Combined Cycle Gas Turbine                         IRENA      International Renewable Energy Agency
CCS   Carbon capture and storage                        LCOE       Levelized Cost of Energy
CO2   Carbon dioxide                                    LNG        Liquefied Natural Gas
GHG Greenhouse gas                                      Mt         Million metric tons
GRE   Gas reciprocating engine                          MW         Megawatt
Gt    Billion metric tons / Gigatons                    MWh        Megawatt hour
GW    Gigawatt                                          OCGT       Open Cycle Gas Turbine
2
    INTRODUCTION –
    THE BRIDGE FUEL MYTH

    As the global climate crisis intensifies while the production and       FIVE REASONS GAS IS NOT A
    consumption of gasa soars, it is clearer than ever that gas is          BRIDGE TO A SAFE CLIMATE
    not a solution to the climate crisis. This report unpacks and           1. Gas Breaks the Carbon Budget: The economically recoverable
    debunks the enduring myth that gas can form a bridge to a                  oil, gas, and coal in the world’s currently producing and under-
    decarbonized future.                                                       construction extraction projects would take the world far
                                                                               beyond safe climate limits. Further development of untapped
    The mythology around gas being a “cleaner” fossil fuel that can            gas reserves is inconsistent with the climate goals in the
    support the transition to clean energy goes back at least three            Paris Agreement.
    decades. Oil and gas corporations have championed and invested
    in this myth as a way to delay the transition away from fossil fuels.   2. Coal-to-Gas Switching Doesn’t Cut It: Climate goals require
    Alarmingly, despite the evidence that overreliance on gas is a             the energy sector to be decarbonized by mid-century. This
    recipe for climate breakdown, a number of politicians and decision-        means that both coal and gas must be phased out. Replacing
    makers continue to repeat the myth of gas as a climate solution.b          coal plants with new gas plants will not cut emissions by nearly
                                                                               enough, even if methane leakage is kept to a minimum.
    In this report, we unpack the core arguments of the bridge fuel
    myth and the data that prove them to be false. First, we discuss        3. Low-Cost Renewables Can Displace Coal and Gas: The
    how the issue of leaking methane, a highly potent greenhouse gas,          dramatic and ongoing cost declines for wind and solar disrupt
    makes clear that gas is not clean. But methane leakage does not            the business model for gas in the power sector. Wind and
    define the climate impact of gas. This report details five additional      solar will play an increasing role in replacing retiring fossil
    reasons why gas cannot form a bridge to a clean energy future,             fuel capacity.
    even if methane leakage is addressed. These five points make clear
    that gas is not clean, gas is not cheap, and gas is not necessary.      4. Gas Is Not Essential for Grid Reliability: Wind and solar
                                                                               require balancing, but gas is not the only, nor the best, resource
                                                                               available for doing so. Battery storage is fast becoming
    Flaring on well pad, Lower Saxony, Germany. ©Andreas, Fractracker.         competitive with gas plants designed for this purpose (known
                                                                               as “peakers”). Wind and solar plants that are coupled with
                                                                               battery storage are also becoming a competitive “dispatchable”
                                                                               source of energy. Managing high levels of wind and solar on
                                                                               the grid requires optimizing a wide range of technologies
                                                                               and solutions, including battery storage, demand response,
                                                                               and transmission. There is no reason to favor gas as the
                                                                               primary solution.

                                                                            5. New Gas Infrastructure Locks In Emissions: Multibillion-dollar
                                                                               gas infrastructure built today is designed to operate for decades
                                                                               to come. Given the barriers to closing down infrastructure
                                                                               ahead of its expected economic lifespan, it is critical to stop
                                                                               building new infrastructure, the full lifetime emissions of which
                                                                               will not fit within Paris-aligned carbon budgets.

                                                                            a We use the term gas to mean all types of gas composed primarily of methane. Fossil
                                                                              gas is a term used in place of what the oil and gas industry calls natural gas. We use
                                                                              the term fossil gas where we are specifically referring to gas from fossil fuel sources.
                                                                              See Box 3 for details of why so-called renewable gas is not generally a solution to the
                                                                              impacts of fossil gas.
                                                                            b For example, Secretary John Kerry used the term during the House Oversight and
                                                                              Reform Committee Hearing on Leadership to Combat Climate Change on April 9,
                                                                              2019, and Virginia Governor Ralph Northam said, “gas has significant potential as
                                                                              a bridge fuel to help us reduce carbon pollution that drives climate change while
                                                                              we transition to solar, wind, and other clean energy sources” in a September 2018
                                                                              press release on Virginia’s climate action plan. https://www.governor.virginia.gov/
                                                                              newsroom/all-releases/2018/september/headline-829610-en.html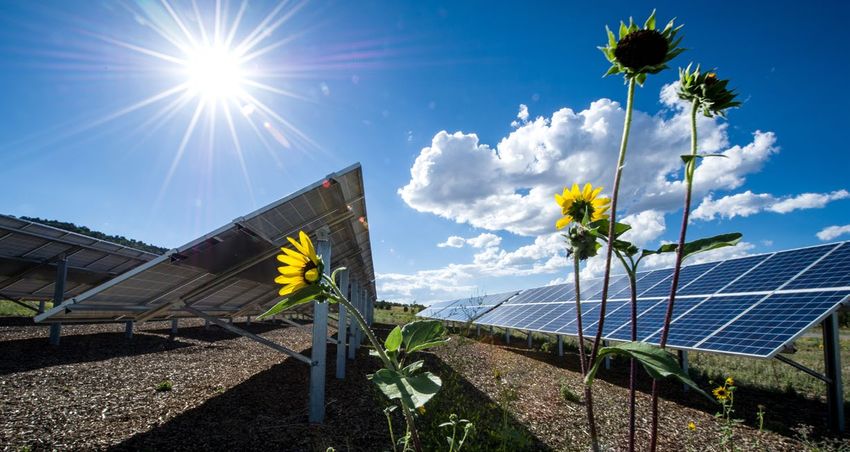
3
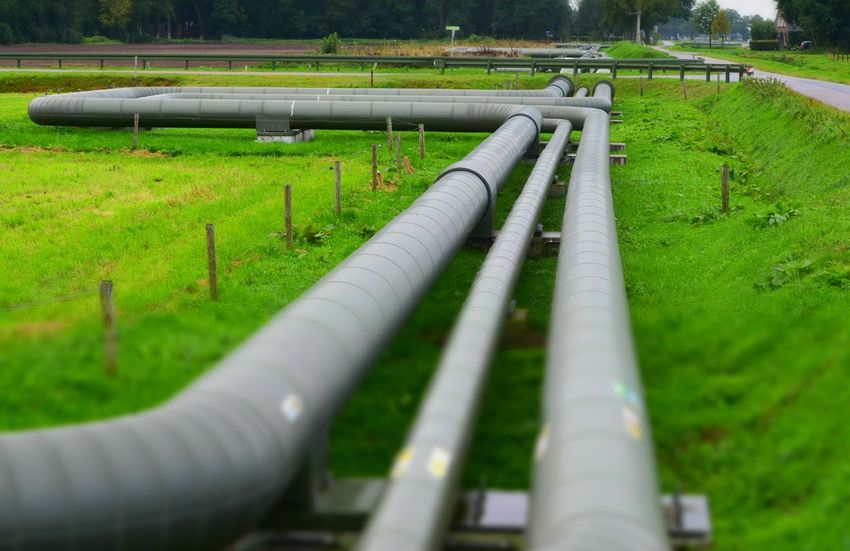
Gas fields and pipeline in the Netherlands. ©Ted Auch.
The oil and gas industry has used the bridge fuel myth as cover This report does not attempt to map a detailed path towards an
for expanding gas supply and consumption as much as possible. energy system with zero gas. There are many studies that show
Global gas production has grown 51 percent since 2000.1 This has specific pathways to achieving zero emissions by 2050.4 Instead,
been greatly facilitated by the development of horizontal drilling we detail why the transition to a zero-carbon energy system is
and hydraulic fracturing (fracking) in North America, which has being undermined by overreliance on gas and, in fact, requires a
enabled access to vast quantities of hitherto inaccessible fossil managed decline of gas production and consumption along with
gas. Aside from the climate implications, the growth in fracked gas that of coal and oil.
has burdened many communities with pollution, health and safety
hazards, and environmental injustice (see Box 1). While the power sector is the main sector discussed in this report,
as it has been central to the bridge fuel myth, achieving climate
The growth in gas production has led to high levels of gas goals will require that all sectors follow the power sector to
consumption in some regions such that for some, decarbonization decarbonization. Efficiency and electrification are key to reducing
now requires the transition from gas to clean energy rather fossil fuel use in all energy sectors – not increasing reliance on a
than from coal and oil. This task is made more difficult by fuel that only makes the transition more challenging. The false
the lock-in effect of billions of dollars spent on recently built hope of “renewable gas” likewise does not provide an adequate
gas infrastructure. solution to the decarbonization of these other sectors (see Box 2).
During this period of rapid growth in gas production, global coal By addressing these issues, this report makes clear that ongoing
production also grew 68 percent. 2 Global fossil fuel emissions grew growth in gas production, consumption, export, and import
2.7 percent in 2018, the largest increase in seven years.3 Business- cannot be justified on climate grounds. The urgent business of full
as-usual projections suggest gas production could grow a further decarbonization requires managing the phase-out of gas alongside
20 to 40 percent by the 2040s.c other fossil fuels.
c Rystad Energy AS UCube Database projects a 20 percent growth in global gas production from 2018 to 2043, after which a modest decline leads to 2050 production some
17 percent above 2018 levels. The International Energy Agency projects a 43 percent growth in gas production from 2017 to 2040 in the “New Policies Scenario” in the
World Energy Outlook 2018.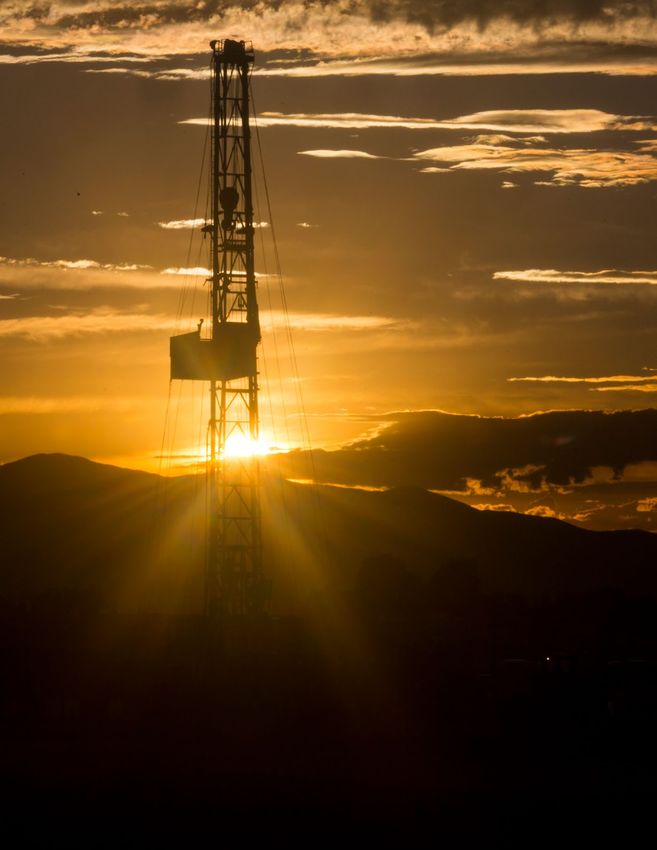
4
    NOT CLEAN, NOT CHEAP,
    NOT NECESSARY

    All methane-based gas emits carbon                            and human error, and some is vented as                         While any broad consensus on how
    dioxide (CO2) when it is combusted. In                        part of routine procedures, such as when                       much methane is leaking remains elusive,
    addition, methane leakage throughout the                      pipelines must be emptied to perform                           there is hard data showing that oil and
    entire gas supply chain creates additional                    routine maintenance or repairs.8                               gas infrastructure is the prime source of
    climate impacts. While some oil and gas                                                                                      the rising levels of methane in the global
    producers have set targets for reducing                       According to the Intergovernmental                             atmosphere over the past decade.13 This
    methane leakage, in many cases there is                       Panel on Climate Change (IPCC), the                            rise in atmospheric methane corresponds
    insufficient transparency to verify how                       warming effect of methane is 87 times                          very closely to the growth in fracked gas
    much methane is actually emitted.5                            greater than CO2 over a 20-year period                         production in the United States.
                                                                  and 36 times greater over a 100-year
    First, we briefly outline the methane                         period.9 However, the study of the                             There is no doubt about the importance of
    issue. We then go on to demonstrate that                      radiative forcing, or warming effect, of                       reducing methane leakage from existing
    methane is not what determines whether                        different greenhouse gases is ongoing,                         oil and gas operations and distribution
    gas is positive for the transition to clean                   and there is increasing evidence that                          networks. But reducing methane leakage
    energy. With or without methane leakage,                      these figures may underestimate the                            does not mean that gas production and
    gas is not clean. Nor is gas the answer                       impact of methane.10, 11                                       consumption can continue to grow.
    to the challenges of transitioning to a
    genuinely clean energy future.                                If elevated levels of methane are leaked in                    The limits of our climate system mean that
                                                                  the process of producing and delivering                        we need to reduce all fossil fuel production
    METHANE LEAKAGE                                               gas to consumers, then any emissions                           and use, and gas is no exception. With
    Methane is the primary constituent of fossil                  advantage gas may have over coal for                           this in mind, the five discussion points
    gas. Gas produced at the wellhead may                         power generation or other uses is reduced                      detailed below make clear that even in
    contain as little as 65 percent methane,                      or negated.                                                    the hypothetical case of zero-methane
    with the rest a combination of gas liquids,                                                                                  leakage, gas cannot be a bridge fuel.
    mostly ethane, butane, and propane.6                          Many studies have been conducted to                            To meet climate goals, gas production
    Liquids are separated at processing plants,                   ascertain how much methane leakage                             and consumption must, as with other
    and “dry” gas delivered in pipelines is                       is occurring and what levels of leakage                        fossil fuels, be phased out, and efforts
    generally more than 90 percent methane.7                      constitute a greater or lesser climate                         to reduce methane leakage do not alter
                                                                  impact attributable to gas compared to                         that conclusion.
    Methane leaks from every part of the gas                      the other fossil fuels.d Several studies have
    supply chain. Methane is highly potent                        found that in the United States, especially,
    when released to the atmosphere, i.e.,                        where gas production has been growing
    without combustion. It is routine in the                      the fastest for most of the past decade,
    production, processing, transportation,                       government estimates of methane leakage
    and storage of gas for some gas to escape.                    rates from oil and gas infrastructure
    Some is leaked through faulty equipment                       underestimate the problem.12

    d This is a substantial and ongoing area of study. We have avoided stating specific figures here on purpose as these parameters tend to change as new studies are published. Many
      of these studies are listed in a database maintained by PSE Healthy Energy under “climate/methane” found here: https://www.zotero.org/groups/248773/pse_study_citation_
      database/items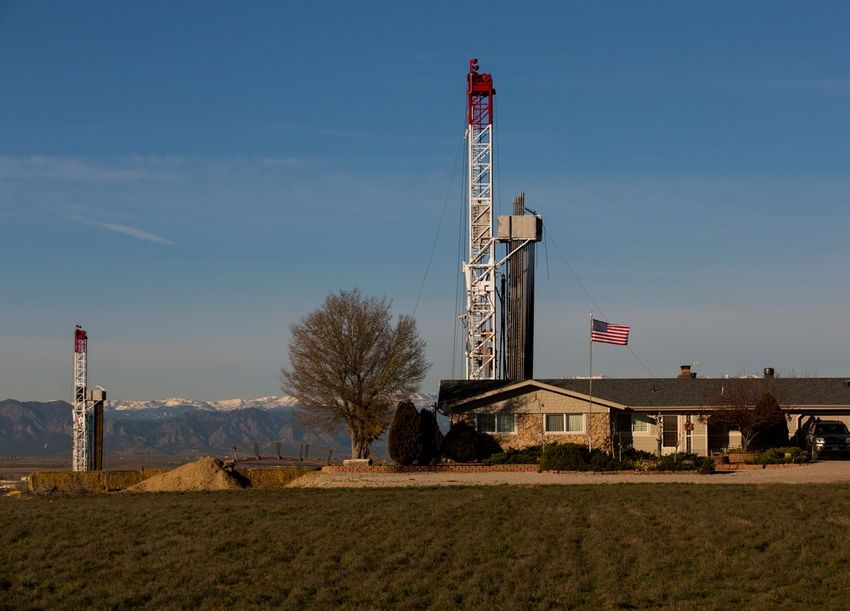
5
BOX 1: Gas Production Burdens Communities
Oil and gas production worldwide often brings pollution, habitat have found themselves powerless to stop pipelines crossing their
destruction, and health and safety risks for host communities, property due to the power of eminent domain granted to pipeline
as well as issues of economic and environmental justice.14 The companies by state and federal regulators.18 Gas infrastructure
process of fracking, which has become the main source of gas in has been sited amidst poor rural, often minority, communities, in
the United States, is accompanied by particularly intense impacts clear cases of environmental racism and injustice.19
for communities.
The proliferation of gas drilling also produces associated
These impacts include groundwater contamination and excessive hydrocarbons called natural gas liquids. Some of these liquids are
water consumption, air pollution, toxic chemical exposure, land used for plastic production and are triggering a disturbing rise
erosion and habitat destruction, increased seismic activity, in the number of petrochemical processing plants and plastics
and health and safety risks associated with heavy truck traffic, facilities constructed in already heavily burdened communities
man-camps, and the toxic and explosive nature of gas and on the U.S. Gulf Coast and in Appalachia. 20
associated hydrocarbons.15, 16, 17
These impacts add to the urgency with which the burgeoning
As gas production has grown in regions with previously little growth in gas production must be addressed. Constraining gas
or no production, storage tanks, pipelines, and compressor production in line with climate limits will ease the tremendous
stations have proliferated, bringing the risks into an increasing burden that has been placed on the communities in the path of
number of communities. Many gas pipeline projects have met the ongoing fracked gas boom.
with resistance from communities and landowners. Landowners
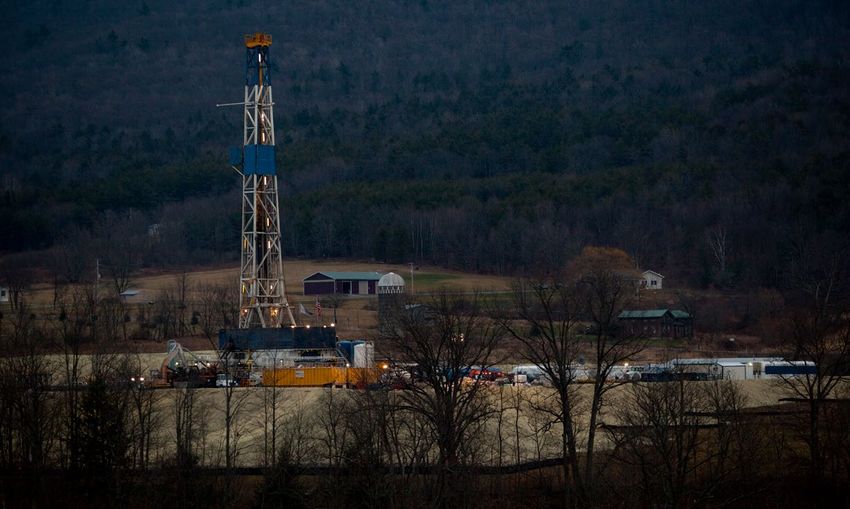
Drilling towers near a home in Colorado, U.S. ©Les Stone/Greenpeace.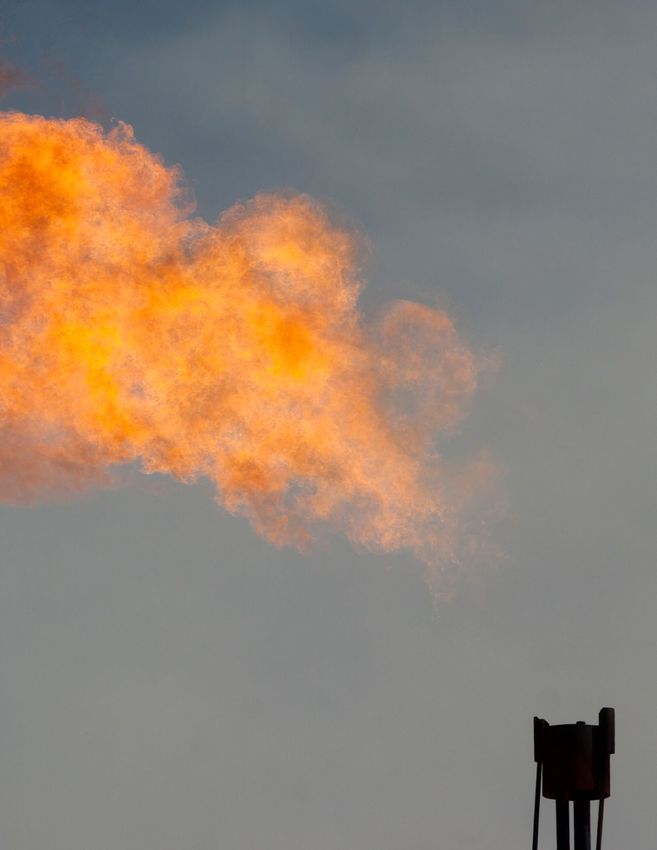
6   Figure 1: CO2 Emissions from Global Developed Fossil Fuel Reserves, Compared to Carbon Budgets within Range of the Paris Goals
             1200
                                                                                                                                            2°C

                                                                                                PARIS GOALS
         1000
                                                  Coal
             800

                    DEVELOPED
    Gt CO2

             600     RESERVES                     Gas
                                                                                                                                  CARBON BUDGET
                                                                                             1.5°C
             400
                                                   Oil
                                                                                     CARBON BUDGET
             200
                      Land use
                      change                   Cement
               0
                                               Emissions                             1.5°C (50% chance)                             2°C (66% chance)
    Source: Rystad Energy, IEA, World Energy Council, IPCC, OCI analysis23

    1. GAS BREAKS THE                                             Using data sources from the energy                            The implication of this analysis is clear:
    CARBON BUDGET                                                 industry and the IPCC, research by Oil                        There is no room for new fossil fuel
    The Paris Agreement, ratified by more                         Change International has found that CO2                       development – gas included – within the
    than 170 nations, requires governments to                     emissions from the oil, gas, and coal in                      Paris Agreement goals. Even if global coal
    pursue efforts to limit global temperature                    already-operating or under-construction                       use were phased out overnight, developed
    rise to 1.5 degrees Celsius (°C) above pre-                   fields and mines globally would push the                      reserves of oil and gas would push the
    industrial levels, and in any case, to hold it                world far beyond 1.5°C of warming and                         world above 1.5°C of warming.
    well below 2°C.21 In 2018, the IPCC released                  would exhaust a 2°C carbon budget, as
    a powerful report showing the critical                        shown in Figure 1.e These “developed                          In practice, this means that achieving the
    importance of the 1.5°C threshold. Limiting                   reserves” represent the oil, gas, and coal                    Paris goals will require governments to
    warming to this level – the more ambitious                    that fossil fuel companies have already                       proactively manage the decline of all fossil
    end of the Paris goals – would significantly                  invested in extracting over the coming                        fuels together. The first step would be to
    reduce the risks of unstoppable runaway                       decades: The necessary wells have been                        stop digging a deeper hole by ceasing to
    climate change.22                                             (or are being) drilled, the pits dug, and                     issue licenses and permits for new oil, gas,
                                                                  the related infrastructure built.                             and coal extraction projects (i.e., to stop
    Climate science shows us that cumulative                                                                                    pushing the developed reserves bar in
    CO2 emissions over time are the primary                       The licenses, permits, sunk capital,                          Figure 1 even higher).
    determinant of how much global warming                        and related infrastructure that go into
    will occur. Based on the evolving study                       developing extraction projects create                         But stopping new projects alone will not
    of this relationship, scientists are able                     a “carbon lock-in” effect, meaning the                        be enough to keep warming well below
    to estimate the level of total cumulative                     oil, gas, and coal shown in Figure 1 will                     2°C. Governments must also phase out
    CO2 emissions that can occur for a given                      be more politically, legally, and                             a significant number of existing projects
    temperature limit. These cumulative totals                    economically difficult to leave in the                        ahead of schedule. These findings show
    – called a “carbon budget” – indicate a                       ground, compared to reserves that                             that managing the phase-out of gas from
    set limit to how much fossil fuel can be                      have not yet been developed.                                  our energy system – in tandem with
    extracted and burned to meet global                                                                                         other fossil fuels – is key to meeting the
    climate goals.                                                                                                              Paris goals.

    e These conclusions account for optimistic estimates of future land use and cement manufacture emissions, which are the largest sources of non-energy emissions and more difficult to
      reduce than energy-sector emissions. The methodology and assumptions behind these estimates are detailed in: Greg Muttitt, The Sky’s Limit: Why the Paris Climate Goals Require A
      Managed Decline of Fossil Fuel Production, Oil Change International, September 22, 2016, http://priceofoil.org/2016/09/22/the-skys-limitreport/, Appendix 2, p. 47.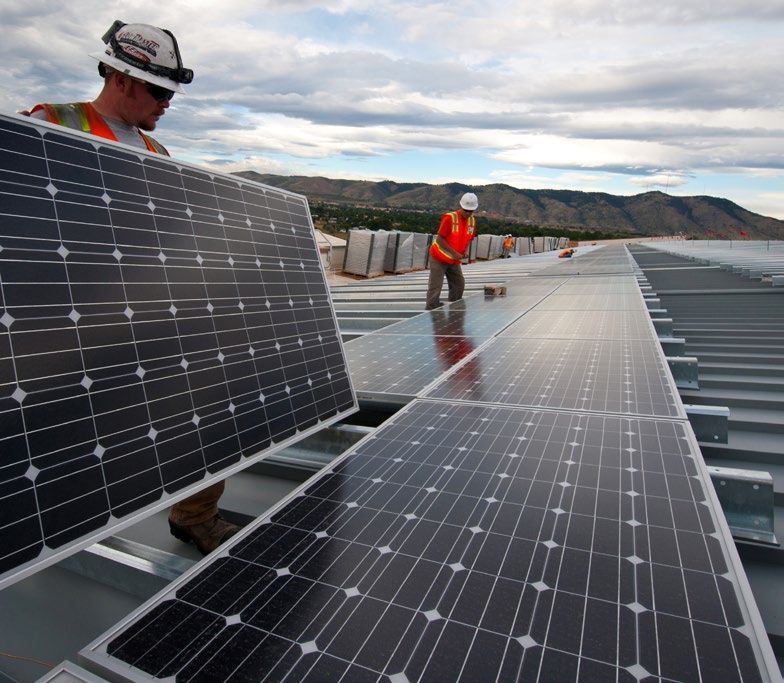
2. COAL-TO-GAS                                                             Yet the myth persists: Gas is widely                           ran a scenario in which a phase-out                      7
   SWITCHING DOESN’T CUT IT                                                   promoted as a means to reduce emissions                        of coal in the power sector by 2035 is
   Power Sector Climate Goals                                                 in the power sector by replacing coal-                         implemented.30 They measured how this
   Cannot Be Met with More Gas                                                fired power plants with those running on                       would affect power generation from gas
                                                                              gas. The extent of emissions reductions                        and renewables assuming current market
   Over 40 percent of the world’s gas is                                      achieved by such fuel switching depends                        dynamics and no other policy changes.
   consumed in the power sector today,                                        on many variables, including methane
   producing around 23 percent of the                                         leakage, the technologies the plants use,                      The results suggest that gas would fill
   world’s electricity. 24 No other sector                                    and the remaining economic lifetime of                         around 70 percent of the void left by coal,
   burns as much gas. In the United States,                                   the plants being replaced. In all scenarios,                   while solar and wind would replace the
   the power sector accounts for about 39                                     however, it is clear that coal-to-gas                          rest. This would achieve significant carbon
   percent of gas consumption.25                                              switching will not deliver the scale or                        emissions reductions compared to business
                                                                              pace of emissions reductions required to                       as usual.f But the projected level of gas
   The power sector represents the low-                                       achieve climate goals, even if methane                         generation locks in emissions such that
   hanging fruit for decarbonization and                                      leakage is kept to a minimum.                                  by 2050, emissions remain substantially
   plays an additional role in decarbonizing                                                                                                 above thresholds consistent with the Paris
   other sectors via electrification of currently                             Current projections of how the global                          goals (see the purple line in Figure 2). Note
   non-electrified sectors, i.e., transport,                                  electricity sector is transitioning to cleaner                 that BNEF measured this outcome against
   heating and cooling systems for buildings,                                 energy sources show progress, but the                          limiting warming to 2°C (see the green line
   and industrial heat. The IPCC’s report on                                  sector remains a long way from aligning                        in Figure 2), a threshold that carries extreme
   pathways to 1.5°C states that, “[s]ince                                    with climate goals. For example, the                           risks, rather than the Paris Agreement’s
   the electricity sector is completely                                       Bloomberg New Energy Finance (BNEF)                            goals of keeping warming well below 2°C
   decarbonized by mid-century in 1.5°C                                       New Energy Outlook 2018 (NEO 2018)                             and pursuing a 1.5°C limit.
   pathways, electrification is the primary                                   projects that renewable energy is currently
   means to decarbonize energy end-use                                        on course to provide nearly 50 percent                         If climate goals are to be met, any effort
   sectors.”26 In other words, a genuine                                      of power generation globally by 2050.29                        to phase out coal must be accompanied
   decarbonization strategy will entail                                       This leads to a 36 percent decline in power                    by policies to constrain gas and support
   eliminating fossil fuels from the power                                    sector emissions from 2017 levels by 2050                      zero-carbon generation. As Matthias
   sector while electrifying these other                                      (see the blue line in Figure 2). However, this                 Kimmel of BNEF stated, “[e]ven if we
   sectors so that eventually, the maximum                                    is well short of the emissions reductions                      decommissioned all the world’s coal plants
   possible proportion of energy is supplied                                  needed.                                                        by 2035, the power sector would still be
   by a combination of clean energy                                                                                                          tracking above a climate-safe trajectory,
   resources generating electricity. 27, 28                                   But what if the phase-out of coal is                           burning too much unabated gas. Getting
                                                                              accelerated with the help of more gas-                         to two degrees requires a zero-carbon
                                                                              fired generation? BNEF analysts also                           solution.”32

   Figure 2: Global Power Sector Emissions in BNEF Scenarios
                      16,000

                          14,000

                          12,000
                                                                                                                                                                 NEO 2018
Million Metric Tons CO2

                      10,000

                          8,000
                                                                                                                                                 Coal phase-out
                          6,000

                          4,000
                                                                                                                                                             NEO 2018 2 degrees
                           2,000

                              0
                              2012            2017        2020                2025                   2030                  2035                   2040                  2045                   2050
   Source: Bloomberg New Energy Finance, 2018                       31

   f               Note that BNEF is only measuring emissions at the chimney stack. Methane leakage associated with gas production, processing, storage, and transport will mean that the actual
                   reductions achieved in this scenario are less than stated.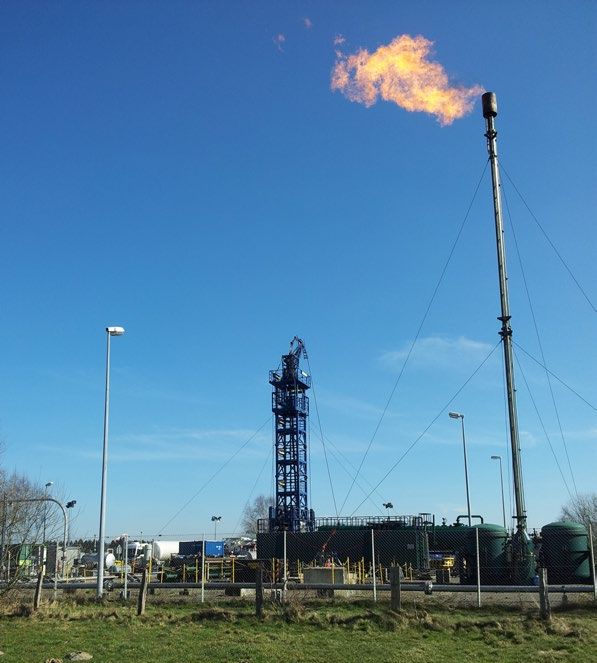
8   Figure 3: Global Gas Pathways: Business-as-usual extraction vs. demand aligned with 1.5°C
                                     200
                                                  IPCC P1 Pathway   IPCC P2 Pathway        Gas Production (current policies)
                                     180

                                     160
    Gas Primary Energy – Exajoules

                                                                        Business-as-usual gas production
                                     140

                                     120

                                     100
                                                                        1.5°C pathways
                                                                        (low neg. emissions)
                                      80

                                      60

                                      40

                                      20

                                      0
                                           2010                      2020                           2030                                   2040                                      2050

    Source: IPCC/IAMC 1.5°C Scenario Explorer and Data hosted by IIASA (Release 1.1)34 and Rystad Energy AS UCube (April 2019)

    Not Just Power: Business-as-                                            the P1 and P2 pathways in the IPCC report,           Carbon Capture and Storage
    Usual Gas Production Drastically                                        shown in the red and orange lines in Figure          (CCS): A Dangerous Bet
    Overshoots Climate Models                                               3. The P1 pathway excludes reliance on
                                                                            unproven negative emissions technologies             Representatives of the oil and gas industry
    Decarbonizing the power sector – by                                     to suck CO2 out of the atmosphere.g The              frequently argue that increasing gas use
    shifting from coal and gas to renewables                                P2 pathway includes limited amounts of               well into the future, or at least maintaining
    by mid-century – is key to rapidly reducing                             unproven negative emissions technologies.            a much slower decline, is still consistent
    climate pollution. But gas use must begin                               By contrast, the blue line shows a                   with climate goals.35 They generally
    winding down in other sectors as well to                                projection of business-as-usual global gas           make their case by including large-scale
    avoid climate breakdown.                                                extraction – if the industry continues to            deployment of commercially unproven
                                                                            build new infrastructure and open up                 technologies in their models. These
    The recent IPCC Special Report features                                 new fields.h                                         are typically both carbon capture and
    four illustrative pathways to achieving                                                                                      storage (CCS) and bioenergy with CCS
    the 1.5°C target, with varying degrees                                  Clearly, industry plans to continue building         (BECCS), a technology conceived of by
    of reliance on “negative emissions”                                     out new gas infrastructure are far out               energy models to sequester CO2 in trees,
    technologies and alignment with                                         of line with the necessary decline of                burn them for energy, and capture the
    development goals.33                                                    global gas use, starting in 2020, shown              emissions.
                                                                            in pathways to limit warming to 1.5°C.
    In Figure 3, we show the trajectory                                     In the P1 pathway, which takes the most              Scientists Kevin Anderson and Glen Peters
    for global gas consumption in the two                                   precautionary approach to unproven                   conclude that bioenergy production
    illustrative pathways with the lowest                                   technologies, gas consumption falls by               and CCS “both face major and perhaps
    reliance on negative emissions and closest                              74 percent below 2010 levels by 2050.                insurmountable obstacles.”36 Given most
    alignment with sustainable development                                  In both 1.5°C-consistent pathways, gas               of the few CCS pilot projects to date have
    and reduced inequality. These are called                                consumption falls by 3 to 5 percent per              proved more costly and less effective
                                                                            year on average between 2020 and 2050.

    g While not relying on carbon capture and storage (CCS) or BECCS, the P1 pathway does rely on sequestration of 246 billion tons of CO2 through planting forests. Without reliance on
      significant afforestation, the gas declines shown in Figure 3 would need to occur even faster.
    h To compare with demand trajectories given by the IPCC, we exported data from the Rystad Energy Ucube database in energy-equivalent units. The variation in historical gas use
      between the lines in Figure 3 is likely due to differences in energy accounting between Rystad’s production-based data and the demand-based primary energy data in integrated
      assessment models. Note that the IEA’s New Policies Scenario projects almost double the growth in gas production compared to the Rystad projection (WEO 2018).
than hoped,i many analysts now consider 9
BOX 2: Renewable Gas: No Excuse for Expansion
that wind and solar power, which are
proven technologies, are likely to remain The gas industry is finding new ways to To produce on a large scale, it would
cheaper than CCS, even if CCS technology push its agenda. In Europe especially, also compete with agriculture and
improves. Large-scale reliance on BECCS, the gas industry claims that the pipelines forestry over land use, reducing its
which exists to date primarily in theoretical and other gas infrastructure it wants to sustainability.
models, would require converting land to build will one day be used to process and
grow bioenergy instead of food, risking transport so-called renewable gas.38 > Hydrogen: Hydrogen is emissions-
large-scale food shortages, unsustainable free when burned, but it has to be
freshwater use, and massive habitat While non-fossil forms of gas could manufactured. Its pollution footprint
conversion: For example, offsetting a play a limited, intermediate role in depends on how it is produced.
third of today’s fossil fuel emissions would decarbonizing hard-to-electrify sectors Today, most hydrogen is made via the
require land equivalent to up to half of the like heavy industry, this transition combustion of fossil fuels. Hydrogen
world’s total crop-growing area.j would still require reducing overall gas can be produced from renewable
use to serve climate goals. Analysis electricity. But this “power-to-gas”
By promoting increasing reliance on gas, by the International Council on Clean technology is expensive and exists so
the oil and gas industry is asking the Transportation found that renewable far only in pilot project form. Because
world to make an incredibly dangerous methane could play “a small role” in hydrogen is a smaller molecule than
bet on uncertain technologies that pose decarbonizing the European Union’s methane, existing gas pipelines,
significant risks to society and ecosystems. economy by 2050 but “cannot represent storage facilities, and appliances
If negative emissions technologies do not the primary strategy for decarbonizing would need to be overhauled to
work out, climate change will be locked an entire sector.”39 use it. Hydrogen can technically be
in. In fact, the recent IPCC report warns converted to synthetic methane to
that, “[Carbon dioxide removal] deployed The energy think tank E3G notes, adapt to existing infrastructure, but
at scale is unproven, and reliance on such “None of the Paris-compliant scenarios that process requires adding CO2,
technology is a major risk in the ability with renewable or decarbonised gas increasing costs and pollution while
to limit warming to 1.5°C.”37 It is far safer show increasing gas demand, and decreasing efficiency.
to reduce emissions in the first place – most of them show a sharp decline in
and that means planning for the phase-out gas volumes compared to today. This > Gas with carbon capture and storage
of gas. suggests there is no justification for (CCS): Using CCS to strip CO2 from
the expansion of the gas networks fossil gas cannot be considered
[emphasis added].”40 “renewable,” but some industry
proponents lump it into this category.
Furthermore, the term “renewable gas” CCS could reduce CO2 pollution
can be misleading. The industry uses emitted when converting gas to
it as a catch-all to refer to a variety of hydrogen. CCS could also be used
production processes and end products to reduce emissions from biogas
– including some still derived from fossil or biomethane. CCS itself remains
gas – all with differing implications for an uncertain, risky, and still-costly
future pollution, cost, and infrastructure. technology (See above).
These include the following41:
The high costs, technical limits, and
> Biogas/biomethane: Both terms refer climate and environmental risks of these
to gas produced through anaerobic technologies suggest they have a highly
digestion of organic matter such as limited, specialized role to play in genuine
manure, sewer sludge, landfill waste, decarbonization – if they have a role
or biomass grown for the purpose. at all. According to E3G analysis of the
Biomethane is the “upgraded” form European context, estimates of the total
of biogas. This process involves potential of renewable gases (excluding
removing some of the CO2 so that its fossil gas-derived forms) “represent a
i For example, the world’s first industrial-scale CCS
project, the Sleipner project in Norway, started in 1996 composition is similar to fossil gas, fraction of the current gas consumption,
and was assumed to be safe until it was discovered to
have fractures in its caprock in 2013. The Boundary enabling its transport via existing even in 2050.”42 The principle solutions
Dam project in Canada, the first to install CCS at a
power station, was exceptionally expensive to build gas infrastructure. Biomethane is still for decarbonization beyond the power
and has struggled to operate as planned, suffered
considerable cost overruns, and been forced to pay methane. It emits CO2 when burned sector lie in electrifying transport,
out for missing contractual obligations.
j Twelve billion metric tons of carbon dioxide extracted and can leak from pipelines and heating, and industry and increasing
per year is estimated to require a land area devoted to
bioenergy of 380 to 700 million hectares, equivalent other infrastructure like fossil gas. energy efficiency to reduce demand.
to 25 to 46 percent of total world crop-growing area.
Pete Smith et al., “Biophysical and economic limits to
negative CO2 emissions,” Nature Climate Change 6,
2015, p. 5, https://doi.org/10.1038/NCLIMATE2870.10
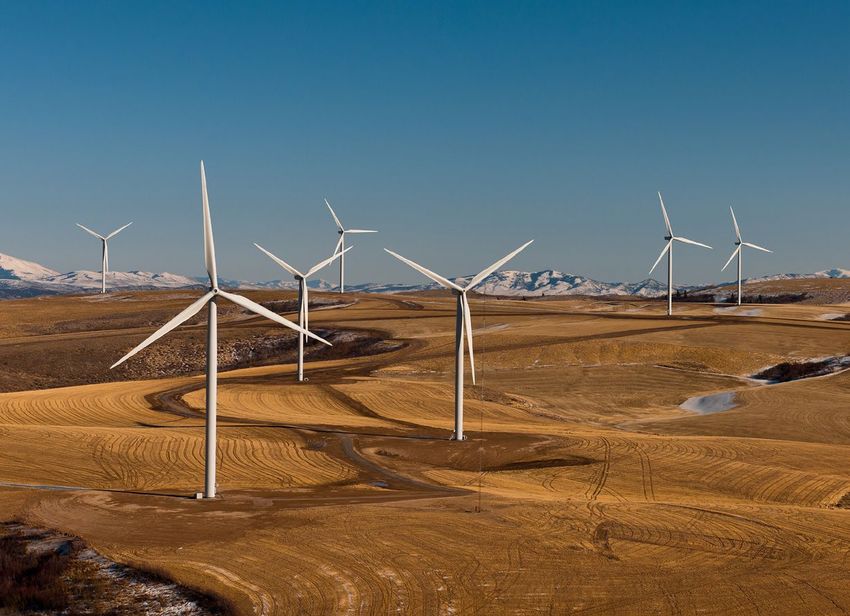
Wind turbines in Power County, Idaho, U.S. ©U.S. Department of Energy.
3. LOW-COST RENEWABLES Even in regions of the United States where such clean energy portfolios, policymakers
CAN DISPLACE COAL solar and wind are not yet lower cost than can step in. They can develop resource
AND GAS gas, we have reached the point where deployment pathways that grow these
The bridge fuel idea is erroneously an energy system based on renewables portfolios over time, developing balanced,
based on the assertion that only gas can will lower costs everywhere. As studies reliable, and low-cost combinations of
affordably replace coal on a large scale in have shown, portfolios of clean energy renewables, energy storage, flexible load,
the short to medium term. While cost has resources will be needed to replace and other complementary resources
been a constraint in the past, today, wind dispatchable fossil fuels.45 Such portfolios while also electrifying buildings and
and solar are the cheapest forms of bulkk will include variable renewables, flexible transportation. Consumers will benefit
energy supply in most major markets.43 load, storage, transmission, and the from lower energy costs. This cost
As these technologies continue to gain gradual electrification of buildings and advantage will only grow over time.
from increasing economies of scale and transportation. Modeling has shown that
implementation experience, the cost and clean energy portfolios will produce a
performance of wind and solar power lower-cost energy system than the status
is only set to improve.44 This means that quo gas-dependent system.46
renewable energy can and does replace
coal as bulk generation while saving While many energy markets are not
consumers money. currently designed to identify and support
k See Box 3 for definition of bulk generation.11
BOX 3: Three Broad Types of Power Generation
We describe three categories of power generation technologies, that are paired with storage capacity can be partially
based on BNEF47, as follows: dispatchable.
> Bulk Generation: Technologies that can supply large > Peaking and Flexibility: Technologies that provide quick
amounts of cheap energy, including wind and solar, as well as response and can be dispatched when needed, including
Combined Cycle Gas Turbinel (CCGT) plants, coal, nuclear, open cycle gas turbines (OCGT) and gas reciprocating
and large hydro. engines (GRE), as well as utility-scale batteries, demand
> Dispatchable Generation: Technologies that offer bulk response, and pumped-storage hydro. Wind and solar
generation but can be dispatched when needed, including combined with battery storage can also be used as flexible
coal, CCGT, nuclear, and large hydro. Wind and solar plants generation.
Falling Costs 88 percent and 69 percent, respectively, Disruption
since 2009.48 Despite the LCOE for gas-
The burgeoning competitiveness of fired CCGT declining by 30 percent in These steep and ongoing cost declines
utility-scale wind and solar generation has the same period, wind and solar are now upend a key aspect of the bridge fuel
been documented by at least two energy cheaper on average (see Figure 4). The myth. Wind and solar are now able to
analyst teams that have each tracked the clear implication is that wind and solar challenge the dominance of coal in many
remarkable decline in the cost of these are not only cleaner but also more cost- major markets. The high cost of imported
technologies over the past decade. They effective choices for replacing coal-fired gas in Asia and Europe, coupled with the
do this by calculating the Levelized Cost of power, and they can also replace gas. effect of zero fuel-cost renewable energy
Energy (or Electricity) (LCOE) for different on fossil fuel plant utilization rates, disrupts
power generation technologies. This is In March 2019, BNEF’s LCOE report stated, the economic case for new gas plant build.
the unsubsidized cost per unit of energy “The relentless decline of solar and wind
produced of financing, building, and costs has made these technologies the As renewable energy capacity increases
operating power plants. cheapest sources of new bulk electricity and its distribution improves, fossil fuel
in all major economies, except Japan. This plants are switched on for less time
Financial advisor firm Lazard has published includes China and India, where not long because the energy produced by wind and
an annual LCOE report for more than a ago coal dominated capacity additions, solar is free at the point of generation. This
decade. The 2018 report found that the as well as the U.S. where the shale gas means fossil fuel plants designed to operate
average global unsubsidized LCOE for revolution has made gas cheap and for extended periods are increasingly used
utility-scale solar and wind has dropped abundant.”50 below their optimal utilization rates, known
as the capacity factor.
Figure 4: Wind and Solar Are Cheaper than Coal and Gas: Mean Global Levelized Cost of Energy for Select Technologies
$400
Wind (-69%) Solar PV (-88%) Gas CCGT (-30%)
359 Coal (-9%) Gas Peaker (-35%)
$350
$300
275 Gas losing to wind & solar
Mean LCOE $/MWh
$250
$200
179
$150
135
111
$100 102
83
58
$50 43
42
$-
2009 2010 2011 2012 2013 2014 2015 2016 2017 2018
Source: Lazard 201849
l Also known as Natural Gas Combined Cycle (NGCC).12 Figure 5: Historical and Projected Average Utilization Rates for CCGT Plants in Select Countries in BAU Scenario
100%
90%
80%
Optimal Utilization Range
70%
60%
United States
50%
Germany
40%
United Kingdom
China
30%
20%
India
10%
29
38
26
40
28
33
35
25
23
22
14
32
37
16
19
27
18
31
15
30
13
21
20
12
17
34
36
39
24
20
20
20
20
20
20
20
20
20
20
20
20
20
20
20
20
20
20
20
20
20
20
20
20
20
20
20
20
20
Source: Bloomberg New Energy Finance, New Energy Outlook 2018
Figure 5 shows historical and projected raises challenges to both the economic being built and planned in the United
annual capacity factors for CCGT plants and climate justifications for the massive States and elsewhere, much of which
in five major markets. In the United Liquefied Natural Gas (LNG) capacity targets the Asian market (See Box 4).
Kingdom, Germany, India, and China,
capacity factors have been well below Workers install solar panels in the U.S. ©U.S. Department of Energy/Schroeder.
the optimal level since at least 2012, and
are projected to stay there through 2040.
In the United States, capacity factors
have been close to the lower end of the
range and are projected to remain just
below the optimal range through the
same period, despite U.S. wholesale gas
prices being among the lowest in the
world. Note that these projections are
from the business-as-usual case shown
in Figure 2 (blue line), in which global
emissions remain far above a weak
interpretation of the Paris climate goals.
Low capacity factors raise the LCOE for
new CCGT plants, and can be a factor in
them losing out to wind and solar on a
cost basis. Figure 6 compares the current
LCOE for new generation in China and
India. It is clear that utility-scale wind and
solar have emerged as winners in the
competition to provide the cheapest bulk
power in these major emerging markets
that are currently dominated by coal.
Cost is clearly not a prohibitive factor to
adding renewable generation capacity,
whether to replace fossil fuel capacity
or meet rising demand. This additionallyFigure 6: Current LCOE of New Bulk Generation in China and India 13
$120
CHINA INDIA
$100
$80
$/MWh
$60
$40
$20
$-
Non-tracking Onshore Coal CCGT Non-tracking Onshore Coal CCGT
PV wind PV wind
Source: Bloomberg New Energy Finance, 1H-2019 LCOE Update
BOX 4: LNG: Making the Problem Worse
Liquefied Natural Gas (LNG) is fossil gas that is cooled to –162°C kept at very low levels – well below two percent, depending on
(–260 degrees Fahrenheit) to reduce volume and facilitate shipping distance and other factors – replacing coal with LNG will
shipping across oceans. On arrival, the liquefied gas is generally result in increased greenhouse gas emissions.52
regasified to be further transported by pipeline to its final
destination. But it is also dangerous to assume that LNG exports
automatically lead to the displacement of coal in destination
As might be expected, this intense process requires a lot of markets. A paper published in November 2017 in the international
energy. Electricity and gas are generally used to power the plants journal Energy studied this issue in detail, examining scenarios in
that chill the gas into LNG. Where gas is used, it is estimated that which U.S. LNG is exported to Asia.53 The study found that the
six to 10 percent of the gas processed is required for powering displacement of coal by LNG exports is far from a given, and that,
the plant.51 Additional energy is required for shipping and as a result of U.S. exports of LNG, “greenhouse gas emissions
regasification. are not likely to decrease and may significantly increase due
to greater global energy consumption, higher emissions in the
So, the LNG process adds a significant amount to the full lifecycle United States, and methane leakage.”54
emissions of producing and using gas. If methane leakage is not14 4. GAS IS NOT ESSENTIAL policy and power market design, not Further, CCGT plants are generally
FOR GRID RELIABILITY adding or maintaining fossil fuel capacity. operationally and economically optimal
As renewable energy costs have declined, at high utilization rates between 60 and
eroding the economic case for new gas > Policymakers can drive the adoption 90 percent (see Figure 5 above). These
development, gas industry advocates have of complementary resources that factors mean that as increasing amounts
increasingly emphasized the variability of enable the integration of high levels of of wind and solar are placed onto the
wind and solar as the reason to build more renewables while maintaining reliable grid, the economics of CCGT plants are
gas capacity. The sun does not always electric service at low costs. challenged. In other words, rather than
shine, and the wind does not always blow, enabling higher penetration of wind and
and therefore – they argue – gas-fired CCGT – The Wrong Technology solar, CCGT plants are threatened by it.
generation is needed to balance supply for the Energy Transition As new, more flexible, cost effective, and
and demand. But gas advocates are clean technologies come on stream, the
misleading the public on the role of gas The vast majority of gas-fired generation addition of new CCGT capacity is unlikely
in an electricity system dominated by capacity being built today uses CCGT to be the best solution for the flexibility
renewable energy. The reality is that there technology. In the United States alone, requirements of a clean energy grid.
are many choices for balancing wind and around 24 gigawatts (GW) of CCGT
solar on the grid, and gas is losing ground capacity was commissioned in 2017 and Batteries Challenge Gas ‘Peakers’
to cheaper, cleaner, and more flexible 2018, and more than 14 GW was under
alternatives. In summary: construction at the beginning of 2019.55 The gas-fired technologies that are more
There is more than 425 GW of CCGT suited to providing flexible generation
> Most of the gas generation capacity capacity in operation globally.56 capacity – gas reciprocating engines
being built today uses Combined Cycle (GRE) and Open Cycle Gas Turbines
Gas Turbine (CCGT) technology. With its two-cycle system of directing (OCGT) – are often referred to as peakers,
CCGT technology is challenged by heat from a gas turbine to a steam turbine, as they are designed to operate during
increasing renewable energy, rather CCGT is the most efficient and cost- periods of peak demand. They have faster
than enabling it. effective gas-fired generation technology response times compared to CCGT, but are
for producing large amounts of energy. 57 slower than batteries (see Figure 7).
> Other types of gas generators, known But because most CCGTs take a relatively
as peakers, are already being challenged long time to ramp up to full power – The immediate response capability
on cost by battery storage. at least 25 minutes – they are not as well of batteries is just one advantage the
suited or as economical for providing technology has over gas peakers. They
> With multiple technologies already the flexibility needed to balance large are also cheaper over the lifetime of
available, managing grids with high amounts of variable renewable generation their operation. Utility-scale batteries are
renewable energy penetration is about (see Figure 7). already competitive with gas peakers
Figure 7: Ramp-up Times for New Power Plants
Maximum
load BATTERY GRE OCGT CCGT
COAL
Minimum
load
0 5 10 15 20 25 30 35
Response requirement (min.)
Source: Bloomberg New Energy Finance, 2H 2018 LCOE Updatem
m Ramp-up times assume a hot start.in some major global markets, such allows the plant to provide load-shifting As battery technology evolves and 15
as Australia, Japan, and the United services, giving these plants access installed capacity grows, additional gas-
Kingdom.58 As the combination of to high-value hours when they might fired generation is not needed. As BNEF
accelerating demand for both electric otherwise be offline.59 Combining wind or recently stated, “[t]he economic case
vehicle and stationary uses triggers solar with battery storage enhances both for building new coal and gas capacity is
increasing economies of scale, costs the profitability and utility of these clean crumbling, as batteries start to encroach
are set to decline rapidly in the coming energy power plants. on the flexibility and peaking revenues
decade and beyond. enjoyed by fossil fuel plants.”63
BNEF reports that wind and solar plants
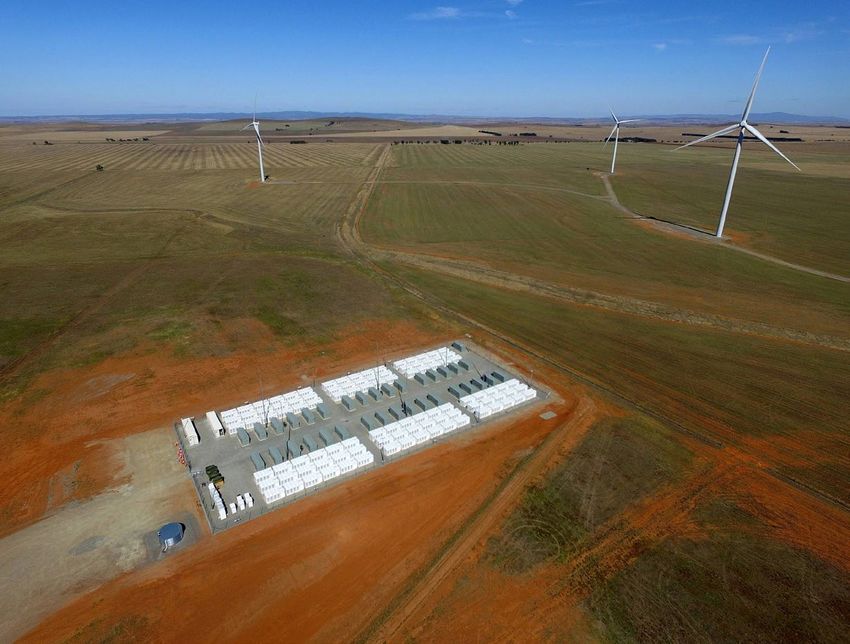
In the United States, the LCOE of stand- with onsite battery storage are already With clean energy technologies beating
alone utility-scale batteries is currently able to compete with new coal or gas gas on costs, flexibility, and emissions, it is
above gas peakers, primarily due to the plants on an LCOE basis in Germany, the imperative that policymakers avoid picking
low cost of gas. But while gas peaker United Kingdom, China, Australia, and the gas as the winner in the race to support
costs are set to rise over the next decade, United States.60 They note, “these projects variable renewable energy as the transition
battery costs are set to decline more than cannot displace fossil fuel plants entirely, to clean energy gathers pace. In order to
55 percent by 2030. By 2023, four-hour but they are able to eat into their run-hours accelerate the clean energy transition, they
stand-alone batteries are projected to be and negatively affect their economics.”61 must proactively design power systems
cheaper to build and operate than both and power markets that optimize a suite of
OCGT and GRE gas peaker technologies The key issue for batteries today is the truly clean technologies and resources that
in the United States (see Figure 8). duration for which they can discharge. can meet reliability requirements with the
The most common systems being lowest emissions and costs.
The emergence of batteries as an installed today have durations of between
increasingly affordable and capable one and four hours. The forecast in High levels of clean energy generation
technology for storing energy has Figure 8 is based on four-storage-hour are possible and affordable today, and
implications for the clean energy systems.n Gas peakers can, of course, are only going to become cheaper and
transition beyond their stand-alone operate for as long as needed given more reliable over time. Managing the
flexible generation capacity. Batteries uninterrupted fuel supply. But a study by challenges raised by transitioning to clean
can be co-located with utility-scale wind Wood Mackenzie in 2018 found that six- energy will require state and wholesale
and solar plants, storing excess power and eight-hour battery storage systems, market policies that incentivize the
when sunshine and wind are abundant, which are beginning to enter commercial right combination of solutions. The key
and effectively allowing a proportion operation today, can address 74 percent problem to solve is climate change, which
of a wind and solar plant’s capacity to and 90 percent of peaking demand, can only lead to substantial reductions in
be dispatchable. This technology also respectively.62 gas use.
Figure 8: Projected LCOE of Battery Storage and Gas Peakers – United States
$180
Utility Scale Battery (4hr) OCGT GRE
$160
$140
$120
$/MWh (Real 2018)
$100
$80
$60
$40
$20
$-
40
28
33
35
25
23
22
20 1
44
32
37
19
27
46
50
20 1
48
49
30
20 1
20
20 3
45
34
42
36
29
38
39
24
26
47
4
3
2
4
20
20
20
20
20
20
20
20
20
20
20
20
20
20
20
20
20
20
20
20
20
20
20
20
20
20
20
20
Source: Bloomberg New Energy Finance, 1H-2019 LCOE Update
n I.e. systems designed to supply power at maximum capacity for 4 hours.16
Solar photovoltaic array in Montezuma County, Colorado, U.S. ©U.S. Department of Energy/Schroeder.
Power Market Design Is Key to even though they could provide value. In These policymakers can develop
the Clean Energy Transition other instances, market rules designed resource deployment pathways that
to accommodate certain technologies or grow clean energy portfolios over time,
High levels of renewables are disrupting contract structures limit the ability of grid developing balanced, reliable, and
current energy markets. Two-thirds operators to tap those resources.”65 low-cost combinations of renewables,
of the U.S. electric load is served by energy storage, flexible load, and other
Regional Transmission Organizations Renewables have also lowered energy complementary resources, while also
(RTOs) that provide competitive markets prices for all generators. Most competitive electrifying buildings and transportation.
for electricity.64 In the United States and power markets are based on power
around the world, a myriad of competitive generators bidding their electricity into The International Renewable Energy
markets exist, each with rules that govern a market. At times of high demand, bids Agency (IRENA) states that in order to
markets for energy services, ancillary from more expensive sources of power are maximize renewable energy capacity
services, and capacity. These markets accepted and all generators are paid the and foster the solutions to wind and solar
were designed for centralized generation highest accepted bid price. During periods variability, policymakers must support
that is dispatched to meet predictable of low demand, only the cheapest sources investment in a suite of technologies,
demand. It is increasingly clear that power are compensated for supplying the grid. none of which include gas. To do this,
market design will need to evolve to policymakers and regulators need to
take advantage of low-cost variable Renewable energy is disrupting this “(p)romote innovative business models
renewable energy. model.66 As wind and sunshine are free, that enhance the system’s flexibility and
renewable energy has low marginal incentivise deployment of renewable
In many regions, current power market running costs. In competitive power technologies. Examples include virtual
rules are an obstacle to the growth of markets, wind and solar are pushing power plants, innovative forms of power
renewable resources and complementary wholesale power prices down and purchase agreements, platform business
resources such as demand response reducing revenues for all generators. models such as peer-to-peer trading, and
and storage. Energy experts at Energy Indeed, far from being expensive for business models that enhance demand
Innovation point to a number of near- consumers, the rise of wind and solar has side response.”68
term changes that would provide greater led to lower consumer costs by lowering
flexibility in wholesale markets. “Simple the floor for wholesale energy prices.67 These are just a few examples of
changes to market rules could unlock a innovations in energy market development
significant amount of flexibility for RTOs. Policymakers in many regions, including and management that are making
In some instances, existing market rules, U.S. states, have significant authority headway today, and must be adopted
even when well intentioned, preclude to influence the generation mix serving more widely to truly enable the transition
certain resources from offering services their state or regional electric grid. to clean energy.5. NEW GAS The Center for Sustainable Energy However, economics is the prime factor at 17
INFRASTRUCTURE LOCKS found that for potential gas power work when capital-intensive infrastructure
IN EMISSIONS plants applying for permits in California has been built. Once capital has been sunk,
Gas-fired power plants and related between 2016 and 2020, most would be operators can keep running a plant as
infrastructure such as pipelines and operating beyond 2050 based on average long as it can sell power for more than the
LNG terminals require large, up- permitting and operating periods in that marginal cost of producing it – even
front multibillion-dollar investments. state.73 The report points out that this if it incurs a loss on the invested capital.
Such investments are economically would be a threat to California’s plans for For this reason, the lower cost of new
predicated on producing revenue for decarbonization. wind and solar capacity does not
several decades.69 Building more gas guarantee the early retirement of dirtier
infrastructure today risks locking in The problem of carbon lock-in describes fossil fuel capacity.
emissions from gas for many decades to a feature of fossil fuel infrastructure that
come. Every new gas-fired power plant tends to persist over long timeframes For the clean energy transition to
we build, along with the pipelines and and lock out alternatives due not only accelerate, it is crucial to cease investment
associated infrastructure to serve it, is to economics, but also technical and in polluting energy sources and do
making it more difficult to decarbonize institutional factors.74 everything feasible to encourage zero-
by 2050, as the IPCC states we must.70 carbon sources to grow to meet emissions
Regulated utilities in the United States targets. At this late stage in the depletion
According to a database of global power- are incentivized to build infrastructure of carbon budgets, it is necessary to move
generating units, there are more than 1,100 by a system that guarantees high returns straight to zero-carbon energy and avoid
gas-fired generators rated over 5MW, built by passing the cost and risk of new locking in further emissions before it is
in or before 1970 that are still in operation infrastructure onto ratepayers.75 While too late.
today; over 400 of these are in the United this system can be utilized to support
States.71 In 2014, the Interstate Natural clean energy, in recent years it has been
Gas Association of America reported that extensively used by utilities to build large
60 percent of the country’s interstate interstate gas transmission pipelines that
gas transmission pipeline network was have only served to lock in gas supply
installed prior to 1970.72 Once it is built, gas during a period in which the transition to
infrastructure can last a very long time. clean energy must proceed apace.76
Fracking for fossil gas in the Marcellus Shale formations in Pennsylvania, U.S. ©Les Stone/Greenpeace.You can also read