Carbon Footprint of Housing in the Leeds City Region - A Best Practice Scenario Analysis 2008 - OSTI.gov
←
→
Page content transcription
If your browser does not render page correctly, please read the page content below

Future Sustainability Programme - Policy Paper

                                  Carbon Footprint of Housing in the Leeds City
                                     Region – A Best Practice Scenario Analysis

                                                     John Barrett and Elena Dawkins

2008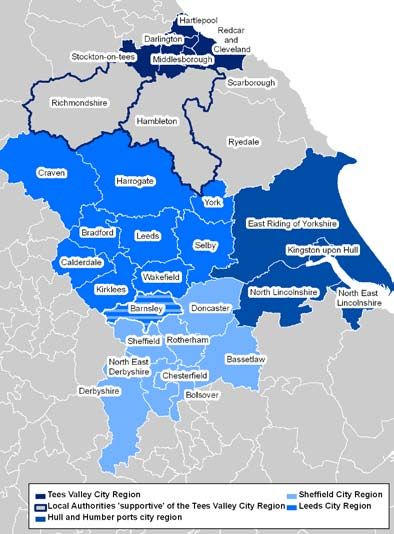
Carbon Footprint of Housing in the
     Leeds City Region – A Best Practice
     Scenario Analysis

     John Barrett and Elena Dawkins

     Commissioned by the Environment Agency

     Stockholm Environment Institute
     Kräftriket 2B
     106 91 Stockholm
     Sweden
     Tel: +46 8 674 7070
     Fax: +46 8 674 7020
     E-mail: postmaster@sei.se
     Web: www.sei.se
     Publications Manager: Erik Willis
     Web Manager: Howard Cambridge
     Layout: Richard Clay
     Cover Photo: Winter sunrise, Otley Road Leeds ©RClay

     Copyright © 2008 by the Stockholm Environment Institute

     This publication may be reproduced in whole or in part and in any form for educa-
     tional or non-profit purposes, without special permission from the copyright holder(s)
     provided acknowledgement of the source is made. No use of this publication may be
     made for resale or other commercial purpose, without the written permission of the
     copyright holder(s).

ii
Contents
Executive Summary iv
Introduction 1
Scope of this report 2
Policy Targets for GHG Reduction 3
Profile of Leeds City Region 4
Results from Other Studies 6
Using Reap For an Environmental Assessment of the Leeds City Region
RSS Housing Policy 6
Regional Strategies and Climate Change – Evaluating the Contribution
that Key Regional Strategies Make Towards Addressing Climate Change 6
What is a “Continuing Trends Scenario? 7
Continuing Trends Scenario 7
Continuing trends results 8
What would the total CO2e emissions be in 2026 to achieve an 80%
reduction by 2050? 9
Measures to Achieve the Target 10
Introduction 10
Measure 1: Building Better New Homes (regional best practice) 10
Measure 2: Retrofit of Existing Homes (regional best practice) 13
Measure 3: Further Retrofit Reductions (External Wall Insulation) 16
Measure 4: Behavioural Change 17
Measure 5: Low and Zero Carbon Technologies 19
Measure 6: Selective Demolition and Rebuild 22
Potential Policy Mixes 24
Policy mix 1: best practice applied throughout the City Region 25
Policy mix 2, 3 and 4: the path for achieving the 80% reduction target 26
Policy Implications 28
Appendix 1: Workshop Feedback on New Builds 30
Appendix 2: Retrofitting 32
Appendix 3: Behavioural Change 34
Appendix 4: Low / Zero Carbon Technologies 36
Appendix 5: Table of Assumptions made for Each Measure 38
iiiCarbon Footprint of Housing in the Leeds City Region – A Best Practice Scenario Analysis
Executive Summary
Background pumps, wind turbines and combined
Climate change will impact, not only on heat and power systems.
the environment, but on social equity and
• Ensuring new build compliance with the
the economy. The scientific consensus is
government’s timetable for the Code for
that for the UK to play its part in limiting
Sustainable Homes (improving to ‘zero
dangerous climate change, we must reduce
carbon’ by 2016) will achieve less than
our carbon emissions by 80 per cent of their
10 per cent of the required reduction.
1990 levels by 2050. The Prime Minister has
asked the independent Committee on Climate • A policy mix of the above measures
Change to strengthen the UK’s current 60 per would still leave the city region
cent target before it is incorporated into the slightly short of its 38 million tonne
Climate Change Bill. This committee will target for 2026. The shortfall could
advise on the first three 5-year carbon budgets be met by fitting wall insulation to
for 2008-2022 and the relative contributions 90,000 properties without cavity
from different sectors of the economy. walls, installing LZC technology to a
27 per cent of the country’s carbon emissions further 170,000 homes, or the energy
are the result of domestic energy use. Better efficient rebuild of 51,000 poorly
evidence is needed on the size of carbon performing properties demolished
reductions that can be achieved by making under regeneration schemes.
our homes more energy efficient.
Approach
Key findings of the study The Stockholm Environment Institute (SEI)
• Even with increases in population and was commissioned by the Environment
housing, Leeds City Region can make Agency to carry out a carbon footprint analysis
a significant contribution to carbon of the housing sector, using the Leeds City
emissions reduction by 2026 through Region (LCR) as an example. The aim was to
the widespread adoption of domestic determine our ability to meet the 80 per cent
energy saving measures. by 2050 challenge of energy efficiency in the
housing sector. The study relates specifically
• Retrofitting almost all existing homes to LCR but its findings will help any planning
is the most effective energy efficiency and development teams make the right
measure; introduction of cavity wall and decisions and gain the resources necessary
loft insulation, energy efficient glazing, to meet carbon budgets at regional and local
draught proofing, improved boilers and levels.
low energy light bulbs could deliver
over half the required reduction. With a growing population and an additional
263,000 housing units to be built within LCR
• More than 20 per cent of the reduction, by 2026, the housing sector would need to
by 2026, will need to come from reduce its expected total carbon dioxide
energy saving behaviour influenced by emissions by 38 million tonnes between
educational campaigns and incentives 2010 and 2026 to be on track for 80 per cent
to adopt technology such as smart savings in 2050.
metering.
The report outlines the most detailed analysis
• A further 12 per cent of the reduction to date of the required measures to deliver
can be achieved if a third of existing a growth-based regional housing strategy,
homes draw some heat or power from alongside reducing carbon emissions. If
their own or community based Low the city region’s new and existing housing
and Zero Carbon technologies (LZCs). is to attain the levels of energy efficiency
These include solar water heating, solar necessary to deliver these carbon savings, big
electricity, ground or air source heat changes will be required in the way we build,
ivStockholm Environment Institute
maintain and run our homes over the next • Planners will need to make judgements
20 years. There are pockets of good practice on how new build, retrofit and
already in the region and the study shows associated LZC schemes will perform
that by combining innovative measures and contribute to a low carbon future,
on construction standards, improvements extending beyond consideration
to existing housing, low and zero carbon of the location and appearance of
technologies and changing behaviour development.
of householders, LCR can achieve the
necessary savings to meet its carbon • The changes required represent a
budget. significant employment opportunity
and commercial rewards for early
Essential and optional measures to meet movers in the city region.
the 38 million tonne carbon emissions
reduction • From 2026 to 2050 there will be
fewer options available as retrofit
Other key messages will be complete in the existing stock
with all new homes being built as
• The study has produced relevant
zero carbon. Further reductions from
evidence to the Leeds City Region and
behavioural change and the expansion
other UK regions.
of decentralised LZC energy systems
• The study sets a total carbon budget serving communities and districts will
over the medium term, assessing be needed.
potential different emission reduction
• No matter how well we do reducing
measures to meet that budget. This
carbon emissions, some climate
approach to local carbon accounting
change is now unavoidable. There are
and performance monitoring is relevant
potential benefits in combining energy
to housing and other sectors.
efficiency plans for existing buildings
• It is essential that good practice and and adapting the same properties to
innovation being developed in local cope better with the inevitable impacts
authorities is shared regionally and of climate change.
nationally, including that for business
models and partnership funding
arrangements.
Further retrofit - external wall insulation 3.4%
OR additional LZCs 3.4%
Option Measure OR rebuild of demolished properties 3.4%
Building better new homes 9%
Low and zero carbon technologies 12.4%
Behavioural change 22%
Essential Measures
Major retrofit of cavity wall homes 53.2%
Figure 1: Contribution of measures to the 38 million tonne
reduction target
vCarbon Footprint of Housing in the Leeds City Region – A Best Practice Scenario Analysis
Table 1: Scale of implementation and effectiveness of essential and option measures
CO2 saving Scale of implementation over period
Essential measures % of 38mt required
(m. tonnes) 2010 to 2026
50,000 per year (90-95% take-up by
Major retrofit 20.2 53.2%
2026)
0.6% energy consumption reduction per
Behavioural change 8.3 22%
year
Low and zero carbon 30,000 per year (35% of all homes by
4.7 12.4%
technologies 2026)
All new homes (14,000 per year) to Code
Building better new homes 3.5 9%
for Sustainable Homes timetable
Total 36.7 96.6%
CO2 saving Scale of implementation over period
Option Measures % of 38mt required
(m. tonnes) 2010 to 2026
Further retrofit to non-cavity 5,000 per year (22% of all non-cavity wall
1.3 3.4%
wall homes homes by 2026)
Additional 10,000 per year (increasing
OR Further LZC technologies 1.3 3.4%
coverage to 47% of all homes by 2026)
OR Rebuild of demolished 1.3 3.4% 3,000 homes per year or 51,000 by 2026
properties
Total 38 100%
viStockholm Environment Institute
Introduction
T he political momentum to address the
adverse effects of climate change through
both mitigation and adaptation is mounting. At
A greenhouse gas emissions target is
established for the Yorkshire and the Humber
region1 which is broadly aligned with the
a national level the Sterne Review has focused 2006 UK Climate Change Action Plan target.
attention on the issue with the clear message The most recent iteration of the Yorkshire
that we need to act now, or literally pay the and Humber greenhouse gas emission target
price at a later stage stating that the overall as set out in the 2006 Regional Economic
costs and risks of climate change will be Strategy is focused on reducing consumption
equivalent to losing at least 5% of global GDP related emissions.
per year, now and forever. More importantly,
The emissions caused due to the direct
climate change potentially threatens the
energy requirements of homes have also been
livelihoods of millions of vulnerable people.
a significant contributor. Any climate change
There is clear acknowledgement that strategy has to consider how we can heat our
responsibility for mitigation lies with homes, provide hot water, and power our
the developed countries as they all have appliances in a way that significantly reduces
disproportionately higher carbon emissions carbon dioxide emissions.
on a per capita basis. The UK has a legally
binding commitment under the Kyoto
protocol to reduce greenhouse gas emissions
(GHG) by 12.5% below base-year level
(1990), over the first commitment period
2008-2012. The UK also has a domestic
target to reduce carbon dioxide emissions
by 20% below 1990 levels by 2010 and the
Energy White Paper sets a longer term goal
of reducing carbon dioxide emissions by 60%
by 2050 with real progress to be achieved by
2020. There is also further discussion that
suggests the required reduction is nearer
80% to avoid some of the more extreme
effects of climate change. There is also a case
for moving early, i.e. achieving a reduction
sooner rather than later. The longer we wait
for climate change policy to be implemented
the greater the accumulated emissions are in
the atmosphere.
1 ‘ Reduce greenhouse gas emissions (CO2
equivalent) by 20-25% over 1990 baseline, based
on modelling of energy/resources consumption
attributable to Y&H’, The Regional Economic Strat-
egy for Yorkshire and the Humber 2006-2015.
1Carbon Footprint of Housing in the Leeds City Region – A Best Practice Scenario Analysis
Scope of this report
T his report focuses on the direct and
indirect CO2e (carbon dioxide equivalent)2
emissions of the housing sector in the Leeds
Finally, the report constructs a set of scenarios
that quantify the potential reduction in CO2e
emissions if all of the 10 local authorities
City Region and documents the results of a adopted the best practice in the region under
workshop undertaken with local authority these five policy areas. In addition to this, a
representatives. In particular, the report more progressive set of policy packages have
concentrates on what local authorities can do been calculated that demonstrate the various
to contribute to a reduction in CO2e emission options available to be on course for an 80%
in the housing sector. This does not just cover reduction in 2026. Both these scenarios are
the houses under the control or ownership of compared with the “Continuing Trends”,
the local authority but all houses within the in essence “do nothing” scenario. All of the
area of the local authority. scenarios have been calculated using the
Resources and Energy Analysis Programme
The policy levers available for local
(REAP), developed by SEI3.
authorities within this sector are growing
and there is considerable diversity in the The pricing of policies is beyond the scope
package of policies to tackle the issue. This of this report. Many of the policy options put
suggests significant room for improvement, forward have never been implemented on
especially if each local authority was to adopt such a wide scale and providing an economic
the “best practice” examples from other local costing could be misleading. Continuing
authorities. This report documents current best with the “do nothing” scenario could have
practice within the Leeds City Region taking both economic and social cost implications;
examples from the 10 local authorities that particularly for the most vulnerable in society.
make up the city region. To do this, the policy This report does not consider the economic
options available have been divided into five costs of implementing policies, but recognises
key categories: the potential economic and social costs of not
taking any action.
• Building New Homes
• Retrofitting Old Homes
• Behavioural Change Programmes
• Low / Zero Carbon Technologies
• Selective Demolition and Rebuild
2 Includes all six major greenhouse gases regu-
lated by the Kyoto Protocol. Emissions of green-
house gases are converted into carbon dioxide
equivalent (CO2e) based on their 100 year global
warming potential. This allows a single figure for 3 For further information on the methodology
the total impact of all emissions sources to be of REAP please visit www.sei.se/reap and click on
produced in one standard unit. “Publications”.
2Stockholm Environment Institute
Policy Targets for GHG Reduction
A growing number of Greenhouse Gas It is not simply an 80% by 2050 target at all.
Emission (GHG) targets are appearing, either In reality, it is a 2050 target combined with an
suggested by the European Union or the UK assumed straight line trajectory of progressive
Government. The UK Government has already reduction from 1990 levels to that target. In
admitted that it will fail to achieve its target of other words, it is an accumulated emissions
a 20% reduction by 2010 in emissions. This is total for the period 1990-2050 that has to be
despite the warning seven years ago from the met (a stated annual reduction could achieve
Royal Commission on Pollution that the UK the same effect). If progress ensured that
would fail to reach this target. In reality, from a emissions are over the straight line, as has been
territorial emission perspective, there has been the case for UK carbon emissions between
a 5% reduction in GHG emissions between 1990 and 2007, then the extra emissions have
1990 and 2007 and no further reduction by to be compensated for later on.
2010 is predicted. This highlights a major
The reason why this is so important is
concern, that a target is easy to announce but
because carbon dioxide does not gradually
very difficult to achieve.
dilute or disperse once it reaches the earth’s
However, this has not stopped further targets atmosphere; it stays there and continues to
being announced. At the European level the have a “greenhouse” warming effect. That
EU Strategic Energy Review introduced a is why any targets to limit damaging climate
legally binding target of 20% reduction in change, such as those from the IPCC adopted
emissions by 2020, from a 1990 baseline. The by the UK government, must be viewed as
Energy White Paper for the UK4 suggests an total accumulated emissions over a given time
even more ambitious target of 26% by 2020. period. That is the basis of the calculations
This would equate to an annual reduction and modelling carried out for this study.
of 1.8% a year between 2008 and 2020 (so
Therefore, based on an annual percentage
far only a 0.3% per year reduction has been
reduction of 1.8% a year, this report adopts a
achieved between 1990 and 2007).
total carbon budget approach and tests a range
Aspirational targets for 2050 have also been of policies to ensure that the housing sector in
put in place. In 2003, the Energy White Paper Leeds City Region achieves this. The earlier
suggested a reduction of 60% by 2050. This climate change policies are implemented the
would equate to an annual reduction of 1.3% easier it will be to achieve this target.
per year. However, the Climate Change Bill5
highlights that the likely reduction needs to
be in the region of 80% of 1990 levels by
2050. Increasingly robust scientific evidence
suggests that this target needs to be achieved
even earlier to ensure that some of the worst
consequences of climate change will be
avoided. An 80% reduction by 2050 would
require the equivalent of an annual reduction
of 1.8% a year, which is aligned with the UK
Government’s 2020 target.
4 Energy White Paper 2003: Our Energy Future
- Creating a Low Carbon Economy
5 March 2007
3Carbon Footprint of Housing in the Leeds City Region – A Best Practice Scenario Analysis
Profile of Leeds City Region
C ity regions have recently been adopted
as a mainstream geographical unit by
central government and regional agencies.
The overall population of the Leeds City region
is forecasted to increase by approximately
13% between 2006 and 2030 (Leeds
There is consensus that they better reflect University Population Projections, 2006).
an area’s economic geography than the sub- To accommodate this growth nearly14,000
regional system. A map of the city regions in houses will be built each year in the Leeds
Yorkshire and the Humber is shown below. City Region until 2026 (The Panel Report
The Local Authorities in Yorkshire and the Recommendations and Draft Regional Spatial
Humber belong to either one of four city Strategy for Yorkshire and The Humber
regions or to a rural and coastal group. The housing provision for Local Authorities until
Leeds City Region is the largest of the four 2026). The highest proportion of these houses
and includes Barnsley, Bradford, Calderdale, will be built in Leeds and Bradford.
Craven, Harrogate, Kirklees, Leeds, Selby,
The carbon dioxide emissions emitted due
Wakefield and York. It contains 2.7 million
to the consumption of residents who live in
people, which is over half of the total
the Leeds City Region are nearly 32 million
population in Yorkshire and the Humber.
tonnes. This represents nearly 5% of the UK’s
The Leeds City Region contains 47% of the
carbon dioxide emissions. The average carbon
region’s total rural population. (Yorkshire and
footprint of a “Leeds City region” resident is
Humber Rural Evidence Base, 2007).
11.4 tonnes. This is 4% lower than the national
average of 11.8 tonnes per person.
Figure 3 provides a breakdown of the carbon
dioxide emissions of the different local
authority residents on a per person basis.
Housing represents 27% of the Leeds City
region’s carbon dioxide emissions. Other
important consumption activities that have
high carbon dioxide emissions include
transport (personal travel), responsible for
20%. Together these two activities represent
nearly 50% of all emissions. If solely looking
at household emissions, excluding government
and capital investment, this figure rises to 65%
(two thirds of carbon dioxide emissions).
Figure 4 provides a more detailed breakdown
of the housing footprint.
Within housing we have included more than
just the obvious. We have also included the
embedded emissions in the materials required
for maintenance of the house and also
expenditure on rent. However, it is the demand
for electricity and gas that dominates the
Figure 2: City regions of Yorkshire carbon footprint of housing (85 – 90%). The
and Humber variation in carbon dioxide emissions of the
different local authorities is 11%. Households
in Harrogate have the highest emissions with
residents of Kirklees having the lowest.
4Stockholm Environment Institute
14.00
Other Consumer items
Captial investment Food
Public services Transport
12.00 Private services Housing
10.00
CO2 (t/capita)
8.00
6.00
4.00
2.00
0
Craven
Wakefield
Bra dfo rd
Kir klee s
Ha rrog ate
Calde rdale
Yo rk
Lee ds
Barnsley
Selby
Figure 3: Carbon Footprint of Leeds City Region by Local Authority Area
3.50
3.00
Gas and other fuels
2.50
Electricity
Maintenance
CO2 (t/capita)
2.00 Rentals
1.50
1.00
0.50
0
Bradford
Wakefield
Crav en
Calderdale
Leeds
Kirklees
Selby
Barns ley
York
Harrogate
Figure 4: Housing Footprint of the Leeds City Region by Local Authority Area
If housing were to achieve a proportional reduction of 80% by 2050 then carbon
reduction in line with the targets discussed dioxide emissions would need to have been
earlier, by 2020 the carbon emissions would reduced to 2 tonnes per person. This creates
to be between 1.3 and 2.3 tonnes per person. a considerable challenge for all stakeholders,
If Leeds City Region wanted to be aligned especially considering the current trajectories
with the UK Government’s suggested for housing shown in the next chapter.
5Carbon Footprint of Housing in the Leeds City Region – A Best Practice Scenario Analysis
Results from Other Studies
Using Reap For an Regional Strategies and
Environmental Assessment Climate Change – Evaluating
of the Leeds City Region RSS the Contribution that Key
Housing Policy Regional Strategies Make
I n 2006 SEI completed a study of the carbon Towards Addressing Climate
dioxide emissions of new and existing houses Change
T
in the Leeds City Region for the Yorkshire he Regional Strategies and Climate
and Humber Environment Forum. The report Change report was commissioned by the
considered the effect of 15 different policy Yorkshire and Humber Assembly to provide
scenarios on the carbon dioxide emissions an in-depth analysis of how existing regional
associated with housing between 2003 and strategies contribute to the regional climate
2026. The study found that retrofitting was change agenda and how they can be combined
the most effective policy for reducing carbon to tackle climate change as one of the seven
emissions followed by an improvement in regional ‘landmark’ issues in the forthcoming
the energy efficiency requirements for new Integrated Regional Framework. The report
homes and an accompanying increase in highlighted that there is no definitive regional
demolition of inefficient housing. Further to greenhouse gas emissions reduction target
this, the report concluded that only retrofit or and that strategies have a variety of interim
a number of initiatives used in combination and longer term targets.
had the potential for longer term carbon
reductions and that single scenarios, although The study modelled the impact that each of
achieving a degree of energy efficiency on a the current regional strategies would have on
per household basis, did not show significant reducing both consumption and production
benefits in the longer term. based emissions by 2021, considering the
Baseline Scenarios (what would happen in
the absence of any strategy) and the Vision
Scenario (the desired impact of the strategy).
Overall the study found that the current
strategies would be able to stabilise the
production-related greenhouse gas emissions
by 2021, but not achieve any reduction.
However, the strategies were found to be a
long way from either stabilising or achieving
any reduction in consumption based emissions.
In fact consumption-related emissions were
projected to almost double between 2003 and
2021 in the Vision Scenario.
This report is important for highlighting the
scale of change that may be required within
the current regional policy landscape in order
to reduce greenhouse gas emissions.
6Stockholm Environment Institute
Continuing Trends Scenario
A summary of the assumptions used in all to 2006 the standard that was required
of the policies and scenarios modelled is by Building Regulations has been
provided in Appendix 5. taken into account on an annual basis.
Therefore, the assumption has been
taken that all 2002 houses meet 2002
What is a “Continuing
energy efficiency rating outlined in the
Trends Scenario? regulation for that year.
T he scenario attempts to show what might
be happening over the next 20 years by
exploring what has happened historically
• In the previous study the Code for
Sustainable Homes had not been
and assuming these trends will continue. The brought into operation. Within this
limitation of such an approach is that the scenario, the carbon footprint of each
scenario does not take into account unexpected of the six levels of the Code has been
events. For example, if oil prices doubled calculated. As with all calculations
tomorrow then the scenario immediately undertaken by SEI, the complete life
becomes redundant. However, the advantage cycle impacts have been taken into
of the approach is two fold. Firstly, it is account. Therefore, while code levels
possible to argue that many of the historical 5 and 6 are suggested to be “Carbon
trends will not change quickly as we live in Neutral”, SEI has undertaken an analysis
a relatively stable country with a reasonably to understand the impacts along the
constant economic state. It is difficult to see complete supply chain demonstrating
how social trends such as smaller family that there is a carbon output. In terms
units, higher divorce rates resulting in lower of the assumption for the “Continuing
occupancy rates will not continue. Secondly, Trends” scenario, there are no official
the scenario does raise the issue of whether targets for private sector housing to
current policy is having an effect, in this meet different levels of the code, only
case on carbon dioxide emissions, and gives recommendations. However, there is
something against which to compare carbon a trend towards ever more stringent
reduction scenarios. targets for new houses. It is important
that a “Continuing Trends” scenario
The following assumptions have been adopted takes this into account. Therefore the
for the scenario: following assumptions have been
• Housing Projections Data was made:
taken from the “Panel Report - The private sector will not
Recommendations and Draft Regional implement the Code at the
Spatial Strategy”. This report same speed required for
documents the housing provision social housing but will make
by local authorities until 2026. improvements. It is suggested
These are updated figures from the that the private sector will
previous analysis and show a higher achieve code level 3 by 2015,
rate of house building in the Leeds code level 4 by 2020 and code
City Region. Annually, nearly 14,000 level 5 by 2025. This is difficult
houses will be built each year in the to predict but does ensure that
Leeds City Region. Not surprisingly, a conservative estimate is
the highest proportion will be built in established.
Leeds followed by Bradford.
• There have been significant • In terms of the state of existing (per
improvements in the analysis of the 2002) houses, information was taken
energy performance of new houses from the Home Energy Efficiency
from 2002 to 2026. For the years 2002 Database, produced by the Energy
7Carbon Footprint of Housing in the Leeds City Region – A Best Practice Scenario Analysis
Saving Trust. There is regionally can calculate the changing household
specific information available. The occupancy of the region. Not
database provides information on a surprisingly it is reducing. We calculate
range of energy efficiency measures that the household occupancy is set to
and their historic update, for example decline steadily from 2.41 in 2002 to
the number of houses with double 2.36 by 2026.
glazing. Within this scenario we have
assumed that house improvements • National assumptions have been
will be undertaken independent of any adopted for the energy mix of electricity
specific retrofit strategy. production. As Leeds City Region
is part of the national grid it seemed
• Assumptions have to be made in terms appropriate to adopt the national
of underlying behavioural change average.
towards energy use. Increasingly,
individuals are becoming more aware
of the issue of climate change. Research Continuing trends results
does suggest that there is a significant
gap between attitude and behaviour.
Therefore while someone may identify
T he results of the “Continuing Trends”
scenario have been shown on both a per
capita basis and total population (in figure 5
climate change as an important issue, (below) and figure 6 on the next page).
they might not do anything about it.
The scenario shows that there is likely to be
According the Energy Saving Trust,
a modest per capita reduction (figure 5). It
even though the “Attitude – Behaviour”
is suggested that the reduction from 2007 to
gap is a problem, the message is getting
2026 is likely to be within the range of 3 to
through resulting in an annual reduction
10%.
of 0.15% in energy consumption
through better management of energy Figure 6 shows the same scenario for the total
in the home. This reduction rate has population of the Leeds City region.
been adopted.
Due to an increase in the population of the
• Information from the Office of Leeds City Region there will be an increase
National Statistics was used to gain in the total carbon dioxide emissions from
an understanding of the changing housing. This is likely to be in the region of
population of the Leeds City Region. 7% and 16% (2007 to 2026).
Together with housing projections we
3.5
Upper Limit
3
Lower Limit
2.5
CO2 (t/capita)
2
1.5
1
0.5 Average
0
2007 2009 2011 2013 2015 2017 2019 2021 2023 2025
Figure 5: Continuing Trends Scenario - per capita CO2e
emissions from housing in Leeds City Region
8Stockholm Environment Institute
12000
If you add all
Upper Limit the CO2e emis-
10000
sions below the
Lower Limit line for every
8000 year you get
CO2e (000s tonnes)
the “Total CO2e
Emissions”
6000
190 million tonnes
Total CO2e
4000 Emissions
between 2007
and 2026 =
2000 190 million
Average tonnes
0
2007 2009 2011 2013 2015 2017 2019 2021 2023 2025
Figure 6: Continuing Trends Scenario - total CO2e Emissions from Housing in
Leeds City Region
What would the total CO2e To be on track for an 80% reduction by 2050,
emissions be in 2026 to CO2e emissions must reduce by the equivalent
achieve an 80% reduction by of 1.8% per year. For the Leeds City region
2050? this means that total CO2e emissions over
the period should not exceed 152 million
A s previously highlighted, emissions by
2026 should be 40% lower than 2007 to
be on target for an 80% reduction by 2050 is
tonnes. This total CO2e emissions figure sets
the challenge for future policy and an interim
2026 target for the rest of the report. New
not the most important fact. What is important policies related purely to housing need to
is what happens in terms of the CO2e emissions remove 38 million tonnes of CO2e emissions
between 2007 and 2026. There is a need to by 2026. In reality, it doesn’t matter when
focus on the “Total CO2e emissions”. The this reduction is achieved, though, as long as
“Continuing Trends” scenario tells us that the the total CO2e emissions do not exceed 152
total CO2e emissions between 2007 and 2026 million tonnes between 2007 and 2026. The
will be 190 million tonnes. “Continuing Trends” scenario demonstrates
that the total budget between 2007 and 2026
will be completely used up by 2022.
9Carbon Footprint of Housing in the Leeds City Region – A Best Practice Scenario Analysis
Measures to Achieve the Target
Introduction the location and design of new
developments can contribute to the
I n order to achieve the reduction in CO2e
emissions of 38 million tonnes a combination
of the following measures will be required:
reduction of the Carbon Footprint of a
local area.
• Building better homes: Implementing • The Code for Sustainable Homes is a
Code for Sustainable Homes targets voluntary standard with six levels of
(zero carbon by 2016) across public energy performance designed to increase
and private sector the environmental sustainability of
homes. All government funded housing
• Major retrofit of existing stock will be built to at least level 3 of the
code.
• Behavioural change: awareness
campaigns to encourage energy saving • Building regulations provide mandatory
baseline national standards for energy
• Low and zero carbon (LZC)
use in buildings. The regulations
technologies in existing homes
progressively raise the energy efficiency
• Selective demolition and rebuild standards of new homes over time.
Local government needs to prepare itself over
Measure 1: Building better the next three years to ensure developers can
new homes (regional best build all new houses to progressively higher
practice) levels of the Code for Sustainable homes.
The Government has proposed targets for
E ven though there have been improvements
in the energy efficiency of new houses,
this has not lead to a corresponding reduction
improving the energy performance of building
regulations in line with the new Code for
Sustainable Homes as follows:
in energy use. This is partly due to increased
levels of comfort instead of energy reduction, • All homes built to Code level 3 by 2010
as well as an increase in energy for lighting – 25% more efficient than existing
and appliances. This clearly demonstrates building regulations
that there is going to have to be a significant
change in the efficiency of houses to counteract • All homes built to Code level 4 by 2013
the growing demand for energy for other – 44% more efficient than existing
purposes. In addition to this, by 2050, houses building regulations
built between 2007 and 2050 will account for • All homes built to Code level 6 by 2016
around 25% of the housing stock. However, – ‘zero carbon homes’
this does not mean that 25% of houses that
exist today will not exist in 2050. New houses Adopting suggested U-values that are required
will be in addition to this total as opposed to to achieve the various levels of the Code for
replacements. It is essential that any new house Sustainable Homes; we have modelled what
does not require retrofit within ten years to this could mean in terms of carbon dioxide
improve its energy efficiency. The technology emissions. These figures should be used as a
does exist now to build houses to very high guideline as there will, of course, be a variation
standards in terms of energy efficiency. in the carbon dioxide emissions dependent on
the occupants energy demand.
DCLG’s proposed policy framework for the
energy performance of new developments is The 2006 Regulations represented a
based around three main policy levers: significant shift in performance over the
average home (nearly 50%). After this the
• The planning system: DCLG’s draft
Code for Sustainable Homes gradually
planning policy statement Planning
tightens the regulation to achieve increasingly
and Climate Change sets out how
better efficiency rating. Level 1 to 4 shows
10Stockholm Environment Institute
3.50
Construction
3.00
Gas
2.50 Household maintenance
Electricity
CO2 (t/capita)
2.00
1.50
1.00
0.50
0
CFS H Lev el 1
CFS H Lev el 2
CF SH Level 3
CF SH Level 4
C FSH Level 5
C FSH Level 6
Baseline
Regulations
(2001)
2006
Figure 7: Carbon Dioxide Emissions of the Code for Sustainable Homes
this incremental improvement with level Building better new homes:
4 delivering 20% saving from the 2006 Workshop Feedback
Regulations. After this the improvements are
Harrogate Council has one of the most
even more substantial. However, at present,
progressive policies on “New Build”. The
few examples can be found of a development
council has adopted the government’s
that would reach Code levels 5 and 6. While
proposed timetable for all house building,
level 6 is described as “Carbon Neutral”,
public or private. They are also appointing
the construction of the home along with the
assessors to ensure compliance. Many local
provision of renewable energy does have
authorities have produced design guides that
some carbon output.
have been used with varying levels of success.
Is there a case for moving more quickly than this However, they have yet to establish a target
in your local area where there are demonstrable similar to Harrogate.
opportunities? If your local authority wants to
The stance taken by Harrogate is unusual
set local standards beyond current building
and it would be difficult to find many local
regulations it will need to demonstrate that
authorities nationally who have taken such a
it can still meet house building targets, but
progressive position on the issue of new build.
this should not be treated as an obstruction to
There was concern from some local authorities
engagement with developers. The supplement
that such a policy could slow down house
to the Planning Policy Statement 1 on Climate
building, hence not meeting UK Government
Change6 suggests that local authorities can set
targets. The UK Government has made it clear
local standards beyond current regulations,
that any standards should not be introduced at
provided that they have the local evidence base
the expense of achieving housing targets.
to justify it and a strategic approach to energy
in their local authority. It also encourages However, the introduction of a “blanket”
local authorities to provide local guidance on policy across the Leeds City region would
low carbon design. create a level playing field ensuring that this
would not be the case. Many local authorities
also mentioned that they were looking to
Leeds for inspiration. One of the barriers
6 Consultation Planning Policy Statement: Plan-
ning and Climate Change Supplement to Planning mentioned by the local authorities was not
Policy Statement 1 (Dec 2006) having a level playing field meaning that most
11Carbon Footprint of Housing in the Leeds City Region – A Best Practice Scenario Analysis
local authorities were unwilling to make the be adopted across Leeds City Region. This
first move. A blanket policy would clearly is a generous assumption, that all houses do
overcome this problem. comply with this standard, as historically this
has not been the case. Boardman suggests
Another issue / barrier is the lack of examples
that up to a third of new houses fail to
of developments built to the higher level
reach building standards. Therefore a clear
codes. At present there are no examples at the
enforcement strategy is required to ensure full
community level of level 5 and 6, only a few
compliance7.
individual houses. Therefore, a target has been
established with little knowledge of whether Figure 8 provides the results, along with the
it is achievable. This suggests the need for “Continuing Trends” scenario and the “80%
“showcase” examples as well as the targets reduction scenario”.
established by Harrogate. The showcase
Due to the limited amount of houses that
examples cannot be individual houses, but
can be affected by the policy, it does little
need to be demonstrated at the community
to change the overall picture. This does not
level, i.e. 100 houses plus. This is a key area
mean that the policy is not important. When
where local authorities could clearly take a
comparing the new homes scenario with the
lead.
continuing trends, the contribution that the
Finally, a further barrier was seen as a lack policy makes is clear.
of expertise in a number of areas, including
It would be a nonsensical situation to have
the construction industry and planners. There
to retrofit new houses in ten years time to
is a lot to learn and training and effective
improve the energy efficiency at greater
communication must form part of any policy.
expense. Houses built to building regulations
today will need to undergo retrofit in the next
Building better new homes:
ten years bearing in mind that the technology
assumptions and results
does exist to build to significantly higher
We have taken the targets established in standards.
Harrogate and assumed that this target would
CO2e (000 t) CO2e (000 t)
12000 40000
Contribution
35000
10000 of code for
30000 sustainable
homes
8000
25000
6000 20000 Further
reduction
15000
4000 Continuing trends required
Code for sustainable homes 10000
2000
80% Reduction Target 5000
0 0
07
10
13
16
19
22
25
20
20
20
20
20
20
20
Figure 8: New Homes Total Carbon Dioxide Emissions Scenario
7 Boardman, 2007 Home Truths: A low-carbon
strategy to reduce UK housing emissions by 80%
by 2050
12Stockholm Environment Institute
As has been mentioned there is also the Energy efficiency varies widely across the
issue of compliance. The worrying statistic housing stock, but energy performance has
that up to a third of houses does not comply the greatest correlation with property age,
with current Building Regulations is a major type and size for existing homes. Large, older,
concern. Boardman suggests that to overcome detached homes tend to have the poorest
this problem mandatory air-tightness tests energy standards. Energy performance is
must be carried out on new homes before they also driven by the amount of insulation and
are allowed to be sold. Such a policy would efficiency of heating systems as well as the
definitely ensure 100% compliance8. demands and awareness of the user (discussed
below).
Summary: Contribution from There is also the issue that almost four million
Building Better New Homes households in the UK struggle to afford an
Assuming Harrogate’s targets for all adequate energy supply and suffer from fuel
new homes (public and private built to poverty. Poor energy efficiency is one of
Code Level 3 by 2010, Code Level 4 the three main causes of fuel poverty and
by 2013 and Code Level 6 by 2016) 80% of people in fuel poverty live in homes
are adopted across the city region: of below average energy efficiency. While
• 150,000 houses built to Code extremely important for other reasons, the
Level 6 by 2026 current approach of purely improving the
• Total saving: 3.5 million tonne thermal efficiency for low-income families
reduction by 2026 will not deliver a reduction in energy demand
as the benefits will be absorbed by increased
• Percentage contribution to target:
comfort.
9% of the required 38 million
tonne reduction CURS surveys have shown that almost all
local authorities (93%) have entered into
partnership arrangements with other agencies
to tackle problems of energy efficiency in their
Measure 2: Retrofit of local area. A majority (84%) provide advice
existing homes (regional and guidance on energy efficiency but the
best practice) nature of service varies enormously. Energy
E ven by 2050, with the present UK efficiency programmes are presently driven
Government’s current ambitious housing by two main strains of funding:
building programme, 75% of current housing • The Energy Efficiency Commitment
stock will still exist. This housing stock is places an obligation on energy suppliers
currently performing extremely badly in terms to promote energy efficiency measures
of energy efficiency. Boardman points out that for householders and is in the middle
British Gas suggest that as a result of poor of its second phase. The third phase
insulation, £1 is wasted for every £3 spent (2008-11), is intended to be 50-100%
on heating. Any reduction in carbon dioxide more ambitious than at present and will
emissions must address the challenging issue continue in some form until 2020. At
of how to retrofit these homes to bring them up the moment 50% of savings associated
to modern day standards as much as possible. with the EEC must be from low income
Lapillonne and Pollier highlight that UK households.
houses use twice as much energy for space
heating as houses in Nordic countries9. • Warm Front is the Government’s main
grant-funded scheme for tackling fuel
poverty. Grants are offered for up to
£2,700 for families to install measures
8 Boardman, 2007 Home Truths: A low-carbon
strategy to reduce UK housing emissions by 80% such as insulation and heating systems.
by 2050 Just under half of local authorities
9 Boardman, 2007 Home Truths: A low-carbon
provide grants themselves and with
strategy to reduce UK housing emissions by 80% other partners. A similar number
by 2050 provide some form of top-up grants
13Carbon Footprint of Housing in the Leeds City Region – A Best Practice Scenario Analysis
for certain groups; this is most likely to • Free cavity wall and loft insulation for
happen in metropolitan authorities. all households
Many of these schemes are aimed at low • Free low energy light bulbs to all
income families and this does little to
improve the energy efficiency of the majority • Free improvements to heating systems
of the population. In terms of delivering the (only for householders fulfilling set
required reduction it is the larger structural criteria, for example they are in fuel
retrofit options that would bring the greatest poverty, on benefits, or in hard to treat
reduction. These are often the most expensive homes, and subject to funding)
and inconvenient for the occupier. • Competitive prices for replacement
boilers and central heating for able to
Retrofit Best Practice: Workshop pay customers
Feedback
The Kirklees Warm Zone project commenced
There were numerous examples of grant
in February 2007 and will run for three years
schemes for a range of retrofit options available
with £21m of funding. This scheme only
for low income families. For example, in
started this year and it is impossible to know
Harrogate, households who receive particular
quite how effective the scheme will be. For
benefits can have free cavity wall insulation. In
the purposes of this scenario, a number of
Calderdale over the last year 1,731 households
assumptions have been made and are listed
have benefited from loans up to £2,700 to help
below.
pay for energy savings. However there is a
lack of awareness and it is estimated that there
Retrofit best practice: assumptions
are 30,000 homes that could still benefit from
this initiative. and results
The fact that every house in Kirklees will be
It is reasonably well known that Kirklees approached under the Warm Zone project is
has done more than other local authorities to extremely encouraging. This suggests that
address the issue. Kirklees established that almost every house will benefit from the free
a considerable number of its residents are in energy efficiency measures in the scheme:
fuel poverty. The key project, Warm Zone, cavity wall and loft insulation. While loft
will offer help to every household in Kirklees insulation is possible for nearly every house,
to improve energy efficiency including: only 68% could have cavity wall insulation.
CO2e (000 t) CO2e (000 t)
12000 40000
Contribution
35000
10000 of retrofit
30000 to reduction
8000
25000
6000 20000
15000
4000 Continuing trends Further
Retrofit 10000 reduction
2000 required
80% Reduction Target 5000
0 0
07
10
13
16
19
22
25
20
20
20
20
20
20
20
Figure 9: Retrofit Scenario – Total Carbon Dioxide
14Stockholm Environment Institute
Information from the Energy Saving Trust The analysis shows that there needs to be even
tells us that currently 43% of houses in the more pressure for householders to change
Leeds City Region have inadequate loft and accept quite significant changes to their
insulation and only 27% currently have houses to achieve considerably higher levels
cavity wall insulation. We assume that 10% of energy efficiency. Boardman suggests
of householders will not allow their home using the Energy Performance Certificates
to be improved for loft insulation as it could as a driving force and the enforcement of the
involve some disruption, but that this drops to Housing, Health and Safety Rating Scheme
5% for cavity wall insulation. System10. Specific carbon targets that the local
authority would be responsible for achieving
In terms of energy saving light bulbs, the fact
for the whole housing market would generate
that they are free should mean a significant
a number of diverse solutions.
take up. There will always be some individuals
who will not want to use the light bulbs. We
have assumed that this could be in the region
of 10%. Summary: Contribution from
Retrofitting Existing Homes
Replacement boilers are not cheap for the We make the assumption that nearly
average householder even with a discount, all of the houses that can have the ba-
with most boiler replacements being in the sic retrofit measures are provided with
region of £2500. There will be a natural rate the necessary installations by 2026.
of replacement and it is safe to assume that 90% of houses across the city region
the existence of the system will speed up the are provided with loft insulation; 95%
replacement. At present, 9% of households (of those with cavity walls) are given
cavity wall insulation; 90% use energy
have a condensing boiler. It is suggested
saving light bulbs and that of those
that the scheme will contribute to a 90% with gas heating systems 90% have a
replacement of the stock by 2026 with a yearly condensing boiler by 2026:
incremental increase.
• Over 800,000 houses improved
Finally, there is the issue of double glazing. with retrofit measures by 2026
There is nothing specific in the plan to ensure • Total saving: 20 million tonne
faster than average replacement of double reduction by 2026
glazing so a natural rate of change has been
• Percentage contribution to target:
assumed.
53% of the required 38 million
The results of the retrofitting existing houses tonne reduction
have been shown below:
With the growing population of the region,
the retrofit option would counteract these
additional emissions but not reduce them. In
essence, the policy in isolation would stabilise
CO2e emissions in the housing sector for
Leeds City Region.
The project being undertaken by Kirklees is
extremely commendable. A more significant
reduction is achieved because of early
implementation. Retrofit is the most important
policy option to achieve the greatest reduction
in emissions, because it can, effectively,
change the emissions of every household in
the region.
10 Boardman, 2007 Home Truths: A low-carbon
strategy to reduce UK housing emissions by 80%
by 2050
15Carbon Footprint of Housing in the Leeds City Region – A Best Practice Scenario Analysis
Measure 3: Further Retrofit
Reductions (External Wall Summary: Further Retrofit
Insulation) Assuming that 90,000 houses are fit-
F urther reductions could be achieved by ted with external/internal wall insula-
tion:
even more extensive retrofit. However;
this does require more extreme action, such • 22% of solid wall properties would
as the internal or external wall insulation of be fitted with external wall insula-
single brick properties. While this may be tion
required in the long term, it can be expensive • Total saving from either measure:
and quite disruptive. 1.3 million tonne reduction by
2026
According to the Energy Saving Trust an
annual average reduction of 7,375 kWh could • Percentage contribution to target:
3.4% of the required 38 million
be achieved per house through external wall
tonne reduction
insulation. Assuming that only the worst
energy performing houses are targeted we
assume a saving of 11,000 kWh could be
achieved.
External wall insulation could deliver a
significant saving per house. The results have
been shown below. Due to the limited number
of houses that would be targeted, it is necessary
to implement this policy as soon as possible,
therefore increasing the benefits through
early implementation. It is our estimate that
there are approximately 400,000 solid wall
properties in the Leeds City Region.
CO2e (000 t) CO2e (000 t)
12000 40000
Contribution
35000 of external wall
10000 insulation
30000 to reduction
8000
25000
6000 20000
Further
15000 reduction
4000 Continuing trends required
External wall insulation 10000
2000
80% Reduction Target 5000
0 0
07
10
13
16
19
22
25
20
20
20
20
20
20
20
Figure 10: External Wall Insulation Results
16Stockholm Environment Institute
Measure 4: Behavioural
6
Change
P roviding efficient new homes, or even 5
retrofitting old ones, can only work to Appliances
4
reduce emissions if the occupier knows how
CO2 (t/capita)
Lighting
to use the technology. A triple glazed window 3
Cooking
left open is no better than a single glazed Hot water
window. There are numerous choices that 2 Heating
the occupier has that will have a considerable
1
impact on CO2e emissions. To demonstrate
this we have documented a few of the key 0
behavioural options and shown the carbon Current With reductions
dioxide variation of two identical houses in
figure 11. The difference in the carbon dioxide Thermostat at 20 degrees Thermostat at 18 degrees
emissions between these two examples is
22%. 4 baths a week 50% of baths replaced by showers
In terms of behavioural change campaigns, Most appliances left on stand by 75% of appliances turned off
there has been a considerable amount of work CO2e Emissions = 5.5 tonnes CO2e Emissions = 4.3 tonnes
done to try to educate the general public with
an increasing volume of national advertising
from organisations such as the Energy Saving Figure 11: Potential for Behavioural Change
Trust (EST). However, marketing research
suggests that what this can achieve can be
limited and that personalised and individual mind. However, this is beyond the scope of
targeted approaches are most likely to bring regional and local policy.
the best results. Individualised marketing has
With few examples from the region itself,
proven to be a valuable tool. In reality, it means
what could realistically be achieved by
individual households are given direct advice
scaling up current activity to attempt to
in the home, on how to achieve a reduction
change the behaviour of households?
in their carbon emissions by changing their
behaviour on a regular basis. Boardman uses examples from Darby
(2006)12 suggesting that a potential 10%
Boardman estimates that at least one third of
reduction could be achieved through the
the carbon savings in the residential sector
introduction of smart metering and providing
will have to come from day to day behavioural
households with better information on their
changes (Hillman and Fawcett, 2005) as
energy consumption month by month. The
opposed to new technology or fuel switching.
UK Government suggests that in real terms
To achieve this Boardman proposes a
this could lead to a reduction of 1% in energy
package of utility focused measures such as
consumption by 2010 and a further 1% by
real time energy use monitors, smart meters
2020. This clearly demonstrates the difficulty
and micro-generation, improved billing
in achieving considerable reduction through
information and details of the carbon content
behavioural change; a 1% reduction over a 10
of fuels purchased.11
year period is simply not enough. Referring
The other solution would be to give clear back to Darby who suggests that considerably
price signals to the consumer through more could be achieved, it is essential that a
taxation or personal carbon allowance
programmes, ensuring that the consumption
of excessive energy is at the forefront of their 12 Darby, S (2006), The effectiveness of feed-
back on energy consumption: A review for DEFRA
on the literature on metering, billing and direct
displays, Environmental Change Institute, Uni-
11 Boardman, 2007 Home Truths: A low-carbon versity of Oxford, Oxford, http://www.eci.ox.ac.
strategy to reduce UK housing emissions by 80% uk/research/energy/downloads/ smart-metering-
by 2050 report.pdf
17You can also read