N A L YSIS Student and Market-Rate Apartment Analysis City of Greenville , NC - Greenville, NC
←
→
Page content transcription
If your browser does not render page correctly, please read the page content below
H O U S I N G         A N A L Y S I S
                 Student and Market-Rate Apartment Analysis

                                     City of G r e e n v i l l e , N C

JANUARY 2018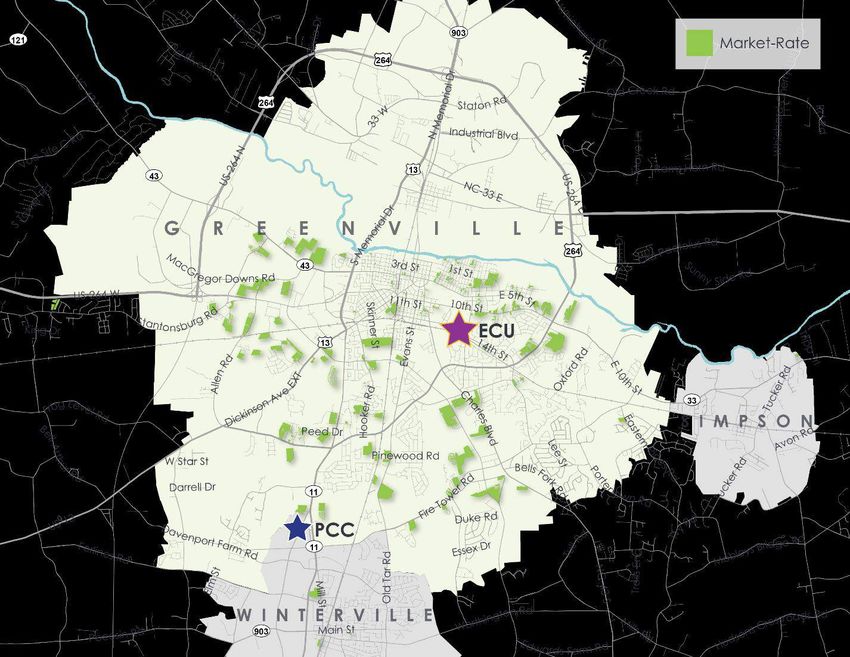
Page intentionally left blank.
Greenville, NC ǀ Student and Market-Rate Apartment Analysis

    Contents

    Executive Summary ……………………………...…………………………………………………..ES

    1. Introduction ............................................................................................................................. 1

    2. Economic Drivers and Community Anchors ....................................................................... 2

              2.1 Uptown Greenville ........................................................................................................................ 2

              2.2 Vidant Medical Center ................................................................................................................ 2

              2.3 North Greenville Industrial District ............................................................................................... 3

    3. Profile of Local Higher Education Facilities ......................................................................... 4

              3.1 East Carolina University ................................................................................................................ 4

              3.2 Pitt Community College ............................................................................................................... 7

    4. Comparable University Case Studies................................................................................... 9

              4.1 University of North Carolina at Wilmington ............................................................................. 10

              4.2 Virginia Polytechnic Institute & State University (Virginia Tech) .......................................... 12

              4.3 University of Virginia .................................................................................................................... 13

              4.4 University of Georgia .................................................................................................................. 15

              4.5 Middle Tennessee State University ........................................................................................... 17

    5. Employment .......................................................................................................................... 20

              5.1 Major Pitt County Employers ..................................................................................................... 20

              5.2 Annualized Employment by Industry ....................................................................................... 20

              5.3 Wages ............................................................................................................................................ 23

    6. Demographics ...................................................................................................................... 25

              6.1 Population..................................................................................................................................... 25

              6.2 Households ................................................................................................................................... 26

              6.3 Median Household Income ...................................................................................................... 27

              6.4 Tapestry Segmentation .............................................................................................................. 28

              6.5 Housing Tenure............................................................................................................................. 30

i
7. Student-Targeted Apartment Performance ..................................................................... 32

           7.1 National Trends in Student Housing ......................................................................................... 32

           7.2 Greenville Student Apartment Peformance .......................................................................... 33

           7.3 Comparable Student Community Performance .................................................................. 38

8. Market-Rate Apartment Performance .............................................................................. 44

           8.1 Market-Rate Performance Trends ............................................................................................ 45

           8.2 Comparable Market-Rate Community Performance ......................................................... 48

9. Student and Market-Rate Development Activity ............................................................ 53

           9.1 Student Development Activity ................................................................................................. 53

           9.2 Market-Rate Development Activity ......................................................................................... 54

10. Forecasted Apartment Demand ....................................................................................... 56

           10.1 Population and Household Forecasts ................................................................................... 56

           10.2 Student Growth Forecasts ....................................................................................................... 58

           10.3 Apartment Demand ................................................................................................................. 61

           10.4 Apartment Supply and Demand Reconciliation ................................................................ 65

Appendix ..................................................................................................................................... 69

           A-1 Public Engagement Summary ................................................................................................. 69

           A-2 Profiles of Large-Scale Student Housing Builders/Developers ........................................... 76

                                                                                                                                                        ii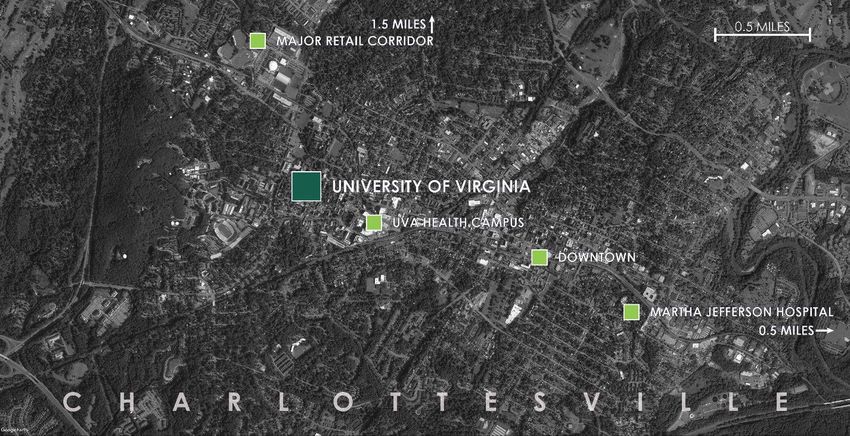
Greenville, NC ǀ Student and Market-Rate Apartment Analysis

      Tables

      Table 1: Enrollment Trends by Type, ECU, 2010-2017 .................................................................................. 6

      Table 2: Major Employers, Pitt County, 2017 .............................................................................................. 20

      Table 3: Annualized Employment by Industry, Pitt County, 2011-2016 ................................................. 21

      Table 4: Comparison of Population Trends, 2010-2017 ............................................................................ 25

      Table 5: Population by Age Cohort, City of Greenville, 2010-2017 ....................................................... 25

      Table 6: Comparison of Household Trends, 2010-2017............................................................................. 26

      Table 7: National Avg. Rents by Distance from Campus, 2017 .............................................................. 33

      Table 8: Comparable Off-Campus Student Communities, City of Greenville, 2017 ......................... 38

      Table 9: Comparable Off-Campus Student Vacancy Rates, City of Greenville, 2017 ..................... 40

      Table 10: Comparable Off-Campus Student Unit Features, City of Greenville, 2017 ........................ 42

      Table 11: Comparable Off-Campus Student Comunity Amenities, City of Greenville, 2017 ........... 43

      Table 12: Comparable Market-Rate Communities, City of Greenville, 2017 ...................................... 48

      Table 13: Comparable Community Vacancy Rates, City of Greenville, 2017 ................................... 50

      Table 14: Comparable Community Interior Features, City of Greenville, 2017 ................................... 51

      Table 15: Comparable Community Amenities, City of Greenville, 2017 .............................................. 52

      Table 16: Under Construction Student Communities, City of Greenville, 2017 ................................... 54

      Table 17: Proposed Student Communities, City of Greenville, 2017 ..................................................... 54

      Table 18: Under Construction Market-Rate Communities, Greenville, 2017........................................ 55

      Table 19: Proposed Market-Rate Communities, Greenville, 2017.......................................................... 55

      Table 20: Off-Campus Housing Forecast, ECU, 2017-2027 ...................................................................... 62

      Table 21: Off-Campus Housing Forecast, Pitt Community College, 2017-2027 .................................. 62

      Table 22: Student Apartment Housing Demand Forecast, ECU, 2017-2027 ........................................ 63

      Table 23: Student Apartment Housing Demand Forecast, ECU, 2017-2027 ........................................ 63

      Table 24: Net Market-Rate Renter Household Growth, City of Greenville, 2017-2027 ....................... 65

iii
Graphs

Graph 1: Student Population Totals, ECU, 1990-2017 ................................................................................. 5

Graph 2: Student Population Totals by Attendance Method, ECU, 2008-2017 .................................... 5

Graph 3: Annual Net New Job Growth, Pitt County, 2005-2016 ............................................................ 21

Graph 4: Share of Jobs by Type, City of Greenville, 2014 ....................................................................... 22

Graph 5: Greenville as a Share of Pitt County Jobs, 2014 ....................................................................... 23

Graph 6: Average Annual Wage, Pitt County, 2006-2016 ...................................................................... 23

Graph 7: Share of Jobs by Average Annual Wage, City of Greenville, 2014 ..................................... 24

Graph 8: Comparison of Shares of Households by Size, 2010 ................................................................ 26

Graph 9: Comparison of Shares of Households by Income, 2017 ......................................................... 27

Graph 10: Comparison of Median Household Income, 2017-2022 ....................................................... 27

Graph 11: Share of Households by Tapestry Segment, City of Greenville, 2017 ................................ 28

Graph 12: Comparison of Housing Unit Tenure, City of Greenville, 2010-2017 ................................... 30

Graph 13: Comparison of Renter-Occupied Housing Unit Tenure, 2000-2017 .................................... 31

Graph 14: Household Tenure, City of Greenville, 2010 ............................................................................ 31

Graph 15: Share of Student Bedrooms by Decade Completed, Greenville, 2017 ............................ 35

Graph 16: Bedrooms by Distance from ECU Campus, Greenville, 2017 .............................................. 35

Graph 17: Vacancy Rate by Decade Completed, Greenville, 2017 ................................................... 36

Graph 18: Vacancy by Distance from ECU Campus, Greenville, 2017 ............................................... 37

Graph 19: Rent/Bedroom by Decade Completed, Greenville, 2017 ................................................... 37

Graph 20: Rent/Bedroom by Distance from ECU Campus, Greenville, 2017 ..................................... 38

Graph 21: Share Comparable Student Bedrooms by Type, Greenville, 2017 ..................................... 39

Graph 22: Monthly Rents/Bedroom by Community, City of Greenville, 2017 ..................................... 40

Graph 23: Monthly Rents/Bedroom by Community, City of Greenville, 2017 ..................................... 41

Graph 24: Inventory by Decade Built, Greenville, 2017 .......................................................................... 45

Graph 25: Vacancy Rate Trends, Greenville, 2011-2017(3Q) ................................................................. 46

                                                                                                                                         iv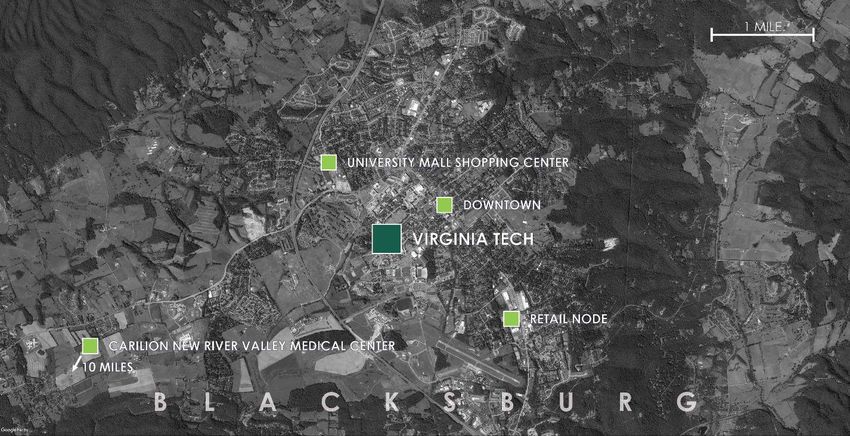
Greenville, NC ǀ Student and Market-Rate Apartment Analysis

    Graph 26: Comparison of Vacancy Rate by Decade Completed, 2017 ........................................... 46

    Graph 27: Average Monthly Rent Trends, 2011-2017 ............................................................................... 47

    Graph 28: Comparison of Monthly Rent by Decade Completed, 2017 .............................................. 47

    Graph 29: Share of Units by Bedroom Type, 2017 ..................................................................................... 48

    Graph 30: Average Unit Size v. Rent/Sq.Ft., City of Greenville, 2017 .................................................... 50

    Graph 31: Population Forecasts, Pitt County, 2017-2027 ......................................................................... 56

    Graph 32: Household Forecasts, Pitt County, 2017-2027 ......................................................................... 57

    Graph 33: Population Forecasts, City of Greenville, 2017-2027 ............................................................. 57

    Graph 34: Household Forecasts, City of Greenville, 2017-2027 .............................................................. 58

    Graph 35: Student Population Totals, ECU, 1990-2017 ............................................................................. 58

    Graph 36: Total Student Enrollment Forecast, ECU, 2017-2027 .............................................................. 59

    Graph 37: Forecasted Student Enrollment by Type, ECU, 2017-2027 .................................................... 60

    Graph 38: FTE Student Forecast, Pitt Community College, 2017-2027 .................................................. 61

    Graph 39: Student Apartment Housing Demand Forecast, City of Greenville, 2017-2027............... 64

    Graph 40: Student Apartment Supply and Demand Reconciliation, 2017-2022 ............................... 66

    Graph 41: Projected Vacancy Rate, Submarket, 2017-2027 ................................................................. 67

v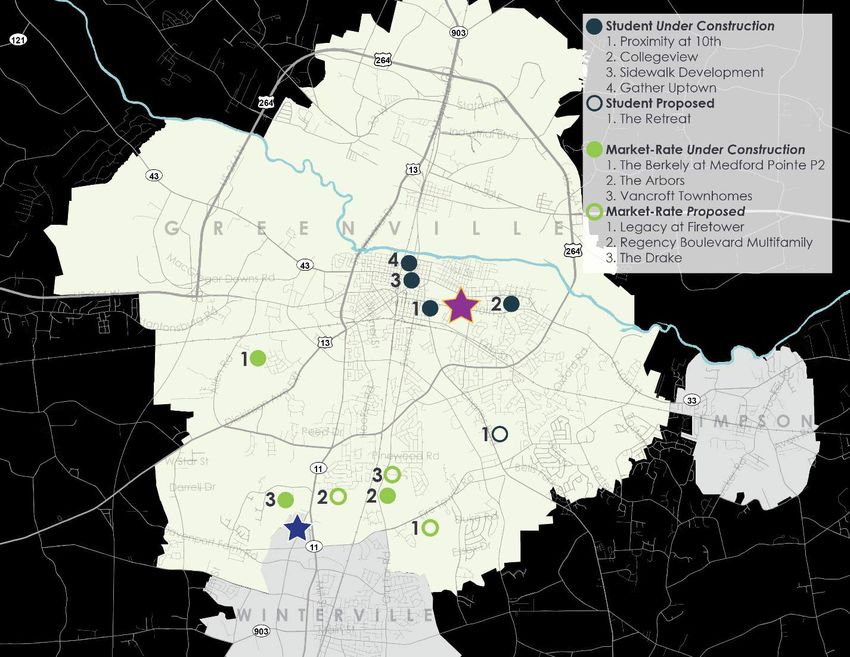
Maps

Map 1: Student and Market-Rate Apartment Properties, City of Greenville, 2017 .............................. 1

Map 2: Comparable University Case Study Locations, 2017 .................................................................... 9

Map 3: UNC-W Location Map, 2017 ............................................................................................................ 10

Map 4: Virginia Tech Location Map, 2017 .................................................................................................. 12

Map 5: University of Virginia Location Map, 2017 ..................................................................................... 14

Map 6: University of Georgia Location Map, 2017 ................................................................................... 16

Map 7: Middle Tennessee State University Location Map, 2017 ............................................................ 18

Map 8: Student-Targeted Apartment Properties, City of Greenville, 2017 .......................................... 34

Map 9: Comparable Student-Targeted Communities, City of Greenville, 2017 ................................ 39

Map 10: Market-Rate Apartment Properties, City of Greenville, 2017 ................................................. 44

Map 11: Comparable Market-Rate Communities, City of Greenville, 2017 ........................................ 49

Map 12: Apartment Development Activity, City of Greenville, 2017 ................................................... 53

                                                                                                                                                  vi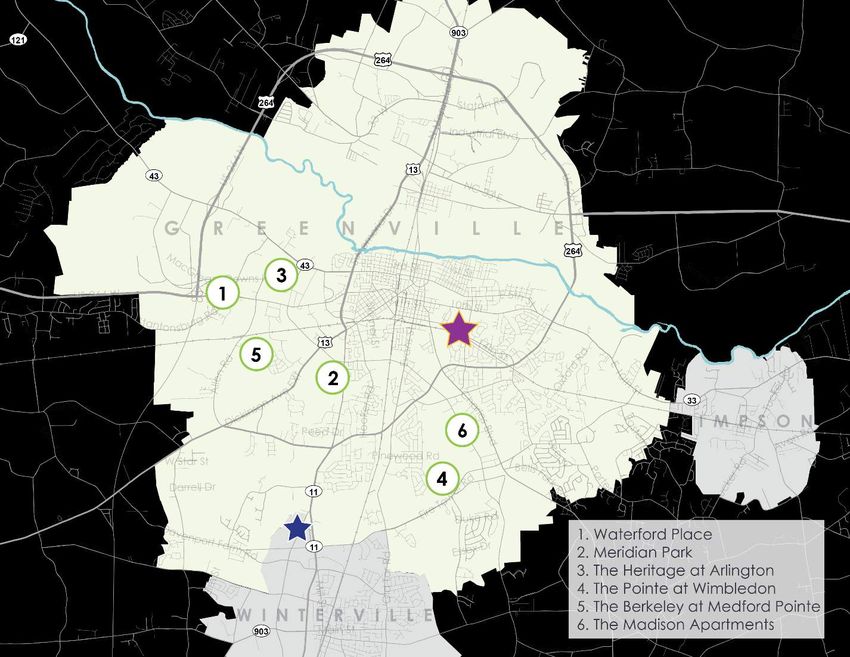
Greenville, NC ǀ Student and Market-Rate Apartment Analysis

       EXECUTIVE SUMMARY
       Kimley-Horn and Associates was retained by the City of Greenville to prepare a student and
       market-rate apartment housing analysis. The purpose of this analysis is to determine whether the
       supply of private, off-campus student and market-rate apartment communities, both existing
       properties and those approved for construction, could saturate the housing market in Greenville.
       It should be noted that this analysis does not forecast future demand for affordable housing in
       Greenville. It also does not provide policy or land use recommendations based on the results.

       Two higher-education facilities are located in or near Greenville, each with students that drive
       demand for student and market-rate apartments.

          •   East Carolina University (ECU) has a total enrollment of 29,131 students as of the fall of
              2017. This includes 23,265 undergraduates and 5,331 graduate students. As of Fall 2017,
              approximately 76.3% of the students were classified as ‘on-campus,’ meaning that they
              regularly attend classes at campus facilities. The remaining 6,909 students are considered
              distance learning, leveraging primarily online resources.
          •   Pitt Community College (PCC) is a two-year technical training college located just south
              of the Greenville city limits. The college reported having 11,678 students enrolled in
              curriculum programs, with 10,344 enrolled in continuing education classes. About 32% of
              those students enrolled in curriculum programs attend school full-time.

       STUDENT APARTMENT PERFORMANCE

       Student apartment performance trends for Greenville focus on 16 active properties specifically
       targeting students. The communities all lease by the bedroom, and primarily offer furnished units.
       There are over 11,000 bedrooms targeting student renters in the City of Greenville, with nearly
       one-third located in communities more than three miles from campus, relying heavily on bus
       transit system.

       The estimated vacancy rate of off-campus, student-targeted housing is currently 11.6%,
       equating to 1,276 available bedrooms. Vacancy rates in off-campus student communities in
       Greenville increase the farther away from campus the communities are located. The three
       communities located less than 0.5 miles from ECU’s campus have an aggregate 2.1% vacancy
       rate, while those more than three miles have the highest rate at 18.7%. Demonstrating an inverse
       trend, communities located less than 0.5 miles from campus have the highest average rents per
       bedroom at $645, while those more than three miles away have the lowest at $484.

       MARKET-RATE APARTMENT PERFORMANCE

       For the purpose of this analysis, market-rate apartments include communities that lease on a per
       unit basis, and do not target specific age or income groups. Affordable or income-restricted
       units are excluded from this analysis. Students can be residents of these communities, often
       requiring a parent to sign as a co-leaser. Greenville hosts nearly 5,200 market-rate apartments in
       communities containing 25 or more units.

ES-1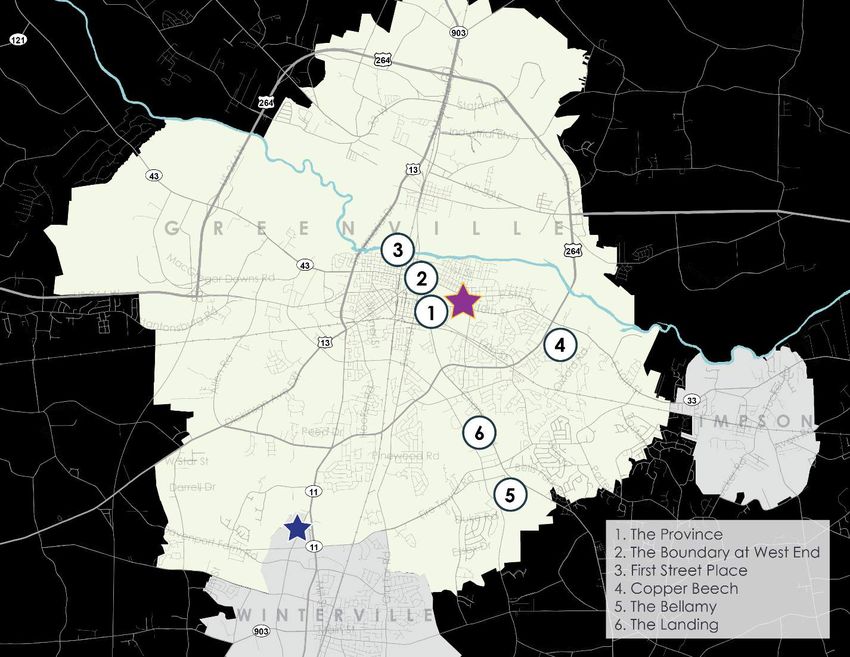
The market-rate apartment vacancy rate in Greenville peaked in 2012 at 5.9%. With only two
communities completed since 2012, vacancy has been on a continuous decline every year
since, reaching a period-low of 2.6% in the third-quarter of 2017. The average monthly rent of
$761 per unit for the City of Greenville in the third-quarter of 2017 represented a gradual
increase from 2011. Average monthly rents in Greenville have increased every year, equating to
16.4% growth over a nearly seven-year period. The last two years have experienced a more
notable annual increase, largely due to the declining available supply in the current inventory.

NEW APARTMENT SUPPLY

There are four student-targeted communities currently being constructed and scheduled to be
completed between 2018 and 2019, totaling 1,930 new bedrooms. Another 656 bedrooms are
proposed in one community, with no start date currently identified. Market-rate apartments are
expected to increase by nearly 800 units including projects that are currently under construction
and proposed for future development.

FORECASTED APARTMENT DEMAND

Student apartment demand is based on enrollment forecasts for ECU and Pitt Community
College, while market-rate demand considers overall household growth in the community.

   •   Student Demand: Based on feedback from the local higher-education facilities, and
       considering recent trends, total enrollment could grow to 33,099 students at ECU and
       4,437 full-time curriculum enrollees at Pitt by 2027. Ultimately forecasts net out students
       that participate in distance learning, live on-campus, and seek housing options that are
       not student targeted or professionally-managed. Based on assumed capture rates
       detailed in the full report, there is a ten-year demand total for nearly 1,600 bedrooms of
       off-campus student apartments in Greenville.
   •   Market-Rate Demand: Demand for market-rate apartments has been forecasted by
       analyzing household growth in Greenville between 2017 and 2022. The City of Greenville
       could reach 47,772 households by 2027, an increase of 8,825, or 22.7%. The 2010 U.S.
       Census reported a 62.8% renter share in the city. This analysis relies on a 20% market-rate
       renter capture, notably lower than the 62.8% overall measure (intended to net out
       households that would gravitate to other product types, including student-, income-, and
       age-targeted communities). Applying the estimated 20% share to forecasted household
       growth indicates that approximately 1,765 net new market-rate rental units could be
       supported in the City of Greenville through 2027.

SUPPLY AND DEMAND RECONCILIATION

There are over 2,500 student-targeted bedrooms in the development pipeline in Greenville. This
new supply is greater than the forecasted demand of approximately 1,600 off-campus beds.
Based on the forecasted student growth and the approved student apartment pipeline, the
Greenville market is expected to experience saturation, especially in the next five years as most
of the expected new supply comes online. Vacancy rates at communities in the market will be
impacted, continuing to remain above the industry-standard for a healthy market.

                                                                                                     ES-2
Greenville, NC ǀ Student and Market-Rate Apartment Analysis
There are 789 market-rate apartment units currently in the development pipeline in Greenville.
The pipeline is split between 281 units currently under construction and targeting 2018 deliveries,
and 508 units proposed. Unlike the existing student communities, market-rate product in
Greenville has an extremely low aggregate vacancy rate of approximately 2.6%. Demonstrating
an opposite projection from the student-targeted demand, market-rate product is expected to
experience a deficit of nearly 1,000 units through 2027.
CONCLUSION
The following considerations are offered as it relates to the reconciliation of future supply and
demand in student and market-rate apartments:
• For student housing, proximity to campus has been clearly highlighted in trend data,
both nationally and In Greenville
o Occupancy at student-targeted apartment communities located further from
ECU’s campus have been impacted more noticeably than newer ones closer to
Uptown and campus
o Communities further from campus have been adjusting pricing to stay
competitive
• Offering a variety of price points for student tenants is critical; student finances vary
significantly
• Although some non-students do live at the existing off-campus communities, the design
of student-targeted communities limit the target market; it can be challenging to
repurpose larger three- and four-bedroom units for families/households
• New market-rate apartments have gravitated to job centers, primarily Vidant, as well as
along corridors that offer easy access to retail goods and services; to-date Greenville has
not attracted a significant amount of market-rate housing with pedestrian access to
Uptown, a trend that diverges from national momentum
ES-3Page intentionally left blank.
Greenville, NC ǀ Student and Market-Rate Apartment Analysis

    1. INTRODUCTION
    Kimley-Horn and Associates was retained by the City of Greenville to prepare a student and
    market-rate apartment housing analysis. The purpose of this analysis is to determine whether the
    supply of private, off-campus student and market-rate apartment communities, both existing
    properties and those approved for construction, could saturate the housing market in Greenville.
    It should be noted that this analysis does not forecast future demand for affordable housing in
    Greenville. It also does not provide policy or land use recommendations based on the results.

    This analysis was identified as an important action item in Greenville’s Horizons 2026
    Comprehensive Plan, which outlines goals related to strengthening existing neighborhoods and
    improving relations with student residents, addressing disinvestment occurring at off-campus
    student housing complexes, and continuing to provide a balanced supply of housing that meets
    the needs of a variety of household types and income levels. The report includes analyses of
    employment, demographics, apartment market performance metrics, comparable case
    studies, and national trends in student housing.

    Located in Pitt County, the City of Greenville is approximately 85 miles east of Raleigh. As the
    county-seat, Greenville represents the largest concentration of residents and commercial
    services in the county (Map 1). It is also home to East Carolina University. According to the U.S.
    Census Bureau, the city has a total area of 34.6 miles, served primarily by US-264 and US-13

      Map 1: Student and Market-Rate Apartment Properties, City of Greenville, 2017

1
2. ECONOMIC DRIVERS AND COMMUNITY ANCHORS
This section describes major economic drivers and community anchors that could impact the
demand for student and market-rate apartments in Greenville. It should be noted that the
area’s two higher education facilities, East Carolina University and Pitt Community College, are
profiled separately in the next section.
2.1 UPTOWN GREENVILLE
Uptown Greenville encompasses a roughly 5 x 5 block area south of the Tar River, adjacent to
the northwest portion of ECU’s main campus. Businesses are a mix of small scale urban varieties,
including banks, professional and medical offices, boutique shops, and restaurants. Uptown
Greenville hosts a significant concentration of the County’s government jobs, with office space
for both Pitt County and the City of Greenville located in the urban core. Nightlife and
entertainment businesses at the core of Uptown serve college students at nearby ECU.
Uptown Greenville has experienced a resurgence in recent years, partially catalyzed by public
investment to update streetscape elements and construct a large parking deck. Along with this
revitalization, there has been an increase in residential development capitalizing on proximity to
a walkable, urban core and the East Carolina University campus. First Street Place Apartments,
The Boundary at West End, and The Province are all located within walking distance to Uptown,
and all have been built since 2010. These properties cater towards the student population,
providing individual bedroom leasing, furnishings, and comprehensive utility packages.
Uptown Greenville, 2017
Uptown Greenville has experienced a surge in residential development in recent years, with four
communities currently under construction in or near the urban core of the community. Totaling
1,930 bedrooms, the four communities target students, offering walkability to East Carolina
University.
2.2 VIDANT MEDICAL CENTER
Located on the west side of the City of Greenville, Vidant Medical Center is the largest non-
military employer in eastern North Carolina, and the 20th largest employer in the state, according
2Greenville, NC ǀ Student and Market-Rate Apartment Analysis
to the NC Labor Market Information Division. The facility is a Level 1 Trauma Center, one of only
six in the State of North Carolina and the only one east of Raleigh. The medical center acts as
the teaching hospital for the Brody School of Medicine, and is directly adjacent to the ECU
Health Sciences Campus, as noted above. Founded in 1923, the hospital is licensed for 861 beds.
Of the 861 beds, 734 are general beds, 75 are rehab beds, and 52 are psychiatric beds. The
hospital has 35 operating rooms: 26 rooms are Shared Inpatient/Ambulatory Surgery; four rooms
are C-Section; three rooms are Other Inpatient; two rooms are Endoscopy. Employment at the
campus is estimated at approximately 7,000 doctors, nurses, and other staff.
In May 2014, Vidant Health announced plans for a new 6-story, 96-bed cancer facility set to
open in 2018. The facility, which in all will encompass over 400,000 square feet, broke ground in
March 2015. Some of the major features of the facility include 96 inpatient rooms with nurse,
patient and family zones; an imaging center; infusion and radiation treatment clinics; and
pharmacy and laboratory facilities. The facility will also include courtyards, gardens, and other
natural areas, as well as research and conference space.
Vidant Medical Center Campus, 2016
2.3 NORTH GREENVILLE INDUSTRIAL DISTRICT
While healthcare and education have grown to be Greenville’s dominant industries, the City’s
longstanding tradition of manufacturing has persisted. What was once home to North Carolina’s
largest tobacco market and the manufacturing of guns, carriages, cottons gins, and silk, now
features operations focused on chemicals, pharmaceuticals, transportation equipment, ag and
food products, and machinery.
There is a cluster of industrial and manufacturing facilities straddling the Greenville city limits
north of the Tar River. Firms with facilities in the area include Grady-White Boats, Hyster-Yale
Group, Patheon, and Mayne-Pharma. CSX operates a rail line that runs north-south through this
industrial district and intersects a rail line leased by Carolina Coastal Railway from Norfolk-
Southern in Greenville that runs 142-miles from Raleigh to Plymouth. Also located in this area is
the Pitt-Greenville Airport, the Eastern Carolina Vocational Center, and the Pitt County
Development Commission’s Technology Enterprise Center, which offers office, laboratory and
light manufacturing space to technology-based companies on a short-term lease basis.
33. PROFILE OF LOCAL HIGHER EDUCATION FACILITIES
3.1 EAST CAROLINA UNIVERSITY
East Carolina University (ECU) is a public university that represents one of the largest economic
drivers in the region, along with Vidant Medical Center. The main portion of the campus is
bounded on the north and south by 5th Street and 14th Street, respectively, and on the east and
west by Charles Boulevard/Cotanche Street and College Hill Drive.
As described in the previous section, Greenville’s downtown area, referred to as “Uptown,” is
directly adjacent to the western side of the campus. Uptown Greenville sits south of the Tar River,
which runs west to east through the northern portion of the City. Greenville Boulevard, which
acts as a major retail corridor for the area, is south of the university campus, and runs generally
southwest to northeast. The areas directly adjacent to the north and east of the campus are
primarily composed of single-family neighborhoods.
Vidant Medical Center is approximately 2.5 miles west of the university campus, and is also the
home of the East Carolina Health Sciences Campus. The Health Sciences Campus, along with
the Brody School of Medicine, is separated from the main portion of the university, and is
located on the western side of the city, directly adjacent to Vidant Medical Center. There is
some off-campus student housing located near this area to accommodate students who
primarily attend classes there. Combined, all campus sections of the university area totals almost
1,600 acres. Currently, expansions are being made to the main campus to build a new student
union building with a parking deck adjacent to the library, along 10 th street.
Residential Dorm Construction, East Carolina University, 2015
The university has a total enrollment of 29,131 students as of the fall of 2017. This includes 23,265
undergraduates and 5,331 graduate students. The Brody School of Medicine has 322 medical
students and 213 dental students. In terms of total student growth, East Carolina University has
4Greenville, NC ǀ Student and Market-Rate Apartment Analysis
been fairly level since 2008. In the ten years prior to the recession, from 1998 to 2008, the
university grew roughly 34%, from 18,263 students to 27,677 students (Graph 1). Since then, the
university has only seen a 4.5% percent growth in total student population. However, it’s worth
noting that a slight uptick in student totals in the past few years shows an 8% growth since 2013.
Graph 1: Student Population Totals, ECU, 1990-2017
35,000
30,000
Student Enrollment
25,000
20,000
15,000
10,000
5,000
0
As of Fall 2017, approximately 76.3% of the students were classified as ‘on-campus,’ meaning
that they regularly attend classes at campus facilities. The remaining 6,909 students are
considered distance learning, leveraging primarily online resources. Since 2008, on-campus
student enrollment has increased by 728 students, while distance education has grown by 771.
This distinction is important when considering demand for off-campus student housing in
Greenville, as distance learning students would not generate housing needs locally.
Graph 2: Student Population Totals by Attendance Method, ECU, 2008-2017
25,000
22,222
21,494
20,000
Total Enrollment
15,000
10,000
6,909
6,183
5,000
On-Campus
Distance
0
2008 2009 2010 2011 2012 2013 2014 2015 2016 2017
5Enrollment distribution has been fairly similar since 2010, with undergraduates having the largest
total change from 21,663 students in 2010 to 23,265 in 2017. This is an increase of about 1,600
students or roughly 7%. The level of graduate students shrunk by over 1,000 students from 2010 to
2015, but since then the total has rebounded to be about 9% lower than 2010 levels. Graduate
student enrollment growth was targeted in the 2015 Report on Enrollment Management, as
targeted to cap at approximately 5,300 students. The dental and medical programs have
stayed relatively constant since 2010.
Table 1: Enrollment Trends by Type, ECU, 2010-2017
Student Enrollment
Year Undergraduate Graduate Dental Medical
2010 21,663 5,812 - 308
2011 21,589 5,437 52 308
2012 21,298 5,226 104 319
2013 21,508 4,902 154 323
2014 22,252 4,740 206 313
2015 23,039 4,731 206 313
2016 22,969 5,468 208 317
2017 23,265 5,331 213 322
Source: East Carolina Univ ersity
Approximately 20% of students live on-campus or in
college-owned housing, while the rest live off campus.
ECU – BY THE NUMBERS
Freshman at ECU are required to live on campus in one
of the provided dorm facilities. Total Students .......................29,131
On-campus facilities are clustered in two main locations, Undergraduate ....................22,969
the first being the “West End” of campus and the
second being on “College Hill” which is to the south of Growth (since 2013) .................. 8%
the main portion of campus. West End and College Hill
Living off Campus.................... 80%
both feature a variety of dorm options, with most being
a hall or suite style layout. Both clusters of dorms are Male/Female ...................43%/57%
easily walkable to other parts of campus.
In State Enrollment .................. 87%
There are also options for housing in the central part of
campus, that feature smaller buildings with hall and suite Faculty ..................................... 2,053
style layouts. These facilities are generally occupied by
Staff .......................................... 5,832
upperclassmen, honors college, and graduate students.
College Hill Suites, located on the College Hill section of
campus, is a high-rise dorm that is reserved only for
upperclassmen. Layouts are suite-style, with two rooms in each suite adjoined by a central
living/kitchen space, and each room, which is shared by two students, has its own bathroom.
The majority of students move to off-campus locations after their first year at school.
Off-campus student living is primarily concentrated in two different options, single-family housing
and small-scale apartment community rentals located in “The Grid,” a residential area just north
of campus, and in student-targeted apartment communities. The Grid is primarily comprised of
6Greenville, NC ǀ Student and Market-Rate Apartment Analysis
single-family detached housing, and reports from local residents say that over 80% of the area is
occupied by renters. Houses within The Grid are walkable to campus and downtown, making
them ideal places for students to live. They are extremely competitive to gain access to, and
most are “passed down” from a previous renter to a friend or acquaintance.
The majority of off-campus students live in large, student-targeted apartment communities that
are spread throughout the City of Greenville. These properties exist in three main clusters – east
of the university down the 10th Street corridor, south of the university down the Charles Boulevard
corridor, and those within an immediate radius of the university and Uptown. In total, there are
currently 16 active properties that are specifically targeting student renters in Greenville. These
are:
• The Davis • The Boundary
• Copper Beech • The Province
• 33 East • The Bower
• Campus Pointe • University Suites
• Campus Towers • University Park
• Sunchase • The Landing
• Paramount 3800 (Captain’s Quarters) • The Bellamy
• First Street Place • The District at Tar River
Rents for the communities vary based on location and quality, with most rents ranging between
$400 and $700 per bedroom. Higher rents are quoted at The Boundary and The Province, due to
their location close to downtown and the university, and it’s expected that the four student-
targeted properties currently under construction will follow a similar trend. A recent shift in
students wanting to live in better quality apartments that are potentially closer to campus has
led to lower occupancy at some of the outlying communities. Paramount 3800, formerly
Captain’s Quarters, has been hit hardest by this shift, given its isolated location on the north side
of the Tar River and the lower construction quality of the units.
3.2 PITT COMMUNITY COLLEGE
Pitt Community College (PCC) is a two-year technical
training college located just south of the Greenville city PCC – BY THE NUMBERS (2016)
limits. The campus, which is the school’s only location, sits
at the prominent intersection of two major corridors, Fire Curriculum Total .................. 11,678
Tower Road and Memorial Drive. The college is
Cont. Education Total ........ 10,344
technically located just within the limits of Winterville, NC,
a suburb of about 9,000 residents that shares Greenville’s Male/Female .................. 40%/60%
southern border.
Faculty ........................................236
PCC is at the end of the prominent retail corridor of
Memorial Drive. Because of this, uses in the immediate Staff..............................................223
vicinity, to the north, south, and east, of the campus are
mostly commercial. To the west of the campus, the land is
7largely occupied by rural/agricultural areas and some single-family housing. Some multi-family
apartments can be found in the surrounding area as well.
The campus area occupies a space of roughly 125 acres, although it is not entirely built out.
About ¼ of the area on the western edge of the campus remains open to future development.
A new 75,000 square foot science and technology training facility, called the Walter and Marie
Williams Building, was dedicated in August 2017 and available for use during the fall 2017
semester after construction began in 2015. The building will house the Industrial Systems
Technology program and allow PCC to move the biotechnology program back to campus.
Pitt Community College, 2017
The college reported having 11,678 students enrolled in curriculum programs, with 10,344
enrolled in continuing education classes. About 32% of those students enrolled in curriculum
programs attend school full-time. According to the 2016 PCC Community Report, students
enrolled in curriculum classes averaged about 26.7 years of age, while those students enrolled in
Continuing Education classes averaged 39.1 years of age, and each group makes up about
roughly half of the student population. PCC offers a wide variety of online and in the classroom
options to support a diverse student group, 63% of which receive some kind of financial aid.
Pitt Community College does not have any on-campus housing, so all students live off campus in
a wide variety of housing choices that best fit their needs. Because of the diversity of student
types, it’s likely that most of the student population at PCC is scattered throughout the Greenville
and Winterville areas at these many housing options.
There are anecdotal reports that PCC students now occupy a more significant portion of the
population at outlying student-target properties south of the university, such as The Landing or
The Bellamy. This makes some sense given the proximity of these locations to PCC, relative to
that of other student-targeted properties. But for students of PCC that do not seek the college
lifestyle, it is most likely that they occupy more affordable, traditionally styled single-family or
multi-family units somewhere in the region, presumably within a relative driving distance to the
college campus.
8Greenville, NC ǀ Student and Market-Rate Apartment Analysis
4. COMPARABLE UNIVERSITY CASE STUDIES
This section profiles five other universities and cities in the Southeast United States that are
comparable to ECU and Greenville. Each profile will focus on the student population and
campus trends, options and trends for on and off campus housing, and will look at the facility’s
location within the community and region, related to the surrounding land uses. These profiles
are important to understanding similarities to the student housing situation for ECU and in the
larger Greenville community. The university case studies were selected based on a variety of
factors, including (but not limited to):
• Geographical location
• Proximity to major metropolitan areas
• Student population and demographics
• City/metro population
• Housing trends and options
The five university case studies identified by this study are:
• University of North Carolina at Wilmington (Wilmington, NC)
• Virginia Polytechnic Institute & State University (Blacksburg, VA)
• University of Virginia (Charlottesville, VA)
• University of Georgia (Athens, GA)
• Middle Tennessee State University (Murfreesboro, TN)
Map 2: Comparable University Case Study Locations, 2017
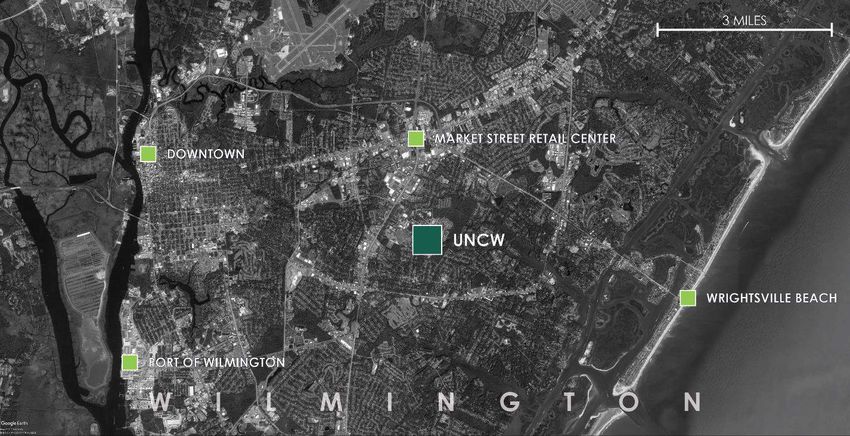
94.1 UNIVERSITY OF NORTH CAROLINA AT WILMINGTON
The University of North Carolina at Wilmington (UNCW) is located in Wilmington, NC, near the
Atlantic Ocean. The City of Wilmington is in New Hanover County, which has roughly 223,483
people and is approximately 80 miles from Pitt County, along the North Carolina coast. The
population estimates include students residing both on campus in dorms (group quarters
facilities), as well as off campus in other housing options. In relation to large metro areas,
Wilmington is roughly 115 miles south of Raleigh, NC, and about 150 miles north of Charleston,
SC. Wilmington and New Hanover County have a strong tourism economy, due to the plethora
of beach destinations along the coastline, as well as successful industrial sectors, anchored by
the Port of Wilmington along the Cape Fear River.
UNCW is centrally located in Wilmington, and is roughly equidistant between the downtown
urban core to the east, and the popular Wrightsville Beach to the west. The Port of Wilmington is
to the southwest. A prominent retail node and corridor sits just north of the campus, centered
around the major intersection of Market Street and S College Road. To the immediate south,
east, and west of the campus, the majority of land uses are made up of single- and multi-family
residences.
Map 3: UNC-W Location Map, 2017
The university reports as having a total enrollment of roughly 16,487 total students and offers 52
undergraduate, 36 master’s degree, and four doctoral programs. More than 13% of all students
are from southeastern North Carolina. UNCW has grown from 13,937 students in 2013 to 16,487 in
the Fall of 2017. This is roughly a 16% growth since 2013. The ratio of undergraduate to graduate
students has remained relatively stable over time.
10Greenville, NC ǀ Student and Market-Rate Apartment Analysis
An estimated 26% of the student body lives on campus.
New full-time freshmen are required to live on campus UNCW – BY THE NUMBERS
during their first year. On-campus dorm facilities are
typically located on the eastern side of the campus Total Students....................... 16,487
close to the dining hall and recreation center amenities.
These facilities offer common campus dorm amenities Undergraduate ................... 14,502
and quality, and are typically hall or suite style in their
Growth (since 2013) ............... 16%
layouts.
Living off Campus ................... 74%
The campus features three apartment-style facilities,
called Seahawk Landing, Seahawk Village, and Male/Female .................. 36%/64%
Seahawk Crossing, that are only available to those
students who are sophomore year or above. The In State Enrollment .................. 83%
complexes are on-campus, university run facilities that
Faculty ........................................ 965
offer all the amenities and layouts of apartment living,
but in an on campus setting. These apartments are Staff .......................................... 1,333
furnished, come with individual leases, and include
utilities in the rent.
Off-campus housing options are mainly found in a variety of student-targeted and market-rate
apartment communities. There are two main clusters of student apartment communities near
the campus, the first of which is located to the north of campus, along the Racine Drive corridor.
These apartments tend to be a bit older and feature a variety of 1-4 bedroom layouts. These
apartments are attractive to students because they are relatively affordable (rents are generally
$350 - $500 per person) and because of the proximity to campus. Students living in this area can
easily walk from their apartment to the campus. Apartments in this area are mostly unfurnished,
and most do not offer individual leases, meaning that students will put just one name on an
apartment lease, and split the total cost amongst themselves. However, oftentimes, utilities are
included as part of the rents.
The second cluster of student apartment communities is northwest of campus, north of Randall
Parkway and in closer proximity to the major retail corridors and nodes along Market Street and
South College Road. This area features some of the newer communities for students with more
modern amenities seen in other off-campus student housing. This includes: pools, study centers,
game rooms, and individual leases. These communities tend to be a bit more expensive on
average ($400 - $600 per person). The adjacent single-family neighborhoods to the south, east,
and west do report as having some student renters, but these houses are mainly populated by
graduate students and aren’t highly coveted.
In order to balance parking demands between those who live, attend class, and work on
campus, any student that resides within one mile of the university campus is not granted a
parking permit. The majority of students who live off campus tend to walk, if they are within a
mile or so of campus, or drive and then park somewhere on campus. There are also some park
and ride shuttles for lots on the periphery of campus.
114.2 VIRGINIA POLYTECHNIC INSTITUTE & STATE UNIVERSITY (VIRGINIA TECH)
Virginia Polytechnic Institute & State University, more colloquially referred to as “Virginia Tech
(VT)”, is located in the City of Blacksburg, along the Appalachian Mountains, in southwestern
Virginia. Blacksburg is the largest city in Montgomery County, VA, and the county has a total
population of 98,602 people. As noted with UNCW, population estimates include students
residing both on campus in dorms (group quarters facilities), as well as off campus in other
housing options. In relation to larger metro regions, Blacksburg is quite isolated for a region of its
size. It is about 165 miles west of Richmond, VA, and about 100 miles southeast of Charleston,
WV.
The City of Blacksburg is largely focused around the university, which is the largest employer in
the County. The Carilion New River Valley Medical Center, in the southern portion of the County,
also acts a strong economic anchor for the area.
Virginia Tech’s campus is centrally located within the City of Blacksburg and is well integrated
into the fabric of the existing city. The urban core, featuring classic main street forms and uses, is
directly adjacent to the main portion of campus. A prominent retail node, the University Mall
Shopping Center, sits just north of the campus. There are some smaller retail areas to the south of
campus, with single-family residential neighborhoods and rural farmland making up the
remainder of adjacent land uses.
Map 4: Virginia Tech Location Map, 2017
Virginia Tech reports having 34,440 students, which makes its student body about 22% larger
than that of ECU’s. The university offers roughly 110 bachelor’s degree programs and 170
graduate programs. The university has increased it’s student body population from 31,906 in 2013
to 34,440 in fall of 2017. This represents a growth about 7.5% since 2013.
12Greenville, NC ǀ Student and Market-Rate Apartment Analysis
An estimated 27% of the student body lives on campus,
and the university reports having 47 on-campus Virginia Tech – BY THE NUMBERS
residence halls. The majority of the larger residence halls
are located on the south/southwest portion of the Total Students....................... 34,440
campus, close to large commuter lots on the periphery
and the more rural edge of the campus. The majority of Undergraduate ................... 27,173
residence halls feature either a suite-style or traditional
Growth (since 2013) .............. 7.5%
hall style builing layout, with most rooms occupying two
students apiece. The university does offer a few Living off Campus ................... 73%
residence halls specifically for upperclassmen or
graduate students. These facilities are typically geared Male/Female .................. 57%/43%
towards single rooms (occupying one individual) and
In State Enrollment .................. 71%
cater to those students looking for apartment style living
in an on-campus setting. Faculty ..................................... 4,288
Off-campus student housing in Blacksburg is generally Staff .......................................... 3,394
concentrated in various multi-family apartment
communities and buildings. The largest cluster of
student-specific apartment communities is located
north of campus, along the Patrick Henry Drive corridor. These apartment communities typically
have four beds/four bathrooms, are furnished, and most provide individual leases for students.
Rents at these communities tend to average roughly $400 per person. The majority of these
communities are 10+ years old; however, there have been a few newer communities built in the
past five years, including “The Retreat at Blacksburg,” which is a cottage-style student
apartment community located on the fringe of the urban area.
There are reports of students renting single-family homes, as well as apartments in smaller, single
buildings in some of the surrounding residential neighborhoods. These properties and houses are
typically occupied by upperclassmen or graduate students, and tend to be passed down from
student to student, meaning that they aren’t usually listed in any official capacity.
There is a campus bus system that circulates down the Patrick Henry Drive corridor, which is
concentrated with student apartment communities. However, unlike ECU, the buses don’t
actually enter the apartment complexes. The buses ride down the corridor and stop at
predetermined locations where students living in various communities can walk to in order to
access the bus. Students who don’t live along the corridor will typically drive, or walk if they live
close enough to campus.
4.3 UNIVERSITY OF VIRGINIA
The University of Virginia (UVA) is located in the City of Charlottesville, Virginia, which is in
Albemarle County. Charlottesville is in the northwestern portion of the state, along the base of
the Appalachian Mountains. The City is roughly 100 miles to the southwest of Washington D.C.,
and about 70 miles northwest of Richmond. Albemarle County has a population of 106,878
people, including students. Charlottesville has a vibrant and active urban core, centered
around a pedestrian-only main street.
13The economy in Charlottesville is largely centered around the university and its associated uses,
like the UVA Health Campus. Tourism also has a significant impact on the local economy. People
travel to Charlottesville for the history of the City and region, to visit the historic downtown, and
to enjoy the region’s numerous wineries, vineyards, and agricultural landmarks.
The university campus is on the western side of the city, roughly a half mile west of the downtown
area. The campus itself is well integrated into the surrounding neighborhoods. A major retail
corridor along US 29 sits 1.5 miles north of the university, which is one of the heavier traveled
corridors in the area due to the high density of retail and commercial use. Residential uses
occupy the areas directly to the north and south of campus, which holds much of the off-
campus student living options for UVA students. The western edge of the campus gives way to a
mix of agricultural, rural, and natural areas.
Map 5: University of Virginia Location Map, 2017
The University of Virginia reported having 23,898 students in 2016, which makes it about 12%
smaller than ECU in terms of student population. About 69% of students come from within the
state of Virginia. The university has shown minimal growth in recent years, with growth from 2015
being negligible. The ratio of undergraduate to graduate students has remained relatively the
same.
Roughly 30% of students at the University of Virginia live on-campus (or “on-grounds” as it is
referred to at UVA), which is similar to the majority of the other case studies. The largest cluster of
dorms on campus are on the western side of the campus, near the football stadium. Dorms on
campus are a mix of traditional hall and suite style layouts. Most of the housing on campus is
occupied by underclassmen, specifically freshman, which is typical of most other college
campuses. However, there are options for upperclassmen and graduate students that feature
more desired amenities such as single rooms, more study areas, better quality facilities, etc.
Some of these options mimic some of the apartment-style living seen off-campus.
14Greenville, NC ǀ Student and Market-Rate Apartment Analysis
About 70% of the student population is living off-
campus, within close proximity (about a mile radius from UVA – BY THE NUMBERS
the campus). Housing for off-campus students is a wide
mix of options that cater to many different age groups Total Students....................... 23,898
and types of students. Various off-campus apartments
Undergraduate ................... 16,331
can be found scattered throughout the neighborhoods
surrounding the campus, these apartments include Growth (since 2015) .............. 0.1%
smaller garden-style buildings, and larger, student-
targeted facilities. Typically, the smaller garden-style Living off Campus ................... 70%
buildings tend to be older than the larger communities,
and are more likely to contain graduate students, or Male/Female .................. 43%/57%
even some faculty or non-students.
In State Enrollment .................. 69%
House rentals are also quite common in these areas as
Faculty ..................................... 2,830
well, with the 14th Street corridor, to the north of
campus, being a prime location for some of these Staff ........................................ 10,532
houses. The neighborhoods to the north and south
commonly contain the student rental houses and
smaller garden-style apartments.
In recent years, additional large, student-targeted apartment communities have been being
built. These can mostly be found within a 0.5 – 1.0-mile radius of the campus, with many of them
being located on and around the Jefferson Park Avenue corridor to the south of campus. The
more recently built of these communities tend to feature more of the typical student amenities
that national student housing trends have shown. These include: individual leases, pools, 4 bed/4
bath layouts, access to transit for students, etc. There are 3-5 of these more prominent, larger
apartment communities, but the integration of the campus and the density of the
neighborhood development campus prevent them from overbuilding in the area.
Currently, there are no major clusters of off-campus student housing that are a significant
distance from the campus. This could be due to the unique historic character of the surrounding
neighborhoods that make it desirable for students and non-students alike. There is a transit
system that the campus uses to help get students to campus, but because of how close-by most
students are, it is not heavily used, like that of the East Carolina Transit System. The buses
circulate along main corridors in the neighborhoods surrounding the campus, but do not
actually enter into any apartment complexes specifically. Most students who do not ride the bus
tend to walk or bike into campus.
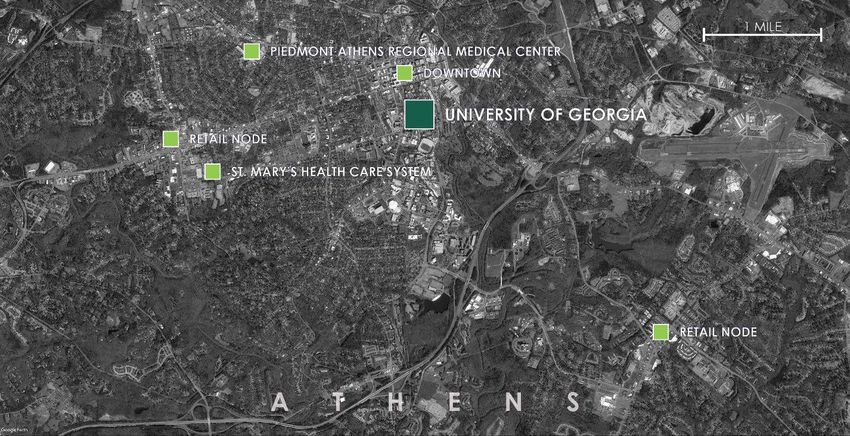
4.4 UNIVERSITY OF GEORGIA
The University of Georgia (UGA) is located in the City of Athens, which is in Clarke County,
Georgia. Clarke County has a total population of roughly 124,707 people, including students.
Athens is in the northwest portion of the state and is about 60 miles east of Atlanta and 130 miles
west of Columbia, SC. Like Charlottesville, Athens is known for having a vibrant and eclectic
downtown urban core, as well as some smaller, arts district neighborhoods throughout the city.
The economy is largely driven by the university and its associated uses; however, there are two
large medical facilities within the city that employ a few thousand people in the area.
15You can also read